41
PNNL-19695 Prepared for the U.S. Department of Energy under Contract DE-AC05-76RL01830 Large-Scale Pumping Test Recommendations for the 200-ZP-1 Operable Unit FA Spane September 2010

PNNL-19695
Prepared for the U.S. Department of Energy under Contract DE-AC05-76RL01830
Large-Scale Pumping Test Recommendations for the 200-ZP-1 Operable Unit FA Spane September 2010

DISCLAIMER This report was prepared as an account of work sponsored by an agency of the United States Government. Neither the United States Government nor any agency thereof, nor Battelle Memorial Institute, nor any of their employees, makes any warranty, express or implied, or assumes any legal liability or responsibility for the accuracy, completeness, or usefulness of any information, apparatus, product, or process disclosed, or represents that its use would not infringe privately owned rights. Reference herein to any specific commercial product, process, or service by trade name, trademark, manufacturer, or otherwise does not necessarily constitute or imply its endorsement, recommendation, or favoring by the United States Government or any agency thereof, or Battelle Memorial Institute. The views and opinions of authors expressed herein do not necessarily state or reflect those of the United States Government or any agency thereof. PACIFIC NORTHWEST NATIONAL LABORATORY operated by BATTELLE for the UNITED STATES DEPARTMENT OF ENERGY under Contract DE-ACO5-76RL01830
Printed in the United States of America
Available to DOE and DOE contractors from the Office of Scientific and Technical Information,
P.O. Box 62, Oak Ridge, TN 37831-0062; ph: (865) 576-8401 fax: (865) 576 5728
email: [email protected]
Available to the public from the National Technical Information Service, U.S. Department of Commerce, 5285 Port Royal Rd., Springfield, VA 22161
ph: (800) 553-6847 fax: (703) 605-6900
email: [email protected] online ordering: http://www.ntis.gov/ordering.htm

PNNL-19695
Large-Scale Pumping Test Recommendations for the 200-ZP-1 Operable Unit FA Spane September 2010 Prepared for the U.S. Department of Energy under Contract DE-AC05-76RL01830 Pacific Northwest National Laboratory Richland, Washington 99352


v
Summary
CH2M Hill Plateau Remediation Company (CHPRC) is currently assessing aquifer characterization needs to optimize pump-and-treat remedial strategies (e.g., extraction well pumping rates, pumping schedule/design) in the 200-ZP-1 operable unit (OU), and in particular for the immediate area of the 241-TX-TY Tank Farm. Specifically, CHPRC is focusing on hydrologic characterization opportunities that may be available for newly constructed and planned ZP-1 extraction wells. These new extraction wells will be used to further refine the 3-dimensional subsurface contaminant distribution within this area and will be used in concert with other existing pump-and-treat wells to remediate the existing carbon tetrachloride contaminant plume. Currently, 14 extraction wells are actively used in the Interim Record of Decision ZP-1 pump-and-treat system for the purpose of remediating the existing carbon tetrachloride contamination in groundwater within this general area. As many as 20 new extraction wells and 17 injection wells may be installed to support final pump-and-treat operations within the OU area.
The addition of new, high-pumping capacity, extraction wells to the 200-ZP-1 pump-and-treat system provides the opportunity of generating areal hydrologic responses that may be analyzed for determining large-scale information for a wide-range of hydrologic properties (i.e., transmissivity, hydraulic conductivity, vertical and horizontal anisotropy, and storativity). This type of aquifer test characterization information is important for the detailed modeling of contaminant capture and the optimal use of the pump-and-treat system. Large-scale information can be obtained that is more reflective of ZP-1 pump-and-treat system operations by performing a constant-rate pumping test of longer duration (e.g., ~1 to 3 months). To conduct extended hydrologic tests of this duration without adversely impacting remedial activities of the pump-and-treat system requires that 1) the pumping tests be conducted within the framework of the existing 200-ZP-1 operational system and 2) the observed areal hydrologic response be monitored primarily with the existing monitor well networks.
Analytical simulations of areal test responses based on representative aquifer properties within the area and anticipated pumping rates indicate that the radius-of-influence (i.e., drawdown of ≥ 0.01 m) from large-scale, new ZP-1 extraction well tests would be extensive, and for test durations of ≥1 month extend to distances of ≥ 1,000 m from the pumping well location. Simulations of barometric effects on monitor well water-level responses during extended large-scale pumping tests indicate a potential well water-level response change of ≤ 0.3 m. The simulated magnitude of potential barometric pressure effects underlies the need to effectively remove barometric effects from surrounding well water level responses monitored during the extended, large-scale, pumping test. While no universal, large-scale test conclusions can be made from these general simulation evaluations, the assessment nevertheless suggests that large-scale, constant-rate pumping tests can be successfully performed within the operational framework of the existing 200-ZP-1 pump-and-treat system. Delineating the areal test response associated solely from pumping at a new ZP-1 extraction well, however, requires that unrelated, extraneous stress effects (e.g., pumping from surrounding ZP-1 pump-and-treat pumping wells and barometric pressure fluctuations) be effectively removed from the surrounding monitored well water-level response. The removal of extraneous hydrologic stresses from monitored areal water-level responses associated with large-scale pumping tests requires that the following conditions be implemented or maintained:
Uniform pumping rates should be maintained for surrounding extraction wells within the 200-ZP-1 system for 1 to 3 months before and during the large-scale, constant-rate pumping test initiated at the new ZP-1 extraction well(s). Maintaining uniform pumping

vi
rates serves to stabilize the areal drawdown (i.e., linear drawdown trend) imposed by surrounding ZP-1 extraction wells.
Barometric pressure effects are effectively removed from each monitor well response record analyzed for detailed large-scale pumping test analysis (Section 2.3).
Background drawdown trends from surrounding ZP-1 extraction wells are effectively removed from monitor well responses, enabling the quantitative analysis of drawdown responses imposed by the new ZP-1 extraction well constant-rate pumping test. The removal of ZP-1 extraction well impacts is greatly facilitated when the collective background trend is stable (linear) and where simple linear-regression correction methods can then be applied.
It should be noted that although the report specifically refers to the 200-ZP-1 OU, the large-scale test recommendations are also applicable to the adjacent 200-UP-1 OU area. This is because of the similar hydrogeologic conditions exhibited within these two adjoining OU locations.

vii
Acronyms
CHPRC CH2M Hill Plateau Remediation Company
CY calendar year
DOE U.S. Department of Energy
DOE/RL U.S. Department of Energy/Richland Operations
EPA U.S. Environmental Protection Agency
FY
IRF
fiscal year
infinite-acting radial flow
OU operable unit
PNNL Pacific Northwest National Laboratory
ROD Record of Decision
WMA Waste Management Area

ix
Acknowledgments
Several Pacific Northwest National Laboratory (PNNL) and CH2M Hill Plateau Remediation Company (CHPRC) staff and subcontractors provided contributions to this report’s preparation. From PNNL, technical peer review and editorial comments were provided by Darrell Newcomer and Wayne Cosby, respectively. Technical review comments were also provided from Mark Byrnes and Eugene Freeman (both with CHPRC), and from CHPRC subcontractors Sally Simmons (Fluor Government Group) and William Price (Freestone Environmental). In addition, CHPRC staff members Chris Newbill provided graphics support and Robert Edrington and Bill Barrett provided information concerning the 200-ZP-1 monitoring well network and pump-and-treat operations system, respectively.

ix
Contents
Summary ............................................................................................................................................... v
Acronyms .............................................................................................................................................. vii
Acknowledgments ................................................................................................................................. ix
1.0 Introduction/Background ............................................................................................................. 1.1
2.0 Large-Scale Pumping Test Discussion ........................................................................................ 2.1
2.1 General Test Performance .................................................................................................. 2.1
2.2 Analytical Methods ............................................................................................................. 2.2
2.2.1 Diagnostic Analysis and Derivative Plots ............................................................... 2.2
2.2.2 Type-Curve Method ................................................................................................ 2.3
2.2.3 Straight-Line Method .............................................................................................. 2.4
2.2.4 Unconfined Aquifer Dewatering Drawdown Correction ........................................ 2.4
2.3 Barometric-Pressure Effects Removal ................................................................................ 2.5
3.0 Large-Scale Test Response Simulations ...................................................................................... 3.1
3.1 Radius-of-Influence ............................................................................................................ 3.1
3.2 Pumping-Time Requirements ............................................................................................. 3.2
3.3 Barometric Pressure and Surrounding ZP-1 Extraction Well Impacts ............................... 3.5
4.0 References .................................................................................................................................... 4.1
Appendix A Large-Scale Pumping Test Example: Well 299-W15-225 .............................................. A.1
A.1 Surrounding ZP-1 Extraction Wells ................................................................................... A.2
A.2 Extended Baseline Monitoring ........................................................................................... A.3
A.3 Constant-Rate Pumping Test .............................................................................................. A.4
A.4 Other General Test Recommendations ............................................................................... A.4

x
Figures
1.1. Location Map Showing New 200-ZP-1 Pump-and-Treat Extraction/Injection Well System ..... 1.3
1.2. Location Map Showing the Boundaries of 200-ZP-1 and 200-UP-1 as Well as Other OU Areas within the Hanford Site ..................................................................................................... 1.4
2.1. Characteristic Log-Log Drawdown and Drawdown Derivative Plots for Various Hydrogeologic Formation and Boundary Conditions .................................................................. 2.3
3.1. Predicted Unconfined Aquifer Drawdown Versus Distance for Selected Pumping Periods ....... 3.2
3.2. Predicted Time/Drawdown at Selected Distances from the Pumped Well for Fully Penetrating Monitor Wells and Wells Completed within the Upper 15% of the Unconfined Aquifer ..................................................................................................................... 3.3
3.3. Predicted Drawdown and Drawdown Derivative Plot for a Monitor Well Completed Within the Upper 15% of the Unconfined Aquifer at a Distance of 300 m from the umped Well .................................................................................................................................. 3.4
3.4. Predicted Time/Drawdown at Selected Distances from the Pumped Well for Varying Unconfined Aquifer Specific Yield ............................................................................................. 3.4
3.5. Observed Barometric Pressure and Predicted Associated Well Water-Level Response ............. 3.7
3.6. Predicted Drawdown at a Monitor Well Located 300 m from the New ZP-1 Extraction Well ... 3.7
3.7. Start of Predicted Background Linear-Drawdown Trend from Surrounding ZP-1 Extraction Wells at a Monitor Well Located 300 m from the New ZP-1 Extraction Well ........................... 3.8
3.8. Predicted Drawdown with Barometric Effects at a Monitor Well Located 300 m from the New ZP-1 Extraction Well .......................................................................................................... 3.8
A.1. Location Map Showing TX-TY Tank Farm and Surrounding Well Sites ................................... A.5
Tables
A.1. Pertinent Distance Information and Recent Average Pumping Rates for Existing Interim ROD 200-ZP-1 Extraction Wells ................................................................................................. A.6
A.2. Pertinent Survey and Completion Information for Waste Management Area (WMA) TX-TY Area Wells ...................................................................................................................... A.7
A.3. Recommended Water-Level Measurement Frequencies During Large-Scale Pumping Test at Extraction Well 299-W15-225 and Nearby Monitor Wells 299-W15-40 and –W15-44 ......... A.8

1.1
1.0 Introduction/Background
CH2M Hill Plateau Remediation Company (CHPRC) is currently assessing aquifer characterization needs to optimize pump-and-treat remedial strategies in the 200-ZP-1 operable unit (OU), specifically for the immediate area of the 241-TX-TY Tank Farm. In addition, CHPRC is focusing on hydrologic characterization opportunities that may be available for recently completed and planned, ZP-1, pump-and-treat extraction wells (Figure 1.1). Characterization information obtained during the drilling of the new extraction wells will be used to further refine the 3-dimensional subsurface contaminant distribution within this area and will be used in concert with previously completed pump-and-treat wells to remediate the existing carbon tetrachloride contaminant plume. Currently, 14 extraction wells are actively used in the Interim Record of Decision, ZP-1, pump-and-treat system for remediating the existing carbon tetrachloride contamination in groundwater within this general area.
As discussed in Spane and Newcomer (2009a,b), a final Record of Decision (ROD) (EPA et al.2008) for the 200-ZP-1 groundwater operable unit was signed by the U.S. Environmental Protection Agency (EPA), the U.S. Department of Energy (DOE), and the Washington Department of Ecology on September 30, 2008. The final selected remedy for this groundwater OU included a combination of pump-and-treat, monitored natural attenuation, and flow-path and institutional controls. While interim pump-and-treat operations have been ongoing since 1994 within the 200-ZP-1 OU, the remedial activities to date have primarily focused on controlling the high-concentration portion of the carbon tetrachloride plume (>2,000 µg/L) within the OU area. The interim pump-and-treat system was designed to treat groundwater at collective pumping rates as high as 500 gpm; however, a new full-scale, 200-West Area Groundwater Treatment Facility is currently being designed to treat groundwater pumped collectively at rates as high as 2,500 gpm. This new facility is scheduled to be placed in operation by December 31, 2011. The new facility will treat the eight contaminants of concern identified in the final ROD (EPA et al. 2008), including carbon tetrachloride, trichloroethylene, total chromium, hexavalent chromium, technetium-99, iodine-129, tritium, and nitrate.
The 200-West Area Groundwater Treatment Facility may have as many as 20 new extraction wells and 17 injection wells installed to support final pump-and-treat operations (see Figure 1.1). The first of these new extraction wells to be installed was well 299-W15-225 (EW-1), which was constructed between February and June 2009. This well is located to the southwest of the 241-TX-TY Tank Farm. An evaluation was performed in fiscal year 2009 (FY 2009) to identify hydrologic test methods that could be implemented at this and other newly constructed extraction wells that would significantly improve the level of hydraulic property characterization within this portion of the 200-ZP-1 OU. As discussed in Spane and Newcomer (2009a), the general objective for acquiring detailed, large-scale, hydraulic property information from the newly constructed ZP-1 extraction wells is to improve and optimize the design and operation of the new 200-West Area Groundwater Treatment Facility, as described in the following U.S. Department of Energy/Richland Operations report (DOE/RL 2008). Specific objectives of the recommended hydrologic characterization tests are to determine the lateral and vertical distribution of aquifer hydraulic properties and to assess the lateral extent or area-of-influence of the new constructed extraction wells (Spane and Newcomer 2009a,b). This type of aquifer test characterization information is important for the detailed modeling of contaminant capture and the optimal use of the pump-and-treat system (e.g., extraction well pumping rates, pumping schedule/design).

1.2
As discussed in Spane and Newcomer (2009a,b), an extended duration, constant-rate, pumping test provides the best opportunity for obtaining detailed, large-scale information for a wide-range of hydrologic properties (i.e., transmissivity, hydraulic conductivity, vertical and horizontal anisotropy, and storativity). Larger scale information can be obtained that is more reflective of ZP-1 pump-and-treat system operations (and hydrologic parameter analysis uncertainty can be significantly reduced) by performing a constant-rate pumping test of longer duration. Of particular relevance to the pump-and-treat system, Spane and Newcomer (2009b) noted that:
An extended constant-rate pumping test can be realized without significant expenditure of additional characterization costs by performing the extended test within the existing 200-ZP-1 operational framework and relying on the existing, surrounding monitor well networks.
To implement an extended constant-rate pumping test using the existing 200-ZP-1 operational pump-and-treat system requires that the pumping at surrounding extraction well centers be held relatively constant when a new extraction well is placed on-line and pumped continuously for a prescribed period of time (e.g., 1 to 3 months). The associated response from the newly placed-on-line extraction well can then be theoretically analyzed from surrounding monitor well responses after removing the background hydrologic trend caused by the combined hydrologic impacts imposed from the other surrounding ZP-1 extraction wells.
It should be noted that an inherent element in analyzing large-scale, hydrologic test response results is the quantification and removal of temporal barometric pressure effects on monitor well water-level response. As demonstrated in Spane and Newcomer (2009b), for specific ZP-1 hydrologic tests conducted in FY-2009, as well as previous tests reported in Spane (1999, 2002, 2008a) and Spane and Thorne (2000), removing barometric pressure effects is necessary for any quantitative, detailed analysis of multi-well, constant-rate, pumping tests conducted within the general 200-West Area of the Hanford Site. Of relevance to this report, Spane and Newcomer (2009b) were able to resolve associated pumping test responses from ZP-1 monitor wells during a short-duration (3-day) pumping test conducted at a newly constructed ZP-1 extraction well (well 299-W15-225; EW-1) for monitor well distances of ≥690 m from the pumped well location after successfully removing barometric pressure effects from the well water-level record. It should be noted, however, that this short-duration test was performed after pumping at other, nearby ZP-1 extraction wells had been terminated for ~1 month to help stabilize water-table trend conditions before implementing the constant-rate test.
This report discusses relevant information required to perform a large-scale, constant-rate, pumping test using the pumping imposed by placing newly constructed extraction wells on-line within the existing 200-ZP-1 operational pump-and-treat system. This differs from previous test recommendation reports (e.g., Spane 2008a, Spane and Newcomer, 2009a) in that the recommended extended large-scale test is performed in the presence of pumping from surrounding extraction wells within the 200-ZP-1 operational pump-and-treat system. Section 2 describes the general test performance and methods to be used to process and analyze the observed associated well responses imposed by the test. Large-scale test response and barometric pressure effect simulations are presented in Section 3, while references cited in the text are listed in Section 4.0. Appendix A provides an example of specific test recommendations for the performance of a large-scale pumping test at a newly constructed ZP-1 extraction well location (well 299-W15-225) that was added to the 200-ZP-1 pump-and-treat system during the summer of CY-2010.

1.3
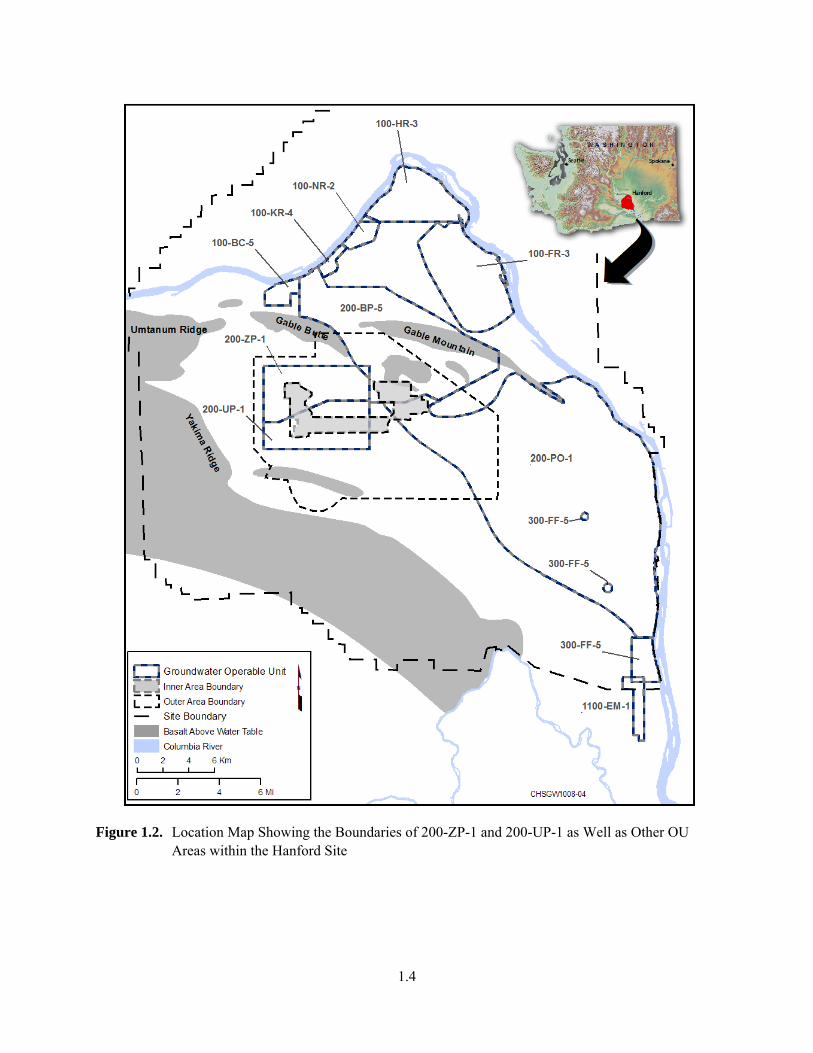
It should be noted that although the report specifically refers to the 200-ZP-1 OU, the large-scale test recommendations would also be applicable to the adjacent 200-UP-1 OU area. This is because of the similar hydrogeologic conditions exhibited within these two OU locations. Figure 1.2 shows the boundary relationships of 200-ZP-1 and 200-UP-1 as well as other OU areas within the Hanford Site.
Figure 1.1. Location Map Showing New 200-ZP-1 Pump-and-Treat Extraction/Injection Well System
1.4
Figure 1.2. Location Map Showing the Boundaries of 200-ZP-1 and 200-UP-1 as Well as Other OU Areas within the Hanford Site

2.1
2.0 Large-Scale Pumping Test Discussion
The following discussion is taken primarily from Spane and Newcomer (2009a) as it pertains to constant-rate, pumping test performance and analysis. During constant-rate pumping tests, groundwater is extracted from the test interval and regulated to maintain a constant, uniform rate. The pressure response within the pumped well is monitored during the active withdrawal (drawdown) phase and during any subsequent recovery (build-up) period following termination of pumping. The analysis of the drawdown and recovery pressure response within the pumped well and surrounding monitor wells (i.e., multi-well tests) provides a means for estimating hydraulic and storage properties of the aquifer as well as for discerning formational and non-formational flow conditions (e.g., wellbore storage, skin effects, presence of boundaries). Standard analytical methods used to analyze constant-rate tests include type-curve matching and straight-line methods (see Section 2.2). Guidance for the performance of constant-rate pumping tests is contained in the Pacific Northwest National Laboratory (PNNL) procedures manual PNL-MA-567,(a) AT-7. An excellent reference for measuring, conducting, and analyzing multi-well, constant-rate, pumping tests is presented in Kruseman and de Ridder (2000). Examples of previous multi-well, constant-rate, pumping tests performed on the Hanford Site are presented in Spane et al. (2001a, 2001b, and 2002) and Spane (2008b). The test results reported for a short-duration (3-day) test reported in Spane and Newcomer (2009b), which involved the newly constructed ZP-1 extraction well 299-W15-225, are of particular relevance to this report’s discussion on large-scale, extended-duration, pumping tests within the 200-ZP-1 OU.
2.1 General Test Performance
The extraction of groundwater from a specific well location at a constant rate causes associated drawdown pressure responses to be imposed within an aquifer that are a function of the pumping rate, distance from the point of pumping, and surrounding aquifer hydraulic and storage properties. The collection of observed drawdown data versus time (i.e., since pumping initiated) at the pumped well and various surrounding monitor well locations provides the analysis basis for determining aquifer hydraulic and storage properties.
It should be noted that an inherent assumption in hydraulic test analysis is that the observed well water-level responses are caused solely by the imposed hydrologic stress (e.g., constant-rate pumping test at a new ZP-1 extraction well). External man-induced stresses (i.e., from surrounding ZP-1 pump-and-treat extraction wells) as well as natural stresses such as barometric pressure fluctuations, however, can have discernible impacts on well water-level measurements and may significantly mask water-level responses within more distant monitoring wells from the new extraction well location (see Section 3). To enhance the delineation of hydrologic responses imposed solely from constant-rate pumping tests conducted at new ZP-1 extraction wells, it is recommended that the transient hydrologic impacts from surrounding ZP-1 extraction wells be stabilized before adding the new ZP-1 extraction well to the 200-ZP-1 pump-and-treat system. An extended baseline monitoring period should also be implemented for removing temporal barometric pressure fluctuation effects and background water-table trends (see Sections 2.3 and 3.3). The general steps required for implementing a constant-rate pumping test at a
(a) PNL-MA-567. 1993. Procedures for Ground-Water Investigations: AT-5, Rev. 2: “Constant-rate discharge and
recovery tests”; Pacific Northwest National Laboratory, Richland, Washington.

2.2
new ZP-1 extraction well location are discussed in Section 3.3, and detailed test recommendations for a specific example test well location are provided in Appendix A.
2.2 Analytical Methods
The following discussion on constant-rate, pumping-test analysis is taken largely from Spane and Newcomer (2008) and Spane (2008b) and applies to constant-rate pumping test drawdown and recovery responses both at the pumped-well and surrounding monitor-well locations. Analytical methods used to analyze well water-level responses associated with constant-rate pumping tests assume homogeneous/ anisotropic conditions and account for wellbore storage and well/aquifer partial penetration relationships.
2.2.1 Diagnostic Analysis and Derivative Plots
Log-log plots of water level versus time have traditionally been used for diagnostic purposes and, more recently, the derivative of the water level or pressure has also been used (e.g., Bourdet et al. 1989, Spane 1993) as an enhanced diagnostic tool. The derivative of the corrected water level with respect to the natural logarithm of time (i.e., essentially the slope of the semi-log plot) is calculated and plotted on the log-log plots of drawdown versus time. The use of derivative plots has been shown to significantly improve the diagnostic and quantitative analysis of various hydrologic test methods (Bourdet et al. 1989, Spane and Wurstner 1993). The improvement in test analysis is attributed to the sensitivity of pressure derivatives to various test/formation conditions. Specific applications for which derivatives are particularly useful include the following:
determining formation-response characteristics (confined or unconfined aquifer) and boundary conditions (impermeable or constant head) that are evident within the test data
assisting in the selection of the appropriate type-curve solution through combined type-curve/derivative plot matching
determining when infinite-acting, radial flow conditions are established and, therefore, when straight-line analysis methods are applicable.
Figure 2.1 shows log-log drawdown and derivative responses for pumping tests that are characteristic of some commonly encountered formation conditions. The early-time data, when wellbore storage is dominant, produce a steep, upward-trending derivative. The derivative normally decreases during transition from wellbore storage to radial flow and stabilizes at a constant value when infinite-acting, radial flow conditions are established. The stable derivative reflects the straight line on the semi-log plot for infinite-acting radial flow. Unconfined and double-porosity aquifers may show two stable derivative sections at the same vertical position, separated by a “valley” representing the transition from an initial elastic storage response to a total test system storativity condition. Diagnostic derivative plots are also useful in identifying boundary effects. A linear, no-flow boundary will result in a doubling of the magnitude of the derivative. If radial flow is established before the influence of the boundary is seen, a stable derivative will occur for a time followed by an upward shift to twice the original value. Constant-head boundaries display a downward trend in the derivative, which may be preceded by a stable derivative if radial flow conditions occur before the boundary effect becomes

2.3
Figure 2.1. Characteristic Log-Log Drawdown and Drawdown Derivative Plots for Various Hydrogeologic Formation and Boundary Conditions (adapted from Spane and Wurstner 1993)
dominant. The DERIV program, described in Spane and Wurstner (1993), should be employed for diagnostic and test-analysis aspects for drawdown data obtained during large-scale, constant-rate, pumping tests conducted within the 200-ZP-1 operational system.
2.2.2 Type-Curve Method
Type-curve matching methods (Theis 1935; Hantush 1964; Neuman 1972, 1974, 1975) are commonly used to analyze pumping test responses. These approaches, however, do not account for wellbore storage effects, either at the pumped well or observation well locations. To account for wellbore storage effects, type curves can be generated using the WTAQ3 computer program described by Moench (1997). WTAQ3 can be used to generate pumping test-type curves that represent a wide range of test and aquifer conditions, including partially penetrating wells, confined or unconfined aquifer models, stress (pump) well skin, and wellbore storage at both the stress and observation (monitor) well locations. The type-curve generation program also allows for non-instantaneous release (drainage-delay factor) of water from the unsaturated zone. The shape of the unconfined aquifer, pumping test-type curves used in the individual well response analysis is sensitive to a number of hydrologic parameters, including radial
2.4
distance from the pumping well location, ro, vertical anisotropy, KD ( i.e., Kv/Kh), and the storativity/specific yield ratio ( = S/Sy).
It should be noted that a publically available version of WTAQ that is described in Barlow and Moench (1999) can be obtained through the U.S. Geological Survey website (http://www.usgs.gov/).
2.2.3 Straight-Line Method
For straight-line analysis methods, the rate of change of water levels within the well during drawdown and/or recovery is analyzed to estimate hydraulic properties. Because well effects are constant with time during constant-rate tests, straight-line methods can be used to quantitatively analyze the water-level response at both pumping and observation wells. The semi-log, straight-line analysis techniques commonly used are based either on the Cooper and Jacob (1946) method (for drawdown analysis) or the Theis (1935) recovery method (for recovery analysis). These methods are theoretically restricted to analyzing test responses from wells that fully penetrate non-leaky, homogeneous, isotropic, confined aquifers. Straight-line methods, however, may be applied under non-ideal well and aquifer conditions if infinite-acting, radial flow (IRF) conditions exist. IRF conditions are indicated during testing when the change in pressure, at the point of observation, increases in proportion to the logarithm of time. As discussed above, the use of diagnostic derivative methods (Bourdet et al. 1989) makes it easier to identify the portions within the test data where straight-line analysis is appropriate. Because of the partially penetrating well conditions for many 200-ZP-1 extraction and monitor well locations (and the generally large inter-well radial distances between extraction and monitor wells), extended duration pumping tests (e.g., >1 month) may be required to establish IRF conditions at surrounding monitor well locations. As a result therefore, the use of straight-line analysis methods can only be applied for those monitor well locations exhibiting IRF diagnostic derivative patterns during the large-scale pumping test.
2.2.4 Unconfined Aquifer Dewatering Drawdown Correction
As noted in Spane and Newcomer (2008), for thin aquifers where drawdown represents a significant percentage of the total saturated thickness, corrections for dewatering the unconfined aquifer are required to account for the decrease in associated aquifer transmissivity. Jacob (1963) provided an equation to correct drawdown data obtained for pumping tests within thin unconfined aquifers. The corrected drawdown, s’, which accounts for aquifer dewatering, can be calculated using the following relationship:
2b
ss's
2
(2.1)
where s is the observed drawdown, and b is the initial saturated aquifer thickness.
The unconfined aquifer within the general 200-ZP-1 area is relatively thick (i.e., ≥55 m), and the predicted areal drawdown and decrease in aquifer thickness during the constant-rate pumping test are expected to be relatively small for the projected pumping test rates, as indicated in Spane and Newcomer (2009b). Given this condition, the associated aquifer dewatering correction for unconfined aquifer tests would also be relatively small (e.g., for s = 1.0 m; s2/2b = 0.01 m). For this reason, dewatering drawdown
2.5
corrections for surrounding monitor well responses are not considered to be of importance for proposed large-scale pumping tests using new ZP-1 extraction wells.
2.3 Barometric-Pressure Effects Removal
As discussed in Spane and Newcomer (2008), barometric-pressure fluctuations can have a discernible impact on well water-level measurements obtained during hydrologic tests for aquifer property characterization. Although the pressure transducers commonly used in hydrologic testing are vented to correct the well readings for changes in barometric pressure, barometric fluctuations can also cause actual changes to the water-level elevation within a well that are unrelated to actual surrounding aquifer conditions. This response effect is commonly ascribed to confined aquifers; however, wells completed within unconfined aquifers may also exhibit associated responses to barometric changes (Weeks 1979, Rasmussen and Crawford 1997). Water levels in unconfined aquifers typically exhibit variable time-lagged responses to barometric fluctuations. This time-lag response is caused by the time required for the barometric pressure change to be transmitted from land surface to the water table through the vadose zone, as compared to the instantaneous transmission of barometric pressure through the open well.
To determine the significance of barometric effects and enable their removal from well water-level measurements, an extended baseline monitoring period (e.g., 1 to 3 months) is recommended before initiating large-scale, constant-rate, pumping tests at new ZP-1 extraction well locations. The extended baseline monitoring period can also be used to evaluate the stabilization of background water-table trends from surrounding ZP-1 extraction well locations. Collecting an extended record of well water-levels and associated barometric pressure readings during this baseline monitoring period enables barometric response functions to be developed for each of the wells selected for monitoring during the hydrologic test characterization. The development of the barometric response functions provides the means for removing barometric pressure fluctuation effects from well water-level measurements collected during the drawdown and recovery phases for large-scale, constant-rate, pumping tests, thereby facilitating quantitative hydrologic test analysis. This is particularly relevant for more distant monitoring wells (i.e., >100 m) from the extraction well where temporal barometric pressure fluctuations may have a greater impact on well water-levels than the hydrologic response produced by pumping at the extraction-well location. A detailed description of the barometric removal process is presented in Rasmussen and Crawford (1997) and Spane (1999, 2002). Examples of its application for barometric-pressure removal from similar areal hydrologic test characterization assessments associated with neighboring ZP-1 extraction well locations are provided in Spane and Thorne (2000) and Spane (2008b).

3.1
3.0 Large-Scale Test Response Simulations
To examine the possibility of conducting large-scale pumping tests within the framework of an operational 200-ZP-1 pump-and-treat system, a series of test response simulations were developed. Predicted pumping test responses were calculated using the analytical WTAQ3 model described by Moench (1997). As noted in Section 2.2, WTAQ3 can be used to generate constant-rate, pumping test responses for a wide range of test and aquifer conditions, including partially penetrating wells, confined or unconfined aquifer models, stress (pump) well skin, and wellbore storage at both the stress and observation (monitor) well locations. The test predictions were performed to assess three hydrologic scenarios pertinent to conducting a large-scale, constant-rate pumping test at new ZP-1 extraction well sites. The three hydrologic scenarios included:
1) determining the radius-of-influence for pumping imposed at a new ZP-1 extraction well for selected periods of time
2) assessing required pumping times to establish IRF conditions at selected distances from the new extraction well location
3) visually examining generated test responses at distant monitor well locations (e.g., ≥300 m from new extraction wells) in the presence of temporal barometric pressure fluctuations.
To conduct the test predictions, hydrologic property information calculated from the FY-2009, 3-day, constant-rate pumping test at well 299-W15-225 served as input information to the WTAQ3 model runs. As noted in Spane and Newcomer (2009b), analysis results for the 3-day test were limited to the composite multi-well analysis for the pumped well and near-field wells located within 100 m from the pumping well location. The composite multi-well analysis indicated the following best-estimate aquifer property values: T = 438 m2/day; K = 7.91 m/day (based on an aquifer thickness, b, of 55.4 m); KD = 0.1; S = 9.7E-4; and Sy = 0.096. These hydrologic properties were the basis for the test-response predictions.
3.1 Radius-of-Influence
Figure 3.1 shows the predicted distance-drawdown-response comparisons produced within the surrounding unconfined aquifer after 1 day, 1 week, 1 month, 2 months, and 1 year for a pumping rate of 870.6 lpm (230 gpm), and aforementioned hydrologic input parameters. If the radius-of-influence is defined as the lateral distance to where a measurable hydrologic response of 0.01 m is produced, then the radius-of-influence for pumping periods of 1 month and 1 year are ~1,000 and 3,000 m, respectively. It should be noted that the predicted drawdown shown in Figure 3.1 is for monitor wells that are completed within the upper 15% of the unconfined aquifer, which is the common completion relationship of most monitor wells within the 200-ZP-1 OU. However, as indicated in Neuman (1972, 1974), drawdown differences with depth within an unconfined aquifer (measured by partially penetrating monitor wells) diminish with distance from the extraction well location, and for radial distances (r) greater than b/(KD)1/2, they completely disappear when testing time, t, exceeds: t ≥ 10 Sy r
2/T (3.1) For illustration purposes, for an aquifer thickness, b, of 55 m, and for the aforementioned hydrologic

3.2
Figure 3.1. Predicted Unconfined Aquifer Drawdown Versus Distance for Selected Pumping Periods
input properties, the calculated time for disappearance of partial penetration or aquifer-depth dependence effects would be ~21.9 days for radial distances greater than 175 m from the extraction well. The relevance of this predicted time using this general equation relationship is more quantitatively shown in Figure 3.2 by comparing the predicted average drawdown for fully penetrating monitor wells versus wells completed within the upper 15% of the unconfined aquifer for selected radial distances from the extraction well. As indicated, after 21.9 days, the predicted drawdown response for fully penetrating monitor wells and wells completed within the upper 15% of the aquifer are essentially the same.
3.2 Pumping-Time Requirements
To evaluate the time required to establish areal IRF conditions, composite diagnostic drawdown and derivative plots were developed for various distances from an extraction well location. Figure 3.3 shows the predicted time drawdown and drawdown derivative plot for a monitor well completed within the upper 15% of the unconfined aquifer at a distance of 300 m from an extraction well. The distance of 300 m was selected because it encompasses the distances of most wells that have been previously monitored and analyzed during large-scale, constant-rate, pumping tests conducted within the 200-ZP-1 (e.g., Spane and Newcomer, 2008, 2009b). As shown, IRF conditions are established after ~2 months of pumping for the aforementioned/indicated test properties. It should be realized that hydraulic diffusivity, T/Sy, primarily determines the onset of IRF conditions for respective monitor well distances. If the T estimate of 438 m2/day, as reported in Spane and Newcomer (2009b) for the 3-day test conducted in FY-2009, is assumed to be representative of larger scale areal conditions, then the establishment of IRF conditions is mainly determined by and inversely proportional to the aquifer specific yield, Sy. To demonstrate this dependence, Figure 3.4 shows a predicted time-drawdown comparison for selected
0.01
0.1
1
10
1 10 100 1000 10000
Predicted Drawdown, m
Radial Distance from Extraction Well, m
1 Day
1 Week
1 Month
2 Months
1 Year
Test ParametersT = 438 m2/dayKD = 0.1S/Sy = 0.01Sy = 0.096b = 55.0 mQ = 870.6 lpm
Distance/Drawdown Relationships

3.3
distances for two representative Sy values expected to encompass actual aquifer conditions (i.e., 0.1 and 0.25). As shown, higher Sy values cause a delay in drawdown response and the onset of IRF conditions at the selected distances.
Figure 3.2. Predicted Time/Drawdown at Selected Distances from the Pumped Well for Fully Penetrating Monitor Wells and Wells Completed within the Upper 15% of the Unconfined Aquifer
0.01
0.10
1.00
10.00
100.00
1000.00
1 10 100 1000 10000 100000 1000000Time, minutes
Pumping Well
r = 50 m; upper 15% of aquifer
r = 300 m; upper 15% of aquifer
r = 1000 m; upper 15% of aquifer
= 21.9 days
Predicted Pumping Test Drawdown
Pre
dict
ed D
raw
dow
n, m
Test ParametersT = 438.0 m2/day
Kh = 7.91 m/dayKD = 0.1 S = 9.69E-4
Sy = 0.096b = 55.0 m
Q = 870.6 lpm fully-penetrating well

3.4
Figure 3.3. Predicted Drawdown and Drawdown Derivative Plot for a Monitor Well Completed within the Upper 15% of the Unconfined Aquifer at a Distance of 300 m from the Pumped Well
Figure 3.4. Predicted Time/Drawdown at Selected Distances from the Pumped Well for Varying Unconfined Aquifer Specific Yield
0.01
0.10
1.00
10.00
1000 10000 100000 1000000
Time, minutes
Drawdown
Drawdown Derivative
= 2 months
Predicted Drawdown at 300 Meters Distance from Pumping Well, in a Monitor Well Completed within the
Upper 15% of the Unconfined Aquifer
Pre
dict
ed D
raw
dow
n an
d Test Parameters
T = 438.0 m2/dayKh = 7.91 m/dayKD = 0.1 S = 9.69E-4
Sy = 0.096ro = 300 mb = 55.0 m
Q = 870.6 lpm
infinite-acting radial flow conditions
0.01
0.10
1.00
10.00
100.00
1 10 100 1000 10000 100000 1000000Time, minutes
r = 50 m; Sy = 0.10
r = 300 m; Sy = 0.10
r = 1000 m; Sy = 0.10
r = 50 m; Sy = 0.25
r = 300 m; Sy = 0.25
r = 1000 m; Sy = 0.25
= 2 months
Predicted Pumping Test Drawdown:Varying Specific Yield Values
Pre
dict
ed D
raw
dow
n, m
Test ParametersT = 438.0 m2/day
Kh = 7.91 m/dayKD = 0.1 S = 9.69E-4
b = 55.0 mQ = 870.6 lpm
(note: predicted drawdown for monitor wells completed within the upper 15% of the unconfined aquifer)
3.5
3.3 Barometric Pressure and Surrounding ZP-1 Extraction Well Impacts
The barometric pressure recorded at the nearby Hanford Meteorological Station observed during the first 6 months of Calendar year 2009 (CY-2009) was used to assess the hydrologic impacts of barometric pressure fluctuations on water-level responses within wells monitored during large-scale pumping tests. Figure 3.5 shows the observed barometric response and predicted hydrologic impact on well water-level response based on the convolution procedure described in Spane (1999, 2002) and the barometric/well response characteristics calculated for ZP-1 monitor well 299-W14-14. This monitor well is reported in Spane and Newcomer (2009b) to provide representative time-lag response characteristics for many wells within the general WMA TX-TY area. As shown in the figure, the impact of barometric pressure fluctuations would produce a maximum water-level change of 0.32 m over the 6-month period, and it varied between -0.13 and +0.19 m. These fluctuations are more prevalent during winter and early spring months (Calendar Days: 1 to 120) because of the higher occurrence of weather events (i.e., passage of low-pressure systems). Any areal well water-level responses associated with large-scale, constant-rate, pumping tests, therefore, would be monitored with an expected variable, a background water-level fluctuation change of ~0.3 m caused by barometric pressure effects, as shown in Figure 3.5.
To examine the hydrologic impacts of pumping at surrounding ZP-1 extraction wells before and during initiation of large-scale, constant-rate, pumping tests (i.e., by adding new ZP-1 extraction wells to the operational 200-ZP-1 pump-and-treat system), the same hydrologic properties and analytical methods were used as listed in Sections 3.1 and 3.2. For this assessment, the simulated drawdown response was predicted for an observation well located 300 m from a new ZP-1 extraction well location. Pumping at the new ZP-1 extraction well was initiated at Calendar Day 91 at a pumping rate of 870.6 lpm (230 gpm). Surrounding ZP-1pumping effects were simulated using three pumping locations located at distances of 300, 450, and 600 m from the monitor well location, respectively. The pumping rate for the surrounding ZP-1 extraction wells was arbitrarily set at 1/3 that of the new ZP-1 extraction well (i.e., 290 lpm; 76 gpm), which is reflective of current maximum pumping rates for some existing ZP-1 extraction wells. The surrounding ZP-1 extraction well pumping was collectively initiated on Calendar Day 1, which is 90 days before implementing the simulated large-scale, constant-rate, pumping test.
Figure 3.6 shows the simulated drawdown at a monitor well located 300 m from the new ZP-1 extraction well. The drawdown for Calendar Days 1 to 91 is attributed solely to the impact of pumping from surrounding ZP-1 extraction wells. The drawdown starting at and after Calendar Day 91 is a superposition of the drawdown produced from the surrounding ZP-1 wells and the initiation of the large-scale, constant-rate pumping tests at the new ZP-1 extraction well. As shown, the hydrologic impact imposed by the large-scale, constant-rate, pumping test (i.e., after Calendar Day 91) is readily discernable from the background drawdown trend, imposed by the surrounding ZP-1 extractions wells. The quantitative analysis of the large-scale, constant-rate, pumping test response is predicated on the ability to remove the extraneous background drawdown effects imposed by the surrounding ZP-1 pumping wells (i.e., de-superposition). The removal process is greatly facilitated if the background drawdown trend is linear in nature. Figure 3.7 shows that for the example examined, the linear background drawdown trend conditions are established ~21 days before initiation of the large-scale, constant-rate, pumping test (i.e., ~Calendar Day 70).
The previous discussion assumes that the observed drawdown response is not significantly impacted by other extraneous water-level response effects. However, as shown in Figure 3.5, temporal barometric

3.6
pressure fluctuations would be expected to produce well water-level changes of ~0.3 m during the period of performing and monitoring large-scale, constant-rate, pumping tests. To demonstrate the impact of barometric effects, Figure 3.8 shows the simulated water-level response due to barometric fluctuations (shown in Figure 3.5) superimposed on the previously predicted drawdown responses (shown in Figure 3.6). Although the presence of drawdown is still evident in the presence of barometric pressure fluctuations, the figure indicates that the removal of barometric pressure effects (see Section 2.3) would be necessary to perform detailed quantitative analysis of the large-scale, pumping test, drawdown response.
While no universal, large-scale test conclusions can be determined from these general simulation evaluations, the assessment nevertheless suggests that large-scale, constant-rate, pumping tests can be successfully performed within the operational framework of the existing 200-ZP-1 pump-and-treat system. The quantitative analysis of the proposed large-scale pumping tests, however, requires that the following conditions be implemented or maintained:
Uniform pumping rates should be maintained for surrounding ZP-1 extraction wells for 1 to 3 months before and during the large-scale, constant-rate, pumping test initiated at the new ZP-1 extraction well(s). Maintaining uniform pumping rates serves to stabilize the areal drawdown (i.e., linear drawdown trend) imposed by surrounding ZP-1 extraction wells.
Barometric pressure effects should be effectively removed from each monitor well response record that is analyzed for detailed, large-scale, pumping test analysis (Section 2.3).
Background drawdown trends from surrounding ZP-1 extraction wells should be effectively removed from monitor well responses, enabling the quantitative analysis of drawdown responses imposed by the new large-scale, constant-rate, pumping test at the ZP-1 extraction well. Removing ZP-1 extraction well impacts is greatly facilitated when the collective background trend is stable (linear) and where simple linear-regression correction methods can then be applied.

3.7
Figure 3.5. Observed Barometric Pressure and Predicted Associated Well Water-Level Response
Figure 3.6. Predicted Drawdown at a Monitor Well Located 300 m from the New ZP-1 Extraction Well
9.85
10.05
10.25
10.45
10.65
10.85
‐0.6
‐0.4
‐0.2
0.0
0.2
0.4
0 30 60 90 120 150 180
Barometric Pressure, m
Well W
ater‐Level Response , m
Calendar Days ‐ 2009
Predicted Water‐Level Response
Barometric Pressure
132.5
133.0
133.5
134.0
134.5
0 30 60 90 120 150 180
Well W
ater‐Level Elevation, m M
SL
Calendar Days
Surrounding ZP‐1 Extraction Well Impact
Total Composite Drawdown
Start of Large‐Scale Pumping Test
Note: predicted drawdown at a monitor well located at a distance of 300 m from the new ZP‐1 extraction well

3.8
Figure 3.7. Start of Predicted Background Linear-Drawdown Trend from Surrounding ZP-1 Extraction Wells at a Monitor Well Located 300 m from the New ZP-1 Extraction Well
Figure 3.8. Predicted Drawdown with Barometric Effects at a Monitor Well Located 300 m from the New ZP-1 Extraction Well
133.0
133.5
134.0
134.5
1 10 100 1000
Well W
ater‐Level Elevation, m M
SL
Calendar Days
Surrounding ZP‐1 Extraction Well Impact
Start of Large‐Scale Pumping Test
Note: predicted drawdown at a monitor well located at a distance of 300 m from the new ZP‐1 extraction well
Note: start of surrounding ZP‐1 extraction well linear‐drawdown trend
132.5
133.0
133.5
134.0
134.5
0 30 60 90 120 150 180
Well W
ater‐Level Elevation, m M
SL
Calendar Days
Surrounding ZP‐1 Extraction Well Impact
Total Composite Drawdown
Start of Large‐Scale Pumping Test
Note: predicted drawdown at a monitor well located at a distance of 300 m from the new ZP‐1 extraction well

4.1
4.0 References
Barlow PM and AF Moench. 1999. “WTAQ ― A Computer Program for Calculating Drawdowns and Estimating Hydraulic Properties for Confined and Water-Table Aquifers.” U.S. Geological Survey Water-Resources Investigations Report 99-4225, 84 p.
Bourdet DJ, A Ayoub, and YM Pirard. 1989. “Use of Pressure Derivative in Well-Test Interpretation.” SPE Formation Evaluation June 1989:293–302.
Cooper HH, Jr., and CE Jacob. 1946. “A Generalized Graphical Method for Evaluating Formation Constants and Summarizing Well-Field History.” American Geophysical Union, Transactions 27(4):526–534.
DOE/RL— U.S. Department of Energy, Richland Operations Office. 2008. Proposed plan for remediation of the 200-ZP-1 groundwater operable unit, record of decision, Hanford 200 Area, 200-ZP-1 superfund site, Benton county, Washington. DOE/RL-2007-33, Rev. 0, Richland, Washington.
EPA, Ecology, and DOE. 2008. Record of Decision, Hanford 200 Area, 200-ZP-1 Superfund Site, Benton County, Washington, 09-AMCP-0003, U.S. Environmental Protection Agency, Washington State Department of Ecology, and U.S. Department of Energy, Olympia, Washington.
Hantush MS. 1964. “Hydraulics of Wells.” Advances in Hydroscience (VT Chow, ed) 1:282–433, Academic Press, New York.
Jacob CE. 1963. “Determining the permeability of water-table aquifers.” In: Methods of Determining Permeability, Transmissibility, and Drawdown. U.S. Geological Survey, Water-Supply Paper 1536-I:245-271.
Kruseman GP, and NA de Ridder (with assistance from JM Verweij). 2000. Analysis and evaluation of pumping test data. International Institute for Land Reclamation and Improvement, Wageningen, The Netherlands. Publication 47, Second Edition (Completely Revised), 377 p.
Moench AF. 1997. “Flow to a Well of Finite Diameter in a Homogeneous, Anisotropic Water-Table Aquifer.” Water Resources Research 33(6):1397–1407.
Neuman SP. 1972. “Theory of Flow in Unconfined Aquifers Considering Delayed Response of the Water Table.” Water Resources Research 8(4):1031–1045.
Neuman SP. 1974. “Effect of Partial Penetration of Flow in Unconfined Aquifer Considering Delayed Gravity Response.” Water Resources Research 10(2):303–312.
Neuman SP. 1975. “Analysis of Pumping Test Data from Anisotropic Unconfined Aquifers Considering Delayed Gravity Response.” Water Resources Research 11(2):329–342.
Rasmussen TC, and LA Crawford. 1997. “Identifying and removing barometric pressure effects in confined and unconfined aquifers.” Ground Water 35(3):502–511.

4.2
Spane FA, Jr. 1993. Selected Hydraulic Test Analysis Techniques for Constant-Rate Discharge Tests. PNL-8539, Pacific Northwest Laboratory, Richland, Washington.
Spane FA, Jr. 1999. Effects of Barometric Fluctuations on Well Water-Level Measurements and Aquifer Test Data. PNNL-13078, Pacific Northwest National Laboratory, Richland, Washington.
Spane FA, Jr. 2002. “Considering barometric pressure in groundwater flow investigations.” Water Resources Research 38(6), 14:1–18.
Spane FA. 2008a. Aquifer Testing Recommendations for Supporting Phase II of the T-Area Technetium-99 Data Objectives Process – Letter Report. PNNL-17433, Pacific Northwest National Laboratory, Richland, Washington.
Spane FA. 2008b. Analysis of the Hydrologic Response Associated with Shutdown and Restart of the 200-ZP-1 WMA T Tank Farm Pump-and-Treat System. PNNL-17732, Pacific Northwest National Laboratory, Richland, Washington.
Spane FA, Jr., and DR Newcomer. 2008. Results of Detailed Hydrologic Characterization Tests – Fiscal and Calendar Year 2005. PNNL-17348, Pacific Northwest National Laboratory, Richland, Washington.
Spane FA, Jr., and DR Newcomer. 2009a. Aquifer Testing Recommendations for Well 299-W15-225: Supporting Phase I of the 200-ZP-1 Groundwater Operable Unit Remedial Design. PNNL-18279, Pacific Northwest National Laboratory, Richland, Washington.
Spane FA, Jr., and DR Newcomer. 2009b. Final Test Report: Preliminary Aquifer Test Results for Well 299-W15-225: Supporting Phase 1 of the 200-ZP-1 Groundwater Operable Unit Remedial Design. PNNL-18732, Pacific Northwest National Laboratory, Richland, Washington.
Spane FA, Jr., and PD Thorne. 2000. Analysis of the Hydrologic Response Associated with Shutdown and Restart of the 200-ZP-1 Pump-and-Treat System. PNNL-13342, Pacific Northwest National Laboratory, Richland, Washington.
Spane FA, Jr., and SK Wurstner. 1993. “DERIV: A program for calculating pressure derivatives for use in hydraulic test analysis.” Ground Water 31(5):814–822.
Spane FA, Jr., PD Thorne, and DR Newcomer. 2001a. Results of Detailed Hydrologic Characterization Tests – FY 1999. PNNL-13378, Pacific Northwest National Laboratory, Richland, Washington.
Spane FA, Jr., PD Thorne, and DR Newcomer. 2001b. Results of Detailed Hydrologic Characterization Tests – FY 2000. PNNL-13514, Pacific Northwest National Laboratory, Richland, Washington.
Spane FA Jr., PD Thorne, and DR Newcomer. 2002. Results of Detailed Hydrologic Characterization Tests – FY 2001. PNNL-14113, Pacific Northwest National Laboratory, Richland, Washington.
Theis CV. 1935. “The Relationship Between the Lowering of the Piezometric Surface and the Rate and Duration of Discharge of a Well Using Ground-Water Storage.” Amer. Geophys. Union, Transactions, 2: 519–524; reprinted in Society of Petroleum Engineers, "Pressure Transient Testing Methods.", SPE Reprint Series (14):27-32.

4.3
Weeks EP. 1979. “Barometric Fluctuations in Wells Tapping Deep Unconfined Aquifers.” Water Resources Research 15(5):1167–1176.

A.1
Appendix A
Large-Scale Pumping Test Example: Well 299-W15-225
The following test example identifies specific activities and test recommendations required to perform a large-scale, constant-rate, pumping test for new ZP-1 extraction wells as they are added to the operational 200-ZP-1 pump-and-treat system. The test example is for new ZP-1well 299-W15-225, which was added to the 200-ZP-1 operational system during the summer of CY-2010. The following discussion pertains to specific activities associated with conducting a large-scale pumping test at well 299-W15-225 within the framework of the 200-ZP-1 operational system; however, these test recommendations can be generally applied (with localized modification) to other surrounding new ZP-1 extraction wells that are added sequentially to the pump-and-treat system. It should be noted that the issuance of this report post-dates the actual addition of well 299-W15-225 to the 200-ZP-1 system; however, the test recommendations for performing the large-scale pumping test were conveyed to CHPRC earlier in the year.
As noted previously, large-scale hydraulic/storage properties can be derived from the large-scale pumping test by monitoring and analyzing the associated, areal hydrologic response imposed by pumping at surrounding monitor well locations. The principal objectives of the large-scale, constant-rate, pumping test are to 1) determine the lateral distribution of aquifer hydraulic/storage properties surrounding the new extraction well and 2) establish the lateral extent or radius-of-influence imposed by the hydrologic test. Because of the extended duration planned for the pumping period (i.e., 1 to 3 months), nearby wells within 100 m and intermediate-distant wells (~100 and ~300 m, respectively) are expected to exhibit response characteristics that can be quantitatively analyzed to determine large-scale, aquifer hydraulic/storage-properties. The principal hydrologic properties determined from analyzing the constant-rate pumping drawdown responses at nearby and far-field wells include transmissivity, hydraulic conductivity, anisotropy, storativity, and specific yield. Of these hydrologic parameters, specific yield requires long-duration, constant-rate, pumping tests for quantitative resolution.
Normally, constant-rate pumping tests are conducted within a controlled setting without the presence of extraneous stresses on the aquifer system (e.g., pumping from surrounding extraction wells). This is to ensure that the monitored areal water-level impacts are associated solely with the designated pumped well. To accomplish this within the framework of an operational pump-and-treat system, however, special measures must be implemented. Primarily, this requires that pumping from surrounding extraction wells within the pump-and-treat system be maintained and controlled at a uniform rate to stabilize water-table responses immediately before and during the large-scale pumping test at the selected new extraction well location. This specific test example examines the possibility of conducting a controlled, large-scale, constant-rate pumping test at new ZP-1 extraction well 299-W15-225 within the operational 200-ZP-1 pump-and-treat system framework. To successfully conduct a large-scale, constant-rate, pumping test at new ZP-1 extraction well 299-W15-225 in the presence of surrounding, active test system pumping requires three basic elements: 1) the shutdown of pumping at all nearby ZP-1 extraction wells within 200 m surrounding new extraction well 299-W15-225, 2) a pre-large-scale pumping test (i.e., post-shutdown of nearby ZP-1 extraction wells) baseline monitoring period to assess near and far-field

A.2
water-table level stabilization, and 3) monitoring of the large-scale, constant-rate, pumping test response of new extraction well 299-W15-225 when it is added to the 200-ZP-1 operational system.
To achieve the identified large-scale, constant-rate, pumping test objectives, it is important that the analyzed well water-level responses observed during testing are attributed solely to the pumping test response imposed at new extraction well 299-W15-225 when it is added to the operational pump-and-treat system. To facilitate the test analysis process, the following testing activities are identified and discussed in the following sections. The general sequence of the identified aquifer test activities for conducting the large-scale pumping test at new ZP-1 extraction well 299-W15-225 is as follows:
Terminate pumping at nearby ZP-1 extraction wells (i.e., wells 299-W15-40, -W15-43, -W15-44, and -W15-765)
Maintain constant, uniform pumping at far-field surrounding ZP-1 extraction wells
Extend baseline monitoring period (~1 to 3 months) following shutdown of pumping at the identified nearby ZP-1 extraction wells
Initiate pumping at new ZP-1 extraction well 299-W15-225 (i.e., adding well 299-W15-225 to the 200-ZP-1 operational system)
Continue baseline water-level monitoring of the pumping effects imposed by extraction well 299-W15-225 (~1 to 3 months).
A discussion of identified test-element/phases is provided below.
A.1 Surrounding ZP-1 Extraction Wells
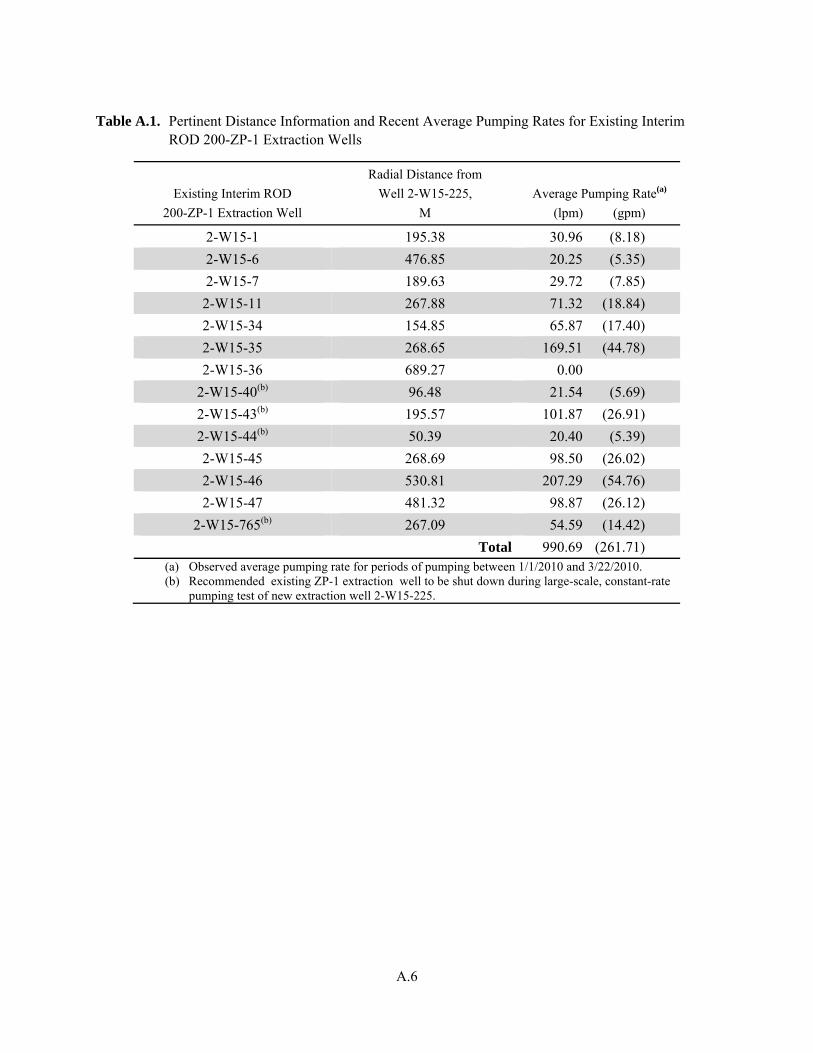
Current plans identify adding new extraction well 299-W15-225 during the summer of CY-2010 to the existing, surrounding 200-ZP-1 pump-and-treat extraction well system being operated to actively pump contaminated groundwater within the 200-ZP-1 OU for treatment. Adding the new extraction well 299-W15-225 will greatly expand the collective pumping by the pump-and-treat system and support DOE operational system goals established for FY-2010. The currently designed pumping rate for new extraction well 299-W15-225 is 870.6 lpm (230 gpm), which is only slightly less than the total composite pumping rate of 990.7 lpm (261.7 gpm) from the existing ROD ZP-1 pump-and-treat extraction wells observed during the first 3 months during Calendar Year 2010 (see Table A.1).
The opportunity exists when adding new ZP-1 extraction well 299-W15-225 to the 200-ZP-1 pump-and-treat system to conduct a large-scale, high-stress, constant-rate, pumping test using the new extraction well. To facilitate this test, it is recommended that the water table within the vicinity of the new extraction well 299-W15-225 and across the general WMA TX-TY area be stabilized before implementing the large-scale, constant-rate, pumping test. To accomplish this, it is recommended that the four nearby ROD-ZP-1 extraction wells (299-W15-40, -W15-43, W15-44, and W15-765) be shut down approximately 1 to 3 months before adding new extraction well 299-W15-225 to the operational system. The reason for shutting down four nearby ZP-1 extraction wells is two-fold: first, to help stabilize the water-table in the immediate-vicinity of new ZP-1 extraction well 299-W15-225, and second, to facilitate the analysis of large-scale, pumping test responses obtained from nearby wells 299-W15-40 and 299-W15-44. These two wells were the focus of the 3-day pumping test performed at the new ZP-1 extraction well 299-W15-225, as previously reported in Spane and Newcomer (2009b).

A.3
Baseline monitoring of well water levels should then be implemented to establish that sufficient water-table stabilization time has occurred before initiating the large-scale, constant-rate test. As indicated in Table A.1, the four nearby ZP-1 extraction wells are located within 270 m from extraction well 299-W15-225 and only represent a small fraction of the total groundwater pumped (i.e., 198.4 lpm; 52.4 gpm) within the existing ZP-1 pump-and-treat system. Although the more-distant ROD ZP-1 extraction well (and even more distant injection well) locations impose an areal hydrologic response that affects long-term, well water-level trends within the WMA TX-TY area, their collective impact is attenuated by their relative distance and dispersed pumping-center locations from the general WMA TX-TY study area (Figure A.1). Because their collective hydrologic impact is primarily associated with background water-table trends within the WMA TX-TY area, the remaining 10, more distant ROD ZP-1 extraction wells can be continuously pumped (i.e., maintained at their current pumping-rate levels) during the shutdown/baseline monitoring and start of the large-scale, constant-rate test. Maintaining pumping at these more distant ZP-1 extraction well locations will also help support CHPRC in meeting DOE pump-and-treat operational facility milestones for FY-2010.
A.2 Extended Baseline Monitoring
As previously demonstrated in Spane and Newcomer (2009a) for a smaller-scale, 3-day, constant-rate test involving extraction well 299-W15-225, the extended baseline monitoring period provides the means for minimizing and removing external hydrologic impacts during testing that are not related to constant-rate pumping at new well 299-W15-225. Specifically, the extended baseline monitoring period can be used to remove the extraneous effects from the shutdown of nearby ZP-1 extraction wells as well as the long-term effects of continuous pumping from more distant ZP-1 extraction wells from well water-level responses monitored within the general TX-TY region. Additionally, extended baseline monitoring provides a data set for establishing water-level barometric response characteristics, which can then be used to remove the extraneous impact of barometric pressure fluctuations on well water-level responses during hydrologic testing periods. This baseline monitoring requires that barometric pressure be measured concurrently with water-level responses at one or several of the monitor-well locations during the extended baseline and hydrologic testing period. It is recommended that a fixed (constant) 15- to 30-minute well water-level frequency be maintained for the duration of the extended baseline monitoring period. Water-level measurement frequencies during the active large-scale, constant-rate pumping test are described below. All extraction and most monitor wells listed in Table A.2 have water-levels that are monitored within existing Hanford Site automated or telemetry-based systems. Six of the monitor wells listed in Table A.2 (i.e., 299-W14-11, 299-W14-14, 299-W14-15, 299-W14-18, 299-W14-19, and 299-W15-763) are not currently part of an existing monitoring-well network. Three or four of these non-network wells should be selected for inclusion within the well network used for this aquifer test characterization. These to-be-selected monitor wells are recommended to have temporary water-level recording systems installed (i.e., pressure transducer/datalogger) and should be included during the extended baseline monitoring period.
The baseline monitoring period should be extended until well water-level responses stabilize and/or establish linear-trend relationships. Based on previous general observations of pump-and-treat hydrologic impacts on areal water-level response patterns within the general 200-West Area, the baseline monitoring period is expected to require ~1 to 3 months to establish stable, areal, water-table conditions.

A.4
A.3 Constant-Rate Pumping Test
Following stabilization of water-table trends with the general WMA TX-TY area, the large-scale, constant-rate pumping test can be initiated at new extraction well 299-W15-225 when it is added to the 200-ZP-1 pump-and-treat system. The designed operational pumping rate of 870.6 lpm (230 gpm) is expected to be maintained during the course of the large-scale pumping test. The initiation of the large-scale pumping test at well 299-W15-225 will produce an extensive, areal drawdown response that can be monitored and analyzed to provide large-scale aquifer property estimates and establish the radius-of-influence for this extraction well within the WMA TX-TY area (see Figure 3.1 through Figure 3.4). The recommended frequency for measuring water levels in the pumped well 299-W15-225 and the two nearest wells (299-W15-40 and –W15-44) will vary only during the first day of the constant-rate pumping test. These are presented in Table A.3. These listed measurement frequencies have been modified from frequencies initially recommended in Spane and Newcomer (2009a) for the 3-day FY-2009 test. These modifications are based on aquifer/well response behavior observed during the 3-day FY-2009 test. No changes to the existing monitoring frequencies are required for measuring water levels in far-field monitor wells (i.e., wells >100 m distance from extraction well 299-W15-225). Measurements collected every 10 to 15 minutes should be sufficient for these far-field well sites throughout the course of the constant-rate pumping test.
Monitoring of the large-scale pumping test will continue for as long as meaningful data (i.e., aquifer response characteristics) are collected during the course of the test and/or until changes in operational activities are required for the ZP-1 pump-and-treat system (e.g., maintenance requirements). After monitoring of the large-scale pumping test has been completed, the four nearby ZP-1 extraction wells (i.e., wells 299-W15-40, -W15-43, -W15-44, and -W15-765) that were initially shut down during the pre-test baseline monitoring period and during the large-scale pumping test can be restarted and returned to the active ZP-1 pump-and-treat system.
A.4 Other General Test Recommendations
1. All performance information (e.g., pumping rate records, in-well drawdown data) for interim ZP-1 extraction wells listed in Table A.1 should be collected and made available before and during starting the large-scale, constant-rate, pumping tests at new extraction well 299-W15-225.
2. All datalogger time systems and field clocks used during the hydrologic testing and baseline monitoring periods should be synchronized with official U.S. time (e.g. http://www.time.gov/timezone.cgi?Pacific/d/-8/java or http://wwp.pacific-standard-time.com/).
3. Depth-to-water measurements should be taken within all wells monitored near the beginning and end of the extended baseline monitoring period and near the end of the monitored large-scale, constant-rate, pumping test. Depth-to-water measurements should be accurately recorded with respect to time.
4. Recovery of well water-level data recorded on field datalogger and automated telemetry recording systems should be downloaded weekly during the extended baseline monitoring period and during the constant-rate pumping test.

A.5
5. Accurate and detailed field notes should be maintained during all phases of the extended baseline monitoring and hydrologic testing.
Figure A.1. Location Map Showing TX-TY Tank Farm and Surrounding Well Sites
A.6
Table A.1. Pertinent Distance Information and Recent Average Pumping Rates for Existing Interim
ROD 200-ZP-1 Extraction Wells
Existing Interim ROD
200-ZP-1 Extraction Well
Radial Distance from
Well 2-W15-225,
M Average Pumping Rate(a)
(lpm) (gpm)
2-W15-1 195.38 30.96 (8.18)
2-W15-6 476.85 20.25 (5.35)
2-W15-7 189.63 29.72 (7.85)
2-W15-11 267.88 71.32 (18.84)
2-W15-34 154.85 65.87 (17.40)
2-W15-35 268.65 169.51 (44.78)
2-W15-36 689.27 0.00
2-W15-40(b) 96.48 21.54 (5.69)
2-W15-43(b) 195.57 101.87 (26.91)
2-W15-44(b) 50.39 20.40 (5.39)
2-W15-45 268.69 98.50 (26.02)
2-W15-46 530.81 207.29 (54.76)
2-W15-47 481.32 98.87 (26.12)
2-W15-765(b) 267.09 54.59 (14.42)
Total 990.69 (261.71) (a) Observed average pumping rate for periods of pumping between 1/1/2010 and 3/22/2010. (b) Recommended existing ZP-1 extraction well to be shut down during large-scale, constant-rate
pumping test of new extraction well 2-W15-225.

A.7
Table A.2. Pertinent Survey and Completion Information for Waste Management Area (WMA) TX-TY Area Wells
T X-TY Tank Farm
Wells
NAD83 (91) Horizontal Coordinate
Survey
NAVD (88) Elevation
Survey Brass Cap,
m MSL
Well-Screen Elevation, m MSL
(Top–Bottom)
Radial Distance from Well 299-W15-225(a)
m North,
m East,
m
2-W10-4 136578.08 566734.64 205.26 147.33–130.56 475.47
2-W10-5 136474.83 566578.60 204.97 151.62–137.90 374.28
2-W10-26 136400.93 566843.40 204.67 138.50–127.80 346.23
2-W14-11 136287.62 566901.69 204.38 124.59–121.54 302.71
2-W14-14 136181.33 566898.39 204.62 138.47–127.79 251.68
2-W14-15 136231.04 566899.66 204.58 137.58–126.95 271.34
2-W14-18 136344.43 566897.44 204.26 137.78–127.11 336.31
2-W14-19 136135.32 566898.63 204.90 136.76–126.09 242.72
2-W15-1(b) 135942.94 566554.31 206.11 148.18–123.79 195.38
2-W15-7(b) 135920.20 566675.88 203.33 147.84–96.62 189.63
2-W15-11(b) 136000.72 566412.30 207.35 151.56–116.80 267.88
2-W15-34(b) 135960.44 566613.41 204.91 140.79–125.46 154.85
2-W15-35(b) 135853.07 566739.26 202.88 140.03–124.77 268.65
2-W15-40(b) 136205.29 566652.49 205.06 138.61–127.90 96.48
2-W15-41 136031.99 566757.58 202.79 136.96–132.38 126.36
2-W15-43(b) 136210.34 566490.12 206.78 137.76–127.09 195.57
2-W15-44(b) 136066.82 566685.02 204.17 138.24–127.57 50.39
2-W15-45(b) 135961.16 566432.94 206.79 135.70–120.44 268.69
2-W15-49 135972.91 566307.20 208.38 136.50–125.83 375.64
2-W15-225(c)
136108.93
566657.35
204.85
130.17–124.08 121.03–81.41
0.00
2-W15-763 136029.05 566809.18 202.18 137.62–126.93 171.56
2-W15-765(b) 136373.06 566697.02 204.51 137.44–126.77 267.09
(a) Calculated well distances are based on the final well coordinate survey report for well 2-W15-225; well distances results previously presented in Spane and Newcomer (2009) were based on interim survey values for well 2-W15-225 and differ generally by <0.1 m.
(b) Existing interim ROD 200-ZP-1 extraction well. (c) Well 2-W15-225 has a 3.05 m blank casing section separating the two indicated well-screen intervals.

A.8
Table A.3. Recommended Water-Level Measurement Frequencies During Large-Scale Pumping Test at Extraction Well 299-W15-225 and Nearby Monitor Wells 299-W15-40 and –W15-44
Extraction Well 299-W15-225 Nearby Monitor Wells(a)
Measurement Time Interval
Measurement Frequency
Measurement Time Interval
Measurement Frequency
0 to 1 minutes 1 to 2 seconds (b) 0 to 60 minutes 1 minute
1 to 3 minutes 5 seconds 1 to 2 hours 2 minutes
3 to 5 minutes 10 seconds 2 to 4 hours 5 minutes
5 to 10 minutes 15 seconds 4 to 8 hours 10 minutes
10 to 20 minutes 20 seconds >8 hours 15 minutes
20 to 30 minutes 30 seconds
30 to 60 minutes 1 minute
1 to 2 hours 2 minutes
2 to 4 hours 5 minutes
4 to 8 hours 10 minutes
>8 hours 15 minutes
(a) Nearby monitor wells: 299-W15-40 and 299-W15-44 (b) Dependent on data-acquisition/measurement-system capabilities.
PNNL-19695
Distr. 1
Distribution No. of Copies OFFSITE
No. of Copies ONSITE
1 S.S. Papadopulos & Assoc., Inc. 7944 Wisconsin Avenue Bethesda, MD, 20814 Tel: 301 718 8900 x258 Fax: 301 718 8909 Cell: 508 815 9886 email: [email protected] Attn: Matt Tonkin (S.S. Papadopulos)
5 CH2M HILL Plateau Remediation Company M. E. Byrnes R3-60 M. Ostrom T3-17 S. A. Simmons R3-60 L.C. Swanson R3-50 Amadeo Rossi R3-60
2 U.S. Department of Energy-Richland Operations J. G. Morse A6-38 A. C. Tortoso A6-38
5 Pacific Northwest National Laboratory F. A. Spane (2) K6-96 T. J. Gilmore K6-96 D. R. Newcomer K6-96 P. D. Thorne K6-96


