Large-scale simulations of gravity flow in block caving
W.R. Hancock Sustainable Minerals Institute, The University of Queensland, Australia
D.K. Weatherley Sustainable Minerals Institute, The University of Queensland, Australia
G.P. Chitombo Sustainable Minerals Institute, The University of Queensland, Australia
Abstract A parallel implementation of the discrete element method (DEM) capable of running on supercomputers has been used to study block caving flows at large scales. A short review of both physical and numerical models highlights the need for a well calibrated, physics based numerical model to supplant physical experimentation. The DEM code ESyS-Particle has been used in a validation study aimed at highlighting potential issues and limitations of such a model. Results show that ESyS-Particle is a suitable candidate for modelling caving flow and is within the range of reasonably expected flow regimes obtained from physical experiments using sand, crushed walnut shells and polypropylene pellets. Further to the validation study, in this paper we demonstrate the flexibility of numerical modelling by simulating both interactive draw and fines migration.
1 Introduction Understanding the gravity flow of broken rock through drawbells presents many challenges in both mine design and optimisation. Current practice in block and panel caving relies upon many empirical rules for determining such items of importance as the extraction level layout and scheduling of draw control. Many of these empiricisms have been generated from relatively small-scale physical models and from reported experience in the field. Although gaining significant popularity worldwide, flow in a block cave remains a poorly understood mechanism due to a lack of field data, exacerbated by the lack of available monitoring opportunities within the caved rock. Because of this, a number of caves in the past have experienced the onset of early dilution, fines migration and mud rushes. Physical models have given the industry a great deal of knowledge about flow behaviour, however, they can be difficult to construct and monitor and raise issues of model similitude (whether these smaller models exhibit the same behaviour as at the cave scale).
One plausible solution is a numerical approach to modelling flow behaviour using the DEM. By tracking the location and orientation of each particle in the system and then updating these positions through computing the physical moments due to collisional and frictional forces etc., one can model complex processes such as rock breakage, slope collapse and granular flow. With application to block caving, DEM provides benefits over continuum based approaches due to its ability to model large displacements and to simulate a distribution of fragment sizes.
The DEM is a computationally expensive numerical method placing severe limitations on the number of particles one may employ in simulations to ensure practical computation times. To relax the computational burden somewhat, ESyS-Particle implements the DEM using a parallel computing approach allowing simulations to be run on supercomputers. The ability to simulate more particles is crucial in some cases to reproduce natural phenomena, as the particle resolution determines the scale on which the processes act. The advantages of the DEM lie in the ability to predict new relationships that can be used in other numerical models to simulate cave-scale flow e.g. REBOP (Pierce, 2008) or continuum-based numerical models (Muhlhaus et al., 2001). DEM research in the past has shown the ability for the simulations to be predictive rather than prescriptive, however, the majority of the work has typically been centred in the near field area of flow close to the drawbell (Pierce et al., 2003). By using ESyS-Particle, the far field area of flow can be investigated, a region defined as over 100 particle diameters away from the drawpoint from which the majority of ore is recovered. Near field simulations can also be constructed using realistic geometries and particle size distribution showing dependencies that may not have existed for lower resolutions at the particle scale.
Large-scale simulations of gravity flow in block caving W.R Hancock et al.
554 Caving 2010, Perth, Australia
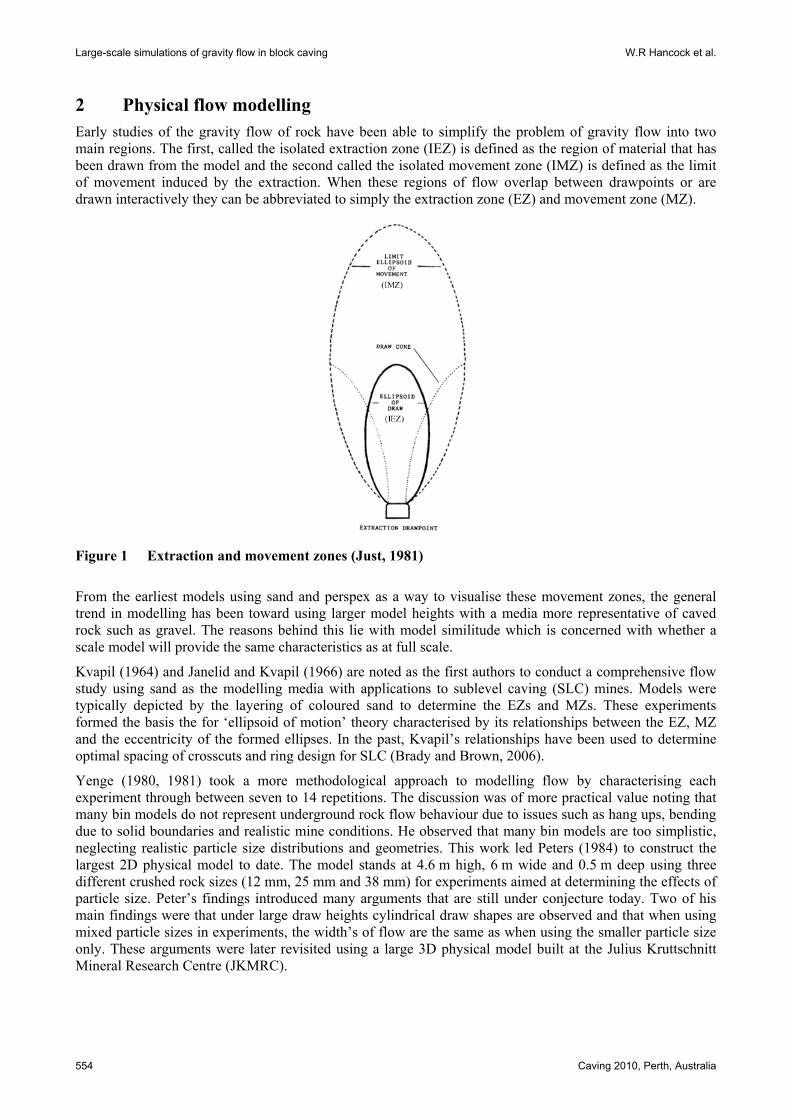
2 Physical flow modelling Early studies of the gravity flow of rock have been able to simplify the problem of gravity flow into two main regions. The first, called the isolated extraction zone (IEZ) is defined as the region of material that has been drawn from the model and the second called the isolated movement zone (IMZ) is defined as the limit of movement induced by the extraction. When these regions of flow overlap between drawpoints or are drawn interactively they can be abbreviated to simply the extraction zone (EZ) and movement zone (MZ).
Figure 1 Extraction and movement zones (Just, 1981)
From the earliest models using sand and perspex as a way to visualise these movement zones, the general trend in modelling has been toward using larger model heights with a media more representative of caved rock such as gravel. The reasons behind this lie with model similitude which is concerned with whether a scale model will provide the same characteristics as at full scale.
Kvapil (1964) and Janelid and Kvapil (1966) are noted as the first authors to conduct a comprehensive flow study using sand as the modelling media with applications to sublevel caving (SLC) mines. Models were typically depicted by the layering of coloured sand to determine the EZs and MZs. These experiments formed the basis the for ‘ellipsoid of motion’ theory characterised by its relationships between the EZ, MZ and the eccentricity of the formed ellipses. In the past, Kvapil’s relationships have been used to determine optimal spacing of crosscuts and ring design for SLC (Brady and Brown, 2006).
Yenge (1980, 1981) took a more methodological approach to modelling flow by characterising each experiment through between seven to 14 repetitions. The discussion was of more practical value noting that many bin models do not represent underground rock flow behaviour due to issues such as hang ups, bending due to solid boundaries and realistic mine conditions. He observed that many bin models are too simplistic, neglecting realistic particle size distributions and geometries. This work led Peters (1984) to construct the largest 2D physical model to date. The model stands at 4.6 m high, 6 m wide and 0.5 m deep using three different crushed rock sizes (12 mm, 25 mm and 38 mm) for experiments aimed at determining the effects of particle size. Peter’s findings introduced many arguments that are still under conjecture today. Two of his main findings were that under large draw heights cylindrical draw shapes are observed and that when using mixed particle sizes in experiments, the width’s of flow are the same as when using the smaller particle size only. These arguments were later revisited using a large 3D physical model built at the Julius Kruttschnitt Mineral Research Centre (JKMRC).
Draw Control
Caving 2010, Perth, Australia 555
Figure 2 JKMRC physical bin (Power, 2004)
The JKMRC model is still one of the largest 3D models built and was first used by Power (2004) to study isolated draw to characterise the effects of particle size. By using markers laid internally an EZ could be back calculated by analysing the time of exit of each marker. Because the model is in 3D there are no viewing points within so the only information about MZs can be gauged from surface subsidence. Castro (2006) later extended the model for use with MZ sensors constructed by attaching markers to extensometers through a thin piano wire encased in metal tubing. An array of markers were used so that one could gauge the limits of the MZ by noting times when the markers were triggered. Interactive draw was also investigated by Castro using between two and nine drawpoints. This was to verify the empirical evidence provided in the interactive theory of draw (Heslop and Laubscher, 1981) suggesting the limits of interaction to be 1.5 x the movement zone width of a drawpoint drawn in isolation. That is, drawpoints spaced over a distance of 1.5 x the MZ width would not interact and not cause mass flow to occur. Drawpoints spaced within this critical distance are able to interact with varying interaction heights defining the point at which MZs first intersect.
From this short review it can be shown that physical modelling has provided a platform for understanding caving flows, however, many questions have been raised of the validity of physical models due to similitude. The trend toward larger physical models has come to an end with heights of greater than 4 m considered impractical from a material logistics point of view. 3D models also provide an extra difficulty in the recording of measurements within the bin. It is thought the age of the physical model has passed and there is currently a need for a well calibrated numerical model to take its place (Guest, 2007).
3 Numerical flow modelling Numerical flow models can be split into two main categories, the first being models aimed at accurately representing the physics of flow for in depth studies and the second being the type aimed at emulating flow characteristics to speed up computation for use with life-of-mine (LOM) studies. Numerical models provide many advantages over their physical counterpart. Many aspects of physical modelling become trivial such as the ability to track material movement, change particle size distributions and modify drawbell geometries.
Large-scale simulations of gravity flow in block caving W.R Hancock et al.
556 Caving 2010, Perth, Australia
A well calibrated model of the first category will also be able to provide new knowledge just as in the physical modelling case.
A number of numerical models have been developed and applied to flow, the simplest of these models is the empirical model developed by Heslop and Laubscher (1981) which uses a mean particle size as an input for determining maximum draw width. The model, which has been implemented in PCBC was developed through the use of field observations and 3D physical modelling experiments aimed at studying interactive draw conducted at Shabanie Mine by Marano (1980). Empirical models typically require little time to simulate and PCBC is no exception. This makes them excellent for LOM simulations and schedule optimisation. However, empirical models are not able to provide any further understanding about flow processes.
Cellular Automata (CA) offer some advantages over the empirical method due to the ability to simulate block movement on a case by case basis. CA models split the domain into a discrete number of blocks which interact with each other depending on the properties of each neighbour. The CA method lends itself well to the implementation of void diffusion (Mullins, 1972), where voids introduced at the drawpoint propagate through the model shifting material downward as they diffuse upwards. The stochastic void diffusion process is able to model LOM simulations within hours on a desktop computer. For this ability to be a practical tool, many researchers have used CA for mine optimisation purposes (Alfaro and Saavedra, 2004; Calderon and Alfaro, 2004; Castro and Whiten, 2007). One drawback of the CA method is that it does require calibration of its EZs and MZs to some form of physical modelling or through the use of grade and metal comparisons from LOM studies.
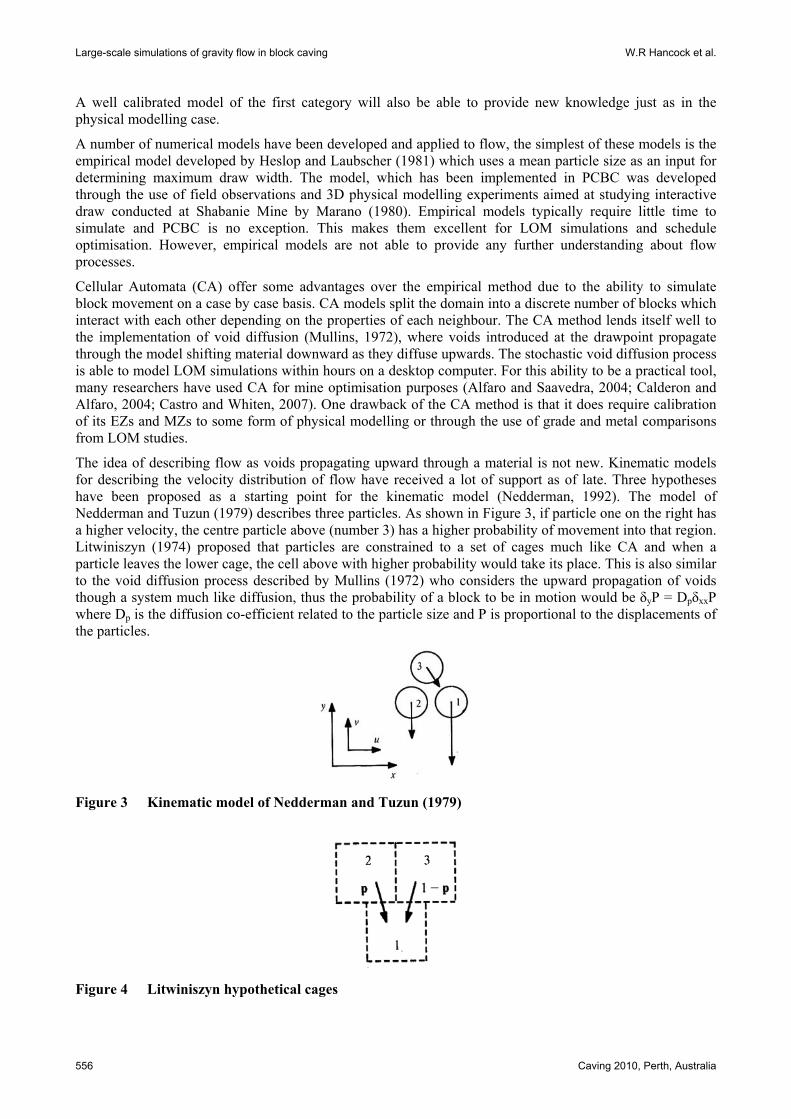
The idea of describing flow as voids propagating upward through a material is not new. Kinematic models for describing the velocity distribution of flow have received a lot of support as of late. Three hypotheses have been proposed as a starting point for the kinematic model (Nedderman, 1992). The model of Nedderman and Tuzun (1979) describes three particles. As shown in Figure 3, if particle one on the right has a higher velocity, the centre particle above (number 3) has a higher probability of movement into that region. Litwiniszyn (1974) proposed that particles are constrained to a set of cages much like CA and when a particle leaves the lower cage, the cell above with higher probability would take its place. This is also similar to the void diffusion process described by Mullins (1972) who considers the upward propagation of voids though a system much like diffusion, thus the probability of a block to be in motion would be δyP = DpδxxP where Dp is the diffusion co-efficient related to the particle size and P is proportional to the displacements of the particles.
Figure 3 Kinematic model of Nedderman and Tuzun (1979)
Figure 4 Litwiniszyn hypothetical cages
Draw Control
Caving 2010, Perth, Australia 557
Interestingly, all three hypotheses arrive at the same governing differential equation (the diffusion equation), although Nedderman solves for probability of movement into the velocity field, Litwiniszyn solves for the probability of upper particles within a cage to move into a lower cage and Mullins solves for the diffusion of void concentrations. The kinematic model provides a mathematical solution to describe flow, linking particle size with flow widths. However, the kinematic model does not take account of the drawbell geometry or particle properties such as friction angle and shape. The most promising numerical model that can link all these physical attributes is the DEM.
The DEM, first applied by Cundall and Strack (1979) to rock mechanics in the early 1970s provides a way to simulate granular material by modelling each particle as a separate entity and integrating the equations of motion at each time step. The DEM is inherently computationally expensive, however, by incorporating physics into the model, it can provide good insight into system behaviour, unachievable by other computational methods (Castro, 2006; Herrmann and Luding, 1998; Martin et al., 2003; Potyondy and Cundall, 2004). To model a caving set-up, DEM particles can be thought of as a mix of boulders, gravel and fines that comprise the column of broken ore above the drawpoints. The initial set-up of a block caving simulation will usually consist of settling a random packing of particles in the drawpoint geometry and then opening the drawpoints and allowing the material to flow out. The effects of geometry, particle size and parameters can then be observed by tracking particle positions at each time step. The DEM offers a unique way to visualise models on a per particle basis allowing engineers to better understand the system at hand.
A DEM model developed by HCItasca, PFC3D has been used in the past with some success, giving rise to an explanation of flow based around changes in porosity. A study by Pierce et al. (2003) using a quarter geometry of a single drawpoint shows the numerical model to be in good agreement with the mechanisms demonstrated by physical models. In the experiments, particles of average radius 0.35 m were allowed to flow through an opening of radius 7 m within a model 42 m high, 19.25 m wide and 19.25 m deep. By applying a velocity profile to particles just below this opening to represent a drawbell, the need to model an actual drawbell was eliminated thus reducing computation time somewhat.
Figure 5 PFC3D flow model (Lorig and Cundall, 2000)
The bulk of results presented in the paper relate to only MZs (due to computation time limitations). Conclusions from these experiments show that the size of the MZ is affected by both particle shape and size, however, the eccentricity of the MZ is not affected by particle size. This is in good agreement with the results of Peters (1984) 2D physical model, however, both Power (2004) and Castro (2006) have shown this to be otherwise using their 3D physical models. With the PFC3D model only being 42 m high, further testing at greater heights is required for a more critical examination. This is an area where a supercomputer implementation of the DEM such as ESyS-Particle is able to contribute to the field.
Large-scale simulations of gravity flow in block caving W.R Hancock et al.
558 Caving 2010, Perth, Australia
Inter-particle percolation (fines migration) of caved rock underdraw has also been modelled using PFC3D (Pierce, 2004). In these tests, particles smaller than the minimum interstices between larger particles (1/5 of the maximum particle radius) were placed on top of a typical quarter symmetry drawbell set-up. The model was modified to use larger particles (0.75 m radius) and filled to a height of 20 m. These tests show that percolation is likely to occur in caved rock underdraw and that a likely source of the percolation is through shear zones along the MZ boundary. A number of tests were also used to validate the model against experimental studies conducted by Bridgwater et al. (1978) using a box containing large particles and fines subjected to shear. From these tests, equations were developed for use in a large scale simulator, called REBOP that has been developed by HCItasca as a way to overcome the inherently slow nature of DEM simulations (Lorig and Cundall, 2000).
By using rules for mass balance between layers calibrated to both DEM modelling and the experimental work at the JKMRC, REBOP is currently one of the few tools used to simulate models with a large number of drawpoints using physical parameters. Friction angle, mean fragment diameter and porosity change are examples of some of the inputs that can be used to tune flow shapes. Unfortunately in practice, the input parameters are difficult to measure and this is where numerical modelling using the DEM has helped in the past. Rather than describing MZ growth through fit functions, REBOP calculates and assigns growth based upon mechanistic laws. REBOP tracks material movement by the use of markers to which a mass is assigned. As the markers (which are free to move in any spatial direction) exit the model, EZ shapes may be calculated. REBOP encompasses three main mechanisms of MZ growth; a porosity jump and the collapse and erosion mechanism described by Lorig and Cundall (2000). Because REBOP does not make any assumptions about flow shapes this gives it a distinct advantage over other codes such as PCBC. REBOP allows the shape of MZs to evolve continuously throughout the life of mine. REBOP does not account for physical interactions between layers, only the mass balance. Because of this it cannot be used as a quantitative predictive model. Rather because flow shapes evolve over time one can use REBOP to develop a better understanding of factors such as changes in schedule, particle size distributions and flow geometries.
In summary, numerical models are of two flavours. Those that can actively provide new knowledge on flow behaviour and those that are emulating flow behaviours in order to speed up computation time. For modelling on the mine scale where runtimes are of most importance there is no option but to choose the latter. Unfortunately, each mine site poses new problems whether it be from the current trend toward super caves, different stress fields or fines. The only way to incorporate new facets of flow that may be produced is through the use of numerical models that aim to simulate the physics of the situation. This work provides quantitative flow relationships to improve the emulator type models, which are then able to provide end data predictions such as drawpoint grade and available resources in life-of-mine simulations.
This two pronged approach has been the crux of the research method in this field historically, where physical models were used as the calibration tool. Progression from smaller 2D physical models through to larger 3D models has now reached scaling limitations. Prevailing stress fields are difficult to model, as is observing MZ in large 3D models. It is hoped that by using DEM to supplant physical modelling research, this approach can continue for the foreseeable future. Through the use of supercomputers, ESyS-Particle, a parallel implementation of the DEM, is able to extend current modelling capacity to allow larger more realistic models to be simulated. Through a recent validation study, the following results demonstrate the ability of ESyS-Particle to calibrate against previous work and also highlight the potential benefits of numerical modelling where it can be used to study facets of flow in more detail.
4 Results and discussion The following results show four different models aimed at validating ESyS-Particle for use with caving studies. The first is a validation study using ESyS-Particle to replicate a PFC3D quarter symmetry model (Pierce et al., 2003). The second set-up demonstrates the capacity of ESyS-Particle to simulate larger model heights by using a full symmetry replica of the physical model constructed at the JKMRC (Power, 2004). The third model shown is aimed at verifying the well known empirical relation as described by Heslop and Laubscher (1981) relating drawpoint spacing to interaction and finally we finish with a demonstration of fines modelling showing mechanisms for percolation and fines pocket formation.
Draw Control
Caving 2010, Perth, Australia 559
4.1 Validation of ESyS-Particle DEM flow models In order to first validate ESyS-Particle for use in further studies a validation against previous numerical modelling results was required. Pierce et al. (2003) provided a small PFC3D flow model which could be used for this purpose. The model, measuring 40 × 17.5 × 17.5 m using particles in the order of 0.35 m mean radius was reconstructed with ESyS-Particle. During reconstruction two major differences were identified; a difference between the rough sphere contact model of ESyS-Particle and the clump logic of PFC3D and also a difference in drawbell geometries where the PFC3D model lacked a drawbell in order to save computation time. The model set-up for the ESyS-Particle simulations is given in Figure 6 and a comparison of MZ results with those of PFC3D (Pierce et al., 2003) is shown in Figure 7.
Figure 6 ESyS-Particle quarter symmetry model
Figure 7 ESyS-Particle comparison with PFC3D (ESyS-Particle as grey particles)
Large-scale simulations of gravity flow in block caving W.R Hancock et al.
560 Caving 2010, Perth, Australia
Figure 8 Quarter symmetry model variability, n = 20
To quantify the statistical variability of MZ results, we conducted 20 simulations with different random packing realisations. The mean and standard deviation of MZ widths are shown in Figure 8. On the basis of these results, we conclude that ESyS-Particle is a suitable implementation of the DEM, able to reproduce the results of previous DEM flow studies.
4.2 Comparison with the kinematic and 3D physical models One limitation of previous numerical modelling work in this area was the computational constraint that limited model size, in the case of Pierce et al. (2003) this was 42 m high. By extending the ESyS-Particle model up to more realistic caving heights (over 100 m), a comparison against the physical results of Castro (2006) could be conducted. The Castro model used a physical bin with dimensions 3.5 × 2.1 × 2.4 m built at the JKMRC for flow studies with the addition of movement markers which could track MZ shape evolution. A comparison between the numerical model and the physical model showed ESyS-Particle flow widths to be of order two times larger than the Castro results (Figure 9). The rough sphere model of ESyS-Particle, although being a good representation of the quarter symmetry numerical studies, was not sufficient to reproduce the material characteristics needed to best represent the physical tests. In order to account for this an ESyS-Particle cluster was developed by bonding two spheres together (similar to the clump logic of PFC3D). By doing this the friction angle of the material was increased and the growth rate of the MZ width was limited to that of the same ratio as in the physical tests. However, there still exists a discrepancy between the starting width of both models. Further research has been proposed investigating the source of this discrepancy by using more realistic block caving geometries and similar extraction methods rather than relying on gravity as the means of removing ore from the simulation.
Draw Control
Caving 2010, Perth, Australia 561
Figure 9 Flow width comparisons to the Castro (2006) physical model
Whilst the lack of correspondence with the 3D physical models is disappointing, it should be noted that ESyS-Particle shows a direct fit to the growth rates predicted by the kinematic model developed by Nedderman (1995). The characteristic equation linking flow widths to heights normalised by particle diameters is shown to be W = 3.42√H where W is the width of the MZ in terms of particle diameters and H is the height. The kinematic model has been shown to be good fit for studies using sand, gravel and crushed walnut shells over a large range of model heights by Pierce (2008). Calibration to this model suggests that in fact it is the Castro data set which differs from previous experimental work (Figure 10). The reason for this has been hypothesised to be due to a significant amount of hang ups observed during the model runs although this has yet to be proven.
Figure 10 Nedderman comparison
Large-scale simulations of gravity flow in block caving W.R Hancock et al.
562 Caving 2010, Perth, Australia
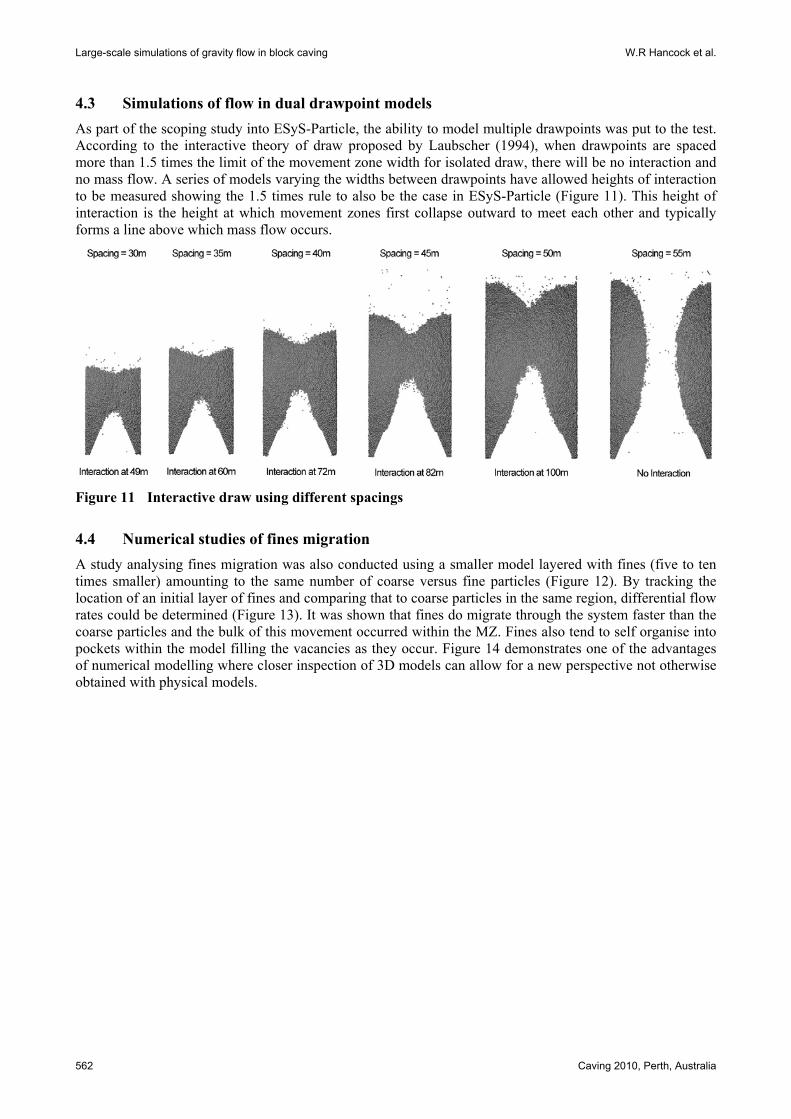
4.3 Simulations of flow in dual drawpoint models As part of the scoping study into ESyS-Particle, the ability to model multiple drawpoints was put to the test. According to the interactive theory of draw proposed by Laubscher (1994), when drawpoints are spaced more than 1.5 times the limit of the movement zone width for isolated draw, there will be no interaction and no mass flow. A series of models varying the widths between drawpoints have allowed heights of interaction to be measured showing the 1.5 times rule to also be the case in ESyS-Particle (Figure 11). This height of interaction is the height at which movement zones first collapse outward to meet each other and typically forms a line above which mass flow occurs.
Figure 11 Interactive draw using different spacings
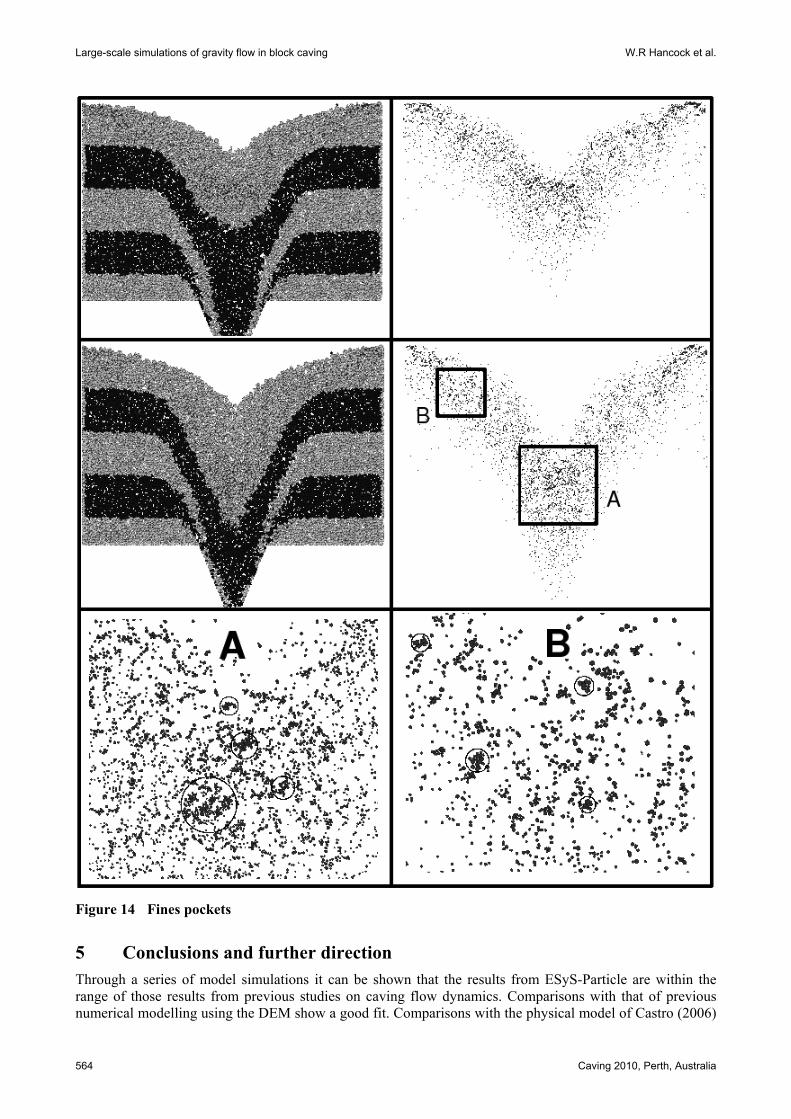
4.4 Numerical studies of fines migration A study analysing fines migration was also conducted using a smaller model layered with fines (five to ten times smaller) amounting to the same number of coarse versus fine particles (Figure 12). By tracking the location of an initial layer of fines and comparing that to coarse particles in the same region, differential flow rates could be determined (Figure 13). It was shown that fines do migrate through the system faster than the coarse particles and the bulk of this movement occurred within the MZ. Fines also tend to self organise into pockets within the model filling the vacancies as they occur. Figure 14 demonstrates one of the advantages of numerical modelling where closer inspection of 3D models can allow for a new perspective not otherwise obtained with physical models.
Draw Control
Caving 2010, Perth, Australia 563
Figure 12 Fines layered model
Figure 13 Fines preferential movement
Large-scale simulations of gravity flow in block caving W.R Hancock et al.
564 Caving 2010, Perth, Australia
Figure 14 Fines pockets
5 Conclusions and further direction Through a series of model simulations it can be shown that the results from ESyS-Particle are within the range of those results from previous studies on caving flow dynamics. Comparisons with that of previous numerical modelling using the DEM show a good fit. Comparisons with the physical model of Castro (2006)
Draw Control
Caving 2010, Perth, Australia 565
reveal however, that although the MZ growth rates are similar, the initial width of flow is almost double in ESyS-Particle regardless of the similar geometry. One difference noted between the models is the draw control. ESyS-Particle uses gravitational free flow to extract material whereas in the physical test, material was allowed to rill before being extracted through a vibratory feeder system. Many hang ups were observed during this extraction procedure and it has been hypothesised that the hang ups are a contributing factor toward the narrow draw. In order to address this issue, a draw control strategy is proposed for future DEM flow models that will cause material to rill out of the drawpoints before being extracted (thereby mimicking the rilling process of the physical model).
The research to be conducted with the calibrated DEM model will aim to expand knowledge of the fundamental processes occurring within block caves with particular emphasis upon flow dynamics in the presence of a broad range of fragment sizes with realistic extraction level geometries (Figure 15). It is postulated that caving flows may be significantly more disturbed than suggested from physical tests and past numerical simulations that utilised a relatively narrow range of fragment sizes. We also aim to utilise the DEM model to further study migration of fine material and its impact upon drawpoint recoveries, compaction of bulk material and the influence of high overburden stresses in caves with column heights in excess of 500 m.
Figure 15 Drawbell footprint for future studies
Acknowledgements
The authors gratefully acknowledge Rio Tinto Pty Ltd for their financial support for the majority of research presented here. The authors also wish to acknowledge the Mass Mining Technologies research project (MMT2) for subsequent financial assistance to continue this research. The cooperation and comments by A. van As, G. van Hout and G. Just have greatly improved the quality of this research. ESyS-Particle was developed with funding support from the Australian Computational Earth Systems Simulator Major National Research Facility (ACcESS MNRF) and the AuScope National Collaborative Research Infrastructure Strategy. Numerical simulations were conducted on the ESSCC SGI Altix ICE supercomputer funded by the Queensland State Government, The University of Queensland and ACcESS MNRF.
References Alfaro, M. and Saavedra, J. (2004) Predictive models for gravitational flow, in Proceedings MassMin 2004,
A. Karzulovic and M. Alvaro (eds), 22–25 August, Santiago, Chile, Instituto de Ingenieros de Chile, Santiago, pp. 179–184.
Brady, B.H.G. and Brown, E.T. (2006) Rock Mechanics, Springer. Bridgwater, J., Cooke, M. and Scott, A. (1978) Interparticle Percolation: Equipment development and mean percolation
velocities, Chemical engineering research and design, Vol. 56a, pp. 157–167.
Large-scale simulations of gravity flow in block caving W.R Hancock et al.
566 Caving 2010, Perth, Australia
Calderon, C. and Alfaro, M. (2004) Computational model for simulation and visualization of gravitational flow, in Proceedings MassMin 2004, A. Karzulovic and M. Alvaro (eds), 22–25 August, Santiago, Chile, Instituto de Ingenieros de Chile, Santiago, CD only, Chapter 05-04, pp. 185–188.
Castro, R. (2006) A study of isolated draw zones in block caving mines, University of Queensland. Castro, R.L. and Whiten, W.J. (2007) A new cellular automaton to model gravity flow in block caving based on
physical modelling observations, in Proceedings 33rd International Symposium on the Application of Computers and Operations Research in the Minerals Industry Conference, APCOM 2007, E.J. Magri (ed), 24–27 April, Santiago, Chile, pp. 233–241.
Cundall, P. and Strack, O. (1979) A discrete numerical model for granular assemblies, Geotechnique, Vol. 29, pp. 47–65.
Guest, A. (2007) The Difference Between Interaction and Interactive Draw, in Proceedings 1st International Symposium on Block and Sub-Level Caving, Cave Mining, Cape Town, South Africa.
Herrmann, H.J. and Luding, S. (1998) Modeling granular media on the computer, Contimuum Mechanics Thermodyn, Vol. 10, pp. 189–231.
Heslop, G.T. and Laubscher, D.H. (1981) Draw Control in Caving Operations on Southern African Chrysotile Asbestos Mines, In Design and Operation of Caving and Sublevel Stoping Mines, D. Stewart (ed), Society of Mining Engineers.
Janelid, I. and Kvapil, R. (1966) Sublevel Caving, International Journal of Rock Mechanics and Mining Sciences, Vol. 3, pp. 129–153.
Just, G. (1981) The significance of material flow in mine design and production, Design and Operation of Caving and Sublevel Stoping Mines, New York, Society of Mining Engineers.
Kvapil, R. (1964) Gravity flow of granular materials in hoppers and bins, International Journal of Rock Mechanics and Mining Sciences, Vol. 2, pp. 35–41.
Laubscher, D.H. (1994) Cave mining – the state of the art, Journal of the South African Institute of Mining and Metallurgy, pp. 279–293.
Litwiniszyn, J. (1974) Stochastic Methods in Mechanics of Granular Bodies, Springer Verlag. Lorig, L. and Cundall, P. (2000) A rapid gravity flow simulator, Final Report, International Caving Study, E.T. Brown
(ed), Brisbane, JKMRC and Itasca Consulting Group, Inc. Marano, G. (1980) The interaction between adjoining drawpoints in free flowing materials and its application to mining,
Chamber of Mines Journal, Vol. 22, pp. 25–32. Martin, C.L., Bouvard, D. and Shima, S. (2003) Study of particle rearrangement during powder compaction by the
Discrete Element Method, Journal of the Mechanics and Physics of Solids, Vol. 51, pp. 667–693. Muhlhaus, H., Sakaguchi, H., Moresi, L. and Fahey, M. (2001) Discrete and continuum modelling of granular material,
in Discrete and Continuous Modelling of Cohesive Frictional Materials, P. Vermeer, S. Diebels, W. Ehlers, H. Herrmann, S. Luding and E. Ramm (eds), Lecture notes in physics, Springer-Verlag, Berlin, pp. 185–204.
Mullins, W.W. (1972) Stochastic Theory of Particle Flow under Gravity, Journal of Applied Physics, Vol. 43, pp. 665–678.
Nedderman, R.M. (1992) Statics and Kinematics of Granular Materials, Cambridge. Nedderman, R.M. (1995) The use of the kinematic model to predict the development of the stagnant zone boundary in
the batch discharge of a bunker, Chemical Engineering Science, Vol. 50, pp. 959–965. Nedderman, R.M. and Tuzun, U. (1979) A kinematic model for the flow of granular materials, Powder Technology,
Vol. 22, pp. 243–253. Peters, D. (1984) Physical modelling of the Draw Behaviour of Broken Rock in Caving, Quarterly of the Colorado
School of Mines, Vol. 79. Pierce, M. (2004) PFC3D modelling of inter-particle percolation in caved rock under draw, in Numerical Modeling in
Micromechanics via Particle Methods, in Proceedings 2nd International PFC Symposium, Y. Shimizu, R. Hart, P. Cundall (eds), 28–29 October 2004, Kyoto, Japan, Routledge, pp. 149–156.
Pierce, M. (2008) Flow Research and REBOP Development: Block/Panel Caving, MMT Meeting, Stockholm. Pierce, M., Cundall, P., Van Hout, G. and Lorig, L. (2003) PFC3D Modeling of Caved Rock Under Draw, in Numerical
Modeling in Micromechanics via Particle Methods, in Proceedings 1st International PFC Symposium, H. Konietzky (ed), 6–8 November 2002, Gelsenkirchen, Germany, Balkema, pp. 211–218.
Potyondy, D.O. and Cundall, P.A. (2004) A bonded-particle model for rock, International Journal of Rock Mechanics and Mining Sciences, Vol. 41, pp. 1329–1364.
Power, G. (2004) Modelling Granular Flow in Caving Mines: Large Scale Physical Models and Full Scale Experiments, University of Queensland.
Yenge, L. (1980) Analysis of Bulk Flow of Materials under Gravity Caving Proceedings: Part I Sublevel caving in relation to flow in bins and bunkers, Quarterly of the Colorado School of Mines, Vol. 75.
Yenge, L. (1981) Analysis of Bulk Flow of Materials under Gravity Caving Proceedings: Part 2 Theoretical and physical modelling of gravity flow of broken rock, Quarterly of the Colorado School of Mines, Vol. 76.