Large upper tropospheric ozone enhancements above midlatitude North America during summer: In situ evidence from the IONS and MOZAIC ozone measurement network O. R. Cooper, 1,2 A. Stohl, 3 M. Trainer, 4 A. M. Thompson, 5 J. C. Witte, 6 S. J. Oltmans, 4 G. Morris, 7 K. E. Pickering, 8 J. H. Crawford, 9 G. Chen, 9 R. C. Cohen, 10 T. H. Bertram, 10 P. Wooldridge, 10 A. Perring, 10 W. H. Brune, 5 J. Merrill, 11 J. L. Moody, 12 D. Tarasick, 13 P. Ne ´de ´lec, 14 G. Forbes, 15 M. J. Newchurch, 16 F. J. Schmidlin, 17 B. J. Johnson, 4 S. Turquety, 18 S. L. Baughcum, 19 X. Ren, 5 F. C. Fehsenfeld, 4 J. F. Meagher, 4 N. Spichtinger, 20 C. C. Brown, 9 S. A. McKeen, 1,2 I. S. McDermid, 21 and T. Leblanc 21 Received 16 March 2006; revised 25 August 2006; accepted 21 September 2006; published 12 December 2006. [1] The most extensive set of free tropospheric ozone measurements ever compiled across midlatitude North America was measured with daily ozonesondes, commercial aircraft and a lidar at 14 sites during July-August 2004. The model estimated stratospheric ozone was subtracted from all profiles, leaving a tropospheric residual ozone. On average the upper troposphere above midlatitude eastern North America contained 15 ppbv more tropospheric residual ozone than the more polluted layer between the surface and 2 km above sea level. Lowest ozone values in the upper troposphere were found above the two upwind sites in California. The upper troposphere above midlatitude eastern North America contained 16 ppbv more tropospheric residual ozone than the upper troposphere above three upwind sites, with the greatest enhancement above Houston, Texas, at 24 ppbv. Upper tropospheric CO measurements above east Texas show no statistically significant enhancement compared to west coast measurements, arguing against a strong influence from fresh surface anthropogenic emissions to the upper troposphere above Texas where the ozone enhancement is greatest. Vertical mixing of ozone from the boundary layer to the upper troposphere can only account for 2 ppbv of the 16 ppbv ozone enhancement above eastern North America; therefore the remaining 14 ppbv must be the result of in situ ozone production. The transport of NO x tracers from North American anthropogenic, biogenic, biomass burning, and lightning emissions was simulated for the upper troposphere of North America with a particle dispersion model. Additional box model calculations suggest the 24 ppbv ozone enhancement above Houston can be produced over a 10 day period from oxidation reactions of lightning NO x and background mixing ratios of CO and CH 4 . Overall, we estimate that 69–84% (11–13 ppbv) of the JOURNAL OF GEOPHYSICAL RESEARCH, VOL. 111, D24S05, doi:10.1029/2006JD007306, 2006 Click Here for Full Articl e 1 Cooperative Institute for Research in Environmental Sciences, University of Colorado, Boulder, Colorado, USA. 2 Also at NOAA Earth System Research Laboratory, Boulder, Colorado, USA. 3 Norwegian Institute for Air Research, Kjeller, Norway. 4 NOAA Earth System Research Laboratory, Boulder, Colorado, USA. 5 Department of Meteorology, Pennsylvania State University, University Park, Pennsylvania, USA. 6 Science Systems and Applications, Inc., NASA Goddard Space Flight Center, Greenbelt, Maryland, USA. 7 Department of Physics and Astronomy, Valparaiso University, Valparaiso, Indiana, USA. 8 Laboratory for Atmospheres, NASA Goddard Space Flight Center, Greenbelt, Maryland, USA. 9 NASA Langley Research Center, Hampton, Virginia, USA. 10 Department of Chemistry and Department of Earth and Planetary Science, University of California, Berkeley, California, USA. 11 Graduate School of Oceanography, University of Rhode Island, Narragansett, Rhode Island, USA. Copyright 2006 by the American Geophysical Union. 0148-0227/06/2006JD007306$09.00 D24S05 12 Department of Environmental Sciences, University of Virginia, Charlottesville, Virginia, USA. 13 Experimental Studies Research Division, Meteorological Service of Canada, Environment Canada, Downsview, Ontario, Canada. 14 Laboratoire d’Aerologie, Centre National de la Recherche Scientifique, Observatoire Midi-Pyrenees, Toulouse, France. 15 Meteorological Service of Canada, Sable Island, Nova Scotia, Canada. 16 Atmospheric Science Department, University of Alabama, Huntsville, Alabama, USA. 17 Wallops Flight Facility, NASA Goddard Space Flight Center, Wallops Island, Virginia, USA. 18 Service d’Ae ´ronomie, Institut Pierre-Simon Laplace, Universite ´ Pierre et Marie Curie, Paris, France. 19 Boeing Company, Seattle, Washington, USA. 20 Department of Ecology, Technical University of Munich, Freising- Weihenstephan, Germany. 21 Table Mountain Facility, Jet Propulsion Laboratory, California Institute of Technology, Wrightwood, California, USA. 1 of 19
Transcript
Large upper tropospheric ozone enhancements above midlatitude
North America during summer: In situ evidence from the IONS and
MOZAIC ozone measurement network
O. R. Cooper,1,2 A. Stohl,3 M. Trainer,4 A. M. Thompson,5 J. C. Witte,6 S. J. Oltmans,4
G. Morris,7 K. E. Pickering,8 J. H. Crawford,9 G. Chen,9 R. C. Cohen,10 T. H. Bertram,10
P. Wooldridge,10 A. Perring,10 W. H. Brune,5 J. Merrill,11 J. L. Moody,12 D. Tarasick,13
P. Nedelec,14 G. Forbes,15 M. J. Newchurch,16 F. J. Schmidlin,17 B. J. Johnson,4
S. Turquety,18 S. L. Baughcum,19 X. Ren,5 F. C. Fehsenfeld,4 J. F. Meagher,4
N. Spichtinger,20 C. C. Brown,9 S. A. McKeen,1,2 I. S. McDermid,21 and T. Leblanc21
Received 16 March 2006; revised 25 August 2006; accepted 21 September 2006; published 12 December 2006.
[1] The most extensive set of free tropospheric ozone measurements ever compiled acrossmidlatitude North America was measured with daily ozonesondes, commercial aircraftand a lidar at 14 sites during July-August 2004. The model estimated stratospheric ozonewas subtracted from all profiles, leaving a tropospheric residual ozone. On average theupper troposphere above midlatitude eastern North America contained 15 ppbv moretropospheric residual ozone than the more polluted layer between the surface and 2 kmabove sea level. Lowest ozone values in the upper troposphere were found above the twoupwind sites in California. The upper troposphere above midlatitude eastern NorthAmerica contained 16 ppbv more tropospheric residual ozone than the upper troposphereabove three upwind sites, with the greatest enhancement above Houston, Texas, at 24 ppbv.Upper tropospheric CO measurements above east Texas show no statisticallysignificant enhancement compared to west coast measurements, arguing against a stronginfluence from fresh surface anthropogenic emissions to the upper troposphere aboveTexas where the ozone enhancement is greatest. Vertical mixing of ozone from theboundary layer to the upper troposphere can only account for 2 ppbv of the 16 ppbv ozoneenhancement above eastern North America; therefore the remaining 14 ppbv must be theresult of in situ ozone production. The transport of NOx tracers from North Americananthropogenic, biogenic, biomass burning, and lightning emissions was simulated for theupper troposphere of North America with a particle dispersion model. Additional boxmodel calculations suggest the 24 ppbv ozone enhancement above Houston can beproduced over a 10 day period from oxidation reactions of lightning NOx and backgroundmixing ratios of CO and CH4. Overall, we estimate that 69–84% (11–13 ppbv) of the
JOURNAL OF GEOPHYSICAL RESEARCH, VOL. 111, D24S05, doi:10.1029/2006JD007306, 2006ClickHere
for
FullArticle
1Cooperative Institute for Research in Environmental Sciences,University of Colorado, Boulder, Colorado, USA.
2Also at NOAA Earth System Research Laboratory, Boulder, Colorado,USA.
3Norwegian Institute for Air Research, Kjeller, Norway.4NOAA Earth System Research Laboratory, Boulder, Colorado, USA.5Department of Meteorology, Pennsylvania State University, University
Park, Pennsylvania, USA.6Science Systems and Applications, Inc., NASA Goddard Space Flight
Center, Greenbelt, Maryland, USA.7Department of Physics and Astronomy, Valparaiso University,
Valparaiso, Indiana, USA.8Laboratory for Atmospheres, NASA Goddard Space Flight Center,
Greenbelt, Maryland, USA.9NASA Langley Research Center, Hampton, Virginia, USA.10Department of Chemistry and Department of Earth and Planetary
Science, University of California, Berkeley, California, USA.11Graduate School of Oceanography, University of Rhode Island,
Narragansett, Rhode Island, USA.
Copyright 2006 by the American Geophysical Union.0148-0227/06/2006JD007306$09.00
D24S05
12Department of Environmental Sciences, University of Virginia,Charlottesville, Virginia, USA.
13Experimental Studies Research Division, Meteorological Service ofCanada, Environment Canada, Downsview, Ontario, Canada.
14Laboratoire d’Aerologie, Centre National de la Recherche Scientifique,Observatoire Midi-Pyrenees, Toulouse, France.
15Meteorological Service of Canada, Sable Island, Nova Scotia,Canada.
16Atmospheric Science Department, University of Alabama, Huntsville,Alabama, USA.
17Wallops Flight Facility, NASA Goddard Space Flight Center, WallopsIsland, Virginia, USA.
18Service d’Aeronomie, Institut Pierre-Simon Laplace, Universite Pierreet Marie Curie, Paris, France.
19Boeing Company, Seattle, Washington, USA.20Department of Ecology, Technical University of Munich, Freising-
Weihenstephan, Germany.21Table Mountain Facility, Jet Propulsion Laboratory, California
Institute of Technology, Wrightwood, California, USA.
16 ppbv ozone enhancement above eastern North America is due to in situ ozoneproduction from lightning NOx with the remainder due to transport of ozone from thesurface or in situ ozone production from other sources of NOx.
Citation: Cooper, O. R., et al. (2006), Large upper tropospheric ozone enhancements above midlatitude North America during
summer: In situ evidence from the IONS and MOZAIC ozone measurement network, J. Geophys. Res., 111, D24S05,
doi:10.1029/2006JD007306.
1. Introduction
[2] Ozone is a key trace gas for both the chemistry andradiative balance of the troposphere [IntergovernmentalPanel on Climate Change, 2001], and as it is the principalpollutant associated with photochemical smog its presencein the lower troposphere has large implications for issues ofair quality. Currently, international research programs suchas the SPARC Project (Stratospheric Processes and theirRole in Climate) and IGAC (International Global Atmo-spheric Chemistry) are focusing research on the dynamicsand composition of the upper troposphere and lower strato-sphere because of this region’s influence on global climatechange, with ozone once again a trace gas of primaryinterest.[3] Chemical transport model (CTM) studies indicate that
North American emissions have a major impact on netglobal tropospheric ozone production [Li et al., 2002].However, verifying CTM estimates of the North Americanozone budget is difficult because of the limited number ofprofiling sites across the continent. Long-term ozonesondeprofiling has been conducted at six locations in Canada, butall are at relatively high latitudes [Tarasick et al., 2005], andat just two sites in the USA: Boulder, Colorado and WallopsIsland, Virginia. However, the National Oceanic and Atmo-spheric Administration (NOAA) initiated the TrinidadHead, California and Huntsville, Alabama sites in the late1990s [Newchurch et al., 2003]. Data coverage increased in2004 with the addition of the NOAA site at Narragansett,Rhode Island, and four new Canadian sites along the USA/Canada border. However, large data gaps still exist in thesouthwestern and south-central USA and the sampling rateof once per week means it will take several years to build aNorth American ozone climatology.[4] To finally measure the daily ozone distribution across
midlatitude North America during the most photochemicallyactive part of the year, NASA, NOAA, Environment Can-ada, and several US universities pooled resources during the1 July to 15 August 2004 ICARTT (International Consor-tium for Atmospheric Research on Transport and Transfor-mation) study to launch ozonesondes from several sitesacross the eastern USA and Canada under the IONS(INTEX Ozonesonde Network Study) program (see over-view of IONS by A. M. Thompson et al. (IONS-04 (INTEXOzonesonde Network Study, 2004): Perspective on sum-mertime UT/LS (upper troposphere/lower stratosphere)ozone over northeastern North America, submitted to Jour-nal of Geophysical Research, 2006, hereinafter referred toas Thompson et al., submitted manuscript, 2006)). Addi-tional ozone profiles across eastern North America wereobtained from five instrumented commercial aircraft that flybetween North America and Europe under the EuropeanMOZAIC program. To increase the sample size, MOZAICprofiles were combined with ozonesonde profiles from
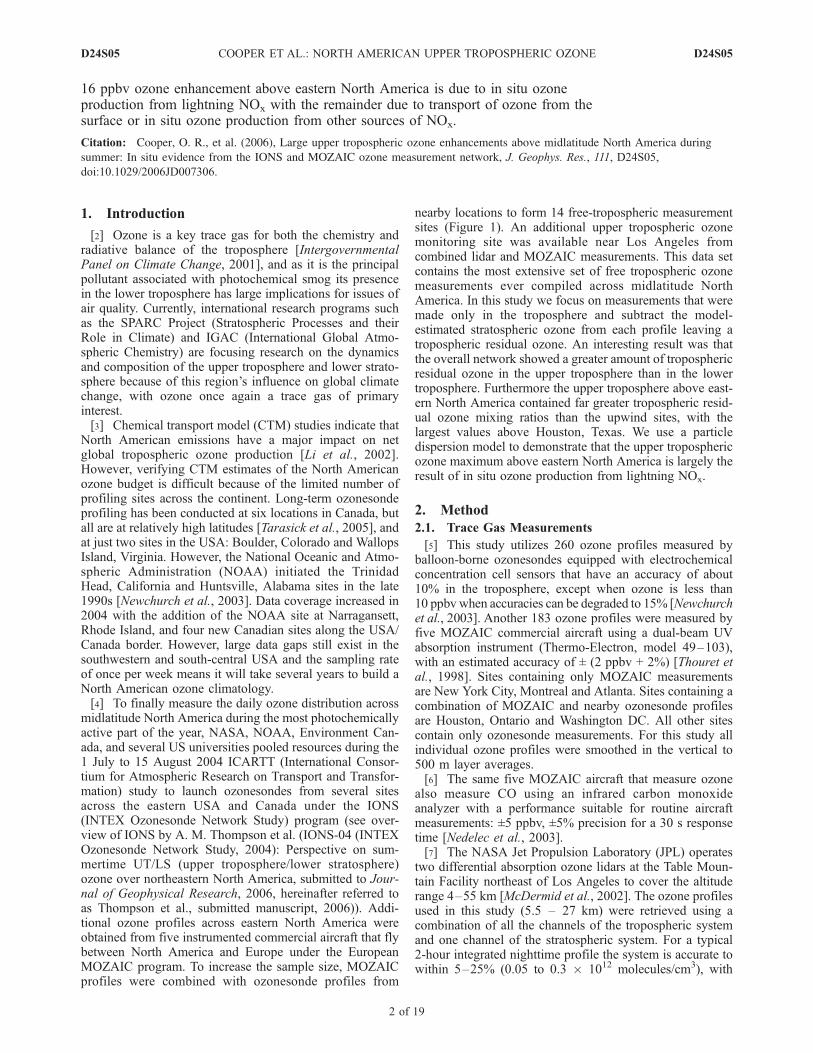
nearby locations to form 14 free-tropospheric measurementsites (Figure 1). An additional upper tropospheric ozonemonitoring site was available near Los Angeles fromcombined lidar and MOZAIC measurements. This data setcontains the most extensive set of free tropospheric ozonemeasurements ever compiled across midlatitude NorthAmerica. In this study we focus on measurements that weremade only in the troposphere and subtract the model-estimated stratospheric ozone from each profile leaving atropospheric residual ozone. An interesting result was thatthe overall network showed a greater amount of troposphericresidual ozone in the upper troposphere than in the lowertroposphere. Furthermore the upper troposphere above east-ern North America contained far greater tropospheric resid-ual ozone mixing ratios than the upwind sites, with thelargest values above Houston, Texas. We use a particledispersion model to demonstrate that the upper troposphericozone maximum above eastern North America is largely theresult of in situ ozone production from lightning NOx.
2. Method
2.1. Trace Gas Measurements
[5] This study utilizes 260 ozone profiles measured byballoon-borne ozonesondes equipped with electrochemicalconcentration cell sensors that have an accuracy of about10% in the troposphere, except when ozone is less than10 ppbv when accuracies can be degraded to 15% [Newchurchet al., 2003]. Another 183 ozone profiles were measured byfive MOZAIC commercial aircraft using a dual-beam UVabsorption instrument (Thermo-Electron, model 49–103),with an estimated accuracy of ± (2 ppbv + 2%) [Thouret etal., 1998]. Sites containing only MOZAIC measurementsare New York City, Montreal and Atlanta. Sites containing acombination of MOZAIC and nearby ozonesonde profilesare Houston, Ontario and Washington DC. All other sitescontain only ozonesonde measurements. For this study allindividual ozone profiles were smoothed in the vertical to500 m layer averages.[6] The same five MOZAIC aircraft that measure ozone
also measure CO using an infrared carbon monoxideanalyzer with a performance suitable for routine aircraftmeasurements: ±5 ppbv, ±5% precision for a 30 s responsetime [Nedelec et al., 2003].[7] The NASA Jet Propulsion Laboratory (JPL) operates
two differential absorption ozone lidars at the Table Moun-tain Facility northeast of Los Angeles to cover the altituderange 4–55 km [McDermid et al., 2002]. The ozone profilesused in this study (5.5 – 27 km) were retrieved using acombination of all the channels of the tropospheric systemand one channel of the stratospheric system. For a typical2-hour integrated nighttime profile the system is accurate towithin 5–25% (0.05 to 0.3 � 1012 molecules/cm3), with
D24S05 COOPER ET AL.: NORTH AMERICAN UPPER TROPOSPHERIC OZONE
2 of 19
D24S05
the largest deviations occurring when the free troposphericozone mixing ratios are very low.[8] Nitrogen Dioxide (NO2) mixing ratios were measured
directly aboard the NASA DC-8 by Laser Induced Fluores-cence (LIF) [Thornton et al., 2000; T. H. Bertram et al.,Convection and the age of air in the upper troposphere,manuscript in preparation, 2006, hereinafter referred toas Bertram et al., manuscript in preparation, 2006] on all18 flights during ICARTT above North America and thewestern North Atlantic Ocean. Briefly, NO2 is excited at585 nm using a Nd:YAG pumped tunable dye laser and theresulting red-shifted fluorescence is imaged onto a photo-multiplier tube following optical and temporal filtering. Asupersonic expansion is used in the detection region toincrease the population of NO2 in the excited rotationalstate, leading to a factor-of-thirty enhancement in signal[Cleary et al., 2002]. The detection sensitivity of thisinstrument is 0.8 ppt/min at S/N = 2. The uncertainty inthe instrument zero is less than 1 ppt.[9] NO was measured directly aboard the NASA DC-8 by
a commercial NO-NOx analyzer (Model TEI 42C) on thebasis of the chemiluminescence technique. The instrumentwas run in NO single mode only, and an in situ NOcalibration system was used for frequent NO span andbackground checks. The detection limit of this instrumentis about 50 pptv with 1 min integration time.[10] CO on the NOAA WP-3D research aircraft was
measured by vacuum ultraviolet resonance fluorescencewith an uncertainty of ±5%. Ozone was measured on theWP-3D with an uncertainty of ±(0.1 ppbv + 3%).[11] A whole air sampler on board the DC-8 collected air
samples in electropolished stainless steel canisters everyfew minutes during each flight. The canisters were shippedto the University of California, Irvine for analysis. AnHP6890 gas chromatogram analyzer with a flame ionizationdetector was used to measure i-pentane and other hydro-
carbons [Colman et al., 2001]. Absolute accuracy was betterthan 10% at 1s, with a precision of 3%.[12] Throughout this manuscript the ozone and CO dis-
tributions are compared between sites at 500 m intervalsbetween the surface and the tropopause. We use the Kruskal-Wallace nonparametric one-way analysis of variance testto determine if the trace gas distributions between twogiven sites have statistically significantly differences at the95% confidence interval.
2.2. FLEXPART Simulations
[13] The global transport and dispersion of North Amer-ican NOx emissions from biomass burning, biogenic, light-ning, aircraft and surface anthropogenic sources wassimulated with the FLEXPART Lagrangian particle disper-sion model [Stohl et al., 1998, 2005], which calculates thetrajectories of a multitude of particles. The model wasdriven by ECMWF wind fields with a temporal resolutionof 3 hours (analyses at 0000, 0600, 1200, 1800 UTC; 3 hourforecasts at 0300, 0900, 1500, 2100 UTC), horizontalresolution of 1� � 1�, and 60 vertical levels. NestedECMWF windfields of 0.36� resolution were used for thearea between 108�W–18�E and 18–72�N covering themajor anthropogenic and lightning emission regions ofNorth America. Both data sets have 16 model layers below2 km, with 10 layers below 700 m. These data setsapproximately represent the full spectral resolution of theECMWF model at that time. Particles are transported bothby the resolved winds and parameterized subgrid motions.To account for convection, FLEXPART uses the parame-terization scheme of Emanuel and Zivkovic-Rothman[1999], which is implemented at each 15-min model timestep, and is intended to describe all types of convection,including the deep convection related to the lightning overthe Gulf of Mexico. The scheme was tested by Forster et al.[2006] and found to produce convective precipitationamounts that are in relatively good agreement with obser-vations both in the tropics and extratropics, reducing thepositive tropical bias of the online convection scheme usedat ECMWF. It also improves the agreement of FLEXPARTsimulations with airborne tracer measurements compared tosimulations without the convection parameterization.[14] FLEXPART is used to simulate the transport of NOx
emissions from biomass burning, biogenic, lightning, air-craft and surface anthropogenic sources. In this study thetracers are run in forward mode as passive tracers that arenot removed by wet or dry deposition processes, neither arethe NOx tracers converted to oxidized species. The tracersare tracked for a variety of time periods including 1, 2, 5 10and 20 days since emission. For example a lightning NOx
tracer that is tracked for 10 days is referred to as a 10-daylightning NOx tracer. To simulate the oxidation of NOx inthe upper troposphere a 2-day e-folding lifetime (as deter-mined from box model analysis) is separately applied to theNOx tracers from all emission sources.[15] The stratospheric ozone contribution to each profile
was estimated using the FLEXPART retroplume technique[Stohl et al., 2003], as described by Cooper et al. [2005a].Briefly, 40,000 back trajectory particles were released fromeach 500 m layer of each ozone profile. The number ofparticles that entered the stratosphere over the previous20 days was tabulated along with their potential vorticity
Figure 1. Locations of the fourteen ozone profile sites in2004: T, Trinidad Head; L, Table Mountain/MOZAIC; H,Houston; V, Huntsville; A, Atlanta; W, Wallops Island;D, Washington DC; Y, New York City; N, Narragansett; B,research vessel Ronald H. Brown; S, Sable Island; M,Montreal; O, Ontario; and P, Pellston. The locations of thetropical portions of the MOZAIC flights to and fromCaracas (C) during 1999–2004 are also shown.
D24S05 COOPER ET AL.: NORTH AMERICAN UPPER TROPOSPHERIC OZONE
3 of 19
D24S05
(PV) values. The mass of each particle was scaled by theO3/PV ratio of the lower stratosphere, as determined fromthe IONS ozonesondes and ECMWF analyses from theICARTT study period, to estimate the amount of strato-spheric ozone carried by each particle. To account for thefact that the PV value for a given particle changes over timethis calculation was performed for each day of the 20-daytransport time, with the average calculated ozone value over20 days considered representative of the particle. Thiscalculation also accounted for the fact that the O3/PV ratiodecreases throughout the summer because of the seasonaldecrease of ozone in the lowermost stratosphere. Thesevalues were integrated over all 40,000 particles in a givenretroplume to yield the quantity of stratospheric ozoneinfluencing a particular 500 m layer of an ozone profile.To verify the modeled results, the ratio of modeled/mea-sured ozone values was calculated for all IONS ozonesondeprofiles for each 500 m layer in the stratosphere (PV >2).The geometric mean of all the point-by-point ratios ofmodeled/measured ozone was near unity (0.97), indicatinglittle overall bias in the model. The standard error of themodeled stratospheric ozone compared to measured ozonewas a factor of 1.5.
2.3. Lightning NOx Emissions
[16] The lightning NOx emissions in this study are notproduced by a grid-scale model parameterization scheme.Instead, lightning NOx production was simulated withFLEXPART above North America and the surroundingwaters according to the exact times and locations of eachcloud-to-ground (CG) lightning flash observed by lightningdetection networks. To the best of our knowledge this is themost accurate simulation of lightning NOx emissions everconducted for all of North America. CG flashes weredetected over the continental USA by the National Lightning
Detection Network (NLDN), with a detection efficiency(DE) better than 90% [Grogan, 2004]. For regions between21 and 60�N, but outside of the continental USA, CGflashes were detected with the experimental long-rangelightning detection network (LRLDN). DE is 60–80% at60�N and 40–60% at 21�N and increases with proximity tothe USA (K. Cummins, Vaisala-Thunderstorm, personalcommunication, 2005). For regions south of 21�N CG andIC flashes were quantified according to a seasonally anddiurnally varying climatology based on 5 years of data fromthe polar orbiting Lightning Imaging Sensor (LIS) andOptical Transient Detector (OTD) instruments [Christianet al., 2003].[17] To account for the drop-off in detection efficiency
south of the USA all NOx emissions from LRLDN flashesin this region were scaled by the inverse of the DE.Furthermore we scaled the NOx emissions per CG flash toaccount for the intracloud (IC) flashes not detected by theNLDN and LRLDN [Ridley et al., 2005]. Monthly griddedIC:CG ratios calculated for the continental United Stateswere applied to the NLDN data [Boccippio et al., 2001].Monthly mean IC:CG values typically range between 1 and10 for individual 0.5� � 0.5� grid cells, with an averagevalue of 4.2 above the continental USA during the studyperiod of 21 June through 15 August. This average value of4.2 was applied to the LRLDN data.[18] We selected a lightning NOx emission rate of 6.4 kg N
flash�1 on the basis of the analysis of North Americanthunderstorms by DeCaria et al. [2005]. Between 21 Juneand 15 August 2004, a single FLEXPART trajectory particlewas released at the exact time and location of the 32 millionCG lightning flashes detected by the NLDN and LRLDN.Another 15million trajectory particles were released from theregion of the lightning climatology (representing 30 millionIC and CG flashes). Computer memory limitations onlypermitted the release of one FLEXPART particle per flash.To account for the fact that lightning NOx emissions occurmainly in the upper troposphere but over a wide range ofaltitudes [Pickering et al., 1998; DeCaria et al., 2005], theparticles were released between the tropopause and 6 kmabove sea level according to a normal distribution whichwas allowed to slide up and down with the height of thetropopause. No particles were released below 6 km and themode of the release height was between 10 and 11 km.Upon release the particles were permitted to move verticallyaccording to the model vertical winds and the convectionscheme.[19] The distribution of the lightning N emissions is
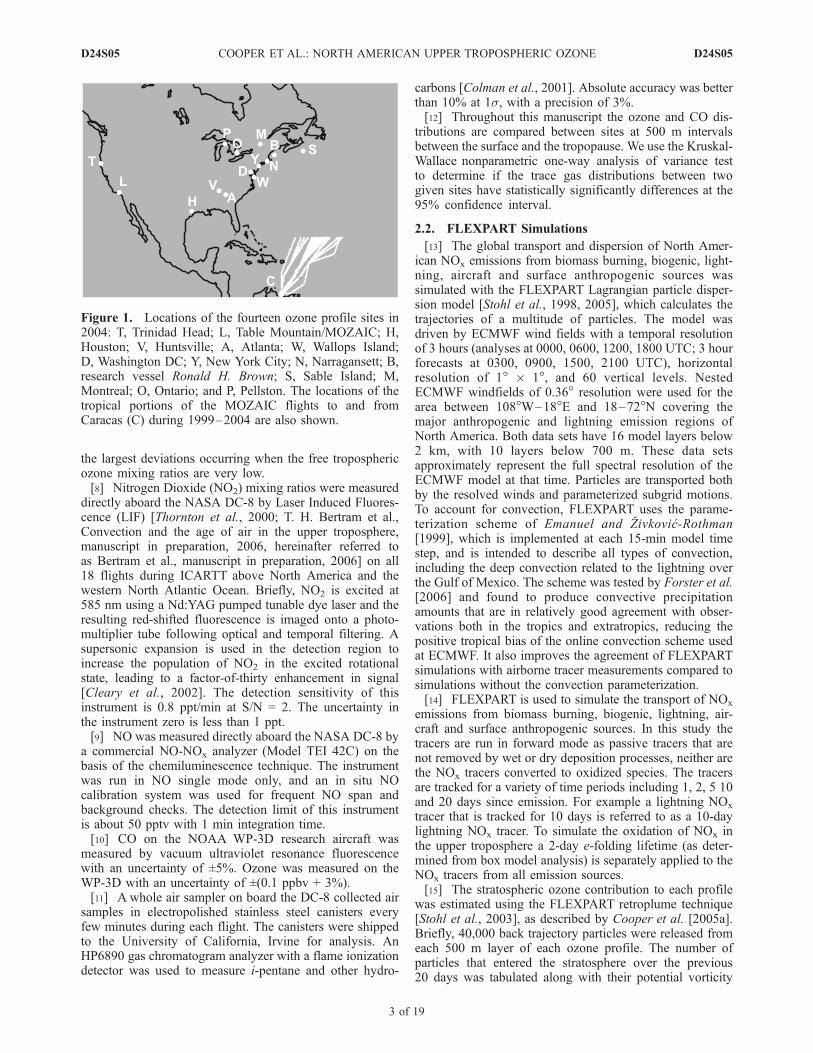
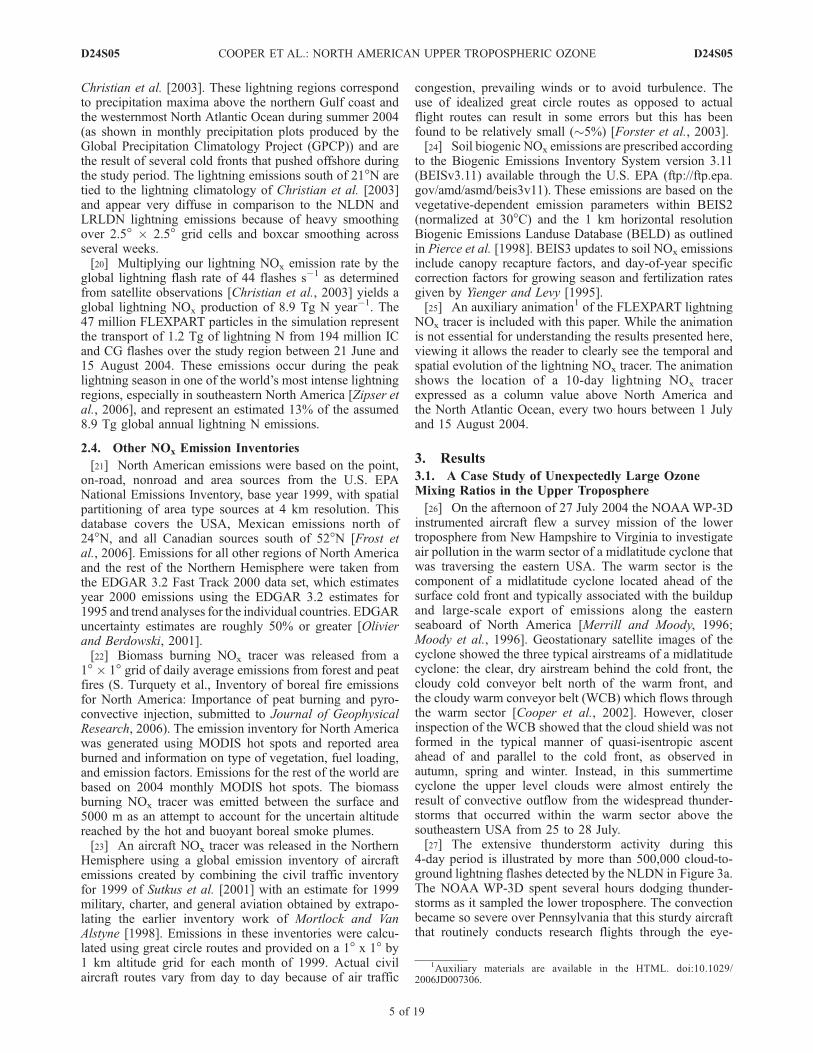
shown in Figure 2. The major regions for lightning emis-sions are located (1) along the Sierra Madre Mountains ofnorthwestern Mexico, (2) above Cuba, and (3) a bandstretching along the northern coast of the Gulf of Mexico,extending across Florida and into the westernmost NorthAtlantic Ocean off the southeastern USA. Lightning is alsoprevalent across the USA, east of the Rocky Mountains.These lightning regions generally correspond to the mostintense regions of lightning depicted by lightning climatol-ogies [Christian et al., 2003; Orville et al., 2002]. Theexception is that the lightning along the northern coast ofthe Gulf of Mexico extends further south than shown byChristian et al. [2003], and the lightning is relatively moreintense off the coast of the southeastern USA than shown by
Figure 2. Cumulative lightning N emissions from CG andIC flashes between 21 June and 15 August 2004.
D24S05 COOPER ET AL.: NORTH AMERICAN UPPER TROPOSPHERIC OZONE
4 of 19
D24S05
Christian et al. [2003]. These lightning regions correspondto precipitation maxima above the northern Gulf coast andthe westernmost North Atlantic Ocean during summer 2004(as shown in monthly precipitation plots produced by theGlobal Precipitation Climatology Project (GPCP)) and arethe result of several cold fronts that pushed offshore duringthe study period. The lightning emissions south of 21�N aretied to the lightning climatology of Christian et al. [2003]and appear very diffuse in comparison to the NLDN andLRLDN lightning emissions because of heavy smoothingover 2.5� � 2.5� grid cells and boxcar smoothing acrossseveral weeks.[20] Multiplying our lightning NOx emission rate by the
global lightning flash rate of 44 flashes s�1 as determinedfrom satellite observations [Christian et al., 2003] yields aglobal lightning NOx production of 8.9 Tg N year�1. The47 million FLEXPART particles in the simulation representthe transport of 1.2 Tg of lightning N from 194 million ICand CG flashes over the study region between 21 June and15 August 2004. These emissions occur during the peaklightning season in one of the world’s most intense lightningregions, especially in southeastern North America [Zipser etal., 2006], and represent an estimated 13% of the assumed8.9 Tg global annual lightning N emissions.
2.4. Other NOx Emission Inventories
[21] North American emissions were based on the point,on-road, nonroad and area sources from the U.S. EPANational Emissions Inventory, base year 1999, with spatialpartitioning of area type sources at 4 km resolution. Thisdatabase covers the USA, Mexican emissions north of24�N, and all Canadian sources south of 52�N [Frost etal., 2006]. Emissions for all other regions of North Americaand the rest of the Northern Hemisphere were taken fromthe EDGAR 3.2 Fast Track 2000 data set, which estimatesyear 2000 emissions using the EDGAR 3.2 estimates for1995 and trend analyses for the individual countries. EDGARuncertainty estimates are roughly 50% or greater [Olivierand Berdowski, 2001].[22] Biomass burning NOx tracer was released from a
1� � 1� grid of daily average emissions from forest and peatfires (S. Turquety et al., Inventory of boreal fire emissionsfor North America: Importance of peat burning and pyro-convective injection, submitted to Journal of GeophysicalResearch, 2006). The emission inventory for North Americawas generated using MODIS hot spots and reported areaburned and information on type of vegetation, fuel loading,and emission factors. Emissions for the rest of the world arebased on 2004 monthly MODIS hot spots. The biomassburning NOx tracer was emitted between the surface and5000 m as an attempt to account for the uncertain altitudereached by the hot and buoyant boreal smoke plumes.[23] An aircraft NOx tracer was released in the Northern
Hemisphere using a global emission inventory of aircraftemissions created by combining the civil traffic inventoryfor 1999 of Sutkus et al. [2001] with an estimate for 1999military, charter, and general aviation obtained by extrapo-lating the earlier inventory work of Mortlock and VanAlstyne [1998]. Emissions in these inventories were calcu-lated using great circle routes and provided on a 1� x 1� by1 km altitude grid for each month of 1999. Actual civilaircraft routes vary from day to day because of air traffic
congestion, prevailing winds or to avoid turbulence. Theuse of idealized great circle routes as opposed to actualflight routes can result in some errors but this has beenfound to be relatively small (�5%) [Forster et al., 2003].[24] Soil biogenic NOx emissions are prescribed according
to the Biogenic Emissions Inventory System version 3.11(BEISv3.11) available through the U.S. EPA (ftp://ftp.epa.gov/amd/asmd/beis3v11). These emissions are based on thevegetative-dependent emission parameters within BEIS2(normalized at 30�C) and the 1 km horizontal resolutionBiogenic Emissions Landuse Database (BELD) as outlinedin Pierce et al. [1998]. BEIS3 updates to soil NOx emissionsinclude canopy recapture factors, and day-of-year specificcorrection factors for growing season and fertilization ratesgiven by Yienger and Levy [1995].[25] An auxiliary animation1 of the FLEXPART lightning
NOx tracer is included with this paper. While the animationis not essential for understanding the results presented here,viewing it allows the reader to clearly see the temporal andspatial evolution of the lightning NOx tracer. The animationshows the location of a 10-day lightning NOx tracerexpressed as a column value above North America andthe North Atlantic Ocean, every two hours between 1 Julyand 15 August 2004.
3. Results
3.1. A Case Study of Unexpectedly Large OzoneMixing Ratios in the Upper Troposphere
[26] On the afternoon of 27 July 2004 the NOAAWP-3Dinstrumented aircraft flew a survey mission of the lowertroposphere from New Hampshire to Virginia to investigateair pollution in the warm sector of a midlatitude cyclone thatwas traversing the eastern USA. The warm sector is thecomponent of a midlatitude cyclone located ahead of thesurface cold front and typically associated with the buildupand large-scale export of emissions along the easternseaboard of North America [Merrill and Moody, 1996;Moody et al., 1996]. Geostationary satellite images of thecyclone showed the three typical airstreams of a midlatitudecyclone: the clear, dry airstream behind the cold front, thecloudy cold conveyor belt north of the warm front, andthe cloudy warm conveyor belt (WCB) which flows throughthe warm sector [Cooper et al., 2002]. However, closerinspection of the WCB showed that the cloud shield was notformed in the typical manner of quasi-isentropic ascentahead of and parallel to the cold front, as observed inautumn, spring and winter. Instead, in this summertimecyclone the upper level clouds were almost entirely theresult of convective outflow from the widespread thunder-storms that occurred within the warm sector above thesoutheastern USA from 25 to 28 July.[27] The extensive thunderstorm activity during this
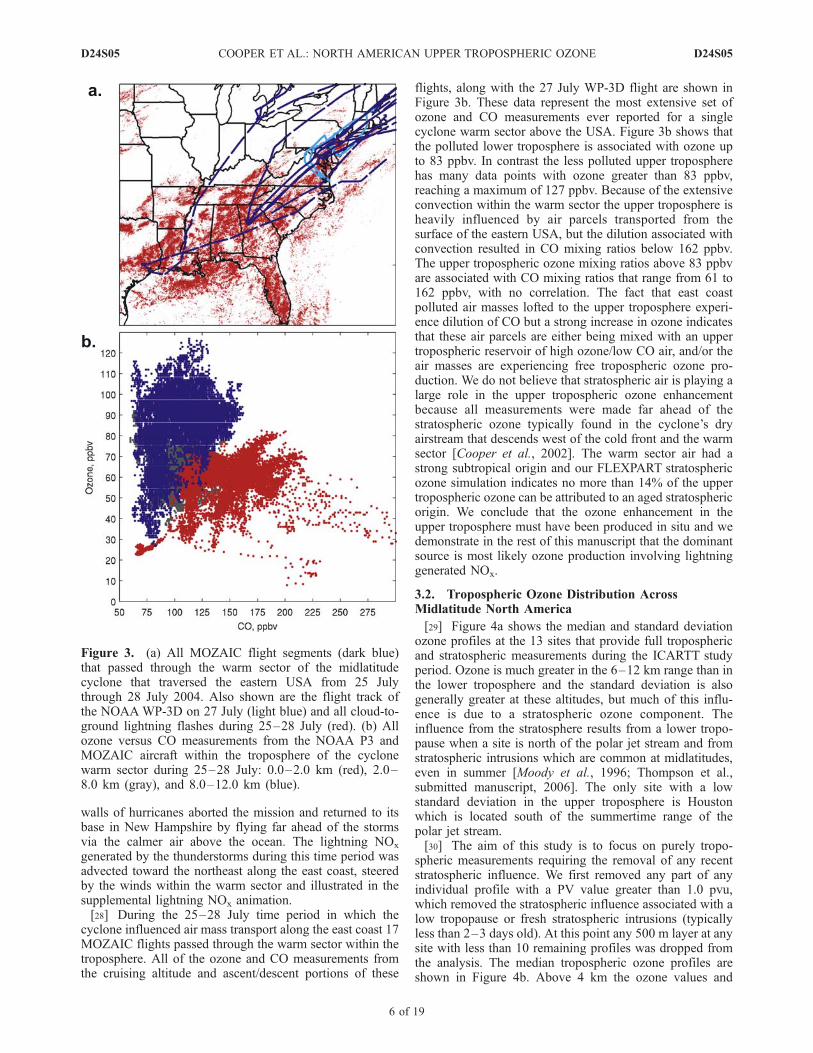
4-day period is illustrated by more than 500,000 cloud-to-ground lightning flashes detected by the NLDN in Figure 3a.The NOAA WP-3D spent several hours dodging thunder-storms as it sampled the lower troposphere. The convectionbecame so severe over Pennsylvania that this sturdy aircraftthat routinely conducts research flights through the eye-
1Auxiliary materials are available in the HTML. doi:10.1029/2006JD007306.
D24S05 COOPER ET AL.: NORTH AMERICAN UPPER TROPOSPHERIC OZONE
5 of 19
D24S05
walls of hurricanes aborted the mission and returned to itsbase in New Hampshire by flying far ahead of the stormsvia the calmer air above the ocean. The lightning NOx
generated by the thunderstorms during this time period wasadvected toward the northeast along the east coast, steeredby the winds within the warm sector and illustrated in thesupplemental lightning NOx animation.[28] During the 25–28 July time period in which the
cyclone influenced air mass transport along the east coast 17MOZAIC flights passed through the warm sector within thetroposphere. All of the ozone and CO measurements fromthe cruising altitude and ascent/descent portions of these
flights, along with the 27 July WP-3D flight are shown inFigure 3b. These data represent the most extensive set ofozone and CO measurements ever reported for a singlecyclone warm sector above the USA. Figure 3b shows thatthe polluted lower troposphere is associated with ozone upto 83 ppbv. In contrast the less polluted upper tropospherehas many data points with ozone greater than 83 ppbv,reaching a maximum of 127 ppbv. Because of the extensiveconvection within the warm sector the upper troposphere isheavily influenced by air parcels transported from thesurface of the eastern USA, but the dilution associated withconvection resulted in CO mixing ratios below 162 ppbv.The upper tropospheric ozone mixing ratios above 83 ppbvare associated with CO mixing ratios that range from 61 to162 ppbv, with no correlation. The fact that east coastpolluted air masses lofted to the upper troposphere experi-ence dilution of CO but a strong increase in ozone indicatesthat these air parcels are either being mixed with an uppertropospheric reservoir of high ozone/low CO air, and/or theair masses are experiencing free tropospheric ozone pro-duction. We do not believe that stratospheric air is playing alarge role in the upper tropospheric ozone enhancementbecause all measurements were made far ahead of thestratospheric ozone typically found in the cyclone’s dryairstream that descends west of the cold front and the warmsector [Cooper et al., 2002]. The warm sector air had astrong subtropical origin and our FLEXPART stratosphericozone simulation indicates no more than 14% of the uppertropospheric ozone can be attributed to an aged stratosphericorigin. We conclude that the ozone enhancement in theupper troposphere must have been produced in situ and wedemonstrate in the rest of this manuscript that the dominantsource is most likely ozone production involving lightninggenerated NOx.
3.2. Tropospheric Ozone Distribution AcrossMidlatitude North America
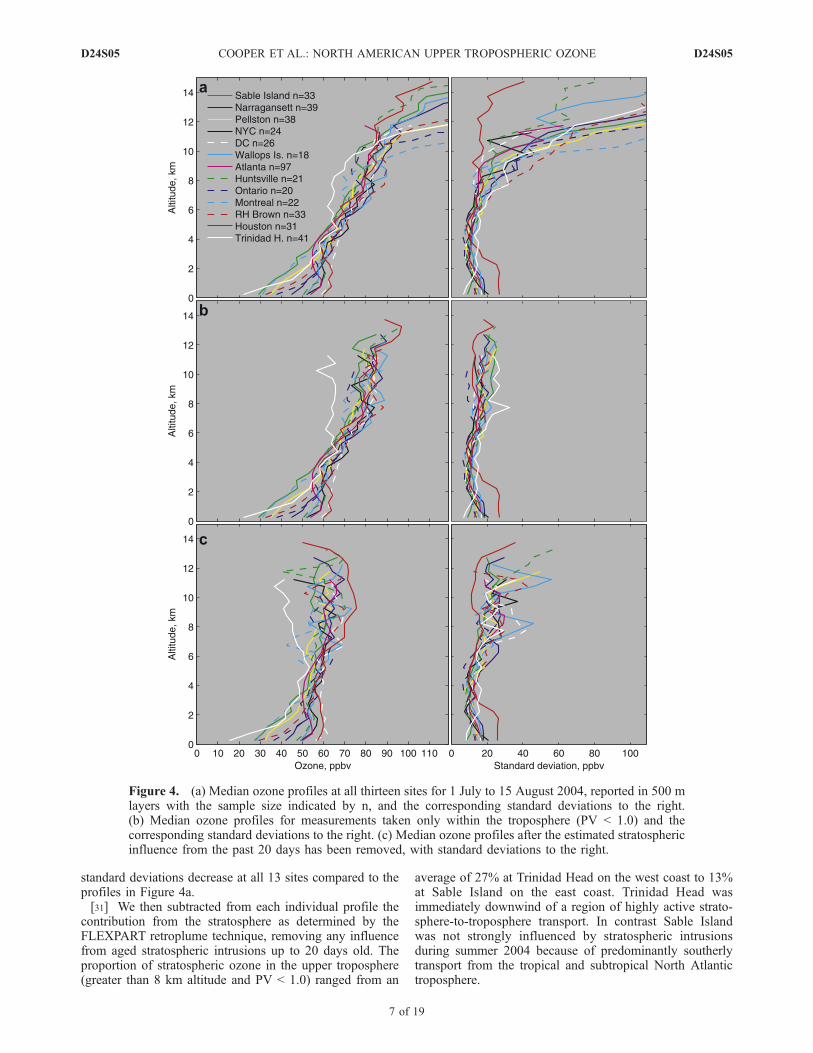
[29] Figure 4a shows the median and standard deviationozone profiles at the 13 sites that provide full troposphericand stratospheric measurements during the ICARTT studyperiod. Ozone is much greater in the 6–12 km range than inthe lower troposphere and the standard deviation is alsogenerally greater at these altitudes, but much of this influ-ence is due to a stratospheric ozone component. Theinfluence from the stratosphere results from a lower tropo-pause when a site is north of the polar jet stream and fromstratospheric intrusions which are common at midlatitudes,even in summer [Moody et al., 1996; Thompson et al.,submitted manuscript, 2006]. The only site with a lowstandard deviation in the upper troposphere is Houstonwhich is located south of the summertime range of thepolar jet stream.[30] The aim of this study is to focus on purely tropo-
spheric measurements requiring the removal of any recentstratospheric influence. We first removed any part of anyindividual profile with a PV value greater than 1.0 pvu,which removed the stratospheric influence associated with alow tropopause or fresh stratospheric intrusions (typicallyless than 2–3 days old). At this point any 500 m layer at anysite with less than 10 remaining profiles was dropped fromthe analysis. The median tropospheric ozone profiles areshown in Figure 4b. Above 4 km the ozone values and
Figure 3. (a) All MOZAIC flight segments (dark blue)that passed through the warm sector of the midlatitudecyclone that traversed the eastern USA from 25 Julythrough 28 July 2004. Also shown are the flight track ofthe NOAAWP-3D on 27 July (light blue) and all cloud-to-ground lightning flashes during 25–28 July (red). (b) Allozone versus CO measurements from the NOAA P3 andMOZAIC aircraft within the troposphere of the cyclonewarm sector during 25–28 July: 0.0–2.0 km (red), 2.0–8.0 km (gray), and 8.0–12.0 km (blue).
D24S05 COOPER ET AL.: NORTH AMERICAN UPPER TROPOSPHERIC OZONE
6 of 19
D24S05
standard deviations decrease at all 13 sites compared to theprofiles in Figure 4a.[31] We then subtracted from each individual profile the
contribution from the stratosphere as determined by theFLEXPART retroplume technique, removing any influencefrom aged stratospheric intrusions up to 20 days old. Theproportion of stratospheric ozone in the upper troposphere(greater than 8 km altitude and PV < 1.0) ranged from an
average of 27% at Trinidad Head on the west coast to 13%at Sable Island on the east coast. Trinidad Head wasimmediately downwind of a region of highly active strato-sphere-to-troposphere transport. In contrast Sable Islandwas not strongly influenced by stratospheric intrusionsduring summer 2004 because of predominantly southerlytransport from the tropical and subtropical North Atlantictroposphere.
Figure 4. (a) Median ozone profiles at all thirteen sites for 1 July to 15 August 2004, reported in 500 mlayers with the sample size indicated by n, and the corresponding standard deviations to the right.(b) Median ozone profiles for measurements taken only within the troposphere (PV < 1.0) and thecorresponding standard deviations to the right. (c) Median ozone profiles after the estimated stratosphericinfluence from the past 20 days has been removed, with standard deviations to the right.
D24S05 COOPER ET AL.: NORTH AMERICAN UPPER TROPOSPHERIC OZONE
7 of 19
D24S05
[32] Once the stratospheric influence from the previous20 days has been removed, the ozone profiles are referred toas tropospheric residual profiles (a quantity which shouldnot be confused with the tropospheric ozone residual thatcan be calculated from Total Ozone Mapping Spectrometerdata [Fishman et al., 1990; Fishman and Balok, 1999]). Themedian and standard deviation tropospheric residual profilesfor each site are shown in Figure 4c. The standard devia-tions of the tropospheric residual ozone profiles in the uppertroposphere are greater than the tropospheric profiles inFigure 4b because of errors in the calculation of thestratospheric ozone component; Wallops Island stands outas being particularly noisy because of its small sample size(n = 18). Cooper et al. [2005b] demonstrated that FLEX-PART simulates well the transport and decay of stratosphericintrusions far south of their origin along the polar jet stream,capturing the transport of intrusions from the midlatitudelower stratosphere to the lower troposphere and the marineboundary layer of the tropical Pacific Ocean. In that studyFLEXPART performed with little bias but with a standarderror of 1.5. Much of this error was due to timing differ-ences between the simulated intrusions and measurements(as much as 12–15 hours), or relatively small displacementsof modeled intrusions in the vertical. The rest of the errorwas due to errors in the wind fields and ozone variability inthe lower stratosphere not captured by the average ozone/PV relationship. In the present study FLEXPART also has astandard error of 1.5 so the modeled and measured ozonevalues for a given time and location will differ by anaverage factor of 1.5. However, because the model hasbeen shown to perform with little bias and can resolvedecaying intrusions, the average influence of stratosphericintrusions at a given location is expected to be fairlyaccurate.[33] The tropospheric residual ozone profiles represent
the median amount of ozone in the troposphere at a givensite with either a tropospheric origin or an aged stratosphericorigin greater than 20 days. We assume that any remainingstratospheric ozone older than 20 days is dispersed through-out the midlatitude troposphere and we neglect any weaklatitudinal gradient that may still exist. Below 5 km thetropospheric residual ozone profiles are representative oftransport along all of the typical pathways that influence asite. Above 5 km where portions of profiles have beenremoved because of the presence of a low tropopause orstrong stratospheric intrusions the profiles are biased awayfrom air masses with polar origins. This bias increases withaltitude with profiles above 10 km representative of airmasses with midlatitude or tropical origins, as expected fortropospheric air masses at these altitudes.[34] An interesting result is that the tropospheric residual
ozone profiles show an overall increase of ozone withaltitude even though the greatest concentrations of anthro-pogenic ozone precursors are found near the surface(Figure 4c). When stations are considered individually allhave significantly more ozone in the upper troposphere(>6 km) than in the lower troposphere (<2 km). When datafrom all sites are combined the difference is also statisticallysignificant with a median tropospheric residual ozone valueof 61 ppbv in the upper troposphere and 46 ppbv in thelower troposphere. When considering just the 12 easternNorth America sites the median tropospheric residual ozone
value in the upper troposphere is 62 ppbv, and 47 ppbv inthe lower troposphere.[35] The lone western North America site of Trinidad
Head has, by far, the lowest tropospheric residual ozonevalues in the upper troposphere. In comparison, the 12 sitesin eastern North America show a broad upper troposphericozone enhancement. Houston has the greatest values, oth-erwise none of remaining eleven eastern sites clearlydominates. In comparison to these combined eleven easternsites, Houston has significantly more ozone between 7.5and 11.0 km.
3.3. Determining Upper Tropospheric Ozone ValuesUpwind of North America
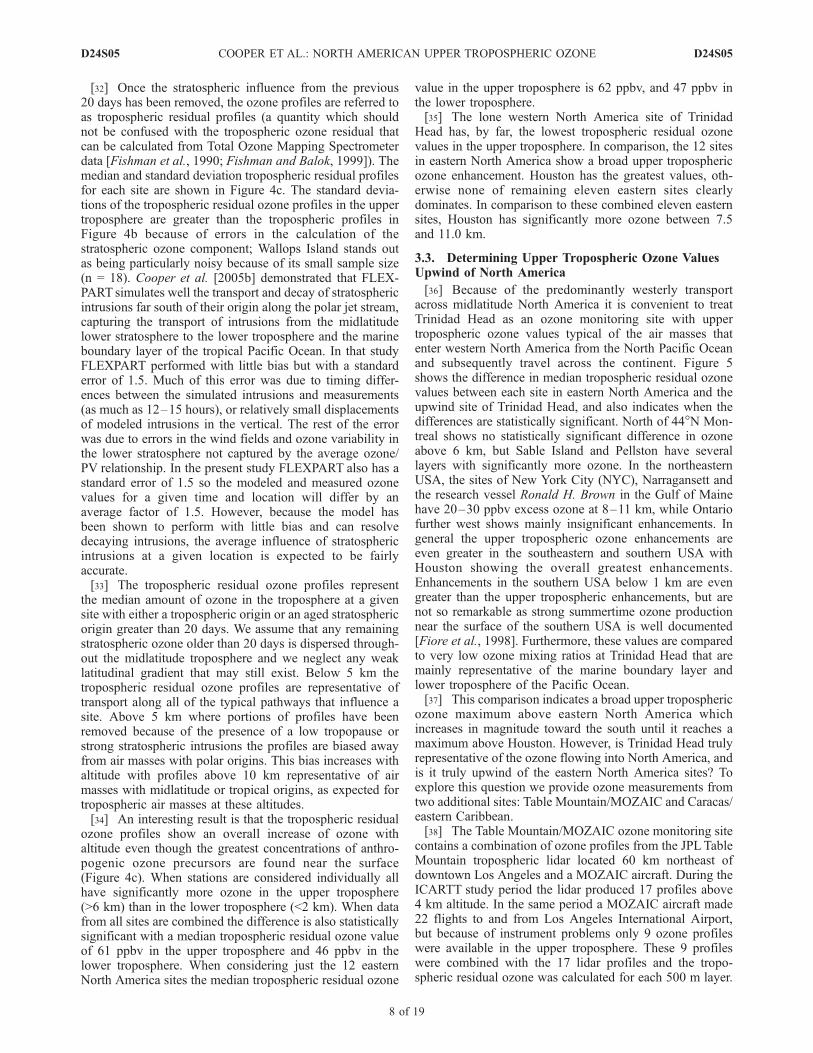
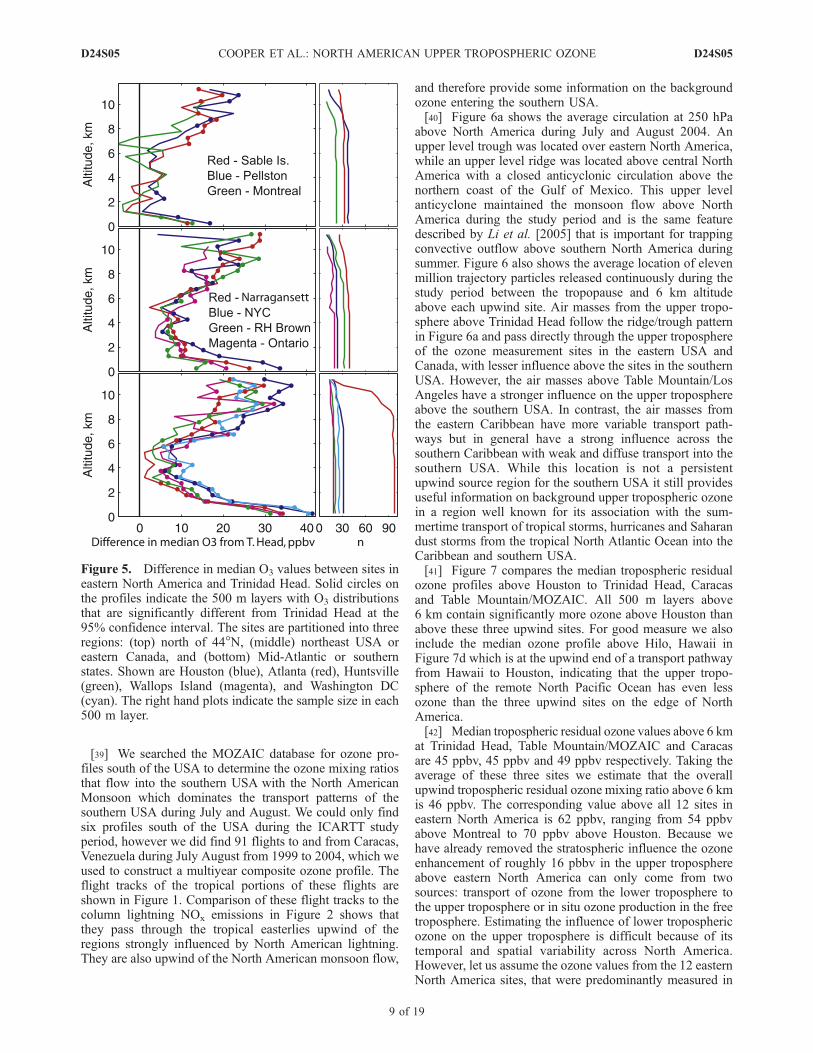
[36] Because of the predominantly westerly transportacross midlatitude North America it is convenient to treatTrinidad Head as an ozone monitoring site with uppertropospheric ozone values typical of the air masses thatenter western North America from the North Pacific Oceanand subsequently travel across the continent. Figure 5shows the difference in median tropospheric residual ozonevalues between each site in eastern North America and theupwind site of Trinidad Head, and also indicates when thedifferences are statistically significant. North of 44�N Mon-treal shows no statistically significant difference in ozoneabove 6 km, but Sable Island and Pellston have severallayers with significantly more ozone. In the northeasternUSA, the sites of New York City (NYC), Narragansett andthe research vessel Ronald H. Brown in the Gulf of Mainehave 20–30 ppbv excess ozone at 8–11 km, while Ontariofurther west shows mainly insignificant enhancements. Ingeneral the upper tropospheric ozone enhancements areeven greater in the southeastern and southern USA withHouston showing the overall greatest enhancements.Enhancements in the southern USA below 1 km are evengreater than the upper tropospheric enhancements, but arenot so remarkable as strong summertime ozone productionnear the surface of the southern USA is well documented[Fiore et al., 1998]. Furthermore, these values are comparedto very low ozone mixing ratios at Trinidad Head that aremainly representative of the marine boundary layer andlower troposphere of the Pacific Ocean.[37] This comparison indicates a broad upper tropospheric
ozone maximum above eastern North America whichincreases in magnitude toward the south until it reaches amaximum above Houston. However, is Trinidad Head trulyrepresentative of the ozone flowing into North America, andis it truly upwind of the eastern North America sites? Toexplore this question we provide ozone measurements fromtwo additional sites: Table Mountain/MOZAIC and Caracas/eastern Caribbean.[38] The Table Mountain/MOZAIC ozone monitoring site
contains a combination of ozone profiles from the JPLTableMountain tropospheric lidar located 60 km northeast ofdowntown Los Angeles and a MOZAIC aircraft. During theICARTT study period the lidar produced 17 profiles above4 km altitude. In the same period a MOZAIC aircraft made22 flights to and from Los Angeles International Airport,but because of instrument problems only 9 ozone profileswere available in the upper troposphere. These 9 profileswere combined with the 17 lidar profiles and the tropo-spheric residual ozone was calculated for each 500 m layer.
D24S05 COOPER ET AL.: NORTH AMERICAN UPPER TROPOSPHERIC OZONE
8 of 19
D24S05
[39] We searched the MOZAIC database for ozone pro-files south of the USA to determine the ozone mixing ratiosthat flow into the southern USA with the North AmericanMonsoon which dominates the transport patterns of thesouthern USA during July and August. We could only findsix profiles south of the USA during the ICARTT studyperiod, however we did find 91 flights to and from Caracas,Venezuela during July August from 1999 to 2004, which weused to construct a multiyear composite ozone profile. Theflight tracks of the tropical portions of these flights areshown in Figure 1. Comparison of these flight tracks to thecolumn lightning NOx emissions in Figure 2 shows thatthey pass through the tropical easterlies upwind of theregions strongly influenced by North American lightning.They are also upwind of the North American monsoon flow,
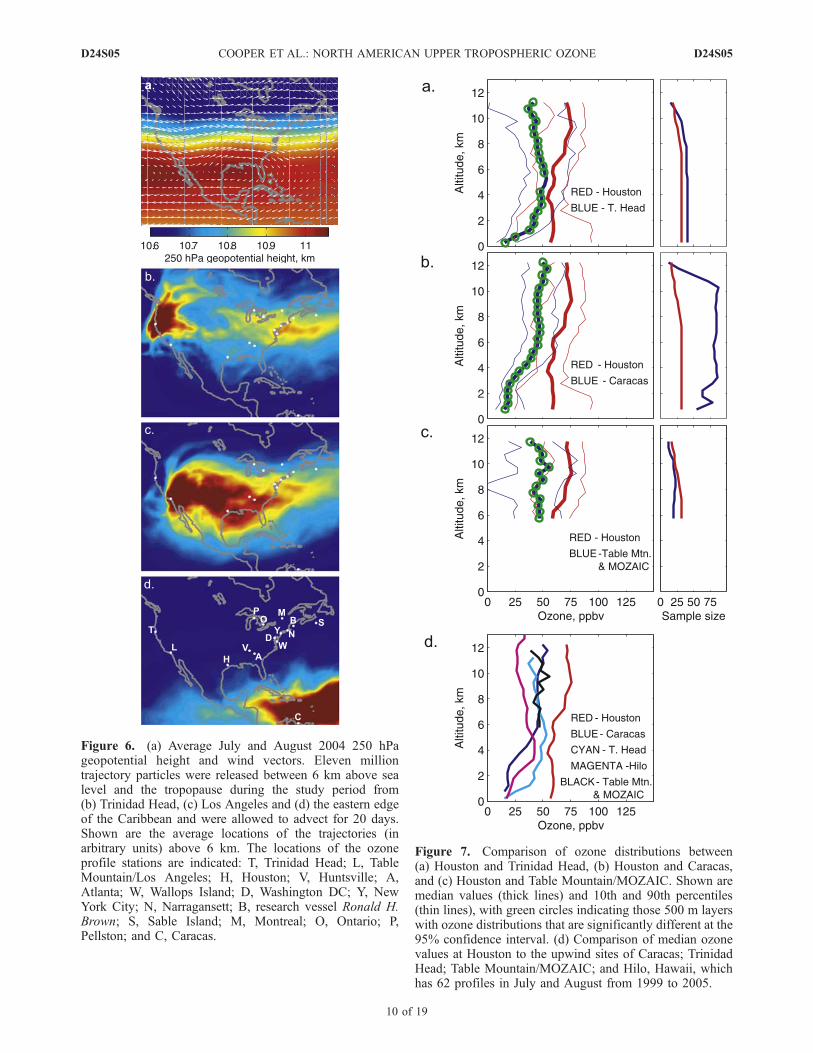
and therefore provide some information on the backgroundozone entering the southern USA.[40] Figure 6a shows the average circulation at 250 hPa
above North America during July and August 2004. Anupper level trough was located over eastern North America,while an upper level ridge was located above central NorthAmerica with a closed anticyclonic circulation above thenorthern coast of the Gulf of Mexico. This upper levelanticyclone maintained the monsoon flow above NorthAmerica during the study period and is the same featuredescribed by Li et al. [2005] that is important for trappingconvective outflow above southern North America duringsummer. Figure 6 also shows the average location of elevenmillion trajectory particles released continuously during thestudy period between the tropopause and 6 km altitudeabove each upwind site. Air masses from the upper tropo-sphere above Trinidad Head follow the ridge/trough patternin Figure 6a and pass directly through the upper troposphereof the ozone measurement sites in the eastern USA andCanada, with lesser influence above the sites in the southernUSA. However, the air masses above Table Mountain/LosAngeles have a stronger influence on the upper troposphereabove the southern USA. In contrast, the air masses fromthe eastern Caribbean have more variable transport path-ways but in general have a strong influence across thesouthern Caribbean with weak and diffuse transport into thesouthern USA. While this location is not a persistentupwind source region for the southern USA it still providesuseful information on background upper tropospheric ozonein a region well known for its association with the sum-mertime transport of tropical storms, hurricanes and Saharandust storms from the tropical North Atlantic Ocean into theCaribbean and southern USA.[41] Figure 7 compares the median tropospheric residual
ozone profiles above Houston to Trinidad Head, Caracasand Table Mountain/MOZAIC. All 500 m layers above6 km contain significantly more ozone above Houston thanabove these three upwind sites. For good measure we alsoinclude the median ozone profile above Hilo, Hawaii inFigure 7d which is at the upwind end of a transport pathwayfrom Hawaii to Houston, indicating that the upper tropo-sphere of the remote North Pacific Ocean has even lessozone than the three upwind sites on the edge of NorthAmerica.[42] Median tropospheric residual ozone values above 6 km
at Trinidad Head, Table Mountain/MOZAIC and Caracasare 45 ppbv, 45 ppbv and 49 ppbv respectively. Taking theaverage of these three sites we estimate that the overallupwind tropospheric residual ozone mixing ratio above 6 kmis 46 ppbv. The corresponding value above all 12 sites ineastern North America is 62 ppbv, ranging from 54 ppbvabove Montreal to 70 ppbv above Houston. Because wehave already removed the stratospheric influence the ozoneenhancement of roughly 16 pbbv in the upper troposphereabove eastern North America can only come from twosources: transport of ozone from the lower troposphere tothe upper troposphere or in situ ozone production in the freetroposphere. Estimating the influence of lower troposphericozone on the upper troposphere is difficult because of itstemporal and spatial variability across North America.However, let us assume the ozone values from the 12 easternNorth America sites, that were predominantly measured in
Figure 5. Difference in median O3 values between sites ineastern North America and Trinidad Head. Solid circles onthe profiles indicate the 500 m layers with O3 distributionsthat are significantly different from Trinidad Head at the95% confidence interval. The sites are partitioned into threeregions: (top) north of 44�N, (middle) northeast USA oreastern Canada, and (bottom) Mid-Atlantic or southernstates. Shown are Houston (blue), Atlanta (red), Huntsville(green), Wallops Island (magenta), and Washington DC(cyan). The right hand plots indicate the sample size in each500 m layer.
D24S05 COOPER ET AL.: NORTH AMERICAN UPPER TROPOSPHERIC OZONE
9 of 19
D24S05
Figure 6. (a) Average July and August 2004 250 hPageopotential height and wind vectors. Eleven milliontrajectory particles were released between 6 km above sealevel and the tropopause during the study period from(b) Trinidad Head, (c) Los Angeles and (d) the eastern edgeof the Caribbean and were allowed to advect for 20 days.Shown are the average locations of the trajectories (inarbitrary units) above 6 km. The locations of the ozoneprofile stations are indicated: T, Trinidad Head; L, TableMountain/Los Angeles; H, Houston; V, Huntsville; A,Atlanta; W, Wallops Island; D, Washington DC; Y, NewYork City; N, Narragansett; B, research vessel Ronald H.Brown; S, Sable Island; M, Montreal; O, Ontario; P,Pellston; and C, Caracas.
Figure 7. Comparison of ozone distributions between(a) Houston and Trinidad Head, (b) Houston and Caracas,and (c) Houston and Table Mountain/MOZAIC. Shown aremedian values (thick lines) and 10th and 90th percentiles(thin lines), with green circles indicating those 500 m layerswith ozone distributions that are significantly different at the95% confidence interval. (d) Comparison of median ozonevalues at Houston to the upwind sites of Caracas; TrinidadHead; Table Mountain/MOZAIC; and Hilo, Hawaii, whichhas 62 profiles in July and August from 1999 to 2005.
D24S05 COOPER ET AL.: NORTH AMERICAN UPPER TROPOSPHERIC OZONE
10 of 19
D24S05
early afternoon or early evening, are broadly representativeof North American lower tropospheric ozone during theICARTT study period. The average tropospheric residualozone value of the eastern North America lower troposphere(< 2 km) is 47 ppbv, only one ppbv greater than the uppertropospheric value of the upwind sites. So no matter howmuch air is transported from the surface of eastern NorthAmerica and mixed with the air from the upwind sites as itenters the upper troposphere above eastern North America,on average, the upper tropospheric ozone value cannot riseabove 47 ppbv because of mixing alone. Even if we arevery cautious and assume the median ozone mixing ratio of59 ppbv in the lower troposphere above Houston is repre-sentative of eastern North America and assume all of theeastern North America upper troposphere is exposed tothe same amount of vertical mixing as Houston (FLEX-PART indicates 15% of the mass of the upper troposphereabove Houston originates in the mixed layer over theprevious 20 days) upper tropospheric ozone would neverexceed 48 ppbv because of mixing alone. Therefore at least14 ppbv of the 16 ppbv ozone enhancement above eastern
North America must be the result of in situ ozone produc-tion in the free troposphere.
3.4. Relatively Low Pollution Levels in UpperTroposphere Above Houston
[43] Now that we have established that in situ ozoneproduction is responsible for the majority of the uppertropospheric ozone enhancement above eastern NorthAmerica we must determine the relative impact of NOx
emissions from lightning, biomass burning, biogenic, air-craft and surface anthropogenic sources. However, first wewill focus on the upper troposphere of Houston to illustratethat this region is not heavily influenced by pollution andthat the ozone production above this site must be stronglyassociated with lightning NOx.[44] In situ evidence that the upper troposphere above
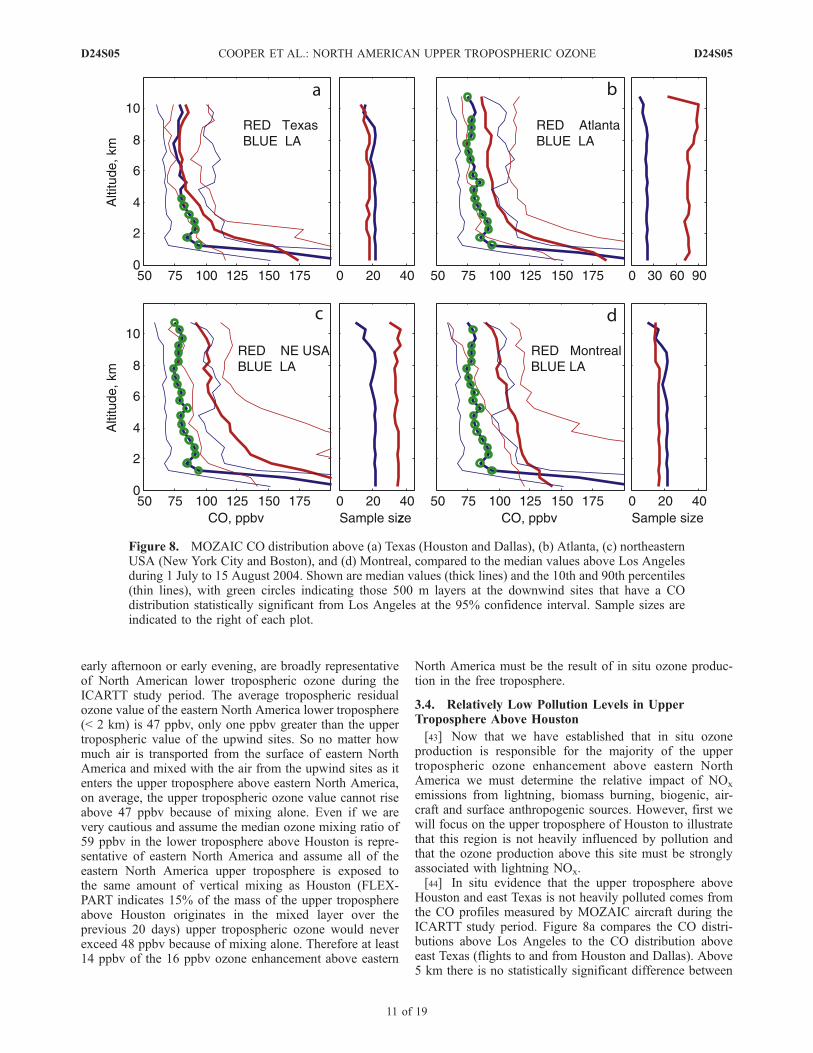
Houston and east Texas is not heavily polluted comes fromthe CO profiles measured by MOZAIC aircraft during theICARTT study period. Figure 8a compares the CO distri-butions above Los Angeles to the CO distribution aboveeast Texas (flights to and from Houston and Dallas). Above5 km there is no statistically significant difference between
Figure 8. MOZAIC CO distribution above (a) Texas (Houston and Dallas), (b) Atlanta, (c) northeasternUSA (New York City and Boston), and (d) Montreal, compared to the median values above Los Angelesduring 1 July to 15 August 2004. Shown are median values (thick lines) and the 10th and 90th percentiles(thin lines), with green circles indicating those 500 m layers at the downwind sites that have a COdistribution statistically significant from Los Angeles at the 95% confidence interval. Sample sizes areindicated to the right of each plot.
D24S05 COOPER ET AL.: NORTH AMERICAN UPPER TROPOSPHERIC OZONE
11 of 19
D24S05
CO at the two sites. While the lower troposphere of the LosAngeles region is heavily polluted, the emissions do notreach the upper troposphere because of a lack of deepconvection above coastal southern California. Thereforethe CO above LA is representative of CO emissions upwindof North America. Despite Texas being located in the southcentral United States the upper troposphere above eastTexas is no more polluted than the upper troposphericbackground air entering the southwestern USA above LosAngeles. In contrast, the eastern sites of Atlanta andMontreal, and the combined sites of New York City/Bostonshow significantly more CO in the upper troposphere incomparison to Los Angeles. The excess CO is the result ofNorth American anthropogenic CO emissions that are loftedto the upper troposphere across the eastern half of thecontinent. Above Montreal, and New York City/Bostonthere was also an influence from CO emissions from thewidespread boreal fires in Alaska and western Canada
during the summer of 2004. We also compared theMOZAIC CO profiles above Texas to the 60 MOZAICCO profiles available at Caracas between 2002 and 2004(not shown) and found no statistically significant differencebetween the two locations above 5 km.[45] Figure 9 shows the average source regions of air in
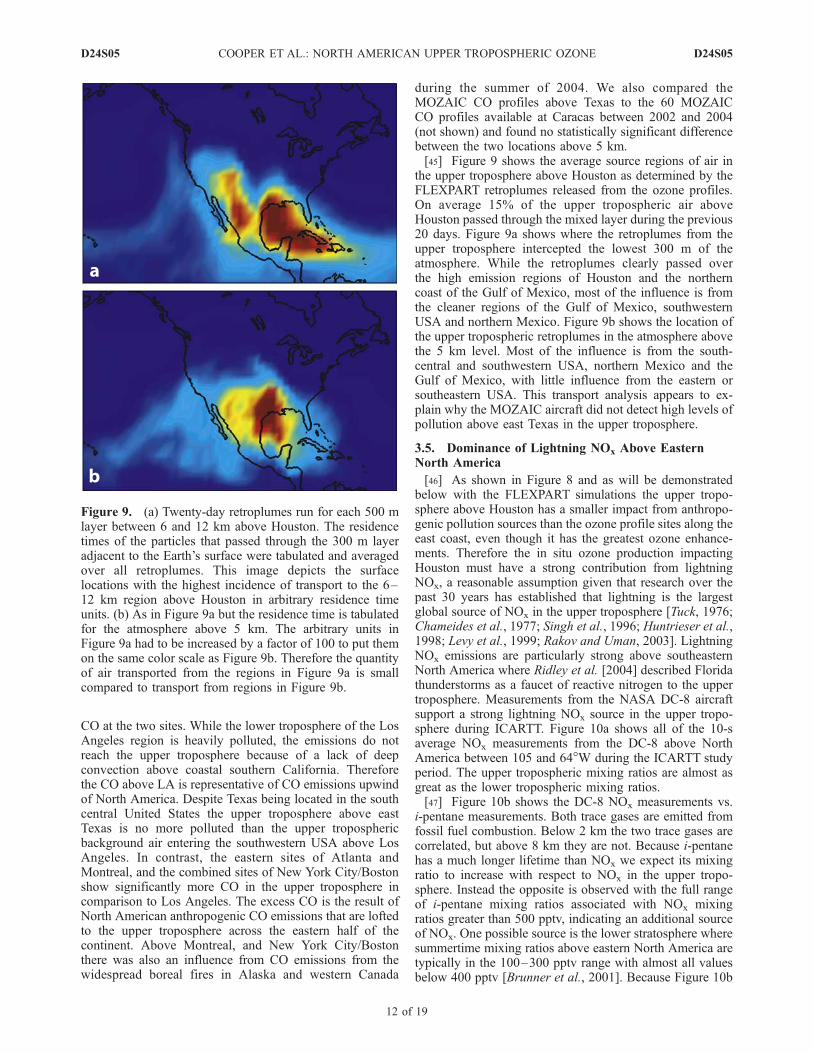
the upper troposphere above Houston as determined by theFLEXPART retroplumes released from the ozone profiles.On average 15% of the upper tropospheric air aboveHouston passed through the mixed layer during the previous20 days. Figure 9a shows where the retroplumes from theupper troposphere intercepted the lowest 300 m of theatmosphere. While the retroplumes clearly passed overthe high emission regions of Houston and the northerncoast of the Gulf of Mexico, most of the influence is fromthe cleaner regions of the Gulf of Mexico, southwesternUSA and northern Mexico. Figure 9b shows the location ofthe upper tropospheric retroplumes in the atmosphere abovethe 5 km level. Most of the influence is from the south-central and southwestern USA, northern Mexico and theGulf of Mexico, with little influence from the eastern orsoutheastern USA. This transport analysis appears to ex-plain why the MOZAIC aircraft did not detect high levels ofpollution above east Texas in the upper troposphere.
3.5. Dominance of Lightning NOx Above EasternNorth America
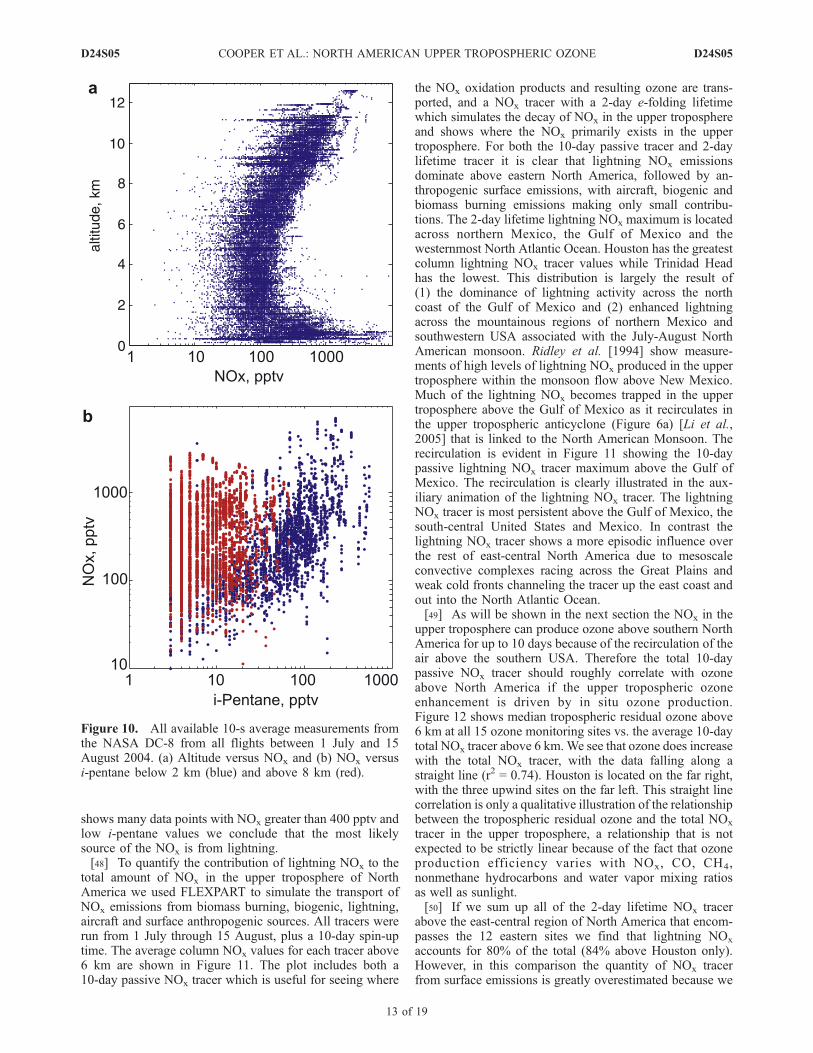
[46] As shown in Figure 8 and as will be demonstratedbelow with the FLEXPART simulations the upper tropo-sphere above Houston has a smaller impact from anthropo-genic pollution sources than the ozone profile sites along theeast coast, even though it has the greatest ozone enhance-ments. Therefore the in situ ozone production impactingHouston must have a strong contribution from lightningNOx, a reasonable assumption given that research over thepast 30 years has established that lightning is the largestglobal source of NOx in the upper troposphere [Tuck, 1976;Chameides et al., 1977; Singh et al., 1996; Huntrieser et al.,1998; Levy et al., 1999; Rakov and Uman, 2003]. LightningNOx emissions are particularly strong above southeasternNorth America where Ridley et al. [2004] described Floridathunderstorms as a faucet of reactive nitrogen to the uppertroposphere. Measurements from the NASA DC-8 aircraftsupport a strong lightning NOx source in the upper tropo-sphere during ICARTT. Figure 10a shows all of the 10-saverage NOx measurements from the DC-8 above NorthAmerica between 105 and 64�W during the ICARTT studyperiod. The upper tropospheric mixing ratios are almost asgreat as the lower tropospheric mixing ratios.[47] Figure 10b shows the DC-8 NOx measurements vs.
i-pentane measurements. Both trace gases are emitted fromfossil fuel combustion. Below 2 km the two trace gases arecorrelated, but above 8 km they are not. Because i-pentanehas a much longer lifetime than NOx we expect its mixingratio to increase with respect to NOx in the upper tropo-sphere. Instead the opposite is observed with the full rangeof i-pentane mixing ratios associated with NOx mixingratios greater than 500 pptv, indicating an additional sourceof NOx. One possible source is the lower stratosphere wheresummertime mixing ratios above eastern North America aretypically in the 100–300 pptv range with almost all valuesbelow 400 pptv [Brunner et al., 2001]. Because Figure 10b
Figure 9. (a) Twenty-day retroplumes run for each 500 mlayer between 6 and 12 km above Houston. The residencetimes of the particles that passed through the 300 m layeradjacent to the Earth’s surface were tabulated and averagedover all retroplumes. This image depicts the surfacelocations with the highest incidence of transport to the 6–12 km region above Houston in arbitrary residence timeunits. (b) As in Figure 9a but the residence time is tabulatedfor the atmosphere above 5 km. The arbitrary units inFigure 9a had to be increased by a factor of 100 to put themon the same color scale as Figure 9b. Therefore the quantityof air transported from the regions in Figure 9a is smallcompared to transport from regions in Figure 9b.
D24S05 COOPER ET AL.: NORTH AMERICAN UPPER TROPOSPHERIC OZONE
12 of 19
D24S05
shows many data points with NOx greater than 400 pptv andlow i-pentane values we conclude that the most likelysource of the NOx is from lightning.[48] To quantify the contribution of lightning NOx to the
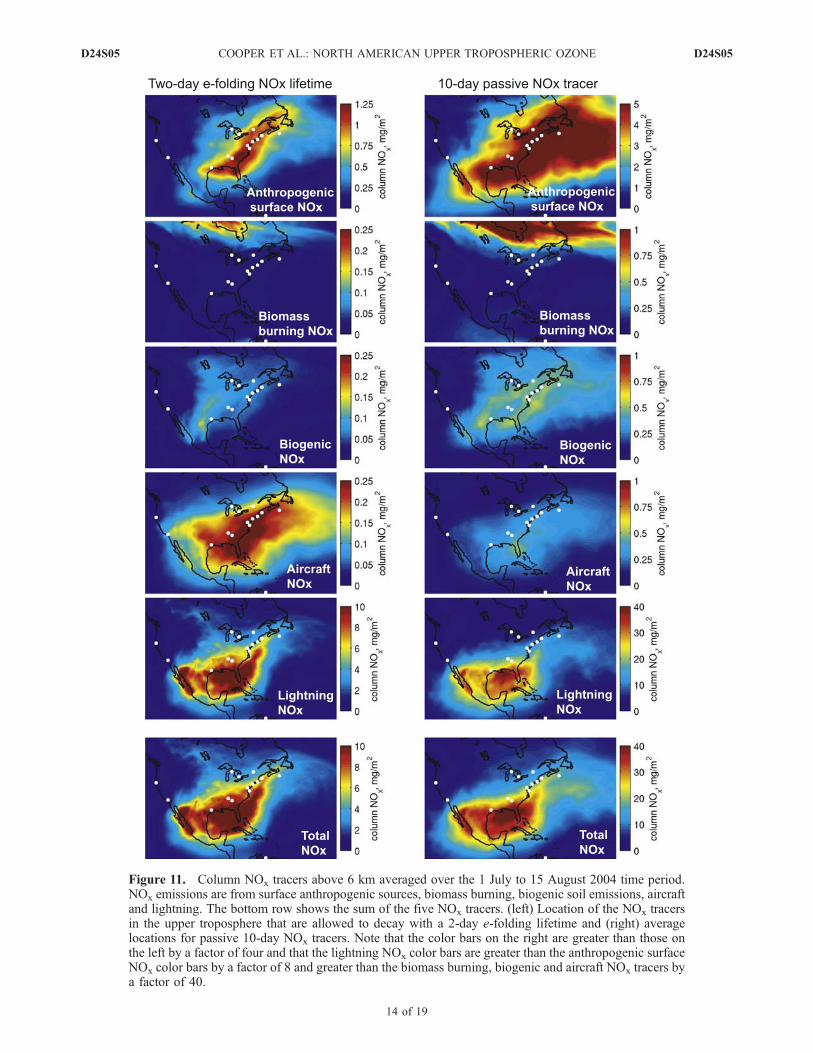
total amount of NOx in the upper troposphere of NorthAmerica we used FLEXPART to simulate the transport ofNOx emissions from biomass burning, biogenic, lightning,aircraft and surface anthropogenic sources. All tracers wererun from 1 July through 15 August, plus a 10-day spin-uptime. The average column NOx values for each tracer above6 km are shown in Figure 11. The plot includes both a10-day passive NOx tracer which is useful for seeing where
the NOx oxidation products and resulting ozone are trans-ported, and a NOx tracer with a 2-day e-folding lifetimewhich simulates the decay of NOx in the upper troposphereand shows where the NOx primarily exists in the uppertroposphere. For both the 10-day passive tracer and 2-daylifetime tracer it is clear that lightning NOx emissionsdominate above eastern North America, followed by an-thropogenic surface emissions, with aircraft, biogenic andbiomass burning emissions making only small contribu-tions. The 2-day lifetime lightning NOx maximum is locatedacross northern Mexico, the Gulf of Mexico and thewesternmost North Atlantic Ocean. Houston has the greatestcolumn lightning NOx tracer values while Trinidad Headhas the lowest. This distribution is largely the result of(1) the dominance of lightning activity across the northcoast of the Gulf of Mexico and (2) enhanced lightningacross the mountainous regions of northern Mexico andsouthwestern USA associated with the July-August NorthAmerican monsoon. Ridley et al. [1994] show measure-ments of high levels of lightning NOx produced in the uppertroposphere within the monsoon flow above New Mexico.Much of the lightning NOx becomes trapped in the uppertroposphere above the Gulf of Mexico as it recirculates inthe upper tropospheric anticyclone (Figure 6a) [Li et al.,2005] that is linked to the North American Monsoon. Therecirculation is evident in Figure 11 showing the 10-daypassive lightning NOx tracer maximum above the Gulf ofMexico. The recirculation is clearly illustrated in the aux-iliary animation of the lightning NOx tracer. The lightningNOx tracer is most persistent above the Gulf of Mexico, thesouth-central United States and Mexico. In contrast thelightning NOx tracer shows a more episodic influence overthe rest of east-central North America due to mesoscaleconvective complexes racing across the Great Plains andweak cold fronts channeling the tracer up the east coast andout into the North Atlantic Ocean.[49] As will be shown in the next section the NOx in the
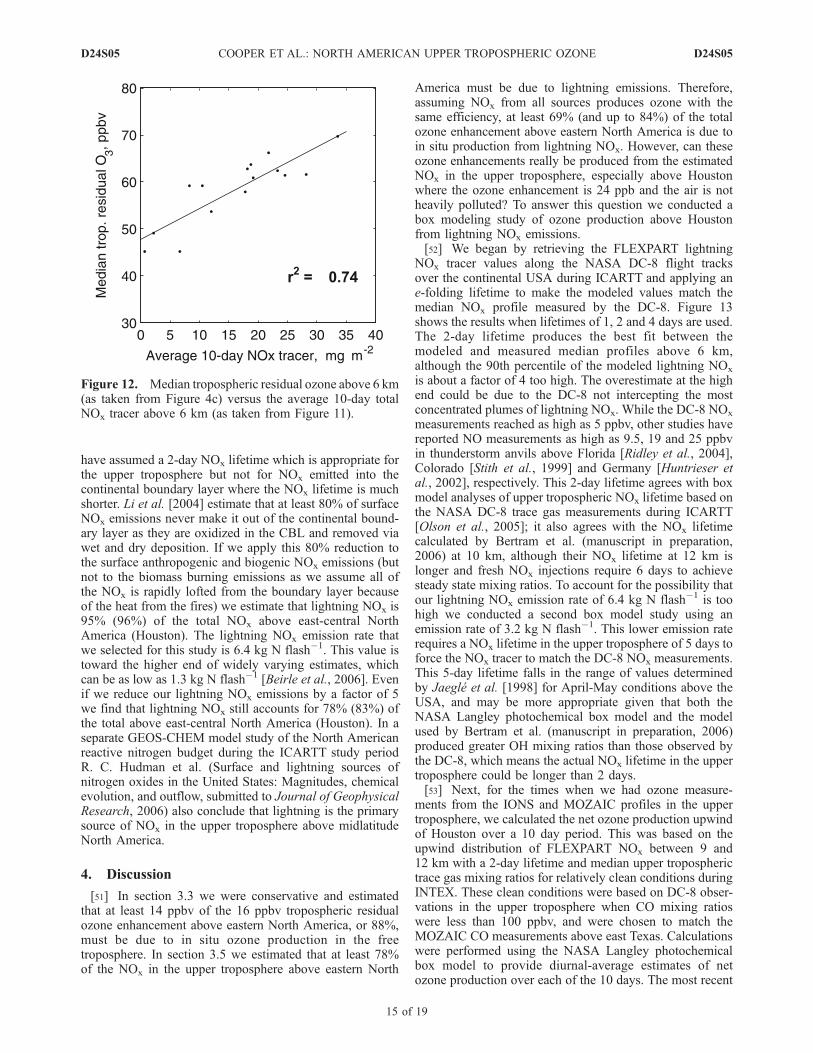
upper troposphere can produce ozone above southern NorthAmerica for up to 10 days because of the recirculation of theair above the southern USA. Therefore the total 10-daypassive NOx tracer should roughly correlate with ozoneabove North America if the upper tropospheric ozoneenhancement is driven by in situ ozone production.Figure 12 shows median tropospheric residual ozone above6 km at all 15 ozone monitoring sites vs. the average 10-daytotal NOx tracer above 6 km.We see that ozone does increasewith the total NOx tracer, with the data falling along astraight line (r2 = 0.74). Houston is located on the far right,with the three upwind sites on the far left. This straight linecorrelation is only a qualitative illustration of the relationshipbetween the tropospheric residual ozone and the total NOx
tracer in the upper troposphere, a relationship that is notexpected to be strictly linear because of the fact that ozoneproduction efficiency varies with NOx, CO, CH4,nonmethane hydrocarbons and water vapor mixing ratiosas well as sunlight.[50] If we sum up all of the 2-day lifetime NOx tracer
above the east-central region of North America that encom-passes the 12 eastern sites we find that lightning NOx
accounts for 80% of the total (84% above Houston only).However, in this comparison the quantity of NOx tracerfrom surface emissions is greatly overestimated because we
Figure 10. All available 10-s average measurements fromthe NASA DC-8 from all flights between 1 July and 15August 2004. (a) Altitude versus NOx and (b) NOx versusi-pentane below 2 km (blue) and above 8 km (red).
D24S05 COOPER ET AL.: NORTH AMERICAN UPPER TROPOSPHERIC OZONE
13 of 19
D24S05
Figure 11. Column NOx tracers above 6 km averaged over the 1 July to 15 August 2004 time period.NOx emissions are from surface anthropogenic sources, biomass burning, biogenic soil emissions, aircraftand lightning. The bottom row shows the sum of the five NOx tracers. (left) Location of the NOx tracersin the upper troposphere that are allowed to decay with a 2-day e-folding lifetime and (right) averagelocations for passive 10-day NOx tracers. Note that the color bars on the right are greater than those onthe left by a factor of four and that the lightning NOx color bars are greater than the anthropogenic surfaceNOx color bars by a factor of 8 and greater than the biomass burning, biogenic and aircraft NOx tracers bya factor of 40.
D24S05 COOPER ET AL.: NORTH AMERICAN UPPER TROPOSPHERIC OZONE
14 of 19
D24S05
have assumed a 2-day NOx lifetime which is appropriate forthe upper troposphere but not for NOx emitted into thecontinental boundary layer where the NOx lifetime is muchshorter. Li et al. [2004] estimate that at least 80% of surfaceNOx emissions never make it out of the continental bound-ary layer as they are oxidized in the CBL and removed viawet and dry deposition. If we apply this 80% reduction tothe surface anthropogenic and biogenic NOx emissions (butnot to the biomass burning emissions as we assume all ofthe NOx is rapidly lofted from the boundary layer becauseof the heat from the fires) we estimate that lightning NOx is95% (96%) of the total NOx above east-central NorthAmerica (Houston). The lightning NOx emission rate thatwe selected for this study is 6.4 kg N flash�1. This value istoward the higher end of widely varying estimates, whichcan be as low as 1.3 kg N flash�1 [Beirle et al., 2006]. Evenif we reduce our lightning NOx emissions by a factor of 5we find that lightning NOx still accounts for 78% (83%) ofthe total above east-central North America (Houston). In aseparate GEOS-CHEM model study of the North Americanreactive nitrogen budget during the ICARTT study periodR. C. Hudman et al. (Surface and lightning sources ofnitrogen oxides in the United States: Magnitudes, chemicalevolution, and outflow, submitted to Journal of GeophysicalResearch, 2006) also conclude that lightning is the primarysource of NOx in the upper troposphere above midlatitudeNorth America.
4. Discussion
[51] In section 3.3 we were conservative and estimatedthat at least 14 ppbv of the 16 ppbv tropospheric residualozone enhancement above eastern North America, or 88%,must be due to in situ ozone production in the freetroposphere. In section 3.5 we estimated that at least 78%of the NOx in the upper troposphere above eastern North
America must be due to lightning emissions. Therefore,assuming NOx from all sources produces ozone with thesame efficiency, at least 69% (and up to 84%) of the totalozone enhancement above eastern North America is due toin situ production from lightning NOx. However, can theseozone enhancements really be produced from the estimatedNOx in the upper troposphere, especially above Houstonwhere the ozone enhancement is 24 ppb and the air is notheavily polluted? To answer this question we conducted abox modeling study of ozone production above Houstonfrom lightning NOx emissions.[52] We began by retrieving the FLEXPART lightning
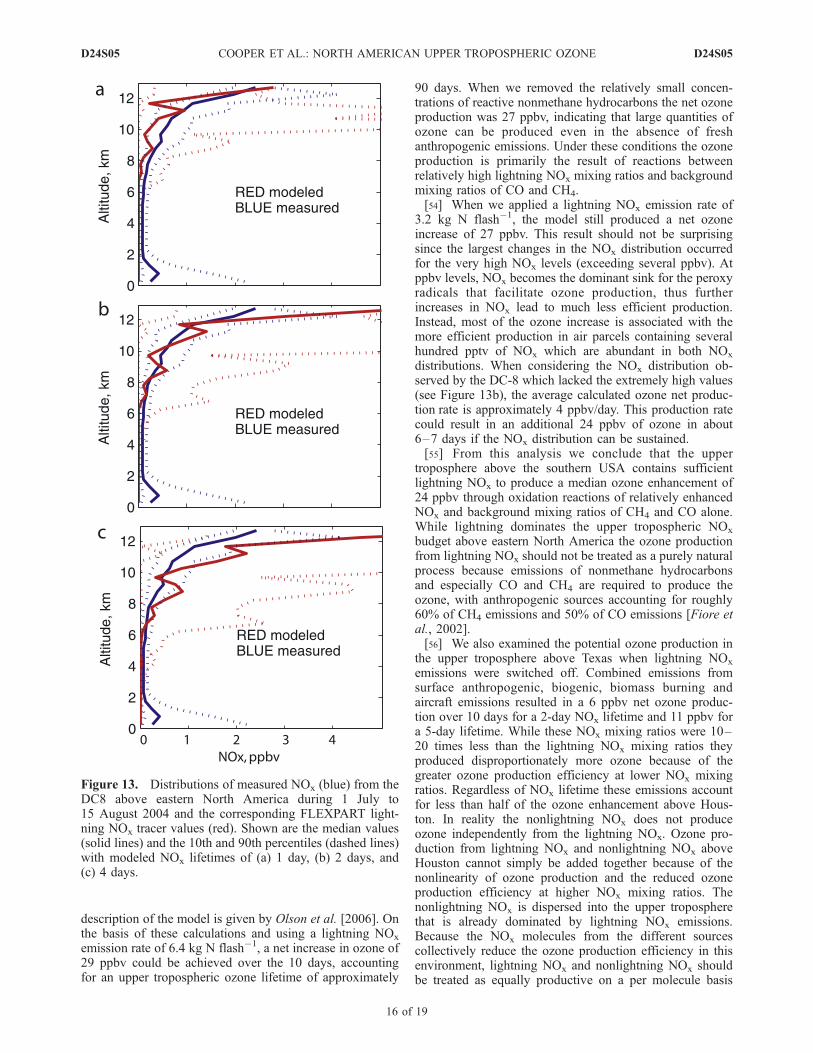
NOx tracer values along the NASA DC-8 flight tracksover the continental USA during ICARTT and applying ane-folding lifetime to make the modeled values match themedian NOx profile measured by the DC-8. Figure 13shows the results when lifetimes of 1, 2 and 4 days are used.The 2-day lifetime produces the best fit between themodeled and measured median profiles above 6 km,although the 90th percentile of the modeled lightning NOx
is about a factor of 4 too high. The overestimate at the highend could be due to the DC-8 not intercepting the mostconcentrated plumes of lightning NOx. While the DC-8 NOx
measurements reached as high as 5 ppbv, other studies havereported NO measurements as high as 9.5, 19 and 25 ppbvin thunderstorm anvils above Florida [Ridley et al., 2004],Colorado [Stith et al., 1999] and Germany [Huntrieser etal., 2002], respectively. This 2-day lifetime agrees with boxmodel analyses of upper tropospheric NOx lifetime based onthe NASA DC-8 trace gas measurements during ICARTT[Olson et al., 2005]; it also agrees with the NOx lifetimecalculated by Bertram et al. (manuscript in preparation,2006) at 10 km, although their NOx lifetime at 12 km islonger and fresh NOx injections require 6 days to achievesteady state mixing ratios. To account for the possibility thatour lightning NOx emission rate of 6.4 kg N flash�1 is toohigh we conducted a second box model study using anemission rate of 3.2 kg N flash�1. This lower emission raterequires a NOx lifetime in the upper troposphere of 5 days toforce the NOx tracer to match the DC-8 NOx measurements.This 5-day lifetime falls in the range of values determinedby Jaegle et al. [1998] for April-May conditions above theUSA, and may be more appropriate given that both theNASA Langley photochemical box model and the modelused by Bertram et al. (manuscript in preparation, 2006)produced greater OH mixing ratios than those observed bythe DC-8, which means the actual NOx lifetime in the uppertroposphere could be longer than 2 days.[53] Next, for the times when we had ozone measure-
ments from the IONS and MOZAIC profiles in the uppertroposphere, we calculated the net ozone production upwindof Houston over a 10 day period. This was based on theupwind distribution of FLEXPART NOx between 9 and12 km with a 2-day lifetime and median upper tropospherictrace gas mixing ratios for relatively clean conditions duringINTEX. These clean conditions were based on DC-8 obser-vations in the upper troposphere when CO mixing ratioswere less than 100 ppbv, and were chosen to match theMOZAIC CO measurements above east Texas. Calculationswere performed using the NASA Langley photochemicalbox model to provide diurnal-average estimates of netozone production over each of the 10 days. The most recent
Figure 12. Median tropospheric residual ozone above 6 km(as taken from Figure 4c) versus the average 10-day totalNOx tracer above 6 km (as taken from Figure 11).
D24S05 COOPER ET AL.: NORTH AMERICAN UPPER TROPOSPHERIC OZONE
15 of 19
D24S05
description of the model is given by Olson et al. [2006]. Onthe basis of these calculations and using a lightning NOx
emission rate of 6.4 kg N flash�1, a net increase in ozone of29 ppbv could be achieved over the 10 days, accountingfor an upper tropospheric ozone lifetime of approximately
90 days. When we removed the relatively small concen-trations of reactive nonmethane hydrocarbons the net ozoneproduction was 27 ppbv, indicating that large quantities ofozone can be produced even in the absence of freshanthropogenic emissions. Under these conditions the ozoneproduction is primarily the result of reactions betweenrelatively high lightning NOx mixing ratios and backgroundmixing ratios of CO and CH4.[54] When we applied a lightning NOx emission rate of
3.2 kg N flash�1, the model still produced a net ozoneincrease of 27 ppbv. This result should not be surprisingsince the largest changes in the NOx distribution occurredfor the very high NOx levels (exceeding several ppbv). Atppbv levels, NOx becomes the dominant sink for the peroxyradicals that facilitate ozone production, thus furtherincreases in NOx lead to much less efficient production.Instead, most of the ozone increase is associated with themore efficient production in air parcels containing severalhundred pptv of NOx which are abundant in both NOx
distributions. When considering the NOx distribution ob-served by the DC-8 which lacked the extremely high values(see Figure 13b), the average calculated ozone net produc-tion rate is approximately 4 ppbv/day. This production ratecould result in an additional 24 ppbv of ozone in about6–7 days if the NOx distribution can be sustained.[55] From this analysis we conclude that the upper
troposphere above the southern USA contains sufficientlightning NOx to produce a median ozone enhancement of24 ppbv through oxidation reactions of relatively enhancedNOx and background mixing ratios of CH4 and CO alone.While lightning dominates the upper tropospheric NOx
budget above eastern North America the ozone productionfrom lightning NOx should not be treated as a purely naturalprocess because emissions of nonmethane hydrocarbonsand especially CO and CH4 are required to produce theozone, with anthropogenic sources accounting for roughly60% of CH4 emissions and 50% of CO emissions [Fiore etal., 2002].[56] We also examined the potential ozone production in
the upper troposphere above Texas when lightning NOx
emissions were switched off. Combined emissions fromsurface anthropogenic, biogenic, biomass burning andaircraft emissions resulted in a 6 ppbv net ozone produc-tion over 10 days for a 2-day NOx lifetime and 11 ppbv fora 5-day lifetime. While these NOx mixing ratios were 10–20 times less than the lightning NOx mixing ratios theyproduced disproportionately more ozone because of thegreater ozone production efficiency at lower NOx mixingratios. Regardless of NOx lifetime these emissions accountfor less than half of the ozone enhancement above Hous-ton. In reality the nonlightning NOx does not produceozone independently from the lightning NOx. Ozone pro-duction from lightning NOx and nonlightning NOx aboveHouston cannot simply be added together because of thenonlinearity of ozone production and the reduced ozoneproduction efficiency at higher NOx mixing ratios. Thenonlightning NOx is dispersed into the upper tropospherethat is already dominated by lightning NOx emissions.Because the NOx molecules from the different sourcescollectively reduce the ozone production efficiency in thisenvironment, lightning NOx and nonlightning NOx shouldbe treated as equally productive on a per molecule basis
Figure 13. Distributions of measured NOx (blue) from theDC8 above eastern North America during 1 July to15 August 2004 and the corresponding FLEXPART light-ning NOx tracer values (red). Shown are the median values(solid lines) and the 10th and 90th percentiles (dashed lines)with modeled NOx lifetimes of (a) 1 day, (b) 2 days, and(c) 4 days.
D24S05 COOPER ET AL.: NORTH AMERICAN UPPER TROPOSPHERIC OZONE
16 of 19
D24S05
and we come back to our broad estimate of lightning NOx
being responsible for 69–84% of the ozone enhancementabove eastern North America (as described at the begin-ning of section 4).[57] Moxim and Levy [2000] conducted a chemical trans-
port model study of ozone above the tropical South AtlanticOcean. They found that the upper tropospheric ozonemaximum above this region was dominated by ozoneproduction from lightning NOx in conjunction with CO/CH4 chemistry. They suggested an ozone maximum wouldhave existed in this region in preindustrial times. Alongthese lines we suggest that an upper tropospheric ozoneenhancement would have existed above eastern NorthAmerica during preindustrial times because of ozone pro-duction from lightning NOx and background mixing ratiosof CO and CH4. While such an analysis is beyond the scopeof this paper we speculate that the ozone enhancementwould have been smaller than the present-day enhancementbecause of the greatly reduced anthropogenic emissions ofNOx, CO and CH4.
5. Conclusions
[58] This study assembled the most comprehensive set ofozone measurements ever collected in the free troposphereabove midlatitude North America during a single season.By focusing on measurements taken only in the troposphereand by calculating and subtracting the influence from agedstratospheric intrusions (up to 20 days old) we produced adata set of tropospheric residual ozone values across thestudy region. On average the upper troposphere abovemidlatitude eastern North America contained 15 ppbv moretropospheric residual ozone than the more polluted layerbetween the surface and 2 km above sea level (Figure 4c).Furthermore the upper troposphere above midlatitude east-ern North America contained 16 ppbv more troposphericresidual ozone than the upper troposphere above 3 upwindsites, with the greatest enhancement above Houston at24 ppbv (Figure 7d). Our detailed simulation of lightningNOx emissions tied to the exact times and locations of actualcloud-to-ground lightning flashes across North Americashows that lightning is the dominant source of NOx in theupper troposphere. Overall, we estimate that 69–84% (11–13 ppbv) of the 16 ppbv ozone enhancement above easternNorth America is due to in situ ozone production fromlightning NOx with the remainder due to transport of ozonefrom the surface or in situ ozone production from othersources of NOx.[59] This study contains several sources of uncertainty,
greatest of which are the lightning NOx emission rate andthe lifetime of NOx in the upper troposphere, and we havebeen careful to take the variability of these values intoaccount. We have provided some broad estimates of thelightning NOx contribution to the widespread upper tropo-spheric ozone enhancement across eastern North America,and additional chemical transport model studies and meas-urements are required to refine the quantification of thecontribution of lightning NOx to the upper troposphericozone enhancement for the individual measurement sta-tions. However, some confirmation of our results is providedby a recent study that showed great foresight into theexistence of the upper tropospheric ozone maximum above
Texas. Li et al. [2005] used a global-scale chemical trans-port model to simulate ozone production above NorthAmerica for the summer of 2000. They predicted that anozone maximum would be present in the upper troposphereabove the south-central USA as a result of convectivelofting of surface ozone, and in situ production by anthro-pogenic NOx, lightning NOx, and formaldehyde producedfrom surface isoprene emissions. Long residence times inthe upper troposphere due to the recirculation in thesemipermanent summertime anyticyclone would allow forozone production over several days. Ozone measurementswere limited for the study period and only 6 profiles aboveHuntsville, Alabama were available to validate the simula-tion. Interestingly, the authors found that they had toincrease the model-generated lightning NOx by a factor of4 above the standard simulation to make the model matchthe ozonesonde measurements, indicating the importance oflightning NOx in this region. Our tropospheric residualozone distribution across the North American upper tropo-sphere confirms the modeling results of Li et al. [2005], withmuch of the ozone distribution related to the recirculation inthe upper tropospheric anticyclone centered over southernNorth America. However, we place greater emphasis on therole of lightning NOx in producing the ozone enhancement.[60] While this study has revealed an upper tropospheric
ozone maximum centered above Houston we only knowthat its production begins somewhere east of the westcoast and somewhere north of Caracas, Venezuela.Additional ozone profiles are required in western NorthAmerica and south of the USA to identify where theozone maximum begins. Another key site on the westcoast would be the southern coast of British Columbia todetermine if Trinidad Head and Table Mountain are trulyrepresentative of air flowing into western North America.Profiles in central Mexico, and at the New Mexico/Mexico border would indicate the amount of ozoneflowing into the southern USA with the North Americanmonsoon, while additional profiles in Colorado andSaskatchewan would reveal the northerly extent of thisinfluence. Finally, profiles are needed from the easternedge of the Caribbean Sea. This location would measurethe background ozone that flows from the tropical NorthAtlantic Ocean into the Gulf of Mexico and on to thesouthern USA via the North American monsoon flow,while being positioned upwind of the major NorthAmerican lightning region.
[61] Acknowledgments. The authors gratefully acknowledge thestrong support of the MOZAIC program by the European Communities,EADS, Airbus and the airlines (Lufthansa, Austrian, Air France) who havecarried the MOZAIC equipment free of charge since 1994. NLDN andLRLDN data were collected by Vaisala-Thunderstorm and supplied to us bythe Global Hydrology Resource Center (GHRC) at NASA Marshall SpaceFlight Center (MSFC). The LIS/OTD 2.5� low-resolution lightning clima-tologies (v0.1 gridded satellite data) are preliminary data sets produced bythe NASA LIS/OTD Science Team (Principal Investigator, H. J. Christian,NASA/MSFC) available from GHRC (http://ghrc.msfc.nasa.gov). GPCPprecipitation plots were made available by NASA Goddard Space FlightCenter at http://precip.gsfc.nasa.gov/. EDGAR (http://www.mnp.nl/edgar)is a product of the National Institute for Public Health and the NetherlandsOrganisation for Applied Scientific Research and is part of the GlobalEmissions Inventory Activity of IGBP/IGAC. We thank Stuart McKeen andGreg Frost at the University of Colorado/NOAA ESRL for making theNorth American NOx emission inventory available to us; Dennis Boccippioat NASA for providing the gridded IC:CG ratios; and Don Blake atUniversity of California, Irvine for providing the i-pentane data. CO on the
D24S05 COOPER ET AL.: NORTH AMERICAN UPPER TROPOSPHERIC OZONE
17 of 19
D24S05
NOAAWP-3D aircraft wasmeasured and kindly provided by JohnHollowayat NOAA ESRL, and ozone on the same aircraft was kindly provided byTom Ryerson, NOAA ESRL. Finally, we thank two anonymous refereesand Rynda Hudman, Harvard University; Heidi Huntrieser, DeutschesZentrum Fur Luft- und Raumfahrt; and Adrian Tuck, NOAA ESRL, fortheir helpful comments.
ReferencesBeirle, S., et al. (2006), Estimating the NOx produced by lightning fromGOME and NLDN data: A case study in the Gulf of Mexico, Atmos.Chem. Phys., 6, 1075–1089.
Boccippio, D. J., K. L. Cummins, H. J. Christian, and S. J. Goodman(2001), Combined satellite- and surface-based estimation of the intra-cloud-cloud-to-ground lightning ratio over the continental United States,Mon. Weather Rev., 129, 108–122.
Brunner, D., J. Staehelin, D. Jeker, and H. Wernli (2001), Nitrogen oxidesand ozone in the tropopause region of the Northern Hemisphere: Mea-surements from commercial aircraft in 1995/1996 and 1997, J. Geophys.Res., 106, 27,673–27,699.
Cleary, P. A., P. J. Wooldridge, and R. C. Cohen (2002), Laser-inducedfluorescence detection of atmospheric NO2 with a commercial diode laserand a supersonic expansion, Appl. Opt., 41, 6950–6956.
Chameides, W. L., D. H. Stedman, R. R. Dickerson, D. W. Rusch, and R. J.Cicerone (1977), NOx production in lightning, J. Atmos. Sci., 34, 143–149.
Christian, H. J., et al. (2003), Global frequency and distribution of lightningas observed from space by the Optical Transient Detector, J. Geophys.Res., 108(D1), 4005, doi:10.1029/2002JD002347.
Colman, J. J., A. L. Swanson, S. Meinardi, B. C. Sive, D. R. Blake, and F. S.Rowland (2001), Description of the analysis of a wide range of volatileorganic compounds in whole air samples collected during PEM-TropicsA and B, Anal. Chem., 73(15), 3723–3731, doi:10.1021/ac010027g.
Cooper, O. R., J. L. Moody, D. D. Parrish, M. Trainer, T. B. Ryerson, J. S.Holloway, G. Hubler, F. C. Fehsenfeld, and M. J. Evans (2002), Trace gascomposition of midlatitude cyclones over the western North AtlanticOcean: A conceptual model, J. Geophys. Res., 107(D7), 4056,doi:10.1029/2001JD000901.
Cooper, O. R., et al. (2005a), A springtime comparison of troposphericozone and transport pathways on the east and west coasts of the UnitedStates, J. Geophys. Res., 110, D05S90, doi:10.1029/2004JD005183.
Cooper, O. R., et al. (2005b), Direct transport of midlatitude stratosphericozone into the lower troposphere and marine boundary layer of the tro-pical Pacific Ocean, J. Geophys. Res., 110, D23310, doi:10.1029/2005JD005783.
DeCaria, A. J., K. E. Pickering, G. L. Stenchikov, and L. E. Ott (2005),Lightning-generated NOx and its impact on tropospheric ozone produc-tion: A three-dimensional modeling study of a Stratosphere-TroposphereExperiment: Radiation, Aerosols and Ozone (STERAO-A) thunderstorm,J. Geophys. Res., 110, D14303, doi:10.1029/2004JD005556.
Emanuel, K. A., and M. Zivkovic-Rothman (1999), Development and eva-luation of a convection scheme for use in climate models, J. Atmos. Sci.,56, 1766–1782.
Fiore, A. M., D. J. Jacob, and J. A. Logan (1998), Long-term trends inground level ozone over the contiguous United States, 1980–1995,J. Geophys. Res., 103, 1471–1480.
Fiore, A. M., D. J. Jacob, B. D. Field, D. G. Streets, S. D. Fernandes, andC. Jang (2002), Linking ozone pollution and climate change: The case forcontrolling methane, Geophys. Res. Lett., 29(19), 1919, doi:10.1029/2002GL015601.
Fishman, J., and A. E. Balok (1999), Calculation of daily troposphericozone residuals using TOMS and empirically improved SBUV measure-ments: Application to an ozone pollution episode over the eastern UnitedStates, J. Geophys. Res., 104, 30,319–30,340.
Fishman, J., C. E. Watson, J. C. Larsen, and J. A. Logan (1990), Distribu-tion of troposphere ozone determined from satellite data, J. Geophys.Res., 95, 3599–3617.
Forster, C., A. Stohl, P. James, and V. Thouret (2003), The residence timesof aircraft emissions in the stratosphere using a mean emission inventoryand emissions from actual flight tracks, J. Geophys. Res., 108(D12),8524, doi:10.1029/2002JD002515.
Forster, C., A. Stohl, and P. Seibert (2006), Parameterization of convectivetransport in a Lagrangian particle dispersion model and its evaluation,J. Appl. Meteorol. Clim., in press.
Frost, G. J., et al. (2006), Effects of changing power plant NOx emissionson ozone in the eastern United States: Proof of concept, J. Geophys. Res.,111, D12306, doi:10.1029/2005JD006354.
Grogan, M. J. (2004), Report on the 2002–2003 US NLDN system-wideupgrade, Vaisala Thunderstorm, Tuscon, Ariz. (Available at http://www.vaisala.com/businessareas/measurementsystems/thunderstorm/knowledgecenter/aboutnldn)
Huntrieser, H., H. Schlager, C. Feigl, and H. Holler (1998), Transport andproduction of NOx in electrified thunderstorms: Survey of previous stu-dies and new observations at midlatitudes, J. Geophys. Res., 103(D21),28,247–28,264.
Huntrieser, H., et al. (2002), Airborne measurements of NOx, tracer species,and small particles during the European Lightning Nitrogen Oxides Ex-periment, J. Geophys. Res. , 107(D11), 4113, doi:10.1029/2000JD000209.
Intergovernmental Panel on Climate Change (2001), Climate Change 2001:The Scientific Basis—Contribution of Working Group I to the Third As-sessment Report of the Intergovernmental Panel on Climate Change,edited by J. T. Houghton et al., 881 pp., Cambridge Univ. Press, NewYork.
Jaegle, L., D. J. Jacob, Y. Wang, A. J. Weinheimer, B. A. Ridley, T. L.Campos, G. W. Sachse, and D. E. Hagen (1998), Sources and chemistryof NOx in the upper troposphere over the United States, Geophys. Res.Lett., 25, 1705–1708.
Levy, H., II, W. J. Moxim, A. A. Klonecki, and P. S. Kasibhatla (1999),Simulated tropospheric NOx: Its evaluation, global distribution and in-dividual source contributions, J. Geophys. Res., 104, 26,279–26,306.
Li, Q., et al. (2002), Transatlantic transport of pollution and its effects onsurface ozone in Europe and North America, J. Geophys. Res., 107(D13),4166, doi:10.1029/2001JD001422.
Li, Q., D. J. Jacob, J. W. Munger, R. M. Yantosca, and D. D. Parrish (2004),Export of NOy from the North American boundary layer: Reconcilingaircraft observations and global model budgets, J. Geophys. Res., 109,D02313, doi:10.1029/2003JD004086.
Li, Q., D. J. Jacob, R. Park, Y. Wang, C. L. Heald, R. Hudman, R. M.Yantosca, R. V. Martin, and M. Evans (2005), North American pollutionoutflow and the trapping of convectively lifted pollution by upper-levelanticyclone, J. Geophys. Res., 110, D10301, doi:10.1029/2004JD005039.
McDermid, I. S., G. Beyerle, D. A. Haner, and T. Leblanc (2002), Redesignand improved performance of the tropospheric ozone lidar at the JetPropulsion Laboratory Table Mountain Facility, Appl. Opt., 41, 7550–7555.
Merrill, J. T., and J. L. Moody (1996), Synoptic meteorology and transportduring the North Atlantic Regional Experiment (NARE) intensive: Over-view, J. Geophys. Res., 101, 28,903–28,921.
Moody, J. L., J. C. Davenport, J. T. Merrill, S. J. Oltmans, D. D. Parrish, J. S.Holloway, H. Levy, G. L. Forbes, M. Trainer, and M. Buhr (1996),Meteorological mechanisms for transporting O3 over the western NorthAtlantic ocean: A case study for August 24–29, 1993, J. Geophys. Res.,101, 29,213–29,227.
Mortlock, A. M., and R. Van Alstyne (1998), Military, charter, unreporteddomestic traffic and general aviation: 1976, 1984, 1992, and 2015 emis-sion scenarios, NASA CR-1998-207639. (Available at http://ntrs.nasa.gov/archive/nasa/casi.ntrs.nasa.gov/19980047346_1998120131.pdf)
Moxim, W. J., and H. Levy II (2000), A model analysis of he tropical SouthAtlantic Ocean tropospheric ozone maximum: The interaction of trans-port and chemistry, J. Geophys. Res., 105, 17,393–17,415.
Nedelec, P., J.-P. Cammas, V. Thouret, G. Athier, J.-M. Cousin, C. Legrand,C. Abonnel, F. Lecoeur, G. Cayez, and C. Marizy (2003), An improvedinfrared carbon monoxide analyser for routine measurements aboardcommercial Airbus aircraft: technical validation and first scientificresults of the MOZAIC III programme, Atmos. Chem. Phys., 3, 1551–1564.
Newchurch, M. J., M. A. Ayoub, S. Oltmans, B. Johnson, and F. J.Schmidlin (2003), Vertical distribution of ozone at four sites in the UnitedStates, J. Geophys. Res., 108(D1), 4031, doi:10.1029/2002JD002059.
Olivier, J. G. J., and J. J. M. Berdowski (2001), Global emissions sourcesand sinks, in The Climate System, edited by J. Berdowski, R. Guicherit,and B. J. Heij, pp. 33–78, A. A. Balkema, Brookfield, Vt.
Olson, J. R., et al. (2005), An examination of photochemical theory basedon INTEX-NA observations, Eos Trans. AGU, 86(52), Fall Meet. Suppl.,Abstract A51C-0063.
Olson, J. R., J. H. Crawford, G. Chen, W. H. Brune, I. C. Faloona, D. Tan,H. Harder, and M. Martinez (2006), A reevaluation of airborne HOxobservations from NASA field campaigns, J. Geophys. Res., 111,D10301, doi:10.1029/2005JD006617.
Orville, R. E., G. R. Huffines, W. R. Burrows, R. L. Holle, and K. L.Cummins (2002), The North American Lightning Detection Network(NALDN)—First results: 1998–2000, Mon. Weather Rev., 130, 2098–2109.
Pickering, K. E., Y. Wang, W.-K. Tao, C. Price, and J.-F. Muller (1998),Vertical distributions of lightning NOx for use in regional and globalchemical transport models, J. Geophys. Res., 103(D23), 31,203 –31,216.
Pierce, T., C. Geron, L. Bender, R. Dennis, G. Tonneson, and A. Guenther(1998), Influence of increased isoprene emissions on regional ozonemodeling, J. Geophys. Res., 103, 25,611–25,629.
D24S05 COOPER ET AL.: NORTH AMERICAN UPPER TROPOSPHERIC OZONE
18 of 19
D24S05
Rakov, V. A., and M. A. Uman (2003), Lightning: Physics and Effects, 687pp., Cambridge Univ. Press, New York.
Ridley, B. A., J. G. Walega, J. E. Dye, and F. E. Grahek (1994), Distribu-tions of NO, NOx, NOy and O3 to 12 km altitude during the summermonsoon season over New Mexico, J. Geophys. Res., 99, 25,519–25,534.
Ridley, B., et al. (2004), Florida thunderstorms: A faucet of reactive nitro-gen to the upper troposphere, J. Geophys. Res., 109, D17305,doi:10.1029/2004JD004769.
Ridley, B. A., K. E. Pickering, and J. E. Dye (2005), Comments on theparameterization of lightning-produced NO in global chemistry-transportmodels, Atmos. Environ., 39, 6184–6187.
Singh, H. B., et al. (1996), Reactive nitrogen and ozone over the westernPacific: Distribution, partitioning, and sources, J. Geophys. Res., 101,1793–1808.
Stith, J., J. Dye, B. Ridley, P. Laroche, E. Defer, K. Baumann, G. Hubler,R. Zerr, and M. Venticinque (1999), NO signatures from lightningflashes, J. Geophys. Res., 104, 16,081–16,090.
Stohl, A., M. Hittenberger, and G. Wotawa (1998), Validation of the La-grangian particle dispersion model FLEXPART against large scale tracerexperiment data, Atmos. Environ., 32, 4245–4264.
Stohl, A., C. Forster, S. Eckhardt, N. Spichtinger, H. Huntrieser, J. Heland,H. Schlager, H. Aufmhoff, F. Arnold, and O. Cooper (2003), A backwardmodeling study of intercontinental pollution transport using aircraft mea-surements, J. Geophys. Res., 108(D12), 4370, doi:10.1029/2002JD002862.
Stohl, A., C. Forster, A. Frank, P. Seibert, and G. Wotowa (2005), Technicalnote: The Lagrangian particle dispersion model FLEXPART version 6.2,Atmos. Chem. Phys., 5, 2461–2474.
Sutkus, D. J., Jr., S. L. Baughcum, and D. P. DuBois (2001), Scheduledcivil aircraft emission inventories for 1999: Database development andanalysis, NASA/CR-2001-211216.
Tarasick, D. W., V. E. Fioletov, D. I. Wardle, J. B. Kerr, and J. Davies(2005), Changes in the vertical distribution of ozone over Canada fromozonesondes: 1980–2001, J. Geophys. Res., 110, D02304, doi:10.1029/2004JD004643.
Thornton, J. A., P. J. Wooldridge, and R. C. Cohen (2000), AtmosphericNO2: In situ laser-induced fluorescence detection at parts per trillionmixing ratios, Anal. Chem., 72, 528–539.
Thouret, V., A. Marenco, J. A. Logan, P. Nedelec, and C. Grouhel (1998),Comparisons of ozone measurements from the MOZAIC airborne pro-gram and the ozone sounding network at eight stations, J. Geophys. Res.,103, 25,695–25,720.
Tuck, A. F. (1976), Production of nitrogen oxides by lightning discharges,Q. J. R. Meteorol. Soc., 102, 749–755.
Yienger, J. J., and H. Levy II (1995), Empirical model of global soil-biogenic NOx emissions, J. Geophys. Res., 100, 11,447–11,464.
Zipser, E. J., D. J. Cecil, C. Liu, S. W. Nesbitt, and D. P. Yorty (2006),Where are the most intense thunderstorms on Earth?, Bull. Am. Meteorol.Soc., 87, 1057–1071.
�����������������������S. L. Baughcum, Boeing Company, Seattle, WA 98124, USA.T. H. Bertram, R. C. Cohen, A. Perring, and P. Wooldridge, Department
of Chemistry, University of California, Berkeley, CA 94720, USA.C. C. Brown, G. Chen, and J. H. Crawford, NASA Langley Research
Center, Hampton, VA 23681-2199, USA.W. H. Brune, X. Ren, and A. M. Thompson, Department of Meteorology,
Pennsylvania State University, University Park, PA 16802, USA.O. R. Cooper, F. C. Fehsenfeld, B. J. Johnson, S. A. McKeen, J. F.
Meagher, S. J. Oltmans, and M. Trainer, NOAA Earth System ResearchLaboratory, Chemical Sciences Division, Theoretical Aeronomy Branch,CSD04, 325 Broadway, Boulder, CO 80305, USA. ([email protected])G. Forbes, Meteorological Service of Canada, Sable Island, NS, Canada
B3J 2L4.T. Leblanc and I. S. McDermid, Table Mountain Facility, Jet Propulsion
Laboratory, California Institute of Technology, Wrightwood, CA 92397,USA.J. Merrill, Graduate School of Oceanography, University of Rhode
Island, Narragansett, RI 02882, USA.J. L. Moody, Department of Environmental Sciences, University of
Virginia, Charlottesville, VA 22093, USA.G. Morris, Department of Physics and Astronomy, Valparaiso University,
Valparaiso, IN 46383, USA.P. Nedelec, Laboratoire d’Aerologie, Centre National de la Recherche
Scientifique, Observatoire Midi-Pyrenees, F-31400 Toulouse, France.M. J. Newchurch, Atmospheric Science Department, University of
Alabama, Huntsville, AL 35805, USA.K. E. Pickering, Laboratory for Atmospheres, NASA Goddard Space
Flight Center, Greenbelt, MD 20771, USA.F. J. Schmidlin, Wallops Flight Facility, NASA Goddard Space Flight
Center, Wallops Island, VA 23337, USA.N. Spichtinger, Department of Ecology, Technical University of Munich,
D-80333 Freising-Weihenstephan, Germany.A. Stohl, Norwegian Institute for Air Research, N-2027 Kjeller, Norway.D. Tarasick, Experimental Studies Research Division, Meteorological
Service of Canada, Environment Canada, Downsview, ON, Canada M3H5T4.S. Turquety, Service d’Aeronomie, Institut Pierre-Simon Laplace,
Universite Pierre et Marie Curie, F-75005 Paris, France.J. C. Witte, Science Systems and Applications, Inc., NASA Goddard
Space Flight Center, Greenbelt, MD 20770, USA.
D24S05 COOPER ET AL.: NORTH AMERICAN UPPER TROPOSPHERIC OZONE