5.1 LARGE WILDFIRE GROWTH INFLUENCED BY TROPOSPHERIC AND STRATOSPHERIC DRY SLOTS IN THE UNITED STATES FRED J. SCHOEFFLER U.S. FOREST SERVICE COCONINO NATIONAL FOREST FLAGSTAFF, ARIZONA Abstract Dry slots are responsible for rapid surface drying and increased gusty winds causing increased wildland fire behavior in the United States (U.S.). There are several research papers dealing with fire weather and wildland fires in the U.S. However, few of them address the actual influence of dry slots in wildland fire weather. Therefore, a reexamination and reevaluation of the previously published research regarding wildfires explicitly influenced by dry slots is approached from the perspective of a wildland fire supervisor for utilizing more water vapor satellite imagery (WVI) toward improved operational wildland fire weather meteorology in the U.S. It is generally accepted that operational wildland fire weather forecasting in the U.S. is an important facet of mesoscale and synoptic meteorology. Indeed, the very first Standard Firefighting Order deals precisely with weather – “Keep informed on fire weather conditions and forecasts.” Moreover, two of the 18 Watch Out Situations deal specifically with temperature/dryness and winds. It is well documented in the available wildland fire weather literature that surfacing lower-stratospheric and mid- to upper-tropospheric weather is responsible for dry air intrusions and descending dry air. Most times, these dry intrusions manifest themselves as clearly visible dark bands in the satellite water vapor imagery, referred to as dry slots. These dry slots usually result in abrupt surface drying and strong, gusty winds often radically influencing wildland fire behavior and hence fire growth. These phenomena can be significant safety issues for fire managers, especially for those fireline supervisors and firefighters on or near active firelines. The same issues very well apply to active prescribed and/or controlled burns. Therefore, accurate and timely dry slot recognition and warnings clearly address the rules in the Standard Firefighting Orders and would allow for better recognition and mitigation of the 18 Watch Out Situations. Dry slots are particularly well documented for Australian wildfires thanks to the work of Dr. Graham Mills and others. Due in large part to their research and efforts, the Australian Bureau of Meteorology (BoM) regularly utilizes dry slot forecasting and nowcasting on a regular basis during their bushfire seasons. In fact, they even utilize a 'dry slot poster' to better educate and inform their fire managers to 'beware the dry slot.' However, little is known or documented for such dry slot occurrences in the U.S. In the cases examined, taken from the existing literature, it will be shown that several wildland fires in the U.S. have in fact been influenced by these dry slots resulting in extreme and unusual fire behavior and large wildfire growth. One of the issues addressed by the author is the fact that the 'dry slot' term is not very well utilized in the U.S. and there as many as thirty synonymous expressions used in the relevant literature. *Corresponding author address: Fred J. Schoeffler, P.O. Box 446, Pine, Arizona 85544 email:[email protected]
Transcript
5.1
LARGE WILDFIRE GROWTH
INFLUENCED BY
TROPOSPHERIC AND STRATOSPHERIC
DRY SLOTS IN THE UNITED STATES
FRED J. SCHOEFFLER U.S. FOREST SERVICE
COCONINO NATIONAL FOREST FLAGSTAFF, ARIZONA
Abstract
Dry slots are responsible for rapid surface drying and increased gusty winds causing increased wildland fire behavior in the United States (U.S.). There are several research papers dealing with fire weather and wildland fires in the U.S. However, few of them address the actual influence of dry slots in wildland fire weather. Therefore, a reexamination and reevaluation of the previously published research regarding wildfires explicitly influenced by dry slots is approached from the perspective of a wildland fire supervisor for utilizing more water vapor satellite imagery (WVI) toward improved operational wildland fire weather meteorology in the U.S. It is generally accepted that operational wildland fire weather forecasting in the U.S. is an important facet of mesoscale and synoptic meteorology. Indeed, the very first Standard Firefighting Order deals precisely with weather – “Keep informed on fire weather conditions and forecasts.” Moreover, two of the 18 Watch Out Situations deal specifically with temperature/dryness and winds. It is well documented in the available wildland fire weather literature that surfacing lower-stratospheric and mid- to upper-tropospheric weather is responsible for dry air intrusions and descending dry air. Most times, these dry intrusions manifest themselves as clearly visible dark bands in the satellite water vapor imagery, referred to as dry slots. These dry slots usually result in abrupt surface drying and strong, gusty winds often radically influencing wildland fire behavior and hence fire growth. These phenomena can be significant safety issues for fire managers, especially for those fireline supervisors and firefighters on or near active firelines. The same issues very well apply to active prescribed and/or controlled burns. Therefore, accurate and timely dry slot recognition and warnings clearly address the rules in the Standard Firefighting Orders and would allow for better recognition and mitigation of the 18 Watch Out Situations. Dry slots are particularly well documented for Australian wildfires thanks to the work of Dr. Graham Mills and others. Due in large part to their research and efforts, the Australian Bureau of Meteorology (BoM) regularly utilizes dry slot forecasting and nowcasting on a regular basis during their bushfire seasons. In fact, they even utilize a 'dry slot poster' to better educate and inform their fire managers to 'beware the dry slot.' However, little is known or documented for such dry slot occurrences in the U.S. In the cases examined, taken from the existing literature, it will be shown that several wildland fires in the U.S. have in fact been influenced by these dry slots resulting in extreme and unusual fire behavior and large wildfire growth. One of the issues addressed by the author is the fact that the 'dry slot' term is not very well utilized in the U.S. and there as many as thirty synonymous expressions used in the relevant literature. *Corresponding author address: Fred J. Schoeffler, P.O. Box 446, Pine, Arizona 85544 email:[email protected]
the literature. First of all, wildland fire weather
influences wildland fire behavior, so obviously,
the more extreme the weather, the more
extreme the fire. Next, those authors in the
literature precisely identify the upper air
influences on these fires, and this is a focus
area that needs attention nationally in the
wildland fire weather operational meteorology
realm. However, only a few actually refer to the
sources and signatures as dry slots. Next, the
actual verification of WVI features and
signatures is good, however, the verbiage to
consistently identify them as dry slots is
somewhat lacking, albeit there is undeniably
improvement here. There are more than 30
synonymous terms for dry slots used in the
United States. Lastly, Charney (2007) and
Charney and Keyser (2010) have very
perceptively stated the importance of
researching “atmospheric conditions aloft” for
establishing better and “more accurate fire
weather and fire behavior predictions” expressly
for those potentially extreme and erratic fire
behavior stages (2007, 2010). They accurately
recognize the importance of such structures as
dry slots “predictable hours or even days in
advance of the event” (2007, 2010). In the long
run, they seek to “develop and implement
indices and diagnostics into the operational fire
weather and fire behavior forecasting that sense
these conditions and communicate to the
forecasters and the operational users of fire
weather prediction when and where the potential
exists for extreme fire behavior” (all emphasis
added) (2007 and 2010). From the author’s
perspective, satellite water vapor imagery and
dry slots align very well with their notions.
There are basically two themes to this paper:
one, that dry slots are both an indicator and a
source of dry air influencing wildland fire
weather and fire behavior and two, that satellite
WVI is a useful tool for identifying these dry
slots. The structure of the paper is as follows: To
begin with, the author will list over a dozen U.S.
wildland fires affected by dry slots and upper air
influences examined in the U.S. literature; four
of them will be discussed in some detail. The
following section takes into account ‘fighting fire
by the rules’ for wildland fire engagement.
Considered next will be those wildland fires
examined in the literature, concentrating
primarily on the mid- and upper-air influences.
Each fire case study will briefly address the
fuels, topography, and fire behavior; however,
the principal focus will be on the meteorological
conditions, mainly dry slots and dry intrusions
that influenced these wildland fires. And followed
by a brief review of the 2011 Wildland Fire
Weather: Multi-Agency Portfolio of Current and
In-Development Capabilities to Support User
Needs. Next, both positive and negative reviews
and comments regarding WVI in the literature
are addressed. And the final section consists of
some discussion and conclusions, including
potential implications of the results of this study
for real-time fire-weather forecasting and future
research in the areas addressed.
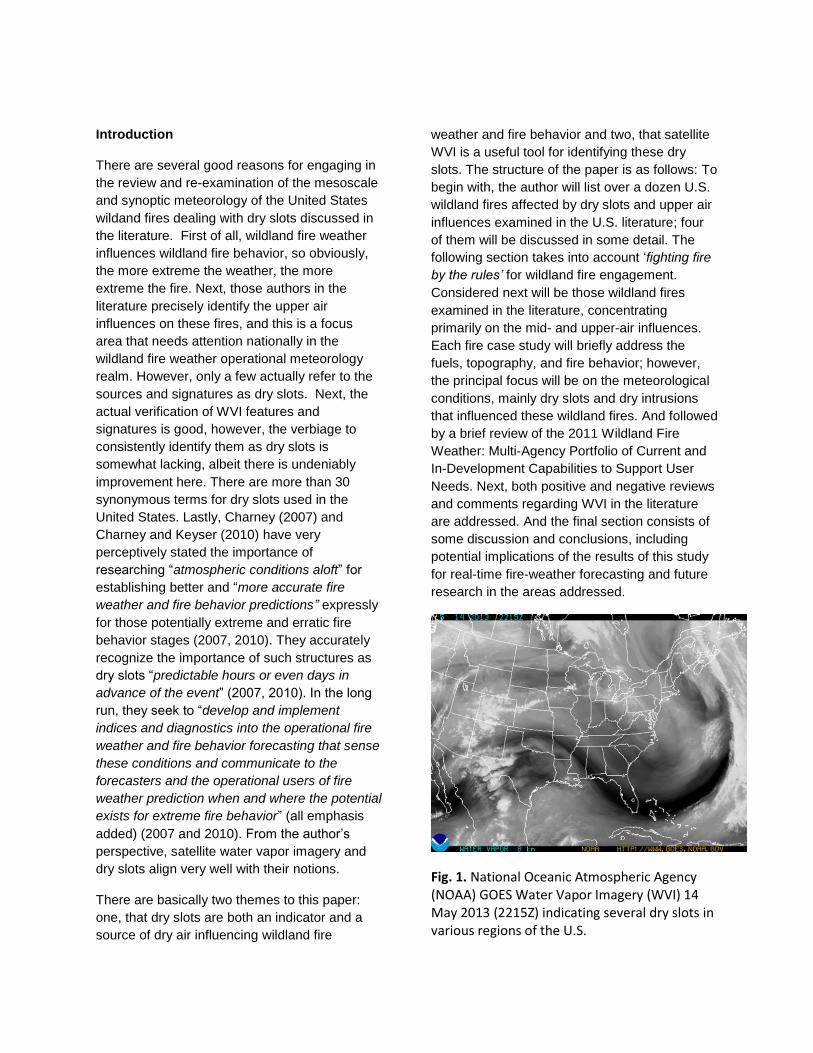
Fig. 1. National Oceanic Atmospheric Agency (NOAA) GOES Water Vapor Imagery (WVI) 14 May 2013 (2215Z) indicating several dry slots in various regions of the U.S.
Consider the dry slot signatures shown in Figure 1. Revealed are several dry slot signatures on the 14 May 2013, Geostationary Operational Environmental Satellite (GOES) WVI. Notice the wide dry slot advecting through South Dakota and into Minnesota and Wisconsin in the northern United States (U.S). This broad dry slot influenced fire weather and fire behavior on several large wildfires in several of the Great Lakes States at the time. Careful examination of the image also reveals a narrow dry slot advecting through Oregon, Idaho, Montana, and North Dakota that spawned numerous Red Flag and wind warnings in those states. In addition, notice the well-defined, elongated southern dry slot that produced Red Flag Warnings in many of those influenced states. All-in-all, this image relates a busy day for dry slots in the U.S. Dry Slots, Dry Intrusions, and Satellite WVI
As shown in Figure 1, dry slots show up as “dark
bands, filaments, or tongues” of very dry air in
satellite WVI between 600 mb to 300 mb
concluded Weldon and Holmes (1991). High-
altitude moisture areas appear cold (bright -
white), and areas where upper-levels are dry
appear warm (dark) in Weldon and Holmes
(1991). Dry slots tend to be associated with
middle tropospheric thermal troughs, e.g.
Weldon and Holmes (1991). The vertical -
structure of dry slots indicates that the genesis
of this dry, high-momentum air is in the mid- to
upper-troposphere and/or the lower-
stratosphere, discovered by e.g. Charney (2007)
and they manifest themselves quite distinctly in
the WVI, e.g. Weldon and Holmes (1991). If the
dark area has a well-defined definite boundary,
the very dry air most likely extends to the
lowest altitudes adjacent to the distinct
boundary in Weldon and Holmes (1991).
Commonly, the dark zones of the dry slot
category are vertically deep with dry air
extending downward to near the surface as
documented by Weldon and Holmes (1991). Dry
slots can be inferred from skew-T soundings,
according to e.g. Smarsh (1994), however, they
are best visible by means of satellite WVI where
you can actually ‘see’ the dry slot signature.
Identifying dry slots can provide fire weather
forecasters with beneficial nowcasting and
forecasting advice for verifying National
Weather Predictions (NWP) as well as Fire
Weather predictions. It is recommended that
the dry slots should be corroborated with
sounding data to verify if they are truly the
source and indicator of dry, windy, and unstable
conditions concluded Watcher (2012-2013). The
author has researched and experienced
numerous wildland fires, both professionally
and those archived in the Wildland Fire Lessons
Learned Center (LLC) Incident Reviews - where
the “humidity dropped like a rock” and the fire
behavior increased as presented in Schoeffler
(2010). The author found that those numerous
experienced-fire-weather-events most often
indicated that the fire weather and resultant
fire behavior were indeed influenced by low to
very low relative humidities and dewpoints, as
well as gusty winds (2010). In almost all the
researched cases, dry slots were found to be a
causal and coincident mechanism and indicator
of extreme wildland fire weather, as also
determined in e.g. Kaplan et al. (2008) and
Schoeffler (2010).
Dry Slots: Causes – Contributing Factors
Precursors – Indicators – Outcomes
A brief examination of the causes, contributing
factors, precursors, indicators, and outcomes of
dry slots addressed by all the U.S. fire weather
researchers is useful. These will be explained
and detailed to some extent as they are
introduced into the discussion: Dry slots are
basically columns of high, fast moving, dry air
that descend rapidly to or near the Earth’s
surface affecting surface drying and intensifying
the winds in Mills (2010) and Werth (2012).
Generally, the darker the dry slot, the lower the
humidity, discerned in e.g. Weldon and Holmes
(1991). A common exception to this is with the
color-enhanced imagery. In one variety, the
driest signatures progressed from brownish to
copper, and then to black; somewhat similar in
the yellowish-orange style. Weldon and Holmes
(1991) recognized that each water vapor image
is “unique” and they suggest using a sequence
of previous images or images viewed in a time-
lapse motion for better interpretation.
Different types of problem dry slots are
associated with Critical Fire Weather Patterns
examined in the publication generated at the
NWS Fire Weather Forecasters Course in Boise,
ID from March 30 to April 2, 1999 (e.g. pre-
frontal, and post-frontal, the breakdown of
upper level ridges, foehn winds, low-level jet
entrance and exit regions, and in advance of
tropical storms), and these were also examined
by Schroeder (1969); Brotak et al. (1977); Mills
(2006); Prevedel (2007); Werth (2012), and
others.
This 1999 NWS publication suggested using WVI
to locate dark areas (dry slots) as potentially
moderate to high Haines Index regions. The
Haines Index is based on the stability and
moisture content of the lower atmosphere and
it measures the potential for existing fires to
become large (Haines 1988). Ratings are from 2
(moist, stable lower atmosphere) to 6 (dry,
unstable lower atmosphere). Most fires get
large during Haines Index of 5-6 (e.g. Haines
1988, Werth et al. 2011). Werth holds that
surfacing dry slots almost always result in
Haines of 5 or 6 (2012). Saltenberger and Barker
also found similar indicators on the 1990
Awbrey Hall Fire (1993). The NWS publication
also recommended to examine the WVI very
carefully for totally black areas, since these
black regions (dry slots) are frequently
associated with a 5/6 Haines Index (1999).
Prevedel (2007) also discovered this dry slot
and Haines 5/6 connection. It is especially
noteworthy that the NWS publication also
cautioned to be on the look-out for “light gray
(i.e. moist) zones,” because these can actually
be Haines 5/6 areas. Weldon and Holmes refer
to these as “grade shades” in the “gray shade
scale” (1991). They further added that there are
multiple layers of moisture with dry layers
between them likely through the troposphere
(1991). Weldon and Holmes concluded that
“gray shade differences and patterns can be
seen within the relatively dark region.” As a
result, these gray shade scale images can range
from light, to medium, to dark; and they further
discovered that “significant gray shade
differences were observed … when the air is
relatively dry at middle levels” (1991) (all
emphasis added).
It has been revealed that satellite imagery will
reveal structures not detected by conventional
data, in e.g. Muller and Fuelberg (1990). It is
quite significant that dry slots and dry intrusions
are often evident in WVI almost a full day
before being realized in infrared or visible
imagery, suggested by e.g. Muller and Fuelberg
(1990). They most likely occur in mid-afternoon,
especially on hot days in Mills (2006a) and
Miretzky (2009). Dry slots are not well predicted
by computer modeling as concluded by Werth
(2012). Out of a total of 232 “abrupt drying
events,” Mills found that 70% occurred with
troughs, dry cold front passages, and/or were
co-located with jet streams. In Australia, cold
fronts and ‘cool changes’ are basically identical
because they obviously break up the oppressive
summertime heat waves (Smith et al. 1983),
and naturally, with fire weather, the leading
concern is the same as with cold fronts -
dangerous wind shifts (e.g. Mills 2008).An
additional 20% to 30% occurred overnight or in
the early morning (2006a, 2009) and Werth
(2012).
Dry slots form during tropospheric jet stream-
induced gravity waves and they are influenced
by topographic rather than coastal stimuli in
Mills (2006a). They are influenced by mountain-
wave breaking and lee trough circulations
according to Mills (2006a). Dry slots always
reflect comparatively dry middle and upper
troposphere, as discovered by e.g. Werth
(2012). Dry slots almost always indicate
descending dry air and/or horizontal dry air
advection in e.g. James and Clark (2003) and air
parcels in the dry intrusion originate at high
tropospheric, or even stratospheric, or
tropopause fold levels in e.g. Smarsh (1994),
and then descend in the region upstream of a
developing cyclone in e.g. James and Clark
(2010).
A relative humidity decline caused by surfacing
dry slots is almost always lower than the
forecasted humidity; “surprisingly lower”
concluded Werth (2012). Dry slots are
responsible for abrupt decreased in relative
humidity, dewpoints, and ultimately fuel
moistures as discovered by e.g. Mills (2008,
2008a, 2009) and strong, gusty winds in Mills
(2005b). They can cause rapid, sustained
increased fire behavior discovered in e.g. Mills
(2005b) and Saltenberger and Barker (1993).
Whether or not dry slots affect wildland fire
behavior is solely determined by the dry air
surfacing and/or near-surfacing resulting in
unusually low relative humidity concluded by
e.g. Werth (2012). It is the development of a
deep, statically neutral boundary layer that
contributes to the link between mid-
tropospheric dry slots and the surface in e.g.
Mills (2008, 2008a). The source of the
extremely dry air associated with the abrupt
surface drying is a band of mid- to upper-
tropospheric dry air that could be associated
with identifiable dark (dry) features in the WVI
in e.g. Mills (2005, 2008a), Prevedel (2007), and
Charney (2007).
Dry slots appear to “pulse” in the WVI. Kaplan
et al. (2008) discussed “two separate drying
pulses” that occurred on the Double Trouble
State Park wildfire in New Jersey in 2002. When
sinking motions occurred, a subsidence layer
and a corresponding dry slot were found and
relative humidity minima followed as examined
in Smarsh (1994).
And lastly, Miretzky (2009) focused exclusively
on the wildfires in the Northeastern U.S (NEUS)
affected by subsidence, and found that there
are “reservoirs” of dry air that form just above
the Planetary Boundary Layer (PBL) (emphasis
added). This author analyzed the Miretzky NEUS
fires examined using WVI verification from the
National Climate Data Center (NCDC), Global
ISCCP B1 Browse System (GIBBS) satellite
archives from 1980 to present (not shown). The
‘reservoirs’ referenced in the Miretzky thesis
may be inferred as dry slots and/or dry
intrusions.
Fighting Fire by the Rules
On the fireline, firefighters and specifically
fireline supervisors must absolutely know,
understand, and follow the Ten Standard Fire
Orders, as well as accurately identify, heed, and
then mitigate the 18 Watch Out Situations. The
Ten Standard Firefighting Orders are essential
rules of engagement for all wildland firefighters
that must be followed on every fire (NWCG
2010). The first Standard Fire Order deals
specifically with recognizing current weather
conditions and obtaining forecasts (NWCG
2010). The third Fire Order is fully coupled to
the first Order in relation to the weather,
because it deals with basing your firefighting
actions on the current and expected fire
behavior (NWCG 2010). Fire behavior is
intricately tied to fire weather. This will all be
addressed further in the text.
Along with the Ten Standard Orders, wildland
firefighters use the 18 Watch Out Situations.
The Watch Out Situations complement the Ten
Standard Orders. Firefighters cannot violate the
18 Watch Out Situations, however, they can fail
to recognize them and/or heed their warnings
and mitigate them, hence one needs to “watch
out” (Wildland Fire LLC). As a generally
accepted practice, wildland firefighters and
fireline supervisors have used clouds as weather
indicators (e.g. altocumulus lenticularis clouds
in the morning suggest high winds aloft
surfacing later in the day). Without a doubt this
sustained practice will continue. At this point,
the author recommends utilizing satellite WVI
as another tested means to identify and discern
dry slots and dry intrusions as a new fire
weather tool and signature indicators.
As previously noted above, the applicable
wildland fire weather-related Ten Standard
Orders and the 18 Watch Out Situations will be
enumerated and briefly addressed
TEN STANDARD FIRE ORDERS - NWCG (2010)
1) Keep informed on fire weather conditions
and forecasts.
3) Base all actions on current and expected fire
behavior.
10) Fight fire aggressively, having provided for
safety first.
18 WATCH OUT SITUATIONS - NWCG (2010)
4) Unfamiliar with weather and local factors
influencing fire behavior.
5) Uninformed on strategy, tactics, and
hazards.
14) Weather is getting hotter and drier.
15) Wind increases and/or changes direction.
Almost all wildland fire injuries, burn-overs, fire
shelter deployments, and fatalities are the
result of not strictly knowing and then following
one or more of the Ten Standard Orders. This
conclusion also applies to the Watch Outs.
Failing to know, recognize and heed one or
more of the 18 Watch Out Situations as
required has been fatal. These are itemized in
sometimes painful detail in the Wildland Fire
LLC Incident Reviews. And on the flip-side,
those that do follow and heed the Standard
Orders and Watch Outs are typically safe and
effective (Wildland Fire LLC and elsewhere).
Based on professional experience, this has been
overwhelmingly true of those firefighters and
fireline supervisors that paid attention to the
weather factors influencing their fire(s) at the
time, changed tactics, disengaged, and then
utilized their established escape route(s) to
safety (Wildland Fire LLC, Schoeffler, and
elsewhere).
To mitigate these and to better follow Fire
Order numbers 1 and 3 respectively, the author
suggests utilizing the Australian BoM dry slot
fire weather nowcasting and forecasting on a
regular basis. These WVI signatures occur
worldwide on a continual basis and have
adversely influenced wildland fire behavior. It is
the predicted fire behavior that is most often
underestimated and/or unheeded, many times
resulting in tragic results as documented in the
Wildland Fire LLC Incident Reviews. Fireline
supervisors base their strategy and tactics on
accurate fire weather forecasting; so dry slot
forecasting would absolutely allow for more
accurate and timely real-time fire weather
predictions of abrupt surface and near-surface
drying and related wind events that would
adversely affect the fire behavior.
The literature reveals a full array of terms
regarding dry slots, e.g. dark bands, filaments,
streamers, tongues of dry air, and the like – at
least 30 such synonyms in the U.S. literature
alone. The dry slot designation and detection is
applied in a limited degree in weather
forecasting nationwide in the U.S. Fortunately,
it is expanding. It is used quite extensively in the
South and Southeast regions of the U.S.
National Weather Service (NWS). Recently, the
Southwestern Region and others are utilizing it
more often, but nationally there is infrequent
use overall. Logically, accurate and timely fire
weather nowcasts and forecasts using satellite
WVI are the desired outcomes of the author.
With some exceptions, fireline supervisors have
a very basic knowledge of subsidence, and
possibly even dry slots and dry air intrusions,
from their fire weather training - but rarely a
working knowledge. The author suggests that
fireline supervisors regularly view WVI on the
firelines when they are safely able to, in order
to be aware of any dry slots approaching their
fire area. This possibility is especially within
their reach in this day and age due to the
advent and accessibility of wireless technology;
and yes, especially while on the firelines. Yet,
the preferred option according to Mills would
be for trained meteorologists to identify these
dry slot signatures and drying events and then
broadcast the vital information to the fireline
over the radio (2006). This vital intelligence
should allow fireline supervisors ample time to
more safely practice wildland firefighting,
anticipating the expected fire behavior based
on the expected weather on a fairly real-time
basis. Therefore, this would allow them time to
either continue to fight the fire and/or to
change their tactics, disengage; or escape and
move to safety if need be. It would most
definitely increase their situational awareness
and enhance their management options as
noted in Mills (2006).
The Alignment of Forces Principle
The Campbell Prediction System (CPS) talks
about “reading a wildland fire” by heeding the
“alignment of forces” of wind, slope, and
preheating that cause variations in fire
behavior. Based on professional experience,
this author will also include relative humidity to
the alignment list. When these forces align, the
fire is going to be at its full intensity. With
further experience, one can more accurately
predict the fire signature that will result and
take appropriate suppression and/or evasive
action as determined by Campbell (1995) and
Schoeffler. This author has truly gained from
the CPS alignment principle extensively on fires
and concluded that utilizing WVI to identify dry
slots is in complete agreement with this system
since dry slots are a primary causal factor and
indicator in the researched fires below. As will
be noted, the fire weather factors of air
temperature, relative humidity, dew point,
winds, and high Haines Index all aligned and
resulted in intensified and often extreme fire
behavior.
There are at least 16 U.S. wildland fires
examined in the general literature focusing on
mid- to upper-air fire weather influences,
including dry slots, and they are listed below.
Now consider some of these researched U.S.
wildland fires, emphasizing the mid- to upper-
atmospheric influences, dry slots and dry
intrusions, subsidence, surface to near-surface
drying, Haines Index, and ensuing winds that
adversely influenced these U.S. wildland fires.
United States Wildland Fire Case Studies -
Limited U.S. Dry Slot Research
Mann Gulch Fire - 5 August 1949 - Helena N.F. – Montana
Mack Lake Fire - 5 May 1980 - Huron/Manistee N.F. - Northern Michigan
Willis Gulch Fire - 26 July 1988 - Boise N.F. – Idaho
Lowman Fire - 29 July 1989 - Boise N.F. - Idaho
Awbrey Hall Fire - 4 August 1990 - Central Oregon
Double Trouble State Park (DTSP) Fire - 2 June 2002 - East-Central New Jersey
Texas and Oklahoma wildfires - 1 January 2006
Lower North Fork Prescribed Burn escape - 26 March 2012 Colorado State Forestry - Conifer, Colorado
Tower Lake (2 May 1999); Cottonville (5 May 2005); Cavity Lake (14 July 2006); Hamm Lake (5 May 2007); Sleeper Lake (2 August 2007); Black River Falls and Pinery (20 May 2009) Fires in the northeastern United States (NEUS)
In every case, subsidence, a dry slot and/or dry
air intrusion advected over the fire or proximate
to the fire area and caused an abrupt drop in
surface and/or near-surface relative humidities
and dewpoints; and strong, gusty winds, to align
and resulted in unusual, often erratic fire
behavior and large fire growth. The subsidence
and/or dry slots often coincided with
atmospheric instability that resulted in a Haines
Index of 5 or 6 in most cases as examined in
Saltenberger and Barker (1993); Werth and
Ochoa (1993); Zimet et al. (2003 and 2007);
Prevedel (2007); and Bass et al. (2012). Miretzky
(2009), in great detail, investigated the NEUS
wildfires listed above (including the Mack Lake
Fire) that were influenced by subsidence, and
when analyzed by this author using archived
WVI (GIBBS), the subsidence events revealed
themselves in varying degrees as dry slot
signatures.
Consider now the specific U.S. wildland fires
studied in the literature. The following wildland
fire discussions address each fire’s fuels,
topography, fire behavior, and in particular the
mesoscale and synoptic weather analyses. Be
aware that the mesoscale and synoptic weather
discussions are paraphrased very strictly from
each of the fire case studies in order to retain as
much as possible, each one of the author’s
original meteorological intent and meaning.
Mack Lake Fire - 5 May 1980 - Huron N.F.
The Mack Lake Fire was the result of an escaped
prescribed (RX) burn near Mio, Michigan in the
northeast portion of the lower peninsula of
Michigan, on the Huron N.F. The U.S. Forest
Service intended to burn only 27 acres that day
to prepare for replanting Jack Pine in the area,
part of a wildlife project for the endangered
Kirtland’s Warbler, as discovered in Simard et
al. (1983). The fuels were various conifers,
mainly very dense jack pine, with brush
understory and the terrain was quite flat
(1983). Even though rated as a “Very High” fire
danger day, the officials ignited the RX burn at
1426 EDT on 5 May 1980 (1983).
At this point, one just has to inquire what the
RX Fire Managers thinking when they ignited
this burn based on the forecasted weather for
that day? Consider Borie (1983) for some useful
insight not included in the “official” report.
Enormous modifications in the Forest Service
prescribed burn policy were administratively
imposed based on this judgment error. By 1615
EDT, the fire spotted across State Highway 33
and was declared a wildfire (1983). As noted by
Gibson et al. (1980), in the first three and one-
half hours, the “very aggressive” fire with
“heavy, roiling black smoke” and “instant
changes in fire behavior due to the winds”
advanced 7.5 miles, and in Simard et al. (1983).
In six hours there was an Agency tractor plow
operator fatality due to a wind shift that caused
a flanking fire to become an intense head fire
with a “strong, though relatively brief intense
fire run to the north,” as investigated by Gibson
(1980) and Simard et al. (1983). In addition, 44
homes and buildings were destroyed; and
within 30 hours it burned 21,000 acres as
established in Simard et al. (1983). There was a
major fire run between 1230 and 1600 hours on
5 May, advanced at 6 to 8 mi/h between 1700
and 1800 EDT found in Simard et al. (1983). The
Mack Lake Fire Report (1980) also noted that
this fire ranked among quite a few others in the
U.S. with anomalously high spread rates and
fireline intensities, e.g. Badoura Fire
(Minnesota) in 1959, Sundance Fire (Idaho) in
1968, and the Air Force Bomb Range Fire (North
Carolina (1983). They calculated the Mack Lake
Fire intensity to be 3.5 trillion BTUs or ten
Hiroshima-sized atomic bombs (1983).
Mesoscale and Synoptic Weather
On May 5th, the 1300 relative humidity over
Mio dropped an anomalous 61% from 80% to its
lowest point (19%) between 0900-1100 EDT1
and the 500-millibar chart displayed a high
pressure ridge over the Northern Rockies (not
shown) as examined in Simard et al. (1983) and
Gibson (1980). The investigators noted that a
single weather reading at the fire site would not
have detected this humidity trend as concluded
by Gibson et al. (1980). A closed low enveloped
eastern Canada with divergent centers over
Newfoundland and Hudson Bay (not shown)
(1983). It was during this time of lowest
humidities, highest temperatures, and highest
wind speeds that the Mack Lake Fire made its
significant run examined in Simard, et al. (1983).
It is noteworthy that the four days followed the
very same cold front passage that impacted the
Mack Lake Fire, to the north, an Alberta,
Canada wildland fire increased significantly
from 20,000 acres to 150,000 acres in size as
discussed in Alexander et al. (1983).
The Mack Lake fire was influenced by a
developing upper-level front deep within a
shortwave trough in the fire area as noted by
Zimet at al. (2007). Subsidence, in the form of a
fully developed dry air intrusion, injected dry air
from the middle and upper-troposphere
descended along sloping isentropes and
adiabatically warmed and dried it along its path
as examined by Zimet et al. (2003 and 2007).
The organized subsidence was also the
mechanism for downwind advection of high
momentum air from within the frontal zone
downward into the fire environment (2003 and
2007). The authors concluded that upper-
frontal processes, characteristic of
northwesterly synoptic-scale flow, were most
likely a causal factor in the 5 May wildfire
spread (2003 and 2007). Consider Fig. 4 - a
logical permissible inference is a dry slot
advecting straight down through the middle of
the 10% to 50% relative humidity contours. This
also would very likely have shown up as a dry
slot on the WVI2. Regrettably, only infrared and
visible satellite imagery was available in the
NOAA, GIBBS archive for 5 May 1980.
Moreover, the angle and quality of the infrared
image was so poor as to render a good image
for publication unfeasible.
Unusually Intense Fire Behavior Phenomenon
There was also distinct residual evidence of
intense fire behavior in the form of Horizontal
Roll Vortices (HRV) determined after the fire
passed through areas where “crown streets” of
scorched canopies, remained as evidence of the
very intense phenomenon examined in Simard
et al. (1983); Haines (1988a); Haines and Lyon
(1990); and HRV occurrence in great detail in
Werth et al. (2011).
Horizontal Roll Vortices, an indication of very
intense fire behavior, occur in moderate terrain
under light winds initially as vertical vortices,
i.e. firewhirls as examined in Werth et al. (2011)
and this author’s professional experiences
(Schoeffler). Haines (1982) also demonstrated
that the existence of HRV is consistent with
existing heat transfer and fluid dynamics
theories.
Forthofer and Goodrick in Werth et al. (2011)
precisely described HRV occurrences when they
observed that these atmospheric horizontal
convective rolls are ordinary features of the PBL
(2011). They noted that adding a fire brings a
complicating aspect into the mix in the form of
a horizontal temperature gradient that can
locally alter the convective organization of the
PBL environment (2011). The causal factors, in
series are, transient ambient vorticity from the
surface wind shear altered by the fire, slanted
into the vertical, followed by longitudinal
reorientation, unmistakable as a bifurcated,
horizontally rolling pair of smoke columns
(2011).
Fig. 2. Vertical cross-section of the Mack Lake
Fire relative humidity valid at 18Z, 5 May 1980.
RH (solid black lines) labeled in percent and
contoured every 10% between 10% and 50%.
Small gray circle with a + represents the
location of the 750 hPa air parcel mentioned in
the Zimet text. Asterisk within the circle
denotes the approximate location of the Mack
Lake Fire. A dry slot may be logically inferred
advecting down through the centerline of the
10% to 50% RH contours (Courtesy of Zimet et
al. 2007).
Lowman Fire - Boise N.F. 29 July 1989 - Idaho
Mesoscale and Synoptic Weather
The 29 July weather at the lightning-ignited
Lowman Fire site was hot and dry throughout
the day. It began initially as four lightning fires
that burned together and resulted from an
intense 26 July lightning bust where 1000
strikes p/h resulted in 300-400 new starts in
central ID (Werth and Ochoa 1993). The fuels
consisted of various conifers, brush understory,
and slash in fairly steep, mountainous
topography near Lowman, ID. Maximum
temperatures ranged from 90°F to 95°F, and an
anomalously low relative humidity of 8% as
discovered in Werth and Ochoa (1993). An
inversion that kept the fire quiet finally broke
around 1100 LST, and this caused the air to
rapidly warm and dry, and this event radically
increased fire behavior according to Werth and
Ochoa (1993). There was a Haines 6 throughout
Idaho as noted in Figure 4 (Werth Figure 6). The
satellite WVI indicated a dry intrusion that
extended from southern California, through
Nevada, and into Idaho and Montana over the
Lowman Fire area at 15Z (Figure 4) (Werth and
Ochoa Figure 7) in Werth and Ochoa (1993). On
this day, the Lowman Fire experienced a fire
behavior blow-up described as a “fire storm”
while the fire moved at 1500 meters per hour
(.93 mi/h) as concluded by Werth and Ochoa
(1993). A fire storm is distinguished by violent
convection caused by a large, continuous area
of intense fire that is often characterized by
destructively violent surface indrafts, near and
beyond the fire perimeter, and sometimes by
tornado-like firewhirls (NWCG 2012).
At the time of the Lowman Fire intense fire
behavior, Werth and Ochoa (1993) discovered
that the weather pattern at the fire site was
dominated by: (1) a low pressure ‘thermal
trough’ in the valleys of California (1993), (2) a
Pacific Northwest coast upper-low moved into
the area (1993), (3) the thermal trough shifted
eastward across Idaho and Nevada (1993), (4) in
response, an area of surface low pressure
moved into the Oregon-Washington border
area (1993), (5) the northern range of the
thermal trough ‘linking up’ with the warm front
accompanied by the surface low that also
approached the area (1993), and that (6) the
Intermountain region low pressure area had
thermal trough characteristics, with the
warmest temperatures in the trough’s center
and the highest thickness values directly over
the fire area (not shown) (1993). According to
Werth and Ochoa (1993) research, the Lowman
Fire area was further influenced by: (1) very dry
low-level air further south in the thermal trough
(1993), (2) a band of air with average relative
humidity below 20% stretched across Idaho and
then southwest toward central California
(1993), (3) satellite WVI indicated a relatively
dark band across Idaho (1993), and (4) dry air
over California and Nevada continued to slowly
flow into Idaho during the day (not shown)
(1993). On 29 July 1999, the Lowman Fire
experienced erratic fire behavior due to high
temperatures, low relative humidity, Haines 6,
persistent drought, and coincident alignment of
a dry slot/dry air intrusion as the causal factors.
Consider the high Haines aligned with the dry
slot in the WVI in Figure 4 (both Werth and
Ochoa Figs.6 and 7).
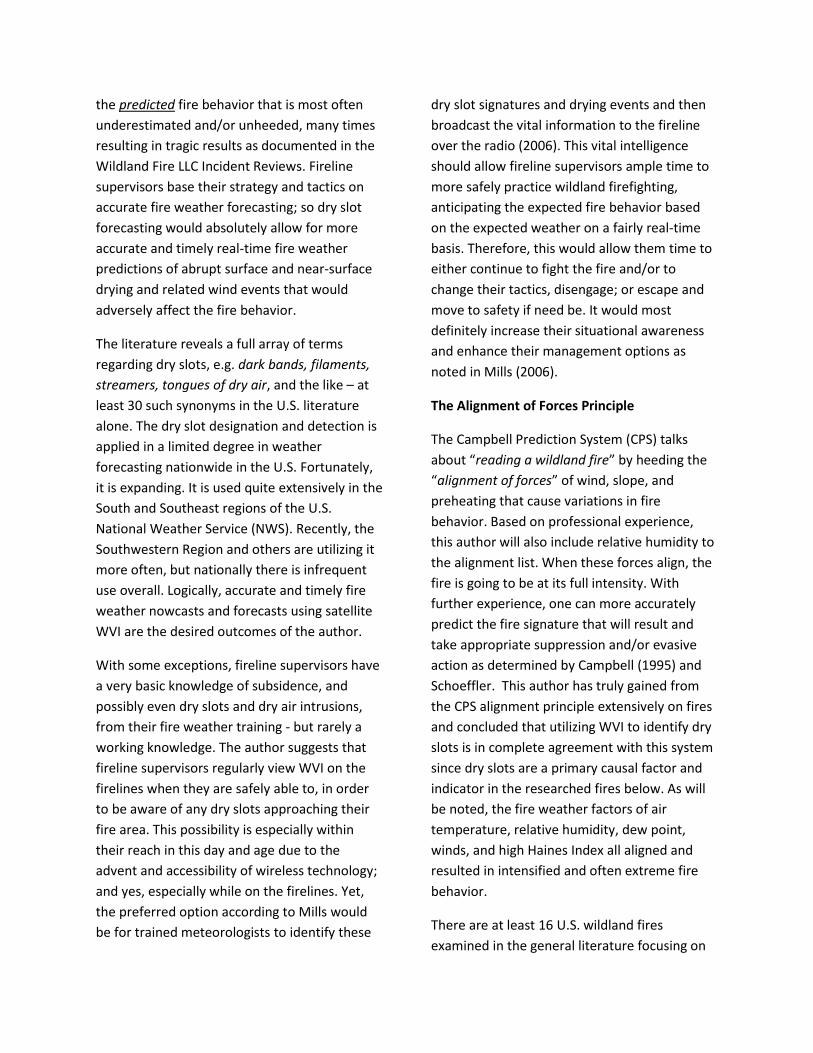
Fig. 3. NCEP/NCAR Relative Humidity Composite
Anomaly Reanalysis of July 2, 1989 15Z (0900
MDT) indicating a very narrow band of
exceptionally low relative humidity in the
central Idaho and Lowman Fire area coincided
and aligned with the dry slot and the high
Haines images in Fig. 4.
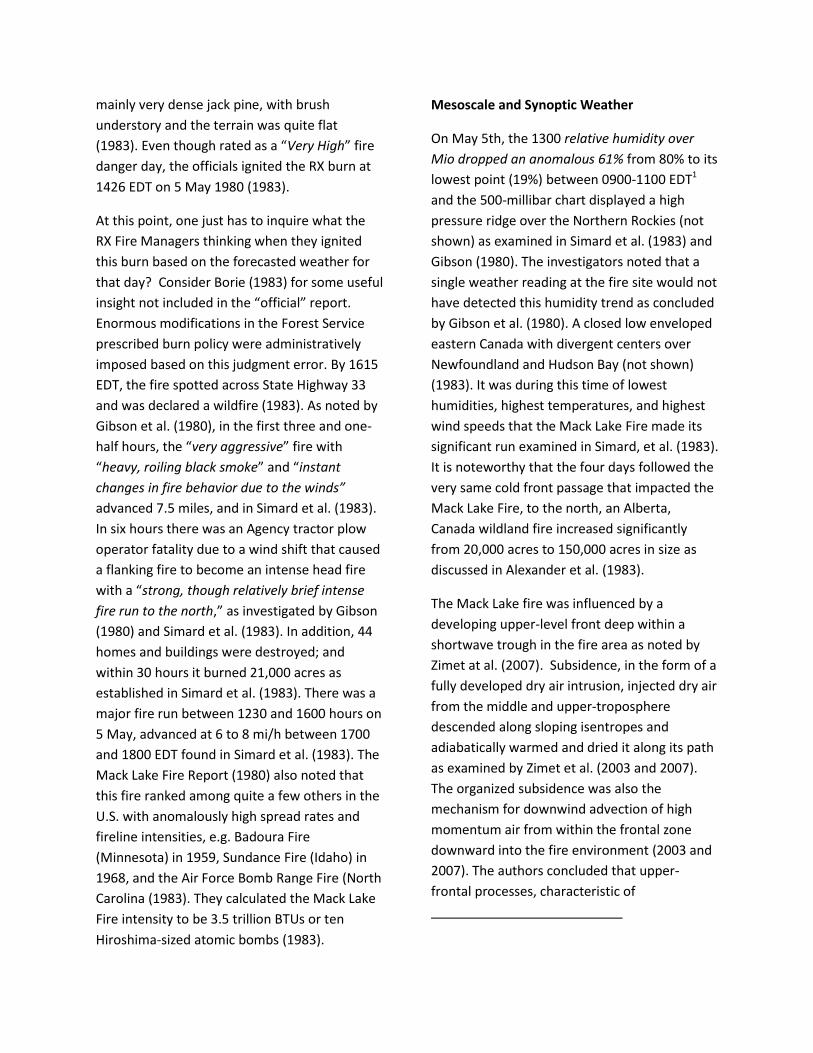
Fig. 4. Lower right WVI indicating a dry slot
advecting into Idaho from the southwest and
through the Lowman Fire area at 15Z. In the
upper right a western U.S. map indicating a
Haines Index of 6 for the Lowman Fire area.
Note that the high Haines aligns with the dry
slot in the WVI above in Werth Fig. 7. Courtesy
of Werth and Ochoa (1993), Figures 6 and 7.
Awbrey Hall Fire – August 4, 1990 – Central OR
Mesoscale and Synoptic Weather
At the time of the 1990 Awbrey Hall Fire,
Saltenberger and Barker found that the
weather pattern at the fire site was dominated
by: (1) the first week of August 1990, an intense
long-wave ridge developed over western North
America (1993), (2) warming and drying peaked
on 4 August as the upper ridge axis passed over
central Oregon (1993), (3) nearly every upper
air station in the region reported extremely low
humidity aloft (Fig. 5) (1993), (4) subsidence
from high pressure east of the Cascades (not
shown) (1993), and (5) a weak surface thermal
trough to the west (not shown) (1993). The
authors also noted that Oregon was classified as
severe to extreme drought after experiencing
four years of drought (1993).
RAWS observations taken from near Bend the
afternoon of 4 August reported a temperature
of 95°F and a relative humidity of 15% (not
shown) (1993). Northerly afternoon surface
winds at this site remained less than 8 mi/h
during the night of 4-5 August as found in
Saltenberger and Barker (1993). The fire was
caused by an abandoned campfire and burned
in various conifers, brush understory, and slash
in fairly flat terrain (1993).
Fig. 5. 20th Century Reanalysis image for 4
August 1990 indicating low surface relative
humidity throughout the West and in the
Awbrey Hall Fire area of central Oregon.
Now consider Figure 6 indicating where GOES
WVI revealed a dry intrusion throughout the
West and the Awbrey Hall fire area on 5 August
1990 at 0301Z (1993). The authors also noted a
fast-moving high-level shortwave impulse that
pushed northeast along the Oregon coast at 45
knots during the evening of 4 August that
affected the fire weather (1993). According to
Weldon and Holmes (1991), darkening in the
dry slot behind the shortwave implies
increasing subsidence behind it as noted by
Saltenberger and Barker (1993).
Fig. 6. GOES WVI indicating a dry slot and dry intrusion throughout the West and the Awbrey Hall Fire area (Courtesy of Saltenberger and Barker 1993). The fire behavior was almost immediately intense surface fire, the fire crowned and spotted, and resulted in “a pulsating fire growth pattern” (1993). It is noteworthy that the Awbrey Hall Fire exhibited “unusually intense nocturnal fire behavior,” that resulted in plume domination3, with very unusual peak fire intensity between 2100-2400 PDT, “contrary to
normal fire behavior” as noted in Saltenberger
and Barker (1993). Plume domination, highly
unusual at night, occurs when the fire growth
and intensity are powered by the convection
column’s strength, i.e. the power of the fire is
more than the power of the wind (1993) and
also addressed in Werth et al. (2011). Overall,
Oregon had endured atmospheric instability
with a Haines of 5 and 6 (not shown) (1993).
The WVI indicated a dry slot 3-6 hours after
erratic and unusual fire behavior examined by
Saltenberger and Barker (1993) (Fig. 6). The
authors inferred that erratic and unusual fire
behavior was due to very low relative humidity,
high nighttime temperatures as examined in
Bates (1962), light surface winds, increased
upper dynamic forcing, and a moderate/ high
Haines Index all in alignment as a dry intrusion
(in the signature of a large dry slot according to
the authors) passed over fire area (1993).
In the Southwestern Region, Tonto N. F. District
Ranger Bates put forward in 1962 that “high
nighttime temperatures” were responsible for
extreme fire behavior the day after the highest
nighttime temperature; 52°F “in the pines” and
81°F “in the semi-desert.” High nighttime
temperatures and extreme fire behavior are
completely in agreement with the alignment
principle as researched and professionally
experienced by this author on numerous
wildland fires with intense fire behavior
(Schoeffler).
Double Trouble Fire, 2 June 2002 – Double
Trouble State Park (DTSP), New Jersey
Mesoscale and synoptic weather
This human-caused wildland fire occurred in
fairly flat terrain and burned in various pine
type, scattered brush understory. The DTSP
wildfire exhibited some rather complicated
weather influences,4 according to Kaplan et al.
(2008) and Charney and Keyser (2010). Consider
the Kaplan et al. (2008) and Charney and Keyser
(2010) separate links below for further detailed
explanations and images and the respective
authors’ complex fire weather research papers
on the DTSP Wildfire. The DTSP wildfire was
influenced by pronounced surface ridging and
drying beneath an upper-level jet exit region,
which led to two separate anomalous drying
events as discovered by Kaplan et al. (2008) and
corroborated by Charney and Keyser (2010).
At the time of the DTSP Fire the weather
pattern at the fire site was dominated by: (1)
deep upper tropospheric subsidence under the
right exit region of a jet streak dried out the
atmospheric column (Figures 7 and 8) (2008 and
2010), (2) mid-level sinking behind a second
lower-level and accelerated a jet streak
entrance region and further transported dry air
surface-wards, (Figures 7 and 8) (2008 and
2010), (3) the development of a convective
boundary layer (2008 and 2010), (4) rightward
directed ageostrophic flow was directed toward
eastern Pennsylvania (PA) and northern New
Jersey (NJ) at 15Z (not shown) (2008 and 2010),
(5) directly under the right exit region was a
second jet streak at ~850 – 750 hPa whose
entrance region was parallel to the leading edge
of a mid-level warm pool just to the southwest
(not shown) and crossed eastern PA under the
right exit region of the mid-level jet (Figure 7
(2008 and 2010), and (6) this elevated warm
band was transported eastward from the
western High Plains over the previous 24- 36
hour period (not shown) (2008 and 2010).
Charney and Keyser maintained that the likely
inferences were that a cluster of circulations
delivered favorable atmospheric conditions for
intense fire weather over central NJ (2008 and
2010). The Palmer Drought Severity Index for
the week prior to the fire indicated a severe
long-term drought in central and southern NJ
(not shown) (2010). Local forestry officials
reported anomalous freezing temperatures
(2010), thus “freeze-drying” any moisture from
the live/dead fuels, a process known as
sublimation.
Fig. 7. GOES satellite WVI valid at (a) 1415Z (b)
1515Z, and (c) 1615Z, 2 June 2002. The arrows
indicate the changing location of the dry
tongues mentioned in the text (Courtesy of
Kaplan et al. 2008).
Here is a succinct excerpt from Charney and
Keyser (2010) suggested that this fire weather
was the result of a dry slot phenomenon: “GOES
WVI for 1215 UTC 2 June 2002 and 0015 UTC 3
June 2002 delineates a ribbon of dry air
advecting south-eastward during this time. This
ribbon of dry air coincided closely with the axis
of the jet streak at 1200 UTC 2 June 2002 and
0000 UTC 3 June 2002” (emphasis added). The
ribbons and dry tongues referenced in the text
are very noticeably dry slots.
At 1915Z the temperature was 75°F with a 62%
relative humidity; and at 21Z the temperature
rose 20° F (2008 and 2010). The authors further
discovered that by 1800 (22Z) the relative
humidity fell abruptly to less than 10% - An
anomalously precipitous drop of over 50% in 4
hours! From 21Z to 02Z, the temperature stayed
unusually high at around 80° F while the winds
shifted from the northwest to west-northwest,
gusted and strengthened as investigated by
Kaplan et al. (2008).
Charney and Keyser (2010) explained that
during the late morning and early afternoon
hours of 2 June, the DTSP weather observations
indicated an anomalous surface relative
humidity drop and an increased wind speed in
the wildfire vicinity. The intensified fire weather
was theorized to be the result of descended
dry, high-momentum air of middle troposphere
origin that occurred coincident with a deepened
mixed layer (2010).
For a more comprehensive account of the
complicated DTSP wildfire mesoscale and
synoptic weather events and images consider
Kaplan, Michael L., C. Huang, Y.L. Yin, and J.J.
Charney (2008)
http://mesolab.ncat.edu/publications%20(web)
/2008_Kaplan_etal(MAP_Jet_Streak_and_Fire).
pdf
See also: Charney, Joseph and Daniel Keyser
(2010)
http://www.publish.csiro.au/paper/WF08191.h
tm
Therefore, the GOES WVI signature that the
authors refer to is a dry slot - clearly visible on
Fig. 9. Dry slot extending across New South Wales. WVI -18 January 2003 at 18Z. Courtesy of Japan Meteorological Agency and Australia BoM. Mills cautioned that when there is a going fire, “the dry slot is potentially one of the triggers to set the fire going uncontrollably. Suddenly, the fuel is drying out more quickly, the wind is stronger and gustier, and the fire can take off explosively” (emphasis added) according to Mills (2006). Mills stated that one has several hours of warning if you can see one of these dry slots moving toward an ongoing fire (Fig. 9) (2006). When a dry slot moves closer to the fire area, then the fire agencies will be given some notice that the fire behavior may soon become more explosive concluded Mills (2006). “Watch out for the dry air aloft” has long been the refrain of experienced fire managers, but little was understood about its behavior and where it originated. They didn't really know where the dry air aloft was except that it was “up there
somewhere” (emphasis added) discovered by Mills (2006). Now they know precisely where the dry air originates and what sort of explosive impact it can have on a bushfire said Mills (2006). There is an expectation that fire weather forecasters will monitor WVI for dry slots of various forms according to Mills (2005b). There is, however, an obligation on Fire Managers to seek such information, or at least notify the BoM of on-going fire activity, even if they are not of sufficient intensity to require special fire weather forecasts concluded Mills (2005b). The Australians also advise that skill and care are needed when interpreting water vapor images and only qualified staff should be using them to make fire weather forecasts (2005b). Wildland Fire Weather: Multi-Agency Portfolio of Current and In-Development Capabilities to Support User Needs A thought-provoking publication in the literature was the above 2011 inclusive treatise by the Office of the Federal Coordinator for Meteorological Services and Supporting Research in Silver Springs, Maryland. It focused on the eleven Federal Departments overseeing twenty Federal Agencies that utilize wildland fire weather data, products, services, needs, and the like. Based on their findings that resulted from an extensive “Needs Assessment Questionnaire,” several topics of interest will be discussed relative to WVI and dry slots. The author will list a few, germane to this paper. Not surprisingly, the overarching Fire weather research topic was designated as important by 100% of users, with a strong requisite for better wind direction and speed predictions for better wildland fire and land management practices. As discussed above in the text, satellite WVI has been shown to do a commendable job revealing strong, gusty, and damaging winds. The reader is directed to Iaccopelli and Knox (2001) and Grumm, DeVoir, and Villani (2004) among others’ research discussed elsewhere in the
text. The users also had concerns about complex terrain. Consider Meyers and Steenburg (2010) and Sharples (2007) research discussed elsewhere in the text. Lamentably, only 54% of users indicated that dry slots and their impact on fire weather were of “moderate” importance. Only 38% felt that there was enough available ”sufficient quality” dry slot information, while only 24% felt there was a “sufficient quantity” of information (emphasis added). The author would suggest that these users are perhaps unfamiliar with and/or unaware of the many benefits of using satellite WVI to identify dry slots. The reader will recall that a 1999 NWS publication, Critical Fire Weather Patterns of the United States, approvingly advocated the use of WVI to locate “dark areas” (dry slots) and warned to be on guard for obscure Haines 5/6 areas of light gray (i.e. moist), also known as gray-scale or gray-shade drying in Weldon and Holmes (1991). Another good method suggested was to scrutinize the WVI carefully for totally black areas, since these black regions (dry slots) are regularly associated with a 5/6 Haines (1999). Consider that these were all in agreement with Weldon and Holmes (1991) and their “gray shade scale” assessments. The questionnaire also referenced the use of forecast upper-level atmospheric parameters and stability conditions. Once again, WVI can provide this. Consider now the research on the DTSP wildfire in New Jersey by Kaplan et al. (2008) and Charney and Keyser (2010) elsewhere in the text. Even though there was no WVI to verify upper-level signatures for the 1980 Mack Lake Fire, research by Zimet and Martin in 2003 and again in 2007 with Zimet, Martin, and Potter found that upper-level fronts and stratospheric intrusions highly influenced this fire dramatically. One is able to clearly infer a dry slot right down the center of the relative humidity contours in both of the two relative humidity vertical cross-section images.
Also considered in the treatise were the Fire Weather Planning Forecasts, a zone-type product intended largely as input to land management decision makers involving firefighter safety, protection of the public and property, or wildland firefighting resource allocation. WVI can be very useful for these forecasts. Clearly, Charney and Charney and Keyser aptly discussed this elsewhere in the text (2007 and 2010) when they advised to “develop and implement indices and diagnostics into the operational fire weather and fire behavior forecasting that sense these conditions” (emphasis added). Regarding the need for identifying mesoscale boundaries that impact fire environments and identifying atmospheric precursors of fire weather events in the Great Lakes region, and developing and implementing atmospheric based predictive indices for anticipating extreme fire behavior, the following research is valid. Miretzky (2009) authored “A Model Based Analysis of the Synoptic and Mesoscale Processes Associated with Subsidence into the Western Great Lakes Wildfire Environment” where he analyzed nine NEUS wildfires, plus the 1980 Mack Lake Fire, and determined that subsidence was a major causal factor on each of the wildfires. And once again consider Kaplan et al. (2008) and Charney and Keyser (2010) where they examined NEUS atmospheric weather event precursors on the 2002, New Jersey DTSP Wildfire. And Zimet et al. (2003 and 2007) examined the same on the 1980 Mack Lake Fire, also a NEUS wildfire elsewhere in the text. Several very good publications on the following mesoscale and synoptic occurrences readily come to mind, e.g. Schroeder et al. (1964) Synoptic weather types associated with critical fire weather; Brotak and Reifsnyder (1977): An investigation of the synoptic situations associated with major wildland fires; The Critical Fire Weather Patterns of the United States, 1999 NWS Fire Weather Forecasters Course; and more recently Prevedel (2007)
Linking Intense Western Wildfires with Weather Patterns and Conditions. Also referenced in the Fire Weather treatise was their concern over Red Flag Warnings and Fire Weather Watches. These are issued by WFOs when the combination of dry fuels and weather conditions support an assessment of extreme fire danger and/or fire behavior. Mills (2005b and 2010) and Werth (2012) delve into this elsewhere in the text. Muller and Fuelberg (1990), Werth (2012), Mills (2005, 2008a), and the 1999 Fire Weather publication regarding dark areas, black regions, and the like - basically dry slots - are focused on elsewhere in the text. As Operational Meteorologists, remember and return to some of the very basic analyses and forecasting methods vigorously encouraged in former education, research, and training venues and the literature. To become less reliant upon computer modeling and such was highly advocated by Bosart (2003) in Whither the Weather Analysis and Forecasting Process? Given what was presented in this wide-ranging Wildland Fire Weather: Multi-Agency Portfolio and the readily-available references cited and applied in the literature; it is most remarkable that the author(s), editors, and users would even make such statements and/or hold some of their viewpoints. This author can only hope that many of those same users would further research these subjects. Maybe then will they change their minds and possibly others’. And finally, they will hopefully begin to acknowledge and ‘see’ dry slots for what they are - a causal fire weather structure and a readily detectable signature - through the use of satellite WVI. This author considers that this would allow for much more accurate and thorough operational wildland fire weather forecasting and model verifications. And it would be “going back to the basics,” always supported as a good idea.
Positive WVI forecasting reviews, commentary, and summarization of introductory text In operational meteorology, satellite WVI analysis can be very beneficial concluded the USW (2008). Satellites can reveal structures not identified by conventional data as discovered by Muller and Fuelberg (1990). The dry intrusion is often evident in the WVI almost a full day before it can be found in the infrared and visible imagery examined by Santurette and Georgiev (2005). One of the most obvious interpretation scenarios occurs when the middle and upper troposphere are very dry according to Muller and Fuelberg (1990). The dark areas always reflect a comparatively dry middle and upper troposphere (1990). A dry band denotes convective instability if it moves over low level moisture and it can also be linked with the upper level disturbance that may trigger the instability discovered by Muller and Fuelberg (1990). A major finding of their research paper was the extremely close concurrence between the surface reports of damaging winds and the satellite signature of the southern fork of the dry intrusion in Iaccopelli and Knox (2001). By combining satellite imagery and potential vorticity analyses, authors Lagouvardos and Kotroni showed that dry air originated in the lower-stratospheric and higher-tropospheric layers (2000). Grumm, DeVoir, and Villani discovered that the strongest wind gusts were confined to the region of the dry slot (2004). They also noted that the strong low-level wind gusts progressed eastward along with the dry slot (2004). Moreover, a secondary dry slot to the west was also associated with gusty winds and influenced by the dry slot (2004). They also noted that the growing dry slot and the expanding area of strong gusty winds were coincident as the cyclone moved northward and the surface front advanced eastward (2004). Therefore, the researchers proposed that the dry slot signature and WVI, over a region of anomalously high winds may be a useful short-term forecast tool in diagnosing similar wind events (2004).
The known connection between mid-tropospheric dry slots and reduced atmospheric humidity may make WVI a valuable guide to areas where atmospheric instability over an active fire may be reduced, as well as their effects on lower-atmosphere drying suggested Mills (2005). Satellite data provides a significant benefit over complex terrain for the mountain meteorologist and therefore WVI is an excellent tool for diagnosing mountain wave signatures as proposed in Meyers (2010) and also Sharples (2007). The literature reveals that mountain waves often indicate extreme upper air turbulence, so this is an aviation concern for aerial firefighting resources as well as for fire weather and fire behavior concerns. If the air immediately above the mixed layer should dry abruptly, then this transformation could be realized at the surface fairly quickly, in time-scales less than an hour discovered Mills (2008). The potential for using WVI to monitor the movement of mid-tropospheric dry air towards the fire site should be investigated as a fire weather forecasting aid suggested Mills (2008). WVI has proved to be a valuable tool for observing the ridge developments, particularly the role of the upstream ridge where clouds are absent in Weldon and Holmes (1991). In addition, operational forecasters equipped with both numerical model fields and satellite WVI are in a better position to follow the synoptic situations as determined by Santurette and Georgiev (2005). According to the Cohesive Strategy, there is always a need for improved fire weather prediction and a general understanding of the weather (2011). According to Weldon and Holmes, WVI could be very useful at a later stage of the decision making process to refine forecasts and then atmospheric behavior can be compared to the model output for verification (1991). Therefore, forecasts can then be confirmed, modified, or significantly changed to reflect the observations suggested Weldon and Holmes (1991).
Model Forecasting Limitations Each WV image is unique, and it is often difficult to interpret a single water vapor image discovered Weldon and Holmes (1991). The WVI features are transient, short-lived, and constantly in motion (1991). The task is much easier and more accurately accomplished when using a sequence of previous images, or when images are viewed in a time-lapse motion concluded Weldon and Holmes (1991). During the unfortunate 2012 Lower North Fork escaped RX Burn in Colorado, the weather forecasts made by computer models or human intuition did not accurately predict actual conditions according to Team Leader Bass (2012). During several Texas and Oklahoma, January 1, 2006 fire events, very poor weather forecast modeling “grossly” overestimated the relative humidity values and underestimated the winds as discovered by Lindley at al. (2006 and 2006a). Incredibly, the modeling completely missed an approaching cold front that accounted for dangerous wind shifts, according to Texas NOAA/NWS meteorologists Lindley, Conder, and Murdoch (2006 and 2006a). Grenci reasoned that high cloud tops frequently tend to contaminate water vapor images (2013). It appears that Grenci’s assertion squares with the findings of Ralph et al. (1998) studying deep tropospheric gravity waves created by leeside cold fronts. They found that interleaving moist layers and clouds can degrade the satellite water vapor interpretation (1998). Meyers and Steenburg suggested that inexperienced forecasters tend to rely too much on computer models and thus tend to be reactive with forecasts, whereas more experienced forecasters tend to be more flexible with their forecasting tools and procedures (2010). Bosart stated that “forecasters who grow accustomed to letting MOS [Model Output Statistics] and the models do their thinking for them on a regular basis during the course of their daily forecasting activities are at high risk of ‘going down in
flames’ when the atmosphere is in an outlier [atypical or infrequent] mode” (emphasis added) ( 2003). Bosart promoted the use of WVI for mesoscale analysis to hone one’s skills and asserted that forecasters are losing their satellite and radar interpretation and analysis skills (2003). Final Summary and Conclusions This review and re-examination of United States
wildland fires clearly suggests that dry slots are
in fact responsible for large wildland fire growth
in the United States and as reflected in the
literature, despite a myriad of synonyms used
for the signatures. The dry slot “theory”
proposed by Australian BoM Dr. Graham Mills
(retired) has been shown in the Australian and
United States literature to verify that dry slots
are responsible for decreased dewpoints and
relative humidities resulting in abrupt near-
surface and sometimes surface drying,
decreased fuel moistures, and increased and
gusty winds resulting in large wildland fire
growth (e.g. 2005b). The movement of a dry
slot in the WVI towards an existing fire, or
towards an area where fire danger is already
extreme might be an indicator of potentially
more extreme fire behavior, and with some
hours warning, therefore uniting satellite WVI
monitoring into existing fire weather watch
procedures may be most advantageous (Mills
2005b).
The author regards Forest Service researcher J. J. Charney (2007 and 2010) as spot-on with his statements regarding atmospheric conditions aloft and utilizing new indices and diagnostics for operation wildland fire forecasting. It has been shown as an acceptable inference that dry slots and dry slot forecasting are included in the atmospheric conditions, indices, and diagnostics mentioned by Charney (2007 and 2010) are also referenced in this text. Even though addressed
in the introduction, Charney is quoted here in total to make the point. “Atmospheric conditions aloft are becoming increasingly recognized as important factors in producing more accurate fire weather and fire behavior predictions, particularly for periods of extreme and erratic fire behavior. The atmospheric structures that contribute to these conditions are, in many cases, predictable hours or even days in advance of the event. The task is to develop and implement indices and diagnostics into the operational fire weather and fire behavior forecasting that sense these conditions and communicate to the forecasters and the operational users of fire weather prediction when and where the potential exists for extreme fire behavior” (emphasis added) (Charney 2007 and Charney and Keyser 2010). Future Research The definite connection between dry air aloft and dry slots influencing large wildland fire growth in the U.S. and North America is valid and warrants further research. The research also suggests that there are very strong dry-slot-associations to high Haines Index, high potential vorticity (PV), high ozone events, inversions, thermal belts, stratospheric intrusions, subsidence, nocturnal low-level jets and jet streaks, , Red Flag Warnings and Fire Weather Watches, and other influencing mechanisms which also warrant further research. Acknowledgements There were many researchers that assisted in the preparation of this paper. With gratitude, the author acknowledges the valuable encouragement and constructive criticism supplied by those that have most assisted in my dry slot research: Dr. Graham Mills, Australian BoM (retired) initially piqued this author’s interest in the subject and guiding him toward U.S. wildfires affected by dry slots. John F. Saltenberger, U.S. Fish and Wildlife Service
meteorologist in the Northwest Interagency Coordination Center, Predictive Services Program in Portland, Oregon has been a huge advocate from the beginning. J. Brent Wachter, NOAA NWS meteorologist and Incident Meteorologist (IMET) in Albuquerque, NM has continued to educate the author in the art of research and meteorology. Paul Werth, Weather Research and Consulting Services, LLC of Battle Ground, Washington; meteorologist and researcher has been a great help with dry slot insight and information, data, and images from the Mann Gulch Fire assisting with NOAA Reanalysis searches. Nicole Petersen, meteorologist, Rutgers University who has given valuable advice, guidance, and encouragement.