+ All Categories
Home > Documents > Larry L. Needham, Ph.D. Chief, Organic Analytical Toxicology Branch National Center for...

Larry L. Needham, Ph.D. Chief, Organic Analytical Toxicology Branch National Center for...

Date post: 26-Dec-2015
Category:
Upload: augustine-blake
View: 217 times
Download: 0 times
Share this document with a friend
Popular Tags:
50
Larry L. Needham, Ph.D. Chief, Organic Analytical Toxicology Branch National Center for Environmental Health Centers for Disease Control and Prevention Atlanta, GA USA 30341 The Exposure - Effect Continuum: Emphasis on Biomonitoring
Transcript

Larry L. Needham, Ph.D.Chief, Organic Analytical Toxicology Branch

National Center for Environmental Health

Centers for Disease Control and Prevention

Atlanta, GA USA 30341

The Exposure - Effect Continuum: Emphasis on Biomonitoring

Water, Air, Food, Soil, Dust, Sediment, Surfaces, Personal Care Products

Distribution

Source

Internal Dose

InhalationIngestionDermal Contact

Target Organ Dose

Biologically Effective Dose

Absorption following:

Metabolism

EliminationElimination

Effect

RISKMANAGEMENT

EPIDEMIOLOGICAL STUDIES

RISKASSESSMENT

PharmacodynamicProcesses

Exposure-Effect Continuum for Environmental Chemicals

Angerer et al. Tox Sci 93(1) 3-10 (2006)

Exposure

Fate and Transport

Water, Air, Food, Soil, Dust, Sediment, Surfaces, Personal Care Products

Source (Chemical plant, waste site)

Internal Dose

InhalationIngestionDermal Contact

Target Organ Dose

Biologically Effective Dose

Absorption

Effect

EXPOSURE ANALYSIS

EFFECT ANALYSIS

EXPOSURE EFFECT ANALYSIS

Adapted from: NRC 1987

Exposure (Contact)

Altered Structure/Function (“omics”)

Fate and Transport

Biomonitoring

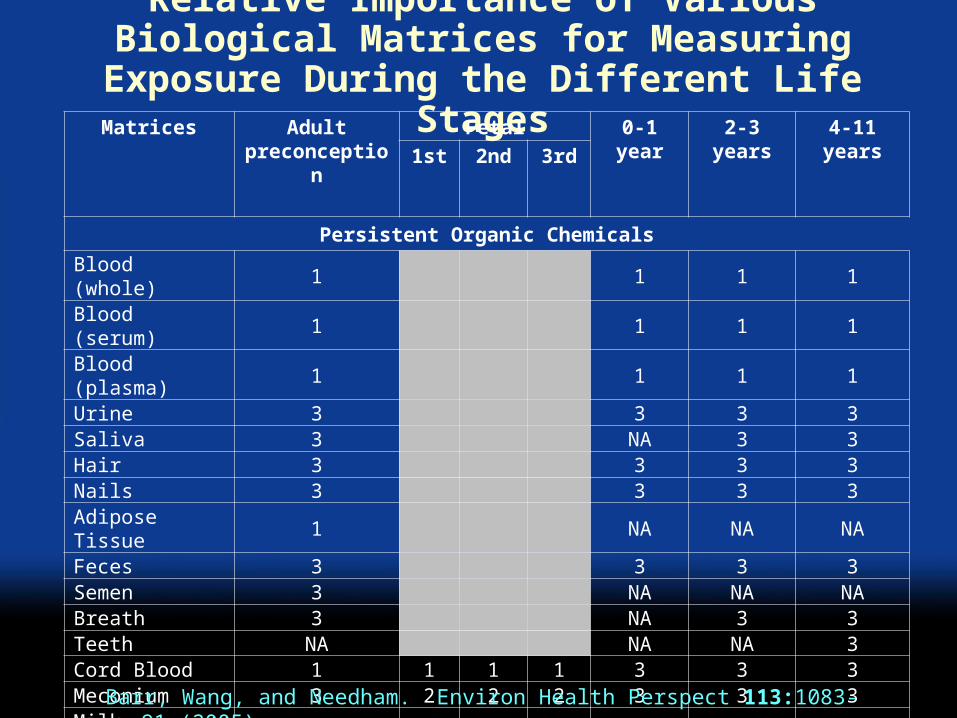
Assessment of human exposure to an environmental chemical by measuring its exposure biomarker(s): the parent chemical (or its metabolite or reaction product) in human blood, urine, milk, saliva, adipose, or other tissue.

Biomonitoring for Disease Prevention

BIOMONITORING Susceptible populations

Screening

Emerging chemicals

Sta

tus

& T

ren

dsH

igh

ly expo

sed

Exposure pathway

Clinical S

tudies

Em

erg

ency

Res

po

nse

Ep

idem

iolo

gy

Preclinical indicators

Adapted from: HESI’s Biomonitoring Technical Committee

INTERPRETATION

Biomonitoring Hinges on the Analytical Measurement

All numbers are not created equally Accuracy Precision Specificity Linearity & Range Limit of detection Ruggedness/Robustness

QA/QC ProgramInterlaboratory comparison

Needham et al. J Toxicol Environ Health A 65: 1893-1908 (2002)

Choosing the Appropriate Matrix

Chemical dependentPopulation dependent (age, race, health

status, etc.)

Selection of Biomonitoring Matrix: Environmental Chemical DependentTwo primary classes of Environmental

Chemicals

Persistent (half-lives in years); PCDDs, PCBs, PBDEs, PFCs, OCs, Pb

Non Persistent (half-lives in minutes/hours); phthalates, pesticides (OPs, carbamates, pyrethroids), VOCs

Absorption, Distribution, and Elimination of Environmental Chemicals in the Body

Bile

Ingestion Inhalation Dermal

Gastrointestinal Tract

Lung

Blood/Lymph

PortalBlood

Kidney

Primary Deposition Sites

Soft Tissues

BoneFat

Secretory Structures

FecesBladderUrine

Liver

Secretions

Saliva Sweat Milk

TearsAlveoli

Expired Air

Needham, Barr, and Calafat. Neurotoxicology 26:547-53 (2005)

Post-Exposure Fate of a Persistent Chemical in Blood and Urine

BloodToxicant/Metabolite

DNA Adduct

Albumin Adduct

Hemoglobin Adduct

Urinary MetaboliteUrinary Adduct

1 10 100 1000

Time (Days)

Con

cent

ratio

n

Adapted from: Henderson et al. Crit Rev Toxicol 20: 65-82 (1989)

Needham and Sexton. JEAEE 10: 611-629 (2000)

Post-Exposure Fate of a Nonpersistent Chemical in Blood and Urine

Time (Days)

BloodToxicant/Metabolite

DNA Adduct

Albumin Adduct

Hemoglobin Adduct

Urinary Metabolite

Urinary Adduct

1 10 100 1000

Con

cent

ratio

n

If chemical forms an adduct: extends time window of exposure

Adapted from: Henderson et al. Crit Rev Toxicol 20: 65-82 (1989)

Needham and Sexton. JEAEE 10: 611-629 (2000)

Post-Exposure Fate of a Nonpersistent Chemical in Blood and Urine

1 10 100 1000Time (Days)

Con

cent

ratio

nBloodToxicant/Metabolite

Urinary Metabolite

Barr et al. Environ Health Perspect 113:1083-1091 (2005)Needham, Barr, and Calafat. Neurotoxicology 26:547-53 (2005)

Selection of Biomonitoring Matrix: Population DependentLife Stages of Children

Conception

Birth

Death

1 y

2 y

3 y

6 y

12 y18-21 y

InfancyYou

ng to

ddle

r

Older toddler

Preschool

Pre High School

Adolescence(High School)

TrimestersEmbryonic (8d – 8w)

Needham et al. Environ Health Perspect 113:1076-1082 (2005)

Relative Importance of Various Biological Matrices for Measuring Exposure During the Different Life StagesMatrices Adult

preconceptionFetal 0-1 year 2-3 years 4-11

years1st 2nd 3rd

Persistent Organic Chemicals

Blood (whole) 1       1 1 1Blood (serum) 1       1 1 1Blood (plasma) 1       1 1 1Urine 3       3 3 3Saliva 3       NA 3 3Hair 3       3 3 3Nails 3       3 3 3Adipose Tissue 1       NA NA NAFeces 3       3 3 3Semen 3       NA NA NABreath 3       NA 3 3Teeth NA       NA NA 3Cord Blood 1 1 1 1 3 3 3Meconium 3 2 2 2 3 3 3Milk (maternal) 1 1 1 1 1 3 3Blood (maternal) 1 1 1 1 1 3 3Urine (maternal) 3 3 3 3 3 3 3Hair (maternal) 3 3 3 3 3 3 3

Barr, Wang, and Needham. Environ Health Perspect 113:1083-91 (2005)

Exposure Assessment Approaches

Questionnaire/Historical Information (includes GIS + video)

Environmental monitoring (Air, Water, Food, Soil)

Biomonitoring

Combine these 3 approaches with calibrated and validated models

CDC’s Third National Report on Human Exposure to Environmental Chemicals

(1999-2000) (2001-2002)

www.cdc.gov/exposurereport

Caveats About the Report

The presence of a chemical does not imply disease

Cannot provide estimates for: States, cities, special localities Groups with special exposures

Analysis of trends for many chemicals awaits future data

NHANES

National Health and Nutrition Examination Survey (administered by NCHS) Stratified, multistage, national probability sample

of the civilian, noninstitutionalized population Data released every 2 years 30 localities via mobile trailers

Data collected Extensive questionnaire on demographics and

health behaviors Physical exam Medical and nutritional lab tests Drinking water sampled

CDC’s National Report on Human Exposure to Environmental Chemicals

Urine Specimens Ages 6

Blood Specimens Ages 12

Exceptions: Pb, Cd, Hg, cotinine1 year 3 years +

Additional Chemicals in 3rd Report148 chemicals

Exposure biomarkers for: Metals Polychlorinated biphenyls, dioxins and furans Organochlorine pesticides Carbamate pesticides Organophosphorous pesticides Pyrethroid pesticides Herbicides Polycyclic aromatic hydrocarbons Phthalates Phytoestrogens Pest repellants Cotinine

* Perfluorinated chemicals

* BFRs

* VOCs

* Perchlorate

* Bisphenol A

* Sunscreen agent

* Triclosan

* Acrylamide * Starting in ‘03www.cdc.gov/exposurereport

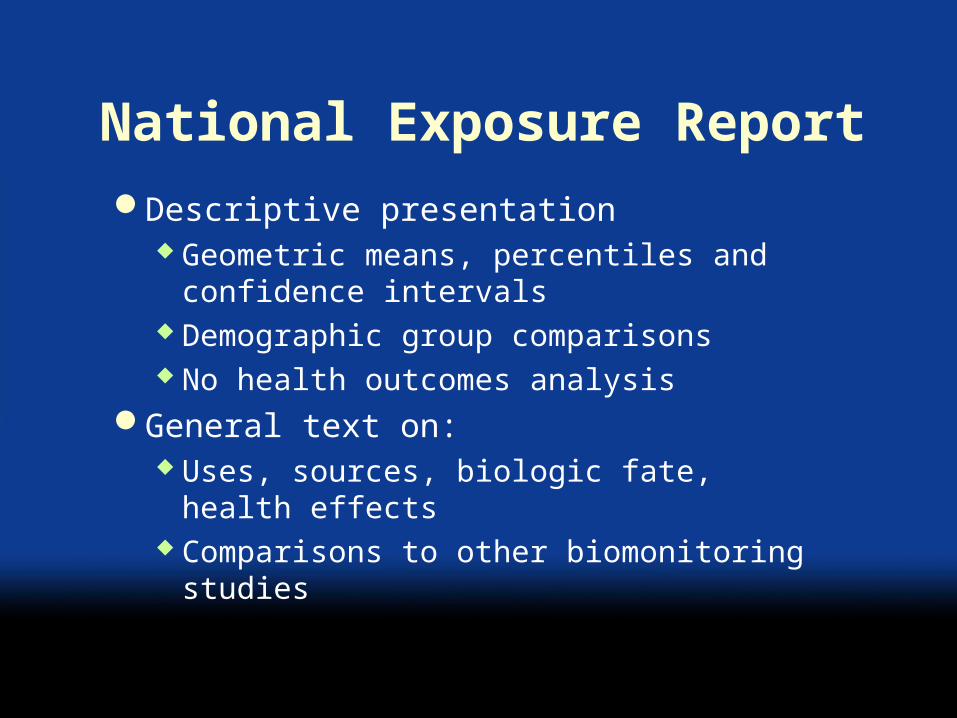
National Exposure Report

Descriptive presentation Geometric means, percentiles and

confidence intervals Demographic group comparisons No health outcomes analysis

General text on: Uses, sources, biologic fate, health effects Comparisons to other biomonitoring studies

Lead

A chemical with “known” toxicityToxic effects define “Level of Concern”

0

10

20

30

40

50

60

70

1965 1970 1975 1980 1985 1990 1995

Blood lead levelsdefining lead

poisoning (g/dL)

Human studies using blood lead as the measure of exposure have found health

effects at lower and lower blood lead levels

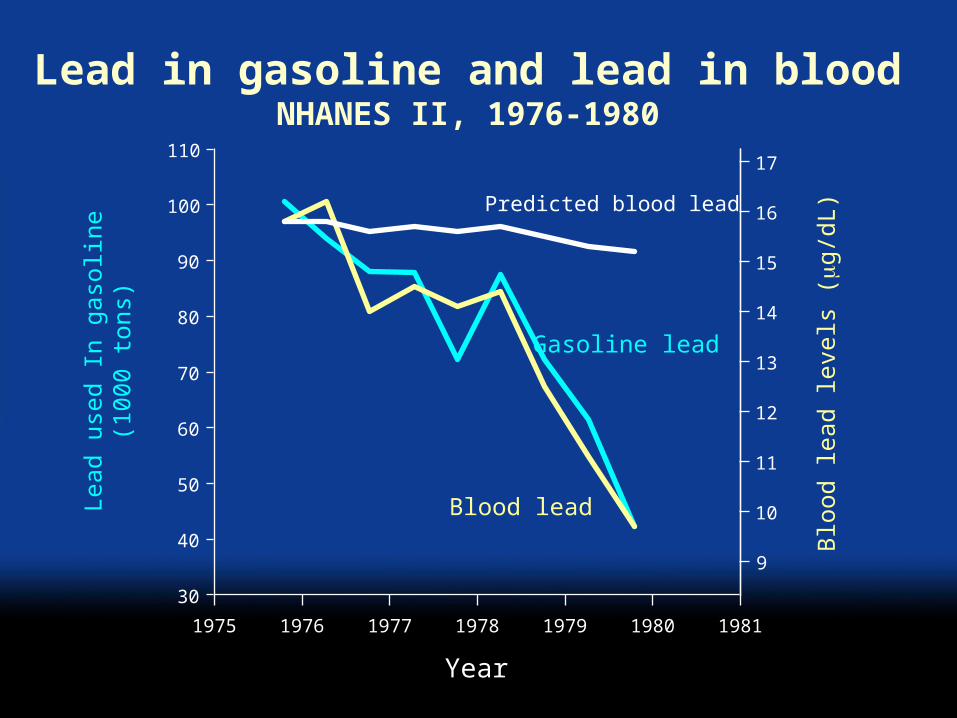
Lead used in gasoline declined from 1976 through 1980

Year

1975 1976 1977 1978 1979 1980 1981

30

40

50

60

70

80

90

100

110

Gasoline lead

Lead

use

d In

gas

olin

e(1

000

tons

)

Environmental modeling predicted only a slight decline in blood lead levels in people

Year

1975 1976 1977 1978 1979 1980 1981

Lead used ingasoline

(thousandsof tons)

30

40

50

60

70

80

90

100

110

Mean bloodlead levels

(g/dL)

9

10

11

12

13

14

15

16

17

Gasoline lead

Predicted blood lead

Blood lead

Year

1975 1976 1977 1978 1979 1980 1981

30

40

50

60

70

80

90

100

110

9

10

11

12

13

14

15

16

17

Gasoline lead

Lead in gasoline and lead in bloodNHANES II, 1976-1980

Blo

od le

ad le

vels

(g

/dL)

Lead

use

d In

gas

olin

e(1

000

tons

)

Predicted blood lead

1974 1976 1978 1980 1982 1984 1986 1988 1990 1992

0

20

40

60

80

100

2

4

6

8

10

12

14

16

18

Blood leadGasoline lead

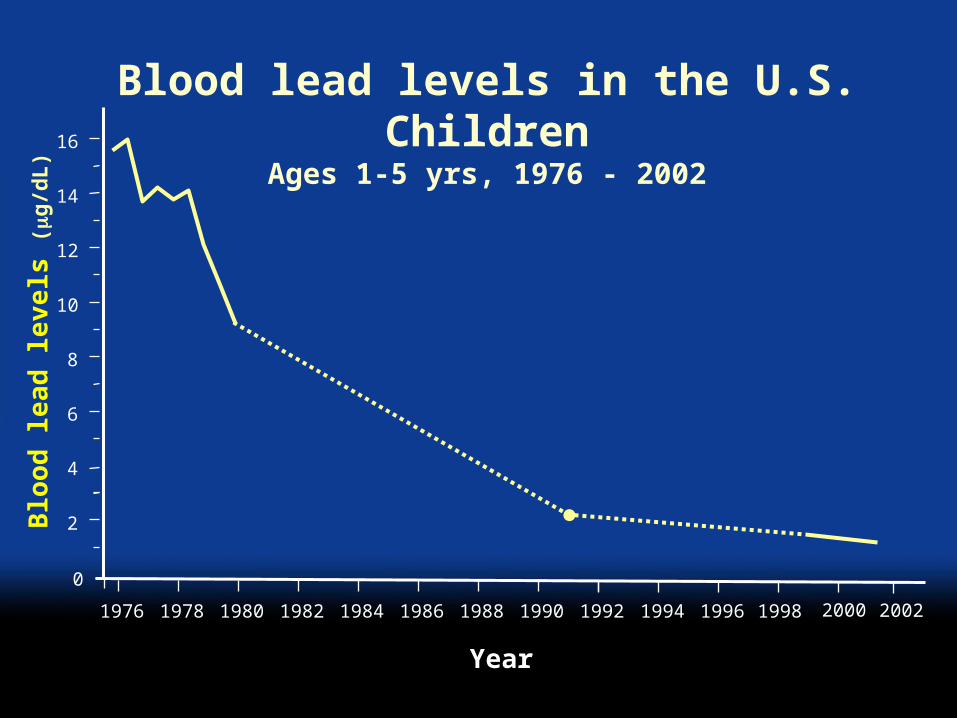
After NHANES II, EPA further restricted leaded gasoline and gasoline lead levels continued to decline through 1991

Year

Lead

use

d In

gas

olin

e(1

000

tons

)

Blo

od le

ad le

vels

(g

/dL)

Year

1974 1976 1978 1980 1982 1984 1986 1988 1990 1992

0

20

40

60

80

100

2

4

6

8

10

12

14

16

18

Blood leadGasoline lead

NHANES III (1988-1994) showed blood lead levels continued to decrease as gasoline levels declined

Lead

use

d In

gas

olin

e(1

000

tons

)

Blo

od le

ad le

vels

(g

/dL)

1976 1978 1980 1982 1984 1986 1988 1990 1992

2

4

6

8

10

12

14

16

Blo

od

lead

lev

els

(g

/dL

)

0

1994 1996 1998 2000

Blood lead levels in the U.S. ChildrenAges 1-5 yrs, 1976 - 2002

Year

2002

Percentage of children 1-5 years old in the U.S. populationwith elevated blood lead levels ( 10 g/dL)

0

20

40

60

80

100

1976-1980 1988-1991 1991-1994 1999-2002

Per

cent

88.2

8.64.4 1.6

Cotinine

Nicotine metabolite that tracks exposure to tobacco smoke

For nonsmokers, tracks exposure to secondhand smoke

N

N

CH3

O

Serum cotinine (ng/mL)

Per

cent

age

of t

he p

opul

atio

n

0

1

2

3

4

5

0.1 1.0 10 100 1000

ETS exposure (nonsmokers)

Smokers

Exposure of the U.S. Population to Tobacco Smoke: Serum Cotinine Levels

(NHANES III, 1988-1991)

Environmental Tobacco Smoke

Monitored as serum cotinineComparing NHANES III (1988-91) to NHANES

99-02, median levels in non-smokers have fallen: 68% in children 69% in adolescents About 75% in adults

Higher in non-Hispanic blacks than Mexican Americans or non-Hispanic whites

Serum Cotinine Levels: Tracking Exposure to Secondhand Smoke in the Non-smoking U.S.

Population

0

0.1

0.2

0.3

4-11 12-19 20-74

Age (years)

Se

rum

co

tinin

e (n

g/m

L)

68%

75%

69%

1988-19911999-2002

Working Backwards on Pathway: Example Dioxin

Internal Dose

Effect

Water, Air, Food, Soil, Dust, Sediment

Based on human studies or animal studies

Exposure

Based on human studies and animal studies

* ~ 95% of exposure via food chain; mitigation: regulate levels in food

*

Question

Two examples (lead and cotinine) “levels of concern” are based on “known” human toxicity.

Should we have similar or different “levels of concern” for other chemicals, for which we have limited toxicity data, but base these “concern levels” on biomonitoring data? AK Department of Health is basing fishing advisories on biomonitoring data (Arnold et al. AJPH 95 393-7 (2005))

NHANES Serum Pools

2001-2002:12 years of age and older

3 - 5 years: planned

6 - 11 years: planned

Serum Pools: NHANES 2001/2002

Used for estimates of the “means”

34 People per pool (Total 1,734 people; 51 pools)

0.75mL Serum per person

25.5 g Serum per pool 2 g BFRs/PCBs/Persistent Pesticides 22 g PCDDs/PCDFs/cPCBs 0.5 g Total Lipids 0.4 g Perfluorinated chemicals

NHANES 2001-2002 Pools

Race/Ethnicity Gender

Age Group (years)

Number of Pools12-19 20-39 40-59 60+

Non-Hispanic

White

M 2 (3) 3 3 3 (4)

F 2 (3) 4 3 4

Non-Hispanic

Black

M 3 1 1 1

F 3 1 1 1

Mexican-American

M 3 2 1 1

F 4 2 1 1( ) for perfluorinated chemicals

Geometric Mean & 95% Adjusted CI of TEQs (PCDDs, PCDFs, dioxin-like PCBs) by Age, Group, Race & Sex (using 2005 TEFs)

0

10

20

30

40

50

60

M F M F M F M F M F M F M F M F M F M F M F M F

12-19 20-39 40-59 60+ 12-19 20-39 40-59 60+ 12-19 20-39 40-59 60+

Mexican-American Non-Hispanic Black Non-Hispanic White

Race/Ethnicity, Age, & Gender

To

tal

TE

Q

What is a Flame Retardant? Flame Retardants (FRs) are a diverse group

of chemicals that are added to materials such as plastics, rubber, textiles and construction materials to reduce their flammability.

Annual World production of FRs estimated to 600,000 metric tons

25% of world production of FRs were bromine containing chemicals

5-30% of flame retarded polymeric materials consist of FRs

Inorganic compounds often used in combination with brominated and/or phosphorus containing FRs.

Mean and Range of BDE-47 by Age Group, Race and Sex

0

20

40

60

80

100

120

140

160

180

200

M F M F M F M F M F M F M F M F M F M F M F M F

12-19 20-39 40-59 60+ 12-19 20-39 40-59 60+ 12-19 20-39 40-59 60+

Mexican-American Non-Hispanic Black Non-Hispanic White

Race/Ethnicity, Age, & Gender

ng

/g l

ipid

Perfluorochemicals (PFCs) in the Environment

Produced since 1950's for use in: Surface treatments: soil and stain

resistant coatings on textiles, carpet, leather

Paper protection: provides oil, grease and water resistance on paper products including those for food use

Performance chemicals including insecticide, fire fighting foams, industrial surfactants, acid mist suppression

3M phased out its fluorooctanylchemistry in May 2000

Mean and Range of PFOS by Age Group, Race and Sex

5.0

10.0

15.0

20.0

25.0

30.0

35.0

40.0

45.0

M(3)

F(4)

M(2)

F(2)

M(1)

F(1)

M(1)

F(1)

M(3)

F(3)

M(1)

F(1)

M(1)

F(1)

M(1)

F(1)

M(3)

F(3)

M(3)

F(4)

M(3)

F(3)

M(4)

F(4)

12-19 20-39 40-59 60+ 12-19 20-39 40-59 60+ 12-19 20-39 40-59 60+

Mexican-American Non-Hispanic Black Non-Hispanic White

Race/Ethnicity, Age, & Gender

ng/m

L

Mean and Range of PFOA by Age Group, Race and Sex

0.0

1.0

2.0

3.0

4.0

5.0

6.0

7.0

8.0

9.0

10.0

M(3)

F(4)

M(2)

F(2)

M(1)

F(1)

M(1)

F(1)

M(3)

F(3)

M(1)

F(1)

M(1)

F(1)

M(1)

F(1)

M(3)

F(3)

M(3)

F(4)

M(3)

F(3)

M(4)

F(4)

12-19 20-39 40-59 60+ 12-19 20-39 40-59 60+ 12-19 20-39 40-59 60+

Mexican-American Non-Hispanic Black Non-Hispanic White

Race/Ethnicity, Age, & Gender

ng/m

L

Biomonitoring for Disease Prevention

BIOMONITORING Susceptible populations

Screening

Emerging chemicals

Sta

tus

& T

ren

dsH

igh

ly expo

sed

Exposure pathway

Clinical S

tudies

Em

erg

ency

Res

po

nse

Ep

idem

iolo

gy

Preclinical indicators

Adapted from: HESI’s Biomonitoring Technical Committee

Exposure Analysis for Disease Prevention

ExposureAnalysis

Susceptible populations

Screening

Emerging chemicals

Sta

tus

& T

ren

dsH

igh

ly expo

sed

Exposure pathway

Clinical S

tudies

Em

erg

ency

Res

po

nse

Ep

idem

iolo

gy

Preclinical indicators

Adapted from: HESI’s Biomonitoring Technical Committee


Recommended