May 30, 2017 ICICI Securities Ltd | Retail Equity Research Result Update Balance sheet mend continues… Larsen & Toubro (L&T) reported a mixed set of Q4FY17 numbers. The company reported healthy topline growth. However, muted execution in some segments impacted EBITDA and PAT growth. L&T reported strong order intake of | 47,289 crore, up 9.6% YoY. Also, going forward, the company has guided at 12% growth in its revenue and 12-15% growth in its order intake. L&T reported a significant improvement in cash-flows. In Q4FY17, CFO came in at | 7300 crore (up by | 3000 crore YoY) and | 12,200 crore in FY17, which is up 58.4% YoY (| 7700 core in FY16). From a balance sheet perspective, net working capital also saw a significant improvement to 19% of sales in FY17 from 23% of sales in FY16 Standalone revenues for the quarter grew 5.5% YoY to | 23,499.6 crore vs. our estimate | 22708.1 crore. On a consolidated basis, revenues came in at | 36800 crore, up 12% YoY. Infrastructure segment revenues disappointed, up 10% while hydrocarbon segment revenues grew 6% YoY. On the negative side, revenues from the power, heavy engineering segment fell 3%, 4% respectively Standalone EBITDA margin was at 12.9% whereas consolidated margins were at 11.8%. Key miss was from margin disappointment in infrastructure segment wherein EBITDA margins for Q4FY17 were at 13.5% vs. 16.1% in Q4FY16. On the positive side, heavy engineering segment reported strong revenue of 26% whereas hydrocarbon saw a solid recovery in margin to 9.8% in Q4FY17 Execution in international market to remain robust; domestic likely to recover in FY18E For FY17, revenues from international markets grew in excess of 15% YoY on the back of planned execution wherein domestic revenues were a laggard during FY17 on the back of liquidity issues, client side delays and demonetisation (impacting the buildings and factories segment). Going ahead also, FY18E will see growth in excess of 15% YoY wherein domestic execution is likely to witness a gradual up-tick. The management guidance of 12% growth builds in a moderate pick-up in domestic execution. Going ahead, we have pencilled in 10% and 13% YoY growth in standalone revenues in FY18E and FY19E, respectively. Balance sheet mend gaining traction From a balance sheet perspective, net working capital saw a significant improvement during Q4FY17 as the same was at 19% of sales vs. 23% of sales in FY16. Even from a cash flow perspective, the company generated CFO to the tune of | 12200 crore in FY17 vs. | 7700 crore in FY16. This is also reiterated by interest costs that were down, on a standalone, consolidated basis, by 10.2%, 6% YoY, respectively. Best play on domestic capex cycle recovery; maintain BUY Focus on improvement of working capital, generation of cash flows and staying away from BoT assets make us believe that L&T is moving in the right direction. This has laid a strong foundation for the next leg of growth. Going ahead, we expect L&T to deliver 11.5% and 10% PAT CAGR, respectively, in FY17-19E. With most equity infusion in L&T IDPL over, we expect L&T’s road to improvement of RoEs to be achievable. Post the recent rally, we expect L&T to have further legs to make an up move as we believe it is the best play on domestic capex recovery. We upgrade the target price to | 2090 (SoTP basis) and maintain BUY. Rating matrix Rating : Buy Target : | 2090 Target Period : 12 months Potential Upside : 19% What’s Changed? Target Chnaged from |1635 to |2090 EPS FY18E Changed from | 65.2 to | 65 EPS FY18E Introduced at | 69.5 Rating Unchanged Quarterly Performance Q4FY17 Q4FY16 YoY (%) Q3FY17 QoQ (%) Revenue 23,499.7 21,061.3 11.6 12,150.0 93.4 EBITDA 3,021.1 3,193.2 -5.4 964.2 213.3 EBITDA (%) 12.9 15.2 -231 bps 7.9 492 bps PAT 1,254.2 2,616.4 -52.1 550.1 128.0 Key Financials | Crore FY16 FY17E FY18E FY19E Net Sales 59,779.6 66,301.4 73,027.7 82,459.7 EBITDA 6,182.1 6,425.2 7,835.2 8,858.6 Net Profit 5,064.1 4,708.2 6,015.2 6,427.0 EPS (|) 54.8 50.9 65.0 69.5 Valuation summary FY16 FY17E FY18E FY19E P/E 32.0 34.4 26.9 25.2 Target P/E 26.9 29.0 22.7 21.2 EV / EBITDA 26.4 26.1 21.8 19.1 P/BV 4.1 3.8 3.5 3.2 RoNW (%) 12.8 11.1 13.0 12.8 RoCE (%) 10.3 10.0 11.5 12.1 Stock data Particular Amount Market Capitalization | 161857.5 Crore Total Debt (FY17) |10500 Crore Cash and Investments (FY17) |3000 Crore EV |169358 crore 52 week H/L |1893/ | 1069 Equity capital | 185 Crore Face value | 2 Price performance (%) 1M 3M 6M 12M Larsen & Toubro Ltd 4.8 (4.9) 9.0 59.8 BHEL 1.5 3.8 17.0 66.0 Thermax Ltd 5.0 10.5 30.5 75.4 Crompton Greaves (14.7) (13.5) (16.0) 37.1 Larsen & Toubro (LARTOU) | 1760 Research Analyst Chirag Shah [email protected]
Transcript
May 30, 2017
ICICI Securities Ltd | Retail Equity Research
Result Update
Balance sheet mend continues…
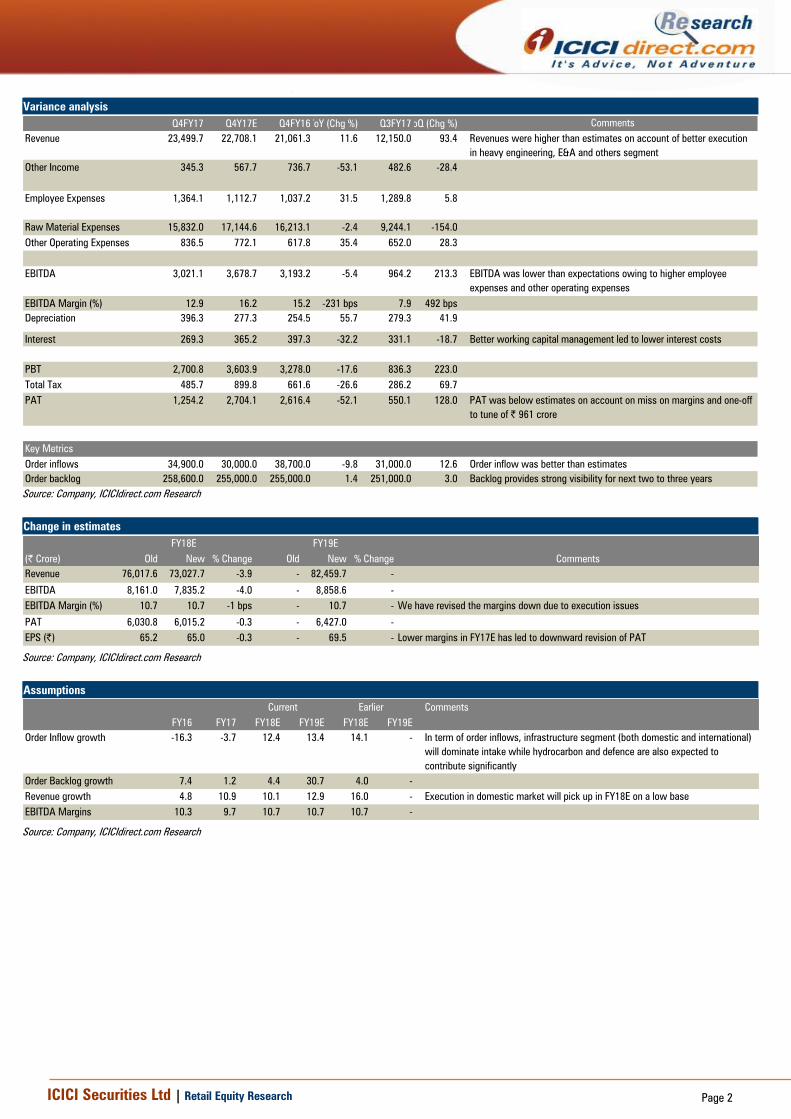
Larsen & Toubro (L&T) reported a mixed set of Q4FY17 numbers. The
company reported healthy topline growth. However, muted
execution in some segments impacted EBITDA and PAT growth. L&T
reported strong order intake of | 47,289 crore, up 9.6% YoY. Also,
going forward, the company has guided at 12% growth in its
revenue and 12-15% growth in its order intake. L&T reported a
significant improvement in cash-flows. In Q4FY17, CFO came in at
| 7300 crore (up by | 3000 crore YoY) and | 12,200 crore in FY17,
which is up 58.4% YoY (| 7700 core in FY16). From a balance sheet
perspective, net working capital also saw a significant improvement
to 19% of sales in FY17 from 23% of sales in FY16
Standalone revenues for the quarter grew 5.5% YoY to | 23,499.6
crore vs. our estimate | 22708.1 crore. On a consolidated basis,
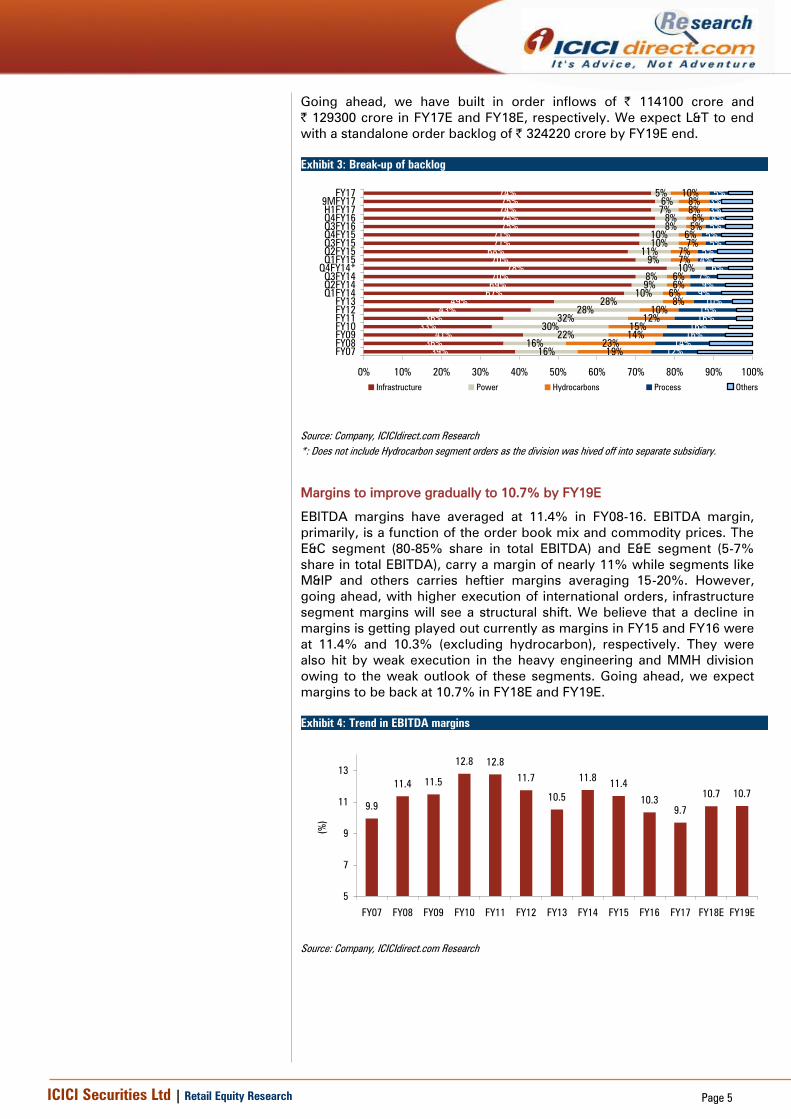
revenues came in at | 36800 crore, up 12% YoY. Infrastructure
segment revenues disappointed, up 10% while hydrocarbon
segment revenues grew 6% YoY. On the negative side, revenues
from the power, heavy engineering segment fell 3%, 4% respectively
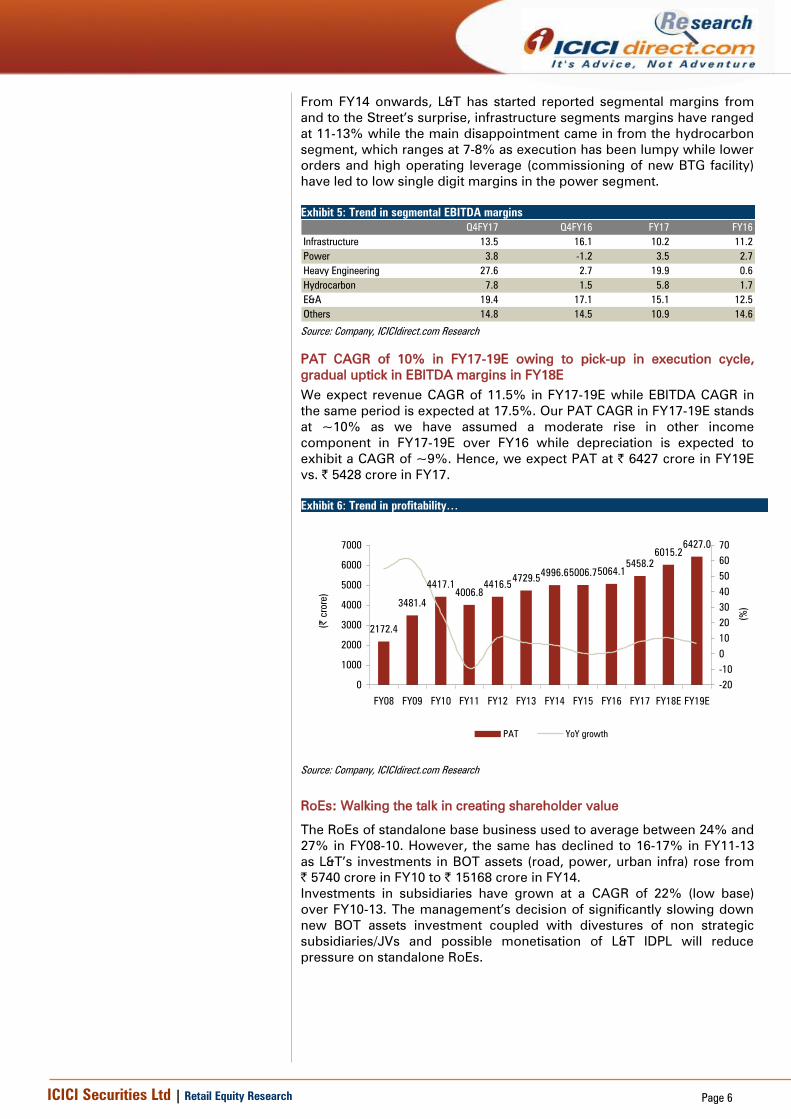
Standalone EBITDA margin was at 12.9% whereas consolidated
margins were at 11.8%. Key miss was from margin disappointment
in infrastructure segment wherein EBITDA margins for Q4FY17 were
at 13.5% vs. 16.1% in Q4FY16. On the positive side, heavy
engineering segment reported strong revenue of 26% whereas
hydrocarbon saw a solid recovery in margin to 9.8% in Q4FY17
Execution in international market to remain robust; domestic likely to
recover in FY18E
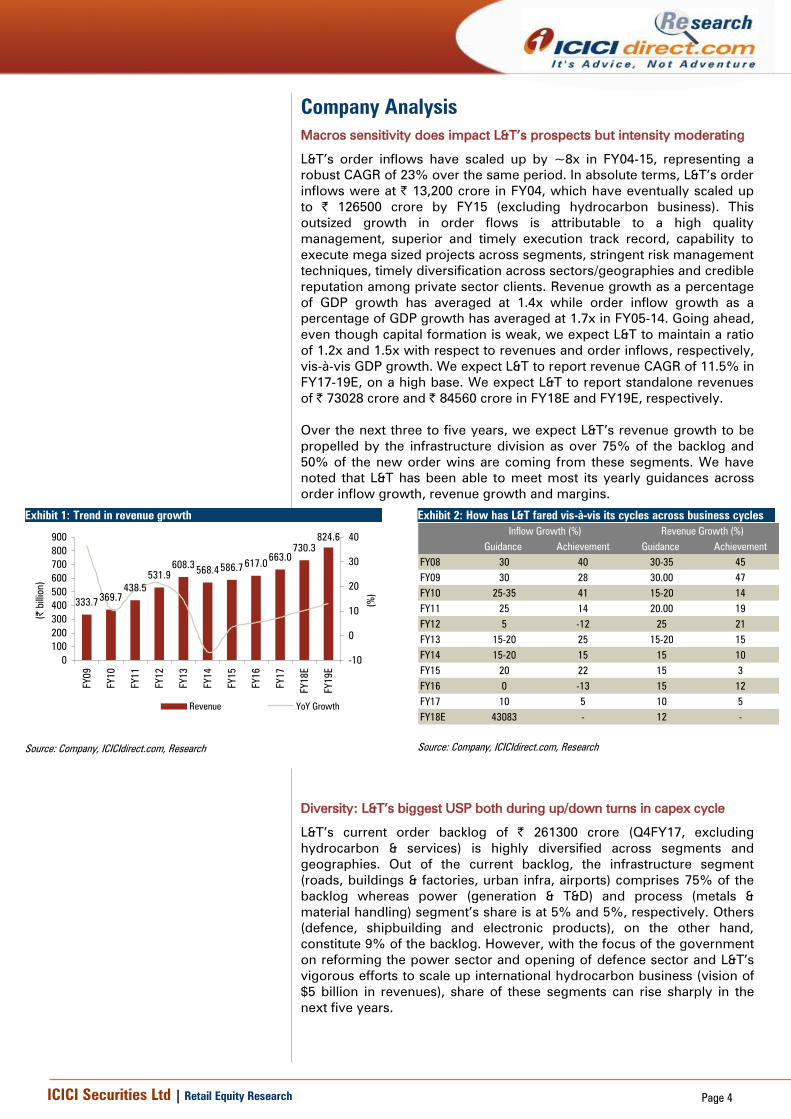
For FY17, revenues from international markets grew in excess of 15%
YoY on the back of planned execution wherein domestic revenues were
a laggard during FY17 on the back of liquidity issues, client side delays
and demonetisation (impacting the buildings and factories segment).
Going ahead also, FY18E will see growth in excess of 15% YoY wherein
domestic execution is likely to witness a gradual up-tick. The
management guidance of 12% growth builds in a moderate pick-up in
domestic execution. Going ahead, we have pencilled in 10% and 13%
YoY growth in standalone revenues in FY18E and FY19E, respectively.
Balance sheet mend gaining traction
From a balance sheet perspective, net working capital saw a significant
improvement during Q4FY17 as the same was at 19% of sales vs. 23%
of sales in FY16. Even from a cash flow perspective, the company
generated CFO to the tune of | 12200 crore in FY17 vs. | 7700 crore in
FY16. This is also reiterated by interest costs that were down, on a
standalone, consolidated basis, by 10.2%, 6% YoY, respectively.
Best play on domestic capex cycle recovery; maintain BUY
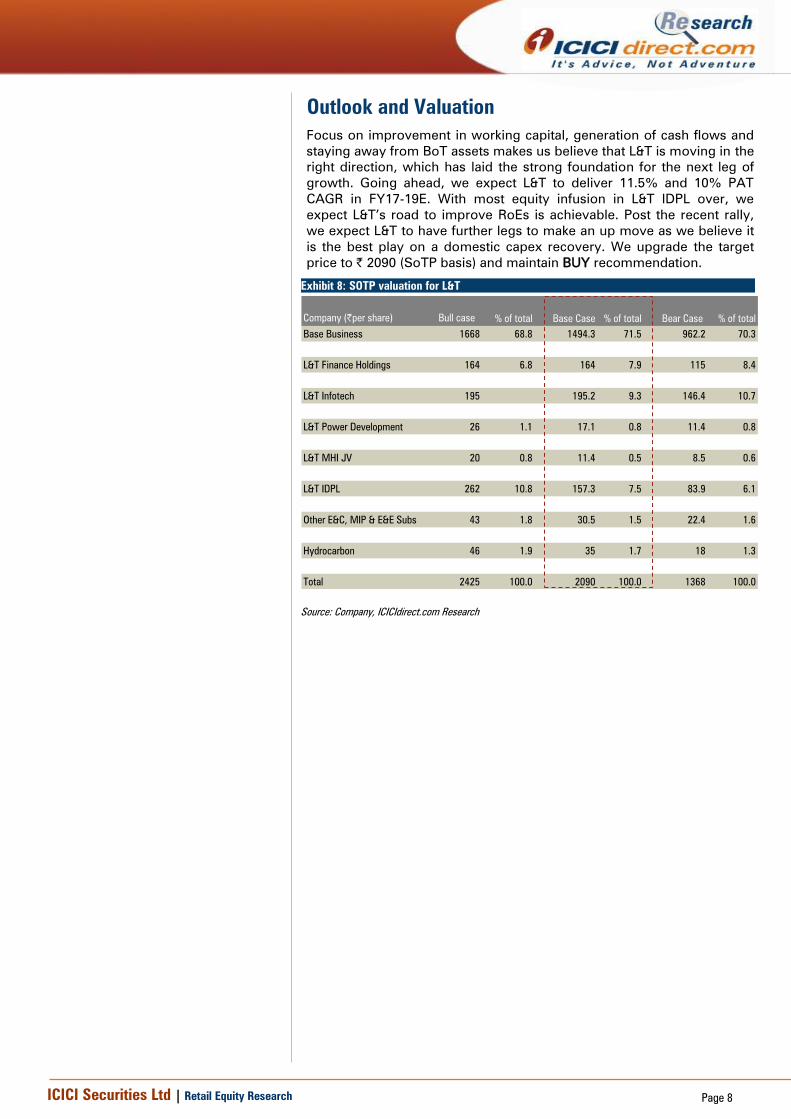
Focus on improvement of working capital, generation of cash flows and
staying away from BoT assets make us believe that L&T is moving in the
right direction. This has laid a strong foundation for the next leg of
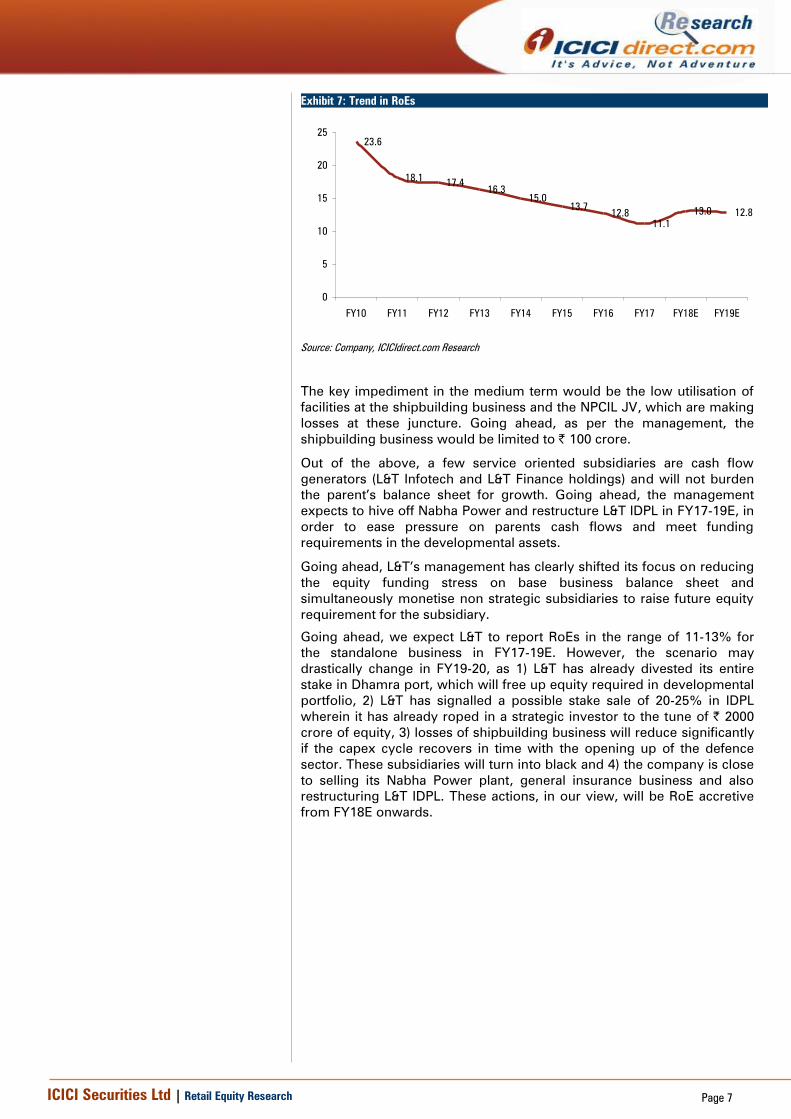
growth. Going ahead, we expect L&T to deliver 11.5% and 10% PAT
CAGR, respectively, in FY17-19E. With most equity infusion in L&T IDPL
over, we expect L&T’s road to improvement of RoEs to be achievable.
Post the recent rally, we expect L&T to have further legs to make an up
move as we believe it is the best play on domestic capex recovery. We
upgrade the target price to | 2090 (SoTP basis) and maintain BUY.
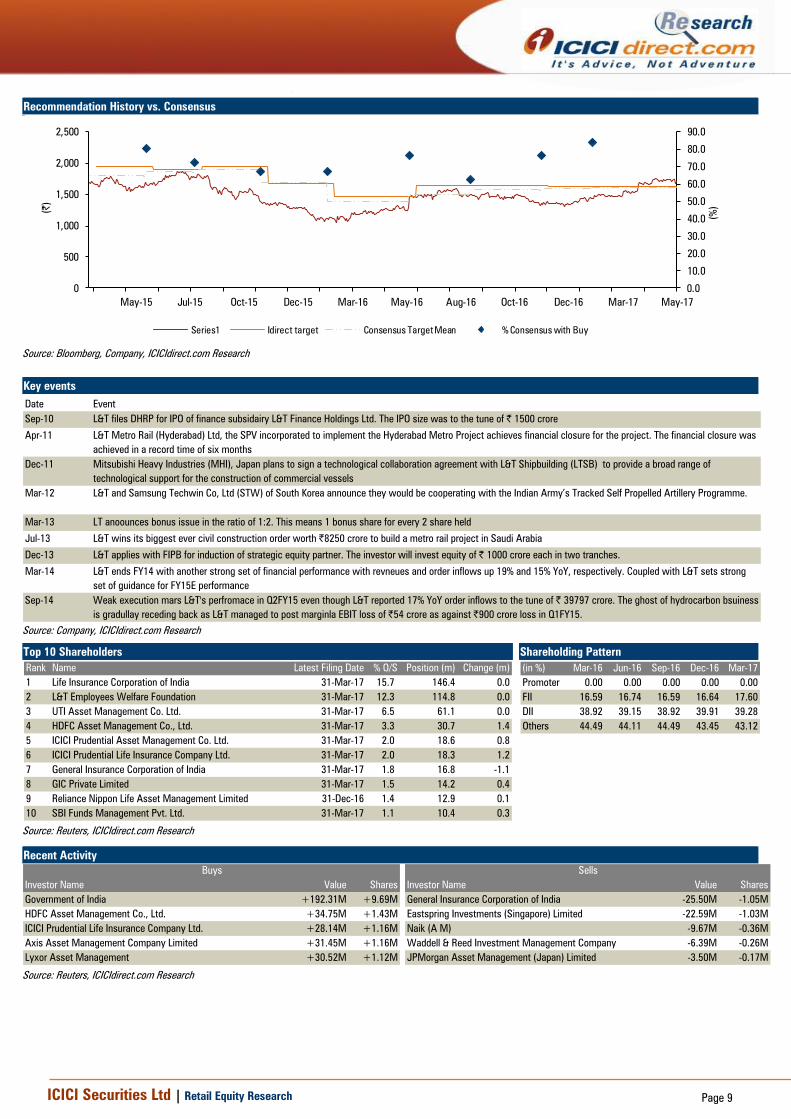
Series1 Idirect target Consensus Target Mean % Consensus with Buy
Source: Bloomberg, Company, ICICIdirect.com Research
Key events
Date Event
Sep-10 L&T files DHRP for IPO of finance subsidairy L&T Finance Holdings Ltd. The IPO size was to the tune of | 1500 crore
Apr-11 L&T Metro Rail (Hyderabad) Ltd, the SPV incorporated to implement the Hyderabad Metro Project achieves financial closure for the project. The financial closure was
achieved in a record time of six months
Dec-11 Mitsubishi Heavy Industries (MHI), Japan plans to sign a technological collaboration agreement with L&T Shipbuilding (LTSB) to provide a broad range of
technological support for the construction of commercial vessels
Mar-12 L&T and Samsung Techwin Co, Ltd (STW) of South Korea announce they would be cooperating with the Indian Army’s Tracked Self Propelled Artillery Programme.
Mar-13 LT anoounces bonus issue in the ratio of 1:2. This means 1 bonus share for every 2 share held
Jul-13 L&T wins its biggest ever civil construction order worth |8250 crore to build a metro rail project in Saudi Arabia
Dec-13 L&T applies with FIPB for induction of strategic equity partner. The investor will invest equity of | 1000 crore each in two tranches.
Mar-14 L&T ends FY14 with another strong set of financial performance with revneues and order inflows up 19% and 15% YoY, respectively. Coupled with L&T sets strong
set of guidance for FY15E performance
Sep-14 Weak execution mars L&T's perfromace in Q2FY15 even though L&T reported 17% YoY order inflows to the tune of | 39797 crore. The ghost of hydrocarbon bsuiness
is gradullay receding back as L&T managed to post marginla EBIT loss of |54 crore as against |900 crore loss in Q1FY15.
Source: Company, ICICIdirect.com Research
Top 10 Shareholders Shareholding Pattern
Rank Name Latest Filing Date % O/S Position (m) Change (m)
1 Life Insurance Corporation of India 31-Mar-17 15.7 146.4 0.0
2 L&T Employees Welfare Foundation 31-Mar-17 12.3 114.8 0.0
3 UTI Asset Management Co. Ltd. 31-Mar-17 6.5 61.1 0.0
ICICI Securities Ltd | Retail Equity Research Page 13
Disclaimer
ANALYST CERTIFICATION
We /I, Chirag Shah PGDBM, Research Analysts, authors and the names subscribed to this report, hereby certify that all of the views expressed in this research report accurately reflect our views about the
subject issuer(s) or securities. We also certify that no part of our compensation was, is, or will be directly or indirectly related to the specific recommendation(s) or view(s) in this report.
Terms & conditions and other disclosures:
ICICI Securities Limited (ICICI Securities) is a full-service, integrated investment banking and is, inter alia, engaged in the business of stock brokering and distribution of financial products. ICICI Securities Limited is a Sebi registered Research Analyst with Sebi Registration Number – INH000000990. ICICI Securities is a wholly-owned subsidiary of ICICI Bank which is India’s largest private sector bank and has its various subsidiaries engaged in businesses of housing finance, asset management, life insurance, general insurance, venture capital fund management, etc. (“associates”), the details in respect of which are available on www.icicibank.com. ICICI Securities is one of the leading merchant bankers/ underwriters of securities and participate in virtually all securities trading markets in India. We and our associates might have investment banking and other business relationship with a significant percentage of companies covered by our Investment Research Department. ICICI Securities generally prohibits its analysts, persons reporting to analysts and their relatives from maintaining a financial interest in the securities or derivatives of any companies that the analysts cover. The information and opinions in this report have been prepared by ICICI Securities and are subject to change without any notice. The report and information contained herein is strictly confidential and meant solely for the selected recipient and may not be altered in any way, transmitted to, copied or distributed, in part or in whole, to any other person or to the media or reproduced in any form, without prior written consent of ICICI Securities. While we would endeavour to update the information herein on a reasonable basis, ICICI Securities is under no obligation to update or keep the information current. Also, there may be regulatory, compliance or other reasons that may prevent ICICI Securities from doing so. Non-rated securities indicate that rating on a particular security has been suspended temporarily and such suspension is in compliance with applicable regulations and/or ICICI Securities policies, in circumstances where ICICI Securities might be acting in an advisory capacity to this company, or in certain other circumstances. This report is based on information obtained from public sources and sources believed to be reliable, but no independent veri fication has been made nor is its accuracy or completeness guaranteed. This report and information herein is solely for informational purpose and shall not be used or considered as an offer document or solicitation of offer to buy or sell or subscribe for securities or other financial instruments. Though disseminated to all the customers simultaneously, not all customers may receive this report at the same time. ICICI Securities will not treat recipients as customers by virtue of their receiving this report. Nothing in this report constitutes investment, legal, accounting and tax advice or a representation that any investment or strategy is suitable or appropriate to your specific circumstances. The securities discussed and opinions expressed in this report may not be suitable for all investors, who must make their own investment decisions, based on their own investment objectives, financial positions and needs of specific recipient. This may not be taken in substitution for the exercise of independent judgment by any recipient. The recipient should independently evaluate the investment risks. The value and return on investment may vary because of changes in interest rates, foreign exchange rates or any other reason. ICICI Securities accepts no liabilities whatsoever for any loss or damage of any kind arising out of the use of this report. Past performance is not necessarily a guide to future performance. Investors are advised to see Risk Disclosure Document to understand the risks associated before investing in the securities markets. Actual results may differ materially from those set forth in projections. Forward-looking statements are not predictions and may be subject to change without notice. ICICI Securities or its associates might have managed or co-managed public offering of securities for the subject company or might have been mandated by the subject company for any other assignment in the past twelve months. ICICI Securities or its associates might have received any compensation from the companies mentioned in the report during the period preceding twelve months from the date of this report for services in respect of managing or co-managing public offerings, corporate finance, investment banking or merchant banking, brokerage services or other advisory service in a merger or specific transaction. ICICI Securities or its associates might have received any compensation for products or services other than investment banking or merchant banking or brokerage services from the companies mentioned in the report in the past twelve months. ICICI Securities encourages independence in research report preparation and strives to minimize conflict in preparation of research report. ICICI Securities or its associates or its analysts did not receive any compensation or other benefits from the companies mentioned in the report or third party in connection with preparation of the research report. Accordingly, neither ICICI Securities nor Research Analysts and their relatives have any material conflict of interest at the time of publication of this report. It is confirmed that Chirag Shah PGDBM; Research Analysts of this report have not received any compensation from the companies mentioned in the report in the preceding twelve months. Compensation of our Research Analysts is not based on any specific merchant banking, investment banking or brokerage service transactions. ICICI Securities or its subsidiaries collectively or Research Analysts or their relatives do not own 1% or more of the equity securities of the Company mentioned in the report as of the last day of the month preceding the publication of the research report. Since associates of ICICI Securities are engaged in various financial service businesses, they might have financial interests or beneficial ownership in various companies including the subject company/companies mentioned in this report. It is confirmed that Chirag Shah PGDBM; Research Analysts do not serve as an officer, director or employee of the companies mentioned in the report. ICICI Securities may have issued other reports that are inconsistent with and reach different conclusion from the information presented in this report. Neither the Research Analysts nor ICICI Securities have been engaged in market making activity for the companies mentioned in the report. We submit that no material disciplinary action has been taken on ICICI Securities by any Regulatory Authority impacting Equity Research Analysis activities. This report is not directed or intended for distribution to, or use by, any person or entity who is a citizen or resident of or located in any locality, state, country or other jurisdiction, where such distribution, publication, availability or use would be contrary to law, regulation or which would subject ICICI Securities and affiliates to any registration or licensing requirement within such jurisdiction. The securities described herein may or may not be eligible for sale in all jurisdictions or to certain category of investors. Persons in whose possession this document may come are required to inform themselves of and to observe such restriction.