33
LAS VEGAS COMMERCIAL REAL ESTATE ROUNDUP Presented by: Presented to: October 14, 2015

LAS VEGASCOMMERCIAL REAL ESTATE
ROUNDUP
Presented by:
Presented to:
October 14, 2015

WHY WE’RE HERE
2
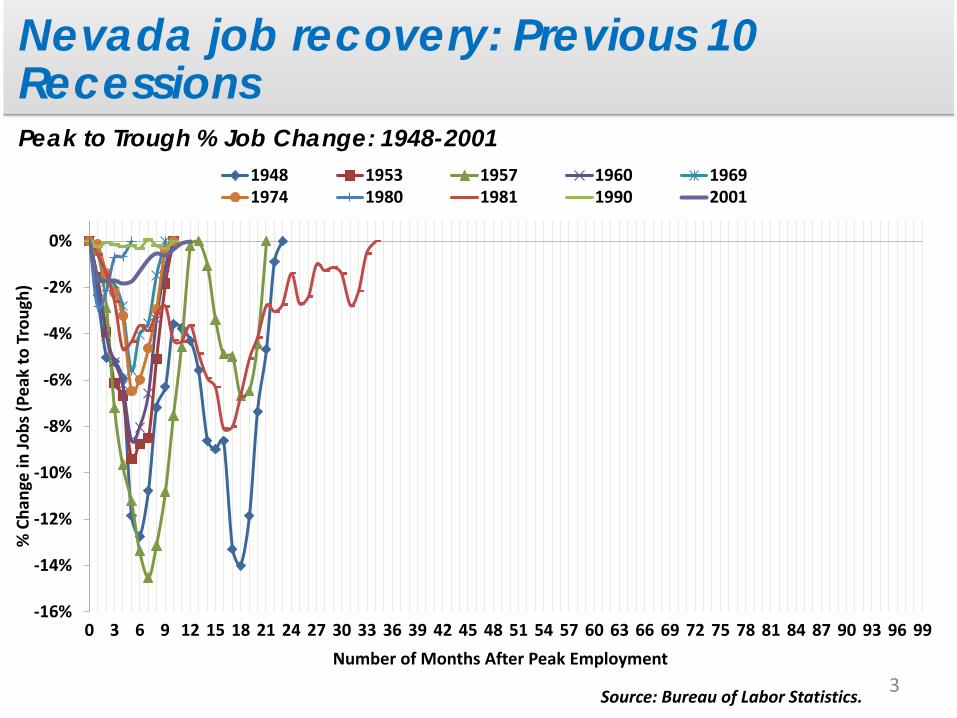
Source: Bureau of Labor Statistics.
Peak to Trough % Job Change: 1948-2001
Nevada job recovery: Previous 10 Recessions
Nevada
US
3
-16%
-14%
-12%
-10%
-8%
-6%
-4%
-2%
0%
0 3 6 9 12 15 18 21 24 27 30 33 36 39 42 45 48 51 54 57 60 63 66 69 72 75 78 81 84 87 90 93 96 99
% C
hang
e in
Jobs
(Pea
k to
Tro
ugh)
Number of Months After Peak Employment
1948 1953 1957 1960 19691974 1980 1981 1990 2001

Source: Bureau of Labor Statistics.
Peak to Trough % Job Change: 1948 to Present
Nevada job recovery from Great Recession (after 99 months)
Nevada
US
4
-16%
-14%
-12%
-10%
-8%
-6%
-4%
-2%
0%
0 3 6 9 12 15 18 21 24 27 30 33 36 39 42 45 48 51 54 57 60 63 66 69 72 75 78 81 84 87 90 93 96 99
% C
hang
e in
Jobs
(Pea
k to
Tro
ugh)
Number of Months After Peak Employment
1948 1953 1957 1960 1969 19741980 1981 1990 2001 2007 US 2007
US Jobs
NV Jobs

PART 1: THE SOUTHERNNEVADA JOB MARKET
5
JobsAbsorptionVacancyRents
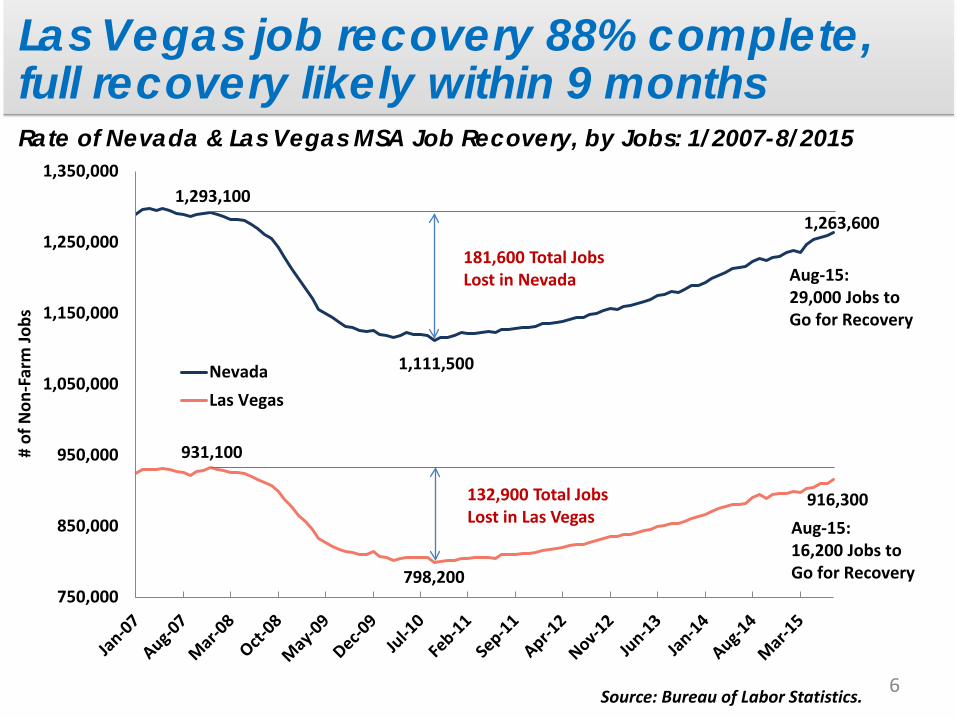
Source: Bureau of Labor Statistics.
Rate of Nevada & Las Vegas MSA Job Recovery, by Jobs: 1/2007-8/2015
Las Vegas job recovery 88% complete,full recovery likely within 9 months
6
1,293,1001,263,600
931,100
916,300
750,000
850,000
950,000
1,050,000
1,150,000
1,250,000
1,350,000
# of
Non
-Far
m Jo
bs
NevadaLas Vegas
1,111,500
181,600 Total Jobs Lost in Nevada
798,200
132,900 Total Jobs Lost in Las Vegas
Aug-15:29,000 Jobs to Go for Recovery
Aug-15:16,200 Jobs to Go for Recovery

Source: Bureau of Labor Statistics.
Nevada Job Growth & Headline Unemployment Rate: 8/2006-8/2015
Unemployment continues to drop, job growth slowing but good
7
-15%
-10%
-5%
0%
5%
10%
15%
Perc
ent (
%)
Axis Title
Job Growth Unemp. Rate
Aug-15 Job Gr: +3.4%
Aug-15 Unemp: 7.1%
Source: Bureau of Labor Statistics.
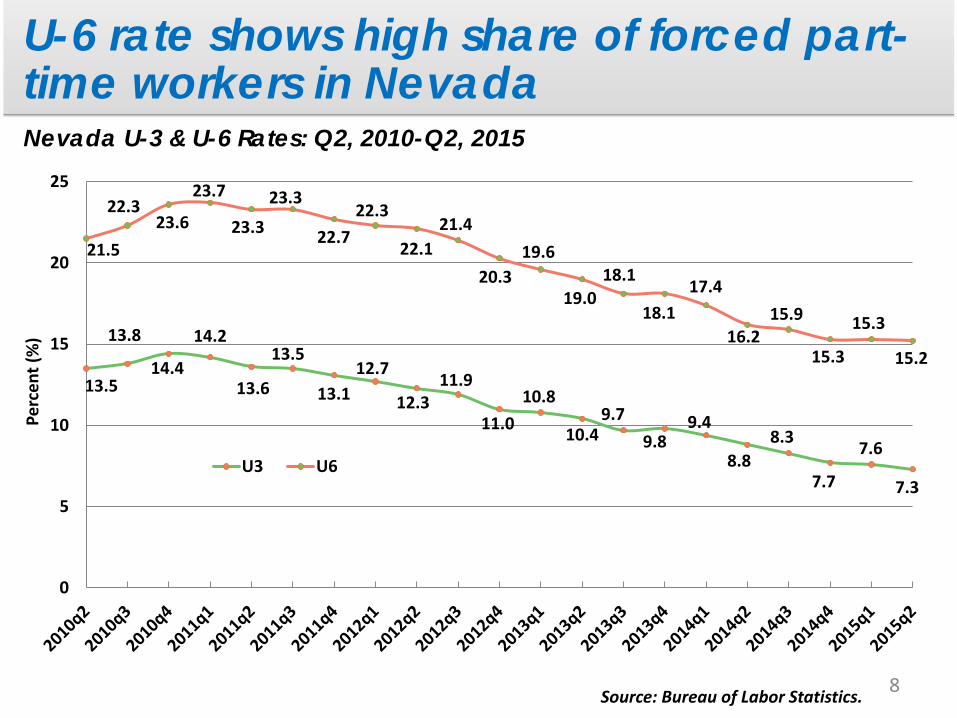
Nevada U-3 & U-6 Rates: Q2, 2010-Q2, 2015
U-6 rate shows high share of forced part-time workers in Nevada
8
13.5
13.8
14.4
14.2
13.6
13.5
13.112.7
12.311.9
11.010.8
10.49.7
9.89.4
8.88.3
7.7
7.6
7.3
21.5
22.323.6
23.7
23.3
23.3
22.722.3
22.121.4
20.319.6
19.018.1
18.117.4
16.215.9
15.3
15.3
15.2
0
5
10
15
20
25
Perc
ent (
%)
U3 U6
Source: Bureau of Labor Statistics.
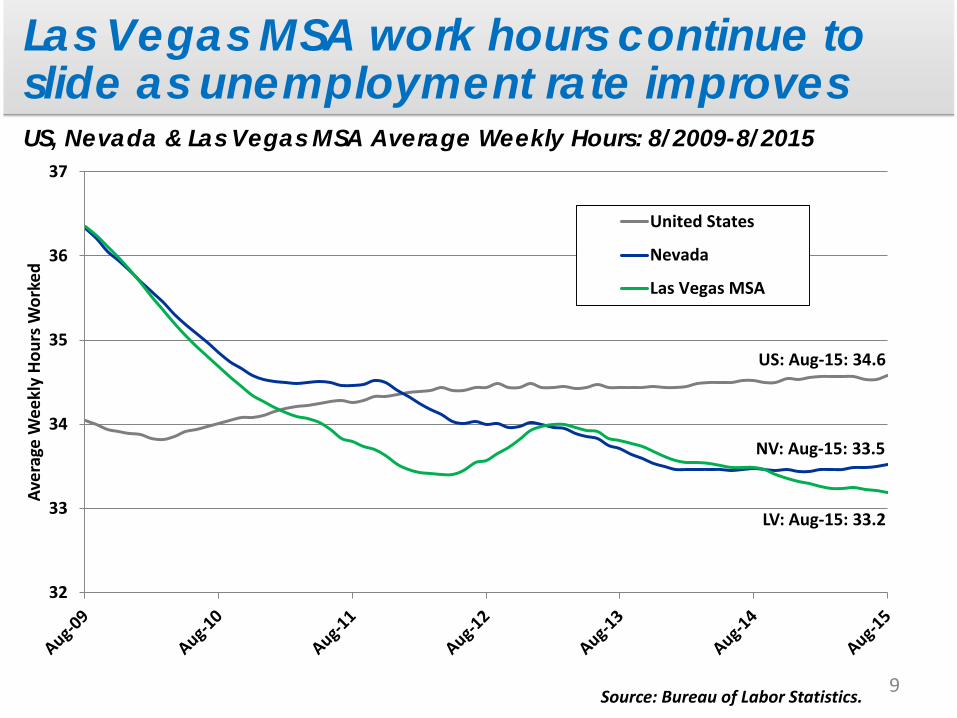
US, Nevada & Las Vegas MSA Average Weekly Hours: 8/2009-8/2015
Las Vegas MSA work hours continue to slide as unemployment rate improves
9
32
33
34
35
36
37
Aver
age
Wee
kly
Hour
s Wor
ked
United States
Nevada
Las Vegas MSA
US: Aug-15: 34.6
LV: Aug-15: 33.2
NV: Aug-15: 33.5
Source: Bureau of Labor Statistics.
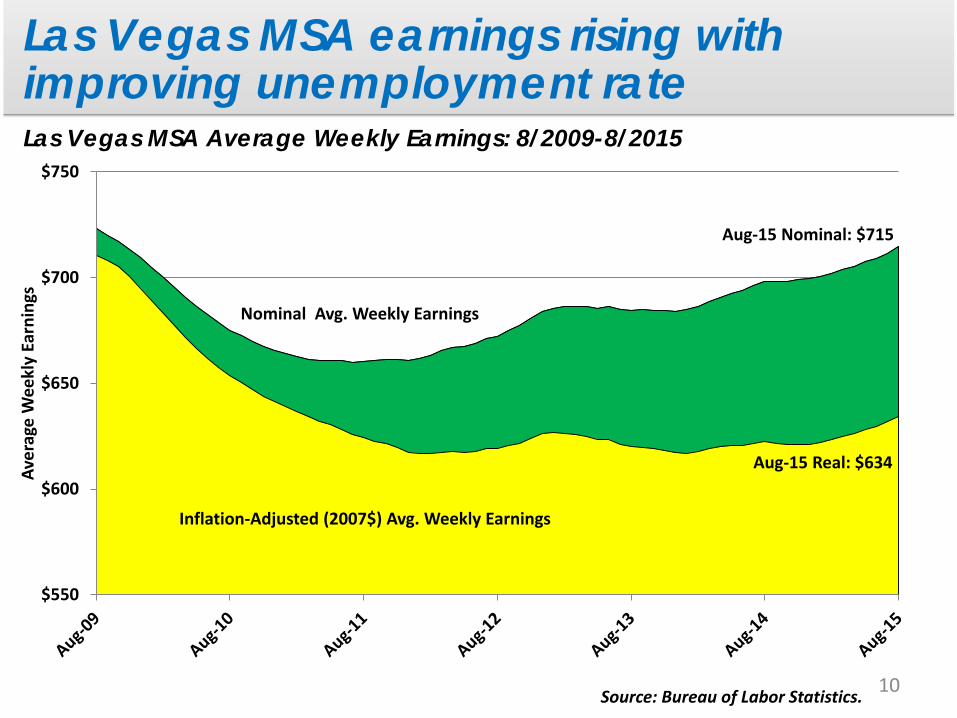
Las Vegas MSA Average Weekly Earnings: 8/2009-8/2015
Las Vegas MSA earnings rising with improving unemployment rate
10
$550
$600
$650
$700
$750
Aver
age
Wee
kly
Earn
ings
Aug-15 Nominal: $715
Nominal Avg. Weekly Earnings
Inflation-Adjusted (2007$) Avg. Weekly Earnings
Aug-15 Real: $634
Source: Nevada Department of Taxation; calculated by RCG Economics.
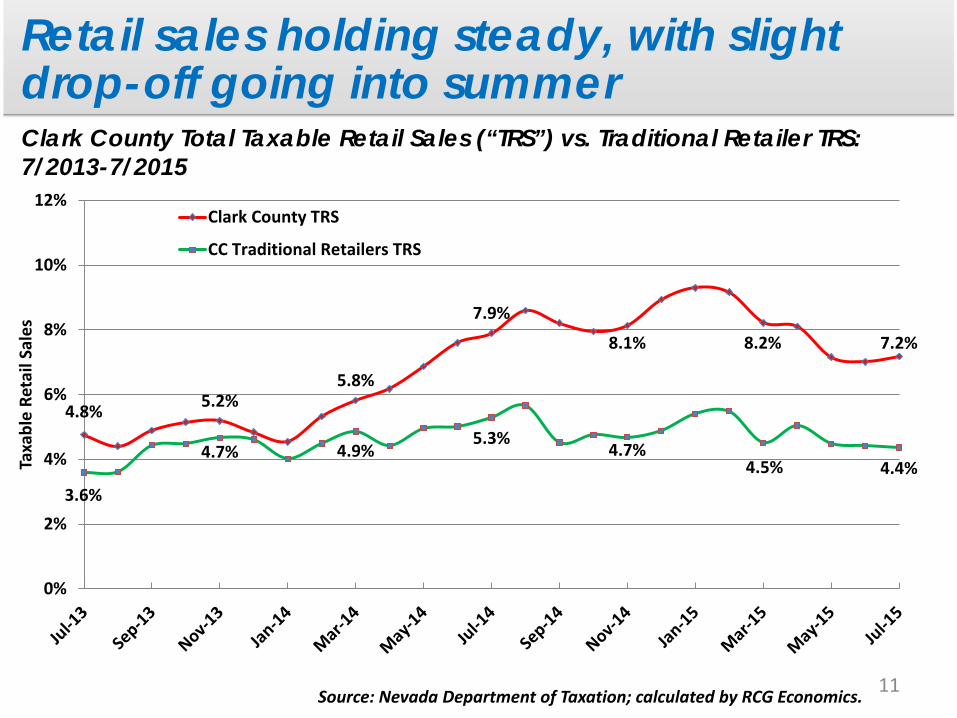
Clark County Total Taxable Retail Sales (“TRS”) vs. Traditional Retailer TRS: 7/2013-7/2015
Retail sales holding steady, with slight drop-off going into summer
11
4.8% 5.2%5.8%
7.9%
8.1% 8.2% 7.2%
3.6%
4.7% 4.9%5.3%
4.7%4.5% 4.4%
0%
2%
4%
6%
8%
10%
12%
Taxa
ble
Reta
il Sa
les
Clark County TRS
CC Traditional Retailers TRS
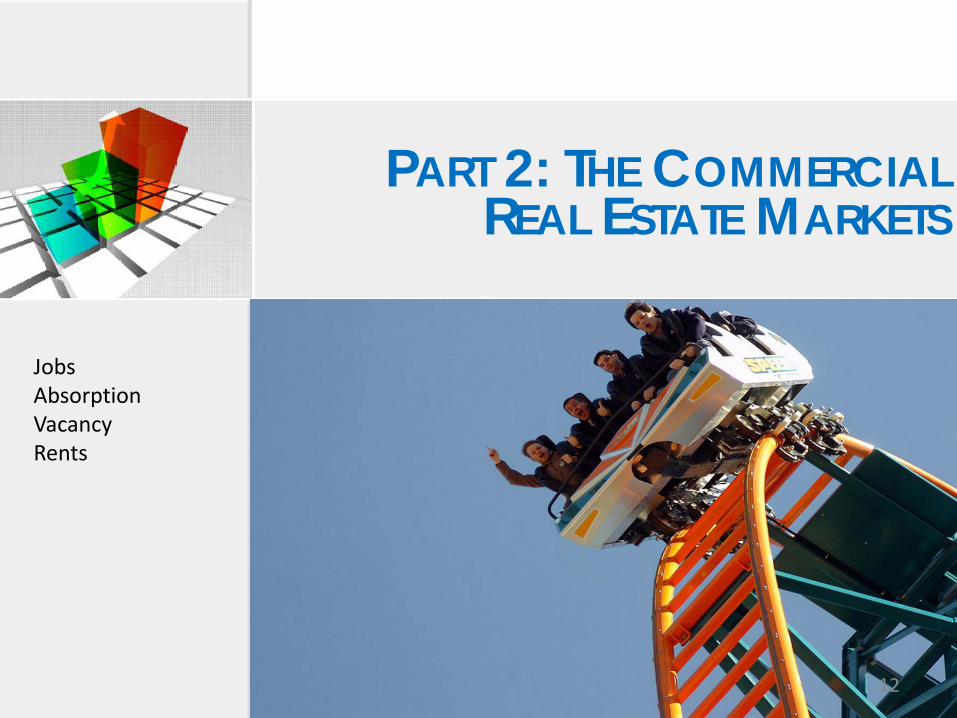
PART 2: THE COMMERCIALREAL ESTATE MARKETS
12
JobsAbsorptionVacancyRents
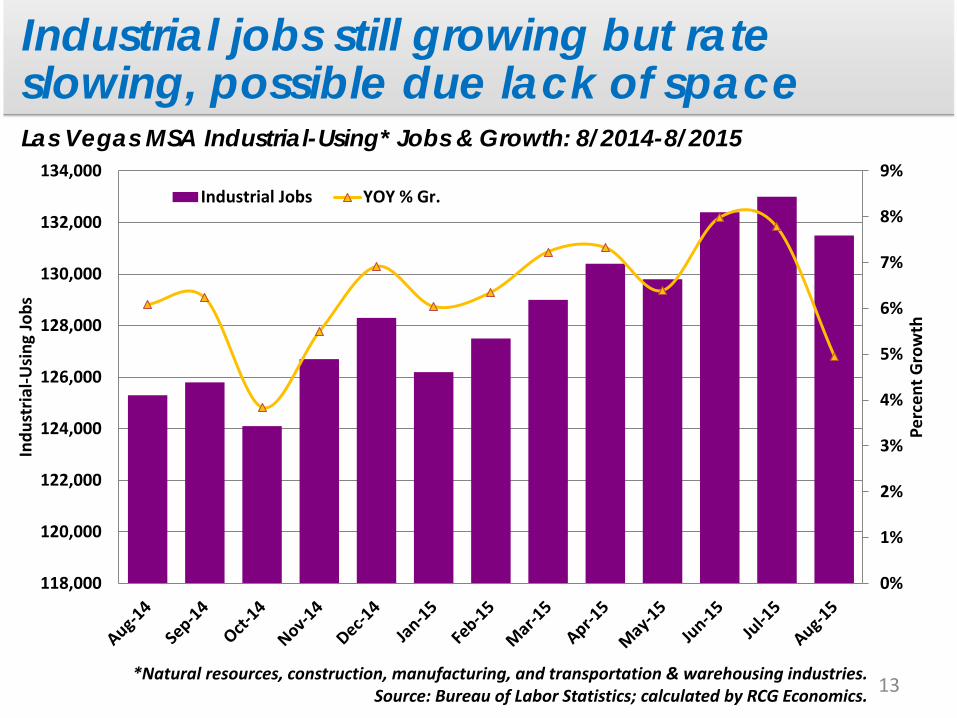
*Natural resources, construction, manufacturing, and transportation & warehousing industries.Source: Bureau of Labor Statistics; calculated by RCG Economics.
Las Vegas MSA Industrial-Using* Jobs & Growth: 8/2014-8/2015
Industrial jobs still growing but rate slowing, possible due lack of space
13
0%
1%
2%
3%
4%
5%
6%
7%
8%
9%
118,000
120,000
122,000
124,000
126,000
128,000
130,000
132,000
134,000
Perc
ent G
row
th
Indu
stria
l-Usi
ng Jo
bs
Industrial Jobs YOY % Gr.
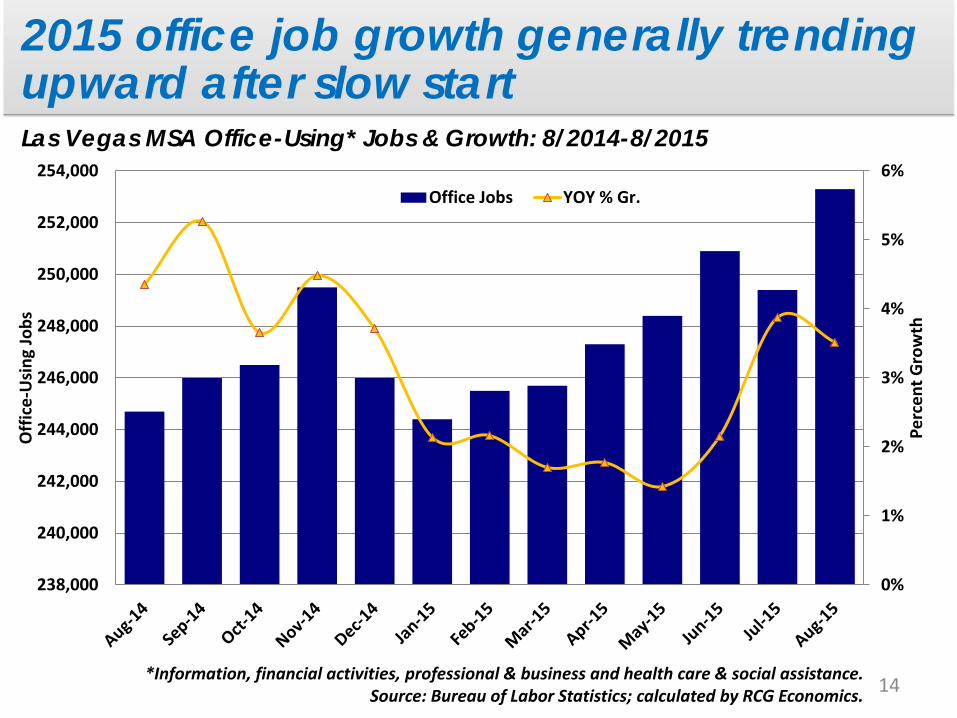
*Information, financial activities, professional & business and health care & social assistance. Source: Bureau of Labor Statistics; calculated by RCG Economics.
Las Vegas MSA Office-Using* Jobs & Growth: 8/2014-8/2015
2015 office job growth generally trending upward after slow start
14
0%
1%
2%
3%
4%
5%
6%
238,000
240,000
242,000
244,000
246,000
248,000
250,000
252,000
254,000
Perc
ent G
row
th
Off
ice-
Usi
ng Jo
bs
Office Jobs YOY % Gr.

Source: Bureau of Labor Statistics; calculated by RCG Economics.
Las Vegas MSA Retail-Using Jobs & Growth: 8/2014-8/2015
Retail job growth falling big during summer doldrums; will pick-up in holidays
15
-2%
-1%
0%
1%
2%
3%
4%
5%
6%
96,000
98,000
100,000
102,000
104,000
106,000
108,000
110,000
Perc
ent G
row
th
Reta
il-U
sing
Jobs
Retail Jobs YOY % Gr.
Source: RCG Economics.
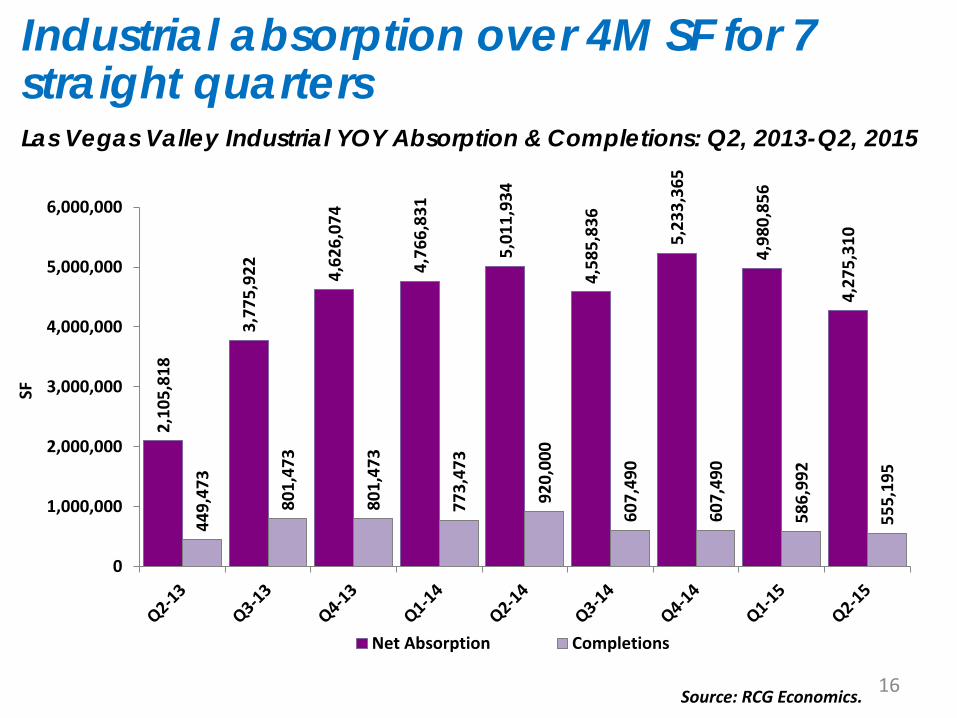
Las Vegas Valley Industrial YOY Absorption & Completions: Q2, 2013-Q2, 2015
Industrial absorption over 4M SF for 7 straight quarters
16
2,10
5,81
8
3,77
5,92
2
4,62
6,07
4
4,76
6,83
1
5,01
1,93
4
4,58
5,83
6
5,23
3,36
5
4,98
0,85
6
4,27
5,31
0
449,
473
801,
473
801,
473
773,
473
920,
000
607,
490
607,
490
586,
992
555,
195
0
1,000,000
2,000,000
3,000,000
4,000,000
5,000,000
6,000,000
SF
Net Absorption Completions

Source: RCG Economics.
Las Vegas Valley Spec Office YOY Absorption & Completions: Q2, 2013-Q2, 2015
Office absorption declined 3 quarters in a row
17
235,
712
-100
,701
129,
477
593,
814
826,
613
1,62
0,09
9
1,23
0,73
7
954,
786
754,
556
67,6
92
26,0
00
81,0
00
126,
700
126,
700
270,
700
225,
700
392,
868
392,
868
-800,000
-300,000
200,000
700,000
1,200,000
1,700,000
2,200,000
SF
Net Absorption Completions

Source: RCG Economics.
Las Vegas Valley Anch. Retail YOY Absorption & Completions: Q2, 2013-Q2, 2015
Retail absorption effectively zero over last 2 quarters
18
698,
027
419,
235
484,
504
436,
903
350,
775
594,
326
320,
789
24,5
31
1,64
4
0 0 0 0 0 0
222,
000
222,
000
222,
000
0
100,000
200,000
300,000
400,000
500,000
600,000
700,000
800,000
SF
Net Absorption Completions
Source: RCG Economics.
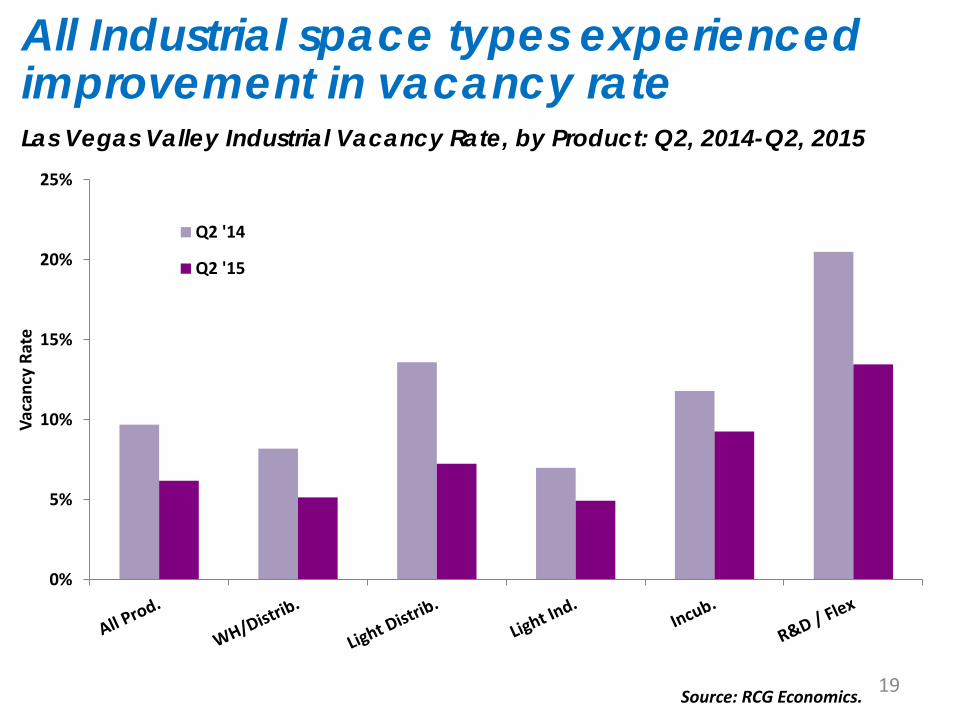
Las Vegas Valley Industrial Vacancy Rate, by Product: Q2, 2014-Q2, 2015
All Industrial space types experienced improvement in vacancy rate
19
0%
5%
10%
15%
20%
25%
Vaca
ncy
Rate
Q2 '14
Q2 '15
Source: RCG Economics.
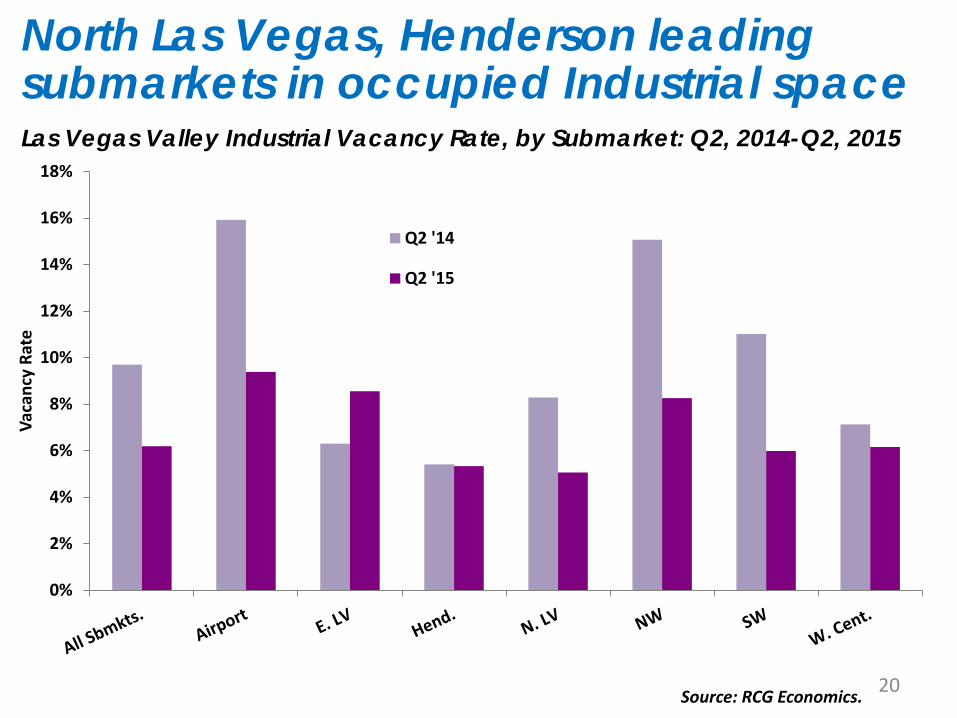
Las Vegas Valley Industrial Vacancy Rate, by Submarket: Q2, 2014-Q2, 2015
North Las Vegas, Henderson leading submarkets in occupied Industrial space
20
0%
2%
4%
6%
8%
10%
12%
14%
16%
18%
Vaca
ncy
Rate
Q2 '14
Q2 '15
Source: RCG Economics.
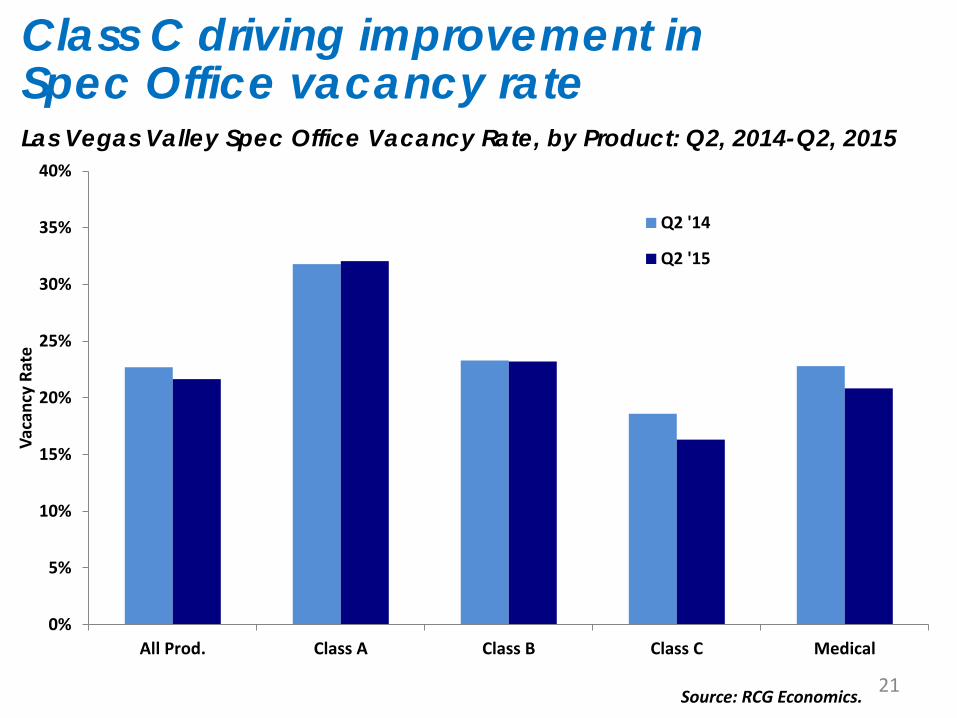
Las Vegas Valley Spec Office Vacancy Rate, by Product: Q2, 2014-Q2, 2015
Class C driving improvement inSpec Office vacancy rate
21
0%
5%
10%
15%
20%
25%
30%
35%
40%
All Prod. Class A Class B Class C Medical
Vaca
ncy
Rate
Q2 '14
Q2 '15

Source: RCG Economics.
Las Vegas Valley Spec Office Vacancy Rate, by Submarket: Q2, 2014-Q2, 2015
Class C-heavy NLV doing well, Class A-heavy East LV (Hughes Center) lagging
22
0%
5%
10%
15%
20%
25%
30%
35%
Vaca
ncy
Rate
Q2 '14
Q2 '15
Source: RCG Economics.
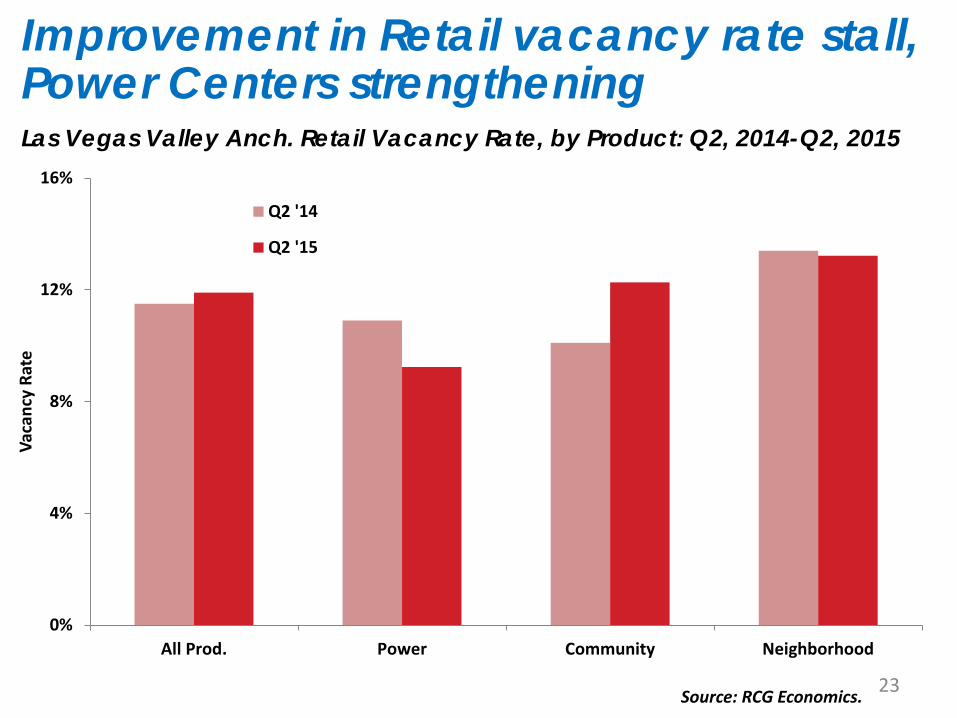
Las Vegas Valley Anch. Retail Vacancy Rate, by Product: Q2, 2014-Q2, 2015
Improvement in Retail vacancy rate stall, Power Centers strengthening
23
0%
4%
8%
12%
16%
All Prod. Power Community Neighborhood
Vaca
ncy
Rate
Q2 '14
Q2 '15

Source: RCG Economics.
Las Vegas Valley Anch. Retail Vacancy Rate, by Submarket: Q2, 2014-Q2, 2015
NE, NW & SW markets healthy, while Downtown, University East struggling
24
0%
4%
8%
12%
16%
20%
Vaca
ncy
Rate
Q2 '14
Q2 '15

Source: RCG Economics.
Las Vegas Valley Industrial Vacancy Rate & Rents: Q2, 2014-Q2, 2015
Industrial rents rising slowly as vacancy rate drops below10%; quality space gone
25
$0.00
$0.10
$0.20
$0.30
$0.40
$0.50
$0.60
$0.70
$0.80
$0.90
$1.00
0%
2%
4%
6%
8%
10%
12%
14%
16%
18%
20%
$ PS
F Pe
r Mon
th (N
NN
)
% V
acan
t
Vacancy - Q2-15 = 6.2%
Asking Rents - Q2-15 = $0.66 PSF/Mo.

Source: RCG Economics.
Las Vegas Valley Spec Office Vacancy Rate & Rents: Q2, 2014-Q2, 2015
Office rents roughly stable with a high but stable vacancy rate
26
$0.00
$0.50
$1.00
$1.50
$2.00
$2.50
$3.00
0%
5%
10%
15%
20%
25%
30%
$ PS
F Pe
r Mon
th (F
SG)
% V
acan
t
Vacancy - Q2-15 = 21.6%
Asking Rents - Q2-15 = $2.14 PSF/Mo.
Source: RCG Economics.
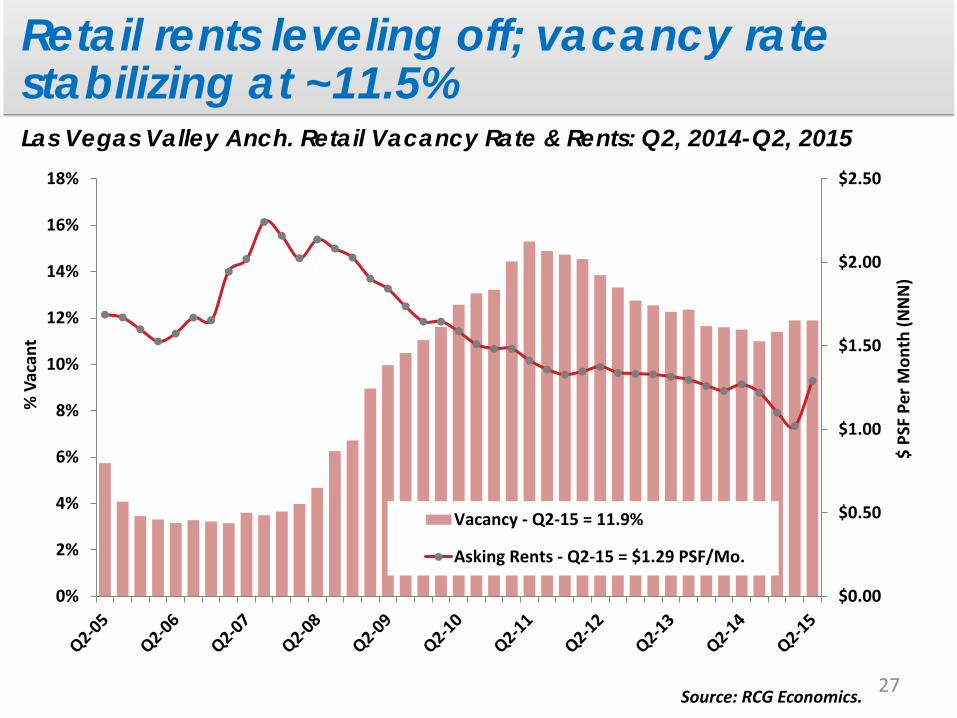
Las Vegas Valley Anch. Retail Vacancy Rate & Rents: Q2, 2014-Q2, 2015
Retail rents leveling off; vacancy rate stabilizing at ~11.5%
27
$0.00
$0.50
$1.00
$1.50
$2.00
$2.50
0%
2%
4%
6%
8%
10%
12%
14%
16%
18%
$ PS
F Pe
r Mon
th (N
NN
)
% V
acan
t
Vacancy - Q2-15 = 11.9%
Asking Rents - Q2-15 = $1.29 PSF/Mo.

Source: RCG Economics.
Las Vegas Valley Industrial Completions as % of Inventory: Q2, 2014-Q2, 2015
Industrial completions picking up; more space on the way
28
0.0%
0.5%
1.0%
1.5%
2.0%
2.5%
Com
plet
ions
as %
of I
nven
tory

Source: RCG Economics.
Las Vegas Valley Spec Office Completions as % of Inventory: Q2, 2014-Q2, 2015
New Office completions started recently,some targeted growth ahead
29
0.0%
0.5%
1.0%
1.5%
2.0%
2.5%
3.0%
3.5%
4.0%
4.5%
Com
plet
ions
as %
of I
nven
tory
Source: RCG Economics.
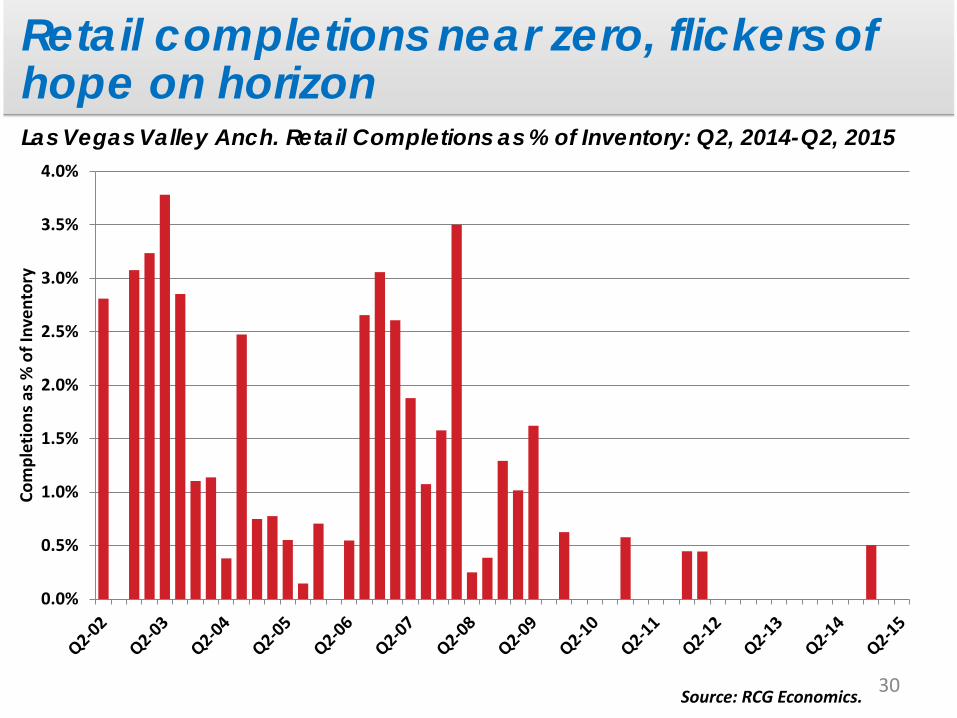
Las Vegas Valley Anch. Retail Completions as % of Inventory: Q2, 2014-Q2, 2015
Retail completions near zero, flickers of hope on horizon
30
0.0%
0.5%
1.0%
1.5%
2.0%
2.5%
3.0%
3.5%
4.0%
Com
plet
ions
as %
of I
nven
tory

Our Services & Products
Our Services Real Estate Market Research Regional Economics Demographics Public Policy Research Tax Policy Analysis
Our Products The Stat Pack Nevada Job Flash Quarterly Commercial Real Estate Services Metro Area Overviews
31

Questions?
32


