Laser-based comparison calibration of laboratory standard microphones Randall P. Wagner, 1,a) Richard A. Allen, 1 and Qian Dong 2 1 Quantum Measurement Division, Physical Measurement Laboratory, National Institute of Standards and Technology, 100 Bureau Drive, Gaithersburg, Maryland 20899, USA 2 Department of Mechanical Engineering, Temple University, 1947 North 12th Street, Philadelphia, Pennsylvania 19122, USA [email protected], [email protected], [email protected]Abstract: A precision laser-based comparison calibration method for laboratory standard microphones is described that uses reference microphones calibrated by the pressure reciprocity method. Electrical drive current and diaphragm velocity are measured while the microphones are driven as transmitters/sources of sound; the diaphragm velocity is measured using scan- ning laser Doppler vibrometry. Sensitivities determined using this method display very good agreement with those determined directly by reciprocity for seven such test microphones at 250 and 1000 Hz. At these frequencies, the expanded (coverage fac- tor k ¼ 2) uncertainties of this comparison calibration method for these microphones are 60.05 dB. [Editor: Mark Sheplak] https://doi.org/10.1121/10.0005919 Received: 2 June 2021 Accepted: 2 August 2021 Published Online: 30 August 2021 1. Introduction Microphones are calibrated to determine their sensitivities for sound pressure measurements and to calibrate other micro- phones as well as sound calibrators, which apply known sound pressures to calibrate acoustical measurement equipment used in the laboratory or field. Such equipment includes sound-level meters, personal sound exposure meters (i.e., noise dosimeters), noise monitoring stations, sound power measurement systems, audiometric equipment, hearing aid test set- ups, and measuring microphone systems. The sensitivity of a microphone is expressed in SI units of V/Pa, but often it is expressed instead as a sensitivity level in dB with respect to a reference of 1 V/Pa. Primary microphone calibrations which are carried out without the need for a reference to another standard of sound pressure (e.g., a calibrated microphone), are performed at national measurement institutes and other organizations worldwide using the reciprocity method. 1–4 For the calibration of laboratory standard (LS) microphones which are desig- nated as type LS1P (nominal 18.6-mm diameter, flat pressure response) or type LS2P (nominal 9.3-mm diameter, flat pres- sure response), 5,6 this method is standardized. 7,8 Standardized methods for secondary calibrations of microphones 9 are implemented by simultaneously or sequen- tially exposing a calibrated reference microphone and the test microphone to nominally identical acoustic fields. The ratio of the pressure sensitivities of the two microphones is then assumed to be equal to the ratio of their output voltages. A critical element of successful implementation of these methods is ensuring that the two microphones are exposed to identi- cal acoustic fields. The applicable standard describes several mounting arrangements for both microphones to achieve such fields. At the National Institute of Standards and Technology (NIST), a reciprocity-based comparison method is used where a calibrated reference microphone serves as a transmitter electrically driven to produce sound in an acoustic coupler cavity that is sensed by the receiver microphone which is an uncalibrated test microphone. 10 The sensitivity of the test microphone is determined from drive-to-receive voltage ratio measurements, the reference microphone sensitivity and driving point electrical impedance, and the acoustic transfer impedance of the cavity. One approach that has been investigated for microphone calibration as an alternative to the reciprocity method involves laser Doppler vibrometer (LDV) measurements of the velocity at different points on a microphone diaphragm to determine its volume velocity when acting as a transmitter/source of sound driven with a current through its electrical ter- minals. 11–13 This approach utilizes the fact that the magnitude of the pressure sensitivity of a reciprocal transducer is the same regardless of whether it is used as a receiver of sound or a source of sound. The former is expressed in terms of open-circuit output voltage for a given incident sound pressure uniformly distributed across the diaphragm, whereas the latter is expressed in terms of output volume velocity for a given drive current. Both expressions reduce to the same SI base units. These investigations have clearly demonstrated the feasibility of implementing primary microphone calibrations a) Author to whom correspondence should be addressed. JASA Express Lett. 1 (8), 082803 (2021) ARTICLE asa.scitation.org/journal/jel
Transcript
Laser-based comparison calibration of laboratorystandard microphones
Randall P. Wagner,1,a) Richard A. Allen,1 and Qian Dong2
1Quantum Measurement Division, Physical Measurement Laboratory, National Institute of Standards and Technology,100 Bureau Drive, Gaithersburg, Maryland 20899, USA
2Department of Mechanical Engineering, Temple University, 1947 North 12th Street, Philadelphia, Pennsylvania 19122,USA
Abstract: A precision laser-based comparison calibration method for laboratory standard microphones is described that usesreference microphones calibrated by the pressure reciprocity method. Electrical drive current and diaphragm velocity aremeasured while the microphones are driven as transmitters/sources of sound; the diaphragm velocity is measured using scan-ning laser Doppler vibrometry. Sensitivities determined using this method display very good agreement with those determineddirectly by reciprocity for seven such test microphones at 250 and 1000Hz. At these frequencies, the expanded (coverage fac-tor k¼ 2) uncertainties of this comparison calibration method for these microphones are 60.05 dB.
[Editor: Mark Sheplak] https://doi.org/10.1121/10.0005919
Received: 2 June 2021 Accepted: 2 August 2021 Published Online: 30 August 2021
1. Introduction
Microphones are calibrated to determine their sensitivities for sound pressure measurements and to calibrate other micro-phones as well as sound calibrators, which apply known sound pressures to calibrate acoustical measurement equipmentused in the laboratory or field. Such equipment includes sound-level meters, personal sound exposure meters (i.e., noisedosimeters), noise monitoring stations, sound power measurement systems, audiometric equipment, hearing aid test set-ups, and measuring microphone systems. The sensitivity of a microphone is expressed in SI units of V/Pa, but often it isexpressed instead as a sensitivity level in dB with respect to a reference of 1V/Pa.
Primary microphone calibrations which are carried out without the need for a reference to another standard ofsound pressure (e.g., a calibrated microphone), are performed at national measurement institutes and other organizationsworldwide using the reciprocity method.1–4 For the calibration of laboratory standard (LS) microphones which are desig-nated as type LS1P (nominal 18.6-mm diameter, flat pressure response) or type LS2P (nominal 9.3-mm diameter, flat pres-sure response),5,6 this method is standardized.7,8
Standardized methods for secondary calibrations of microphones9 are implemented by simultaneously or sequen-tially exposing a calibrated reference microphone and the test microphone to nominally identical acoustic fields. The ratioof the pressure sensitivities of the two microphones is then assumed to be equal to the ratio of their output voltages. Acritical element of successful implementation of these methods is ensuring that the two microphones are exposed to identi-cal acoustic fields. The applicable standard describes several mounting arrangements for both microphones to achieve suchfields. At the National Institute of Standards and Technology (NIST), a reciprocity-based comparison method is usedwhere a calibrated reference microphone serves as a transmitter electrically driven to produce sound in an acoustic couplercavity that is sensed by the receiver microphone which is an uncalibrated test microphone.10 The sensitivity of the testmicrophone is determined from drive-to-receive voltage ratio measurements, the reference microphone sensitivity anddriving point electrical impedance, and the acoustic transfer impedance of the cavity.
One approach that has been investigated for microphone calibration as an alternative to the reciprocity methodinvolves laser Doppler vibrometer (LDV) measurements of the velocity at different points on a microphone diaphragm todetermine its volume velocity when acting as a transmitter/source of sound driven with a current through its electrical ter-minals.11–13 This approach utilizes the fact that the magnitude of the pressure sensitivity of a reciprocal transducer is thesame regardless of whether it is used as a receiver of sound or a source of sound. The former is expressed in terms ofopen-circuit output voltage for a given incident sound pressure uniformly distributed across the diaphragm, whereas thelatter is expressed in terms of output volume velocity for a given drive current. Both expressions reduce to the same SIbase units. These investigations have clearly demonstrated the feasibility of implementing primary microphone calibrations
a)Author to whom correspondence should be addressed.
with laser-based velocity measurements of diaphragm vibration, but the results obtained were not established to be asaccurate as the results typically obtained with the reciprocity method. Along similar lines, a technique that utilizesmicroscope-mounted laser vibrometers to measure displacements across the diaphragms of piezoelectric micro-electromechanical system microphones and dynamic pressure sensors during electromechanical actuation has been devel-oped to replace shock tube measurements as a means for calibrating these piezoelectric devices.14
In preliminary scanning LDV velocity measurements done at NIST of type LS1P microphones, coarse scans weremade across the entire diaphragm of each microphone to develop velocity profiles as a function of the radial distancefrom the center. Figure 1 shows such a velocity profile for one of the microphones driven with a current of 0.676lA at afrequency of 1000Hz. The data with best repeatability were acquired in the central region of the diaphragm where themotion is greatest and where the data are relatively uniform spatially. Based on these observations, a model and equationsoriginally developed for calibration utilizing a single-point measurement at the diaphragm center, without a referencemicrophone,13 were applied to develop the precision laser-based comparison calibration method discussed herein thatuses a reference LS1P microphone calibrated by reciprocity. Application of this model therefore led to the acquisition ofvelocity data with a fine spatial resolution in a relatively small scan area around the diaphragm center to optimize thescanning procedure for the comparison calibration method.
The magnitude of the frequency-dependent pressure sensitivity jMj of a microphone in transmitter mode isexpressed as
Mj j ¼ � qiZa þ Zr
Za
��������; (1)
where q is the volume velocity, i is the drive current through the terminals of the microphone, Za is the acoustic imped-ance of the microphone, and Zr is the radiation impedance of the microphone. For microphones of the same type, themodel assumes that the distribution of vibration on the surface of the diaphragm and the volume velocity normalized tothe velocity at the center of the diaphragm are consistent from sample to sample in terms of the normalized frequency,which is equal to the drive frequency divided by the resonance frequency of the microphone sample. To apply the model,Eq. (1) is rewritten as
Mj j ¼ �qnu r0ð Þ
iZa þ Zr
Za
��������; (2)
where q is replaced by the product of the normalized volume velocity qn and the velocity at the diaphragm center u(r0).Values of qn, derived empirically from LDV velocity measurements across the diaphragms of LS1P microphones driven intransmitter mode, are available as a function of the normalized frequency in the forms of graphical data13 and tabulardata.15
For the comparison calibration work described herein, a version of Eq. (2) is applied for a reference (calibrated)microphone with a known pressure sensitivity MR, and another version is applied for a test (uncalibrated) microphonewith an unknown pressure sensitivity MT. After dividing the equation for MT by the one for MR and solving for jMTj, theequation
Fig. 1. Diaphragm rms velocity (mm/s) profile as a function of the radius (mm) from the diaphragm center for a type LS1P microphonedriven with a current of 0.676lA at a frequency of 1000Hz. The microphone diaphragm has a radius of 9.3mm.
ARTICLE asa.scitation.org/journal/jel
JASA Express Lett. 1 (8), 082803 (2021) 1, 082803-2
is obtained, where the subscript T designates a parameter associated with the test microphone and the subscript R designa-tes a parameter associated with the reference microphone. For type LS1P test and reference microphones at relatively lowfrequencies (1000Hz and below), the last two terms in the product of Eq. (3), which are the ratio of impedance terms andthe ratio of normalized volume velocities, can both be assumed to be equal to 1; uncertainties related to these assumptionsare included as discussed in Sec. 4. As the measurements discussed herein were conducted at frequencies of 250 and1000Hz, the applicable equation reduces to
MTj j ¼ MRiRiT
� �u r0ð ÞTu r0ð ÞR
!����������: (4)
These frequencies were chosen because of their widespread use in specifications for acoustical instrumentation and insound calibrators, which usually limit their available frequency options to one or both of these two. Rather than performan absolute calibration at multiple frequencies, it is often more practical for many acoustical measurement setups to usean absolute calibration performed with a sound calibrator at a single frequency in combination with a microphone fre-quency response determined by an electrostatic actuator16 or the manufacturer’s specifications for frequency response/flatness.
2. Measurement procedure
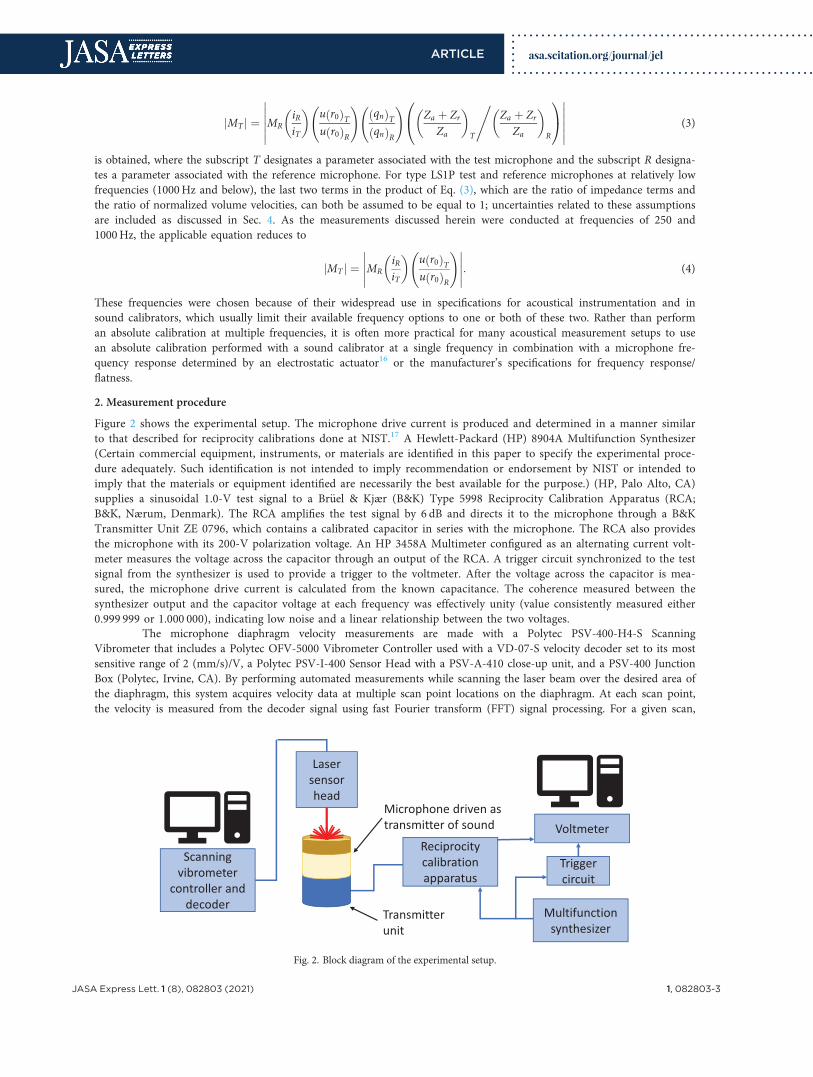
Figure 2 shows the experimental setup. The microphone drive current is produced and determined in a manner similarto that described for reciprocity calibrations done at NIST.17 A Hewlett-Packard (HP) 8904A Multifunction Synthesizer(Certain commercial equipment, instruments, or materials are identified in this paper to specify the experimental proce-dure adequately. Such identification is not intended to imply recommendation or endorsement by NIST or intended toimply that the materials or equipment identified are necessarily the best available for the purpose.) (HP, Palo Alto, CA)supplies a sinusoidal 1.0-V test signal to a Br€uel & Kjær (B&K) Type 5998 Reciprocity Calibration Apparatus (RCA;B&K, Nærum, Denmark). The RCA amplifies the test signal by 6 dB and directs it to the microphone through a B&KTransmitter Unit ZE 0796, which contains a calibrated capacitor in series with the microphone. The RCA also providesthe microphone with its 200-V polarization voltage. An HP 3458A Multimeter configured as an alternating current volt-meter measures the voltage across the capacitor through an output of the RCA. A trigger circuit synchronized to the testsignal from the synthesizer is used to provide a trigger to the voltmeter. After the voltage across the capacitor is mea-sured, the microphone drive current is calculated from the known capacitance. The coherence measured between thesynthesizer output and the capacitor voltage at each frequency was effectively unity (value consistently measured either0.999 999 or 1.000 000), indicating low noise and a linear relationship between the two voltages.
The microphone diaphragm velocity measurements are made with a Polytec PSV-400-H4-S ScanningVibrometer that includes a Polytec OFV-5000 Vibrometer Controller used with a VD-07-S velocity decoder set to its mostsensitive range of 2 (mm/s)/V, a Polytec PSV-I-400 Sensor Head with a PSV-A-410 close-up unit, and a PSV-400 JunctionBox (Polytec, Irvine, CA). By performing automated measurements while scanning the laser beam over the desired area ofthe diaphragm, this system acquires velocity data at multiple scan point locations on the diaphragm. At each scan point,the velocity is measured from the decoder signal using fast Fourier transform (FFT) signal processing. For a given scan,
Fig. 2. Block diagram of the experimental setup.
ARTICLE asa.scitation.org/journal/jel
JASA Express Lett. 1 (8), 082803 (2021) 1, 082803-3
only the FFT data for the single-frequency bin containing the sinusoidal test frequency are utilized because the micro-phone is driven during the entire scan at that single frequency.
The velocity was measured in a circular grid of 129 points in the central 7% of the total diaphragm area. Thegrid consisted of a single center point and 16 rings with eight points each, with 0.15-mm spacing between rings. In addi-tion, there were four diaphragm edge points used only as visual aids to set the alignment.
Nine B&K 4160 microphones, which are type LS1P microphones, were used to acquire the data to develop thecomparison calibration method. Each of these microphones was also calibrated at 250 and 1000Hz by the reciprocitymethod using the NIST plane wave coupler reciprocity calibration system. On a given day, the current and velocity mea-surements were made at both test frequencies on all microphones sequentially to develop a single complete set of data forthe microphone group. Seven such datasets containing a trial for each microphone were acquired for the group of ninemicrophones.
Barometric pressure and temperature data were also acquired during the measurements to ensure that theseparameters did not drift outside allowed limits. For a given day, the ambient barometric pressure is required to stay withina range of 10 millibars. The temperature requirement is 23 6 2 �C.
3. Data reduction and experimental results
Two of the nine microphones, the two with the best repeatability in velocity divided by current with all velocity pointsincluded, over all trials at 250Hz were chosen as reference microphones. At a given frequency, the sensitivity of each testmicrophone was calculated as the average of the two sensitivities determined using these two reference microphones.
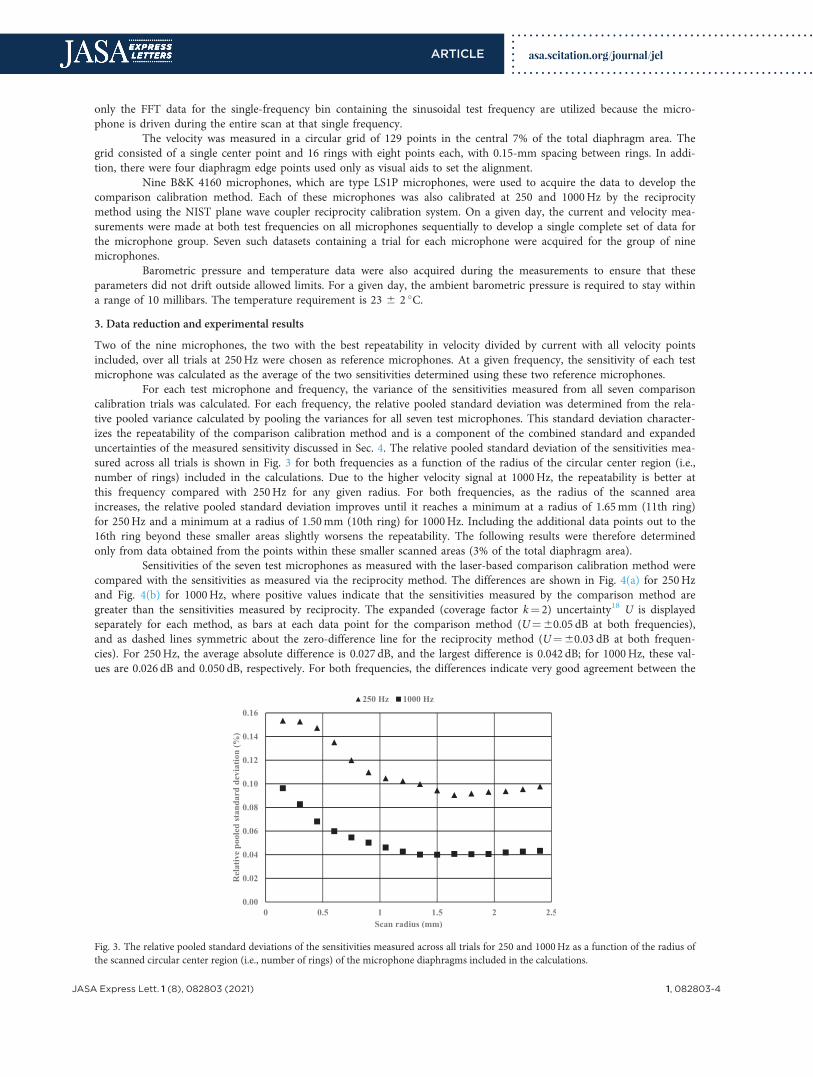
For each test microphone and frequency, the variance of the sensitivities measured from all seven comparisoncalibration trials was calculated. For each frequency, the relative pooled standard deviation was determined from the rela-tive pooled variance calculated by pooling the variances for all seven test microphones. This standard deviation character-izes the repeatability of the comparison calibration method and is a component of the combined standard and expandeduncertainties of the measured sensitivity discussed in Sec. 4. The relative pooled standard deviation of the sensitivities mea-sured across all trials is shown in Fig. 3 for both frequencies as a function of the radius of the circular center region (i.e.,number of rings) included in the calculations. Due to the higher velocity signal at 1000Hz, the repeatability is better atthis frequency compared with 250Hz for any given radius. For both frequencies, as the radius of the scanned areaincreases, the relative pooled standard deviation improves until it reaches a minimum at a radius of 1.65mm (11th ring)for 250Hz and a minimum at a radius of 1.50mm (10th ring) for 1000Hz. Including the additional data points out to the16th ring beyond these smaller areas slightly worsens the repeatability. The following results were therefore determinedonly from data obtained from the points within these smaller scanned areas (3% of the total diaphragm area).
Sensitivities of the seven test microphones as measured with the laser-based comparison calibration method werecompared with the sensitivities as measured via the reciprocity method. The differences are shown in Fig. 4(a) for 250Hzand Fig. 4(b) for 1000Hz, where positive values indicate that the sensitivities measured by the comparison method aregreater than the sensitivities measured by reciprocity. The expanded (coverage factor k¼ 2) uncertainty18 U is displayedseparately for each method, as bars at each data point for the comparison method (U¼60.05 dB at both frequencies),and as dashed lines symmetric about the zero-difference line for the reciprocity method (U¼60.03 dB at both frequen-cies). For 250Hz, the average absolute difference is 0.027 dB, and the largest difference is 0.042 dB; for 1000Hz, these val-ues are 0.026 dB and 0.050 dB, respectively. For both frequencies, the differences indicate very good agreement between the
Fig. 3. The relative pooled standard deviations of the sensitivities measured across all trials for 250 and 1000Hz as a function of the radius ofthe scanned circular center region (i.e., number of rings) of the microphone diaphragms included in the calculations.
ARTICLE asa.scitation.org/journal/jel
JASA Express Lett. 1 (8), 082803 (2021) 1, 082803-4
two methods. Two statistical tests were performed to verify the observed agreement. At each frequency, a paired t testshowed that the calculated t value is less than the critical t value, indicating that the means are not significantly different(with a probability of 95%). In addition, results from the two methods were compared with each other by calculating nor-malized deviations, an approach utilized for comparing measurement results obtained by laboratories participating in aninterlaboratory comparison with the comparison reference value.19 A normalized deviation is the difference between thevalues being compared divided by the root-sum-square of their uncertainties. If the absolute value of a normalized devia-tion is less than unity, the measurement result is considered to be in agreement with the reference value. If the absolutevalue of a normalized deviation is greater than unity, the difference between the measured result and the reference value isconsidered to be greater than what would be expected based on the uncertainties of both. At each frequency, all the nor-malized deviations were less than unity, indicating agreement between the two methods.
4. Uncertainty evaluation
Published guidelines for evaluating uncertainties18 were applied to determine the standard and expanded (k¼ 2) uncertain-ties for the laser-based comparison calibration results. These uncertainties are reported and summarized in Table 1 forboth frequencies. For each frequency, a standard uncertainty is shown for each individual contributing component alongwith the expanded uncertainty calculated for the measured sensitivities by combining the component standard uncertain-ties according to these guidelines. In addition, the type designations (A or B) of the component uncertainties are listed.
A type A standard uncertainty uA1 was determined by calculating the variance of the sensitivities measured foreach test microphone over all seven of the trials and pooling the variances obtained for all seven microphones. This
Fig. 4. Differences between the sensitivities of the seven test microphones as measured with the laser-based comparison calibration methodand the sensitivities as measured via the reciprocity method for each microphone. (a) 250Hz. (b) 1000Hz. A positive value indicates that thesensitivity measured with the comparison method is greater than the sensitivity measured by reciprocity. Uncertainties of reciprocity calibra-tion indicated by dashed lines; uncertainties of laser-based comparison calibration indicated by vertical bars.
ARTICLE asa.scitation.org/journal/jel
JASA Express Lett. 1 (8), 082803 (2021) 1, 082803-5
standard uncertainty is equal to the standard deviation derived from the pooled variance. It characterizes the repeatabilityof the comparison calibration method.
An additional type A standard uncertainty uA2 was determined based on the results of a previous statistical anal-ysis20 of the long-term stability of type LS1P microphones calibrated at NIST. It is included to account for the drift thatcan occur in the sensitivities of the reference microphones between periodic reciprocity calibrations, which historicallyhave been done routinely at NIST every two years.
A type B standard uncertainty uB1 is included to account for the uncertainty of the reference microphone sensi-tivity at a given frequency as determined by reciprocity. It is equal to one half of the expanded (k¼ 2) uncertainty of thissensitivity, which was derived in the same manner as previously described for type LS2aP microphone calibrations done atNIST.17
All of the additional standard uncertainties considered to arise from various other effects were determined fromtype B evaluations by establishing values for the upper and lower bounds of symmetric rectangular probability distribu-tions based on estimated limits of the effects on the measurement results due to each source of uncertainty.18 In theabsence of any information concerning the shape of the probability distribution, a rectangular distribution is a reasonabledefault model to assume. The standard deviation of a rectangular probability distribution is equal to one half of the widthof the distribution divided by the square root of 3. To determine the standard uncertainties for these type B evaluations,the standard deviations were calculated for each of the rectangular probability distributions developed.
To derive the standard uncertainty uB2 of the velocity ratio measured between the test and reference micro-phones, velocity measurements were performed on three different microphones at four different drive voltages (0.60, 0.84,1.0, and 1.1V) measured at the output of the synthesizer to investigate the linearity of the velocity measurements. Thisrange in drive voltages more than covers the range (4 dB) of sensitivities specified for type LS1P microphones at the twofrequencies used.5,6 For all three microphones, the various velocity ratios calculated for a given microphone from thevelocities measured for the microphone at the different drive voltages were calculated and compared with the valuesexpected based on the ratios of the measured drive voltages. The largest discrepancy found was used to establish boundsfor a symmetric rectangular probability distribution. The same approach was used to develop the standard uncertainty uB3for the current ratio measured between the reference and test microphones by using the voltage data measured across thereference capacitor instead of the velocity data.
The standard uncertainty uB4 of the ratio of normalized volume velocities for the test and reference microphonesis included to account for potential deviations of this ratio from 1. Such deviations could potentially be caused by differ-ences in resonance frequencies from the nominal value of 8200Hz provided for the type LS1P microphone samples.21
Bounds were established for a symmetric rectangular probability distribution based on deviations in values of measuredresonance frequencies reported for type LS1P13 and type LS2P22 microphones from nominal values in combination withvalues of qn as a function of normalized frequency available as graphical data13 and tabular data.15
To determine the standard uncertainty uB5 associated with the uncertainty of the polarization voltage, boundswere established for a symmetric rectangular probability distribution from the multimeter manufacturer’s accuracy specifi-cations for direct current voltage measurements and the 1-mV difference allowed in the setting of the voltage.
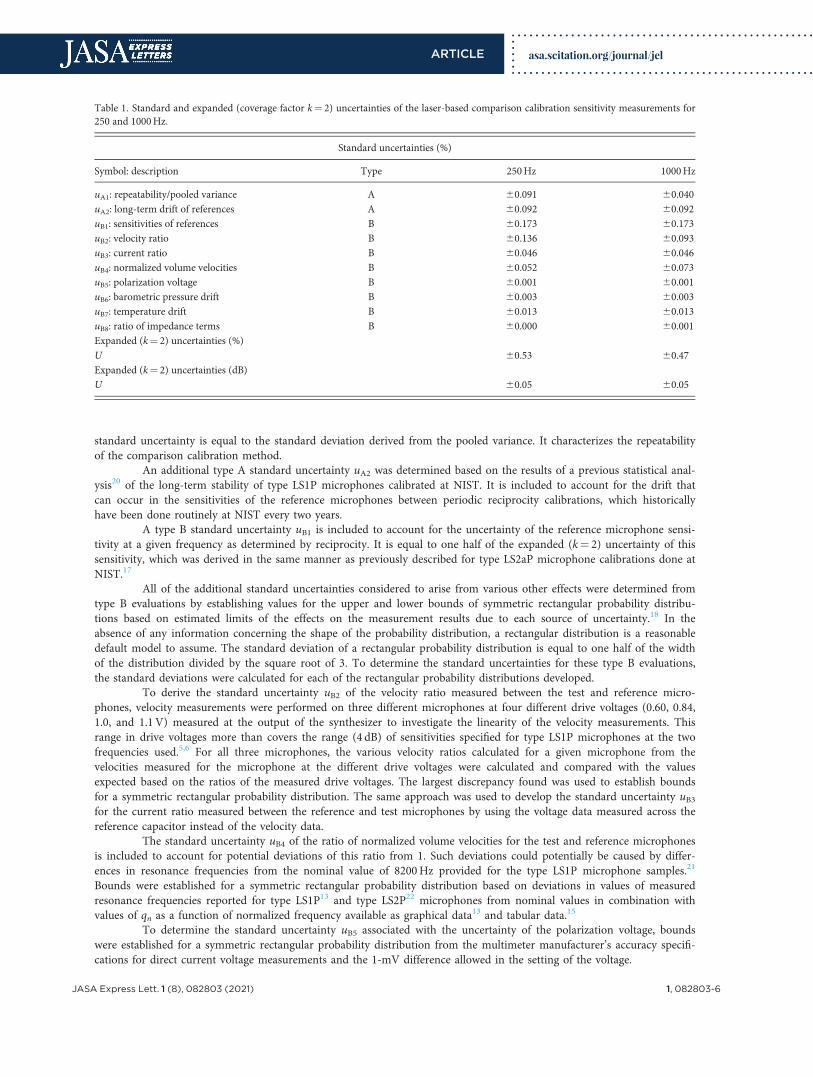
Table 1. Standard and expanded (coverage factor k¼ 2) uncertainties of the laser-based comparison calibration sensitivity measurements for250 and 1000Hz.
Standard uncertainties (%)
Symbol: description Type 250Hz 1000Hz
uA1: repeatability/pooled variance A 60.091 60.040uA2: long-term drift of references A 60.092 60.092uB1: sensitivities of references B 60.173 60.173uB2: velocity ratio B 60.136 60.093uB3: current ratio B 60.046 60.046uB4: normalized volume velocities B 60.052 60.073uB5: polarization voltage B 60.001 60.001uB6: barometric pressure drift B 60.003 60.003uB7: temperature drift B 60.013 60.013uB8: ratio of impedance terms B 60.000 60.001Expanded (k¼ 2) uncertainties (%)
U 60.53 60.47Expanded (k¼ 2) uncertainties (dB)U 60.05 60.05
ARTICLE asa.scitation.org/journal/jel
JASA Express Lett. 1 (8), 082803 (2021) 1, 082803-6
The standard uncertainties uB6 and uB7 are included to account for effects due to drift in the ambient barometricpressure and temperature, respectively, that could occur during the course of the comparison calibration between referencemicrophone and test microphone measurements. Bounds were established for symmetric rectangular probability distribu-tions based on published data23 regarding the static pressure and temperature coefficients of laboratory standard micro-phones and allowed drifts in the measured pressure and temperature.
The standard uncertainty uB8 of the ratio of impedance terms for the test and reference microphones is includedto account for potential deviations in this ratio from 1. An analysis of these terms11 was applied in conjunction withpotential deviations in the acoustic impedances of the nine microphones from a value determined using nominal equiva-lent volume parameters of type LS1P microphones.21 These potential deviations were inferred from the results obtained byapplying an iterative fitting procedure17,21 that was performed during the reduction of reciprocity calibration data for thesenine microphones.
5. Summary
A laser-based method for comparison calibrations of microphones has been described that uses scanning LDV velocitymeasurements at and near the center (central 3% of the diaphragm area) of the type LS1P test and reference microphoneswhen the microphones are driven as transmitters with measured drive currents. The sensitivities determined with thiscomparison method at 250 and 1000Hz for a group of seven test microphones using two reference microphones calibratedby the reciprocity method were found to be in very good agreement with the sensitivities determined for those test micro-phones directly by the reciprocity method. For 250Hz, the largest difference in sensitivities determined by the two meth-ods for any of the microphones is 0.042 dB, and the average absolute difference, which was calculated using the differencefor all test microphones, is 0.027 dB. For 1000Hz, the largest difference is 0.050 dB, and the average absolute difference is0.026 dB.
The expanded (k¼ 2) uncertainties for the laser-based comparison method are 60.05 dB at 250 and 1000Hz.These uncertainties compare favorably with those of the reciprocity-based comparison calibration service conducted atNIST with a large-volume acoustic coupler, which are 60.08 dB at 250 and 1000Hz. In addition, the laser-based methodis simpler and faster to implement, especially at 1000Hz where the coupler is hydrogen filled for the reciprocity-basedcomparison service. The expanded (k¼ 2) uncertainties for the laser-based comparison method also compare favorablywith those specified (60.08 to 60.10 dB) for a commercial system that implements the method of the relevant interna-tional standard.9
Measurements of the resonance frequencies for each individual microphone used were not necessary at 250 and1000Hz to obtain the relatively low uncertainties for the laser-based comparison method. Future work to extend thesecomparison measurements beyond 1000Hz will require determining the resonance frequencies for each individual micro-phone because the normalized volume velocity varies significantly over small ranges of the normalized frequency as themicrophone resonance frequency is approached.
References and links1W. R. MacLean, “Absolute measurement of sound without a primary standard,” J. Acoust. Soc. Am. 12(1), 140–146 (1940).2R. K. Cook, “Absolute pressure calibration of microphones,” J. Res. Natl. Bur. Stand. 25(5), 489–505 (1940).3A. L. DiMattia and F. M. Wiener, “On the absolute pressure calibration of condenser microphones by the reciprocity method,”J. Acoust. Soc. Am. 18(2), 341–344 (1946).
4L. L. Beranek, R. K. Cook, F. F. Romanow, F. M. Wiener, and B. B. Bauer, “American standard method for the pressure calibration oflaboratory standard microphones Z24.4–1949 (abridged),” J. Acoust. Soc. Am. 22(5), 611–613 (1950).
5ANSI S1.15-1997/Part 1 (R2016), Measurement Microphones - Part 1: Specifications for Laboratory Standard Microphones (AcousticalSociety of America, Melville, NY, 1997).
6IEC 61094-1-Ed. 2.0, 2000, Measurement Microphones – Part 1: Specifications for Laboratory Standard Microphones (InternationalElectrotechnical Commission, Geneva, Switzerland, 2000).
7ANSI S1.15-2005/Part 2 (R2015), Measurement Microphones - Part 2: Primary Method for Pressure Calibration of LaboratoryStandard Microphones by the Reciprocity Technique (Acoustical Society of America, Melville, NY, 2005).
8IEC 61094-2 Ed. 2.0 2009-02, Electroacoustics - Measurement microphones - Part 2: Primary Method for Pressure Calibration ofLaboratory Standard Microphones by the Reciprocity Technique (International Electrotechnical Commission, Geneva, Switzerland,2009).
9IEC 61094-5 Ed. 2.0 2016-05, Electroacoustics - Measurement Microphones - Part 5: Methods for Pressure Calibration of WorkingStandard Microphones by Comparison (International Electrotechnical Commission, Geneva, Switzerland, 2016).
10V. Nedzelnitsky, “Laboratory microphone calibration methods at the national institute of standards and Technology, U.S.A,” in AIPHandbook of Condenser Microphones: Theory, Calibration, and Measurements, edited by G. S. K. Wong and T. F. W. Embleton (AIPPress, Woodbury, NY 1995), pp. 145–161.
11G. Behler and M. Vorlander, “Reciprocal measurements on condenser microphones for quality control and absolute calibration,” ActaAcust. united Ac. 90, 152–160 (2004).
12S. Barrera-Figueroa, K. Rasmussen, and F. Jacobsen, “Hybrid method for determining the parameters of condenser microphones frommeasured membrane velocities and numerical calculations,” J. Acoustical Soc. Am. 126(4), 1788–1795 (2009).
ARTICLE asa.scitation.org/journal/jel
JASA Express Lett. 1 (8), 082803 (2021) 1, 082803-7
13J. G. Suh, W. H. Cho, H. Y. Kim, Z. Cui, and Y. Suzuki, “Sensitivity measurement of a laboratory standard microphone by measuringthe diaphragm vibration,” Appl. Acoust. 143, 38–47 (2019).
14D. A. Mills, T.-A. Chen, S. Horowitz, W. C. Patterson, and, and M. Sheplak, “A novel, high-frequency, reciprocal calibration methodfor dynamic pressure sensors used in high-speed flows,” AIAA Scitech 2020 Forum, Orlando, FL (January 6–10, 2020), pp. AIAA 2020-2213.
15W. H. Cho (personal communication, 2020).16IEC 61094-6 Ed 1.0 2004-11, Electroacoustics- Measurement microphones - Part 6: Electrostatic Actuators for Determination ofFrequency Response (International Electrotechnical Commission, Geneva, Switzerland, 2004).
17R. P. Wagner, V. Nedzelnitsky, and S. E. Fick, “New measurement service for determining pressure sensitivity of type LS2aP micro-phones by the reciprocity method,” J. Res. Natl. Inst. Stan. Technol. 116(5), 761–769 (2011).
18B. N. Taylor and C. E. Kuyatt, Guidelines for Evaluating and Expressing the Uncertainty of NIST Measurement Results, NIST TechnicalNote 1297-1994 Edition (U.S. Government Printing Office, Washington DC, 1994).
19H. K. Iyer, C. M. Wang, and D. F. Vecchia, “Consistency tests for key comparison data,” Metrologia 41, 223–230 (2004).20R. P. Wagner and W. F. Guthrie, “Long-term stability of one-inch condenser microphones calibrated at the National Institute ofStandards and Technology,” J. Res. Natl. Inst. Stan. Technol. 120, 164–172 (2015).
21Reciprocity Calibration System Type 9699 User Manual, BE 1499—11 (Br€uel & Kjær, Nærum, Denmark, 1997), pp. 5–30.22J. G. Suh, H. Y. Kim, and Y. Suzuki, “Measurement of resonance frequency and loss factor of a microphone diaphragm using a laservibrometer,” Appl. Acoust. 71, 258–261 (2010).
23K. Rasmussen, “The static pressure and temperature coefficients of laboratory standard microphones,” Metrologia 36(4), 265–273(1999).
ARTICLE asa.scitation.org/journal/jel
JASA Express Lett. 1 (8), 082803 (2021) 1, 082803-8