1. INTRODUCTIONThere is an increasing interest in reliable, easy-to-usemethods for the measurement of the optical aberrationsin the human eye. Rapidly evolving refractive surgerytechniques require methods to assess the modificationsthey induce in the optical quality of the eye. In addition,if we know the wave-front distortion of the eye, it is evenpossible to correct it,1–3 which opens a wide field of newapplications such as improving performance on specific vi-sual tasks or retinal surgery.
One of the earliest measurements of the geometricalaberrations of the human eye was carried out by Young4
in 1801 with subjective methods. Since then, many au-thors have measured aberrations in the human eye sub-jectively (Refs. 5–8 are some classical examples), but ob-jective methods have been developed only morerecently.9–13 Objective methods have important advan-tages over subjective ones for practical applications. Thelatter often depend on the ability of the subject to performthe task (Vernier alignment, discrimination, etc.) andhence on his or her visual (or Vernier) acuity, contrastsensitivity, degree of training and cooperation, attention,etc. These factors limit the application of subjectivemethods to the foveal or parafoveal region of cooperativesubjects. In addition, psychophysical methods tend to beslow, and one has to count on potential mistakes by thesubject.
As far as we know, at least five different approaches tothe objective measurement of aberrations in the eye have
been reported: the Foucault knife-edge test,9 the objec-tive version of the Howland aberroscope,10 phase retrievalfrom double-pass images,1,3 Hartmann–Shack wave-frontsensors11,14 (to be referred to as H–S), and laser raytracing12,15 (LRT). Although there have been very fewcomparative studies of these methods,16,17 the H–S is be-coming popular since it offers advantages in terms of ro-bustness, reliability, and rapidity. More important, alarge scientific literature and important technological de-velopments are available for its application to the mea-surement of aberrations that are due to atmospheric tur-bulence. The H–S method has been compared recently16
with Smirnov’s psychophysical method.6 Nevertheless,psychophysical measurements were so time-consumingthat such comparison was limited to a one-dimensionalsection of the wave aberration, and hence no thoroughvalidation was achieved. A comparative study of theH–S sensor and Howland’s aberroscope has recently beenreported.17
On the other hand, the LRT method has many featuresin common with the H–S method, which permits the de-sign of an experimental procedure in which all param-eters (optical path, sampling pattern, etc.) are shared bythese two completely objective methods, allowing a ratherclose and direct comparison for reciprocal validation.With this in mind, the specific goals of the present paperare the following:
1. To validate H–S and LRT separately by direct com-parison of double-pass versus single-pass configurations
2000 Optical Society of America
E. Moreno-Barriuso and R. Navarro Vol. 17, No. 6 /June 2000/J. Opt. Soc. Am. A 975
in an artificial eye consisting of a high-quality(diffraction-limited) lens plus an interchangeable aberrat-ing plate. In the single-pass case, the flexibility of theLRT method permits us to measure the aberrations eitherin the object or in the image space for further validation ofthe basic assumptions. Moreover, a direct recording ofthe single-pass point spread function (PSF) will provideus with a global reference.
2. Direct comparison of H–S and LRT, both in artifi-cial and in human eyes (double pass) for reciprocal vali-dation. In particular, we want to study the effects of co-herence and incoherence of the illumination as well as theeffects of entrance and exit pupil size in both cases. Inaddition, we shall compare different pupil sampling pat-terns (hexagonal versus square) and densities (0.6- versus1-mm sampling interval). This last study will be carriedout only in LRT, where the sampling pattern and intervalare controlled by the computer and hence are very easy tomodify.
3. To experience the advantages and drawbacks ofboth methods in a practical implementation of the mea-surement of human eyes. Since the two techniques canshare the same optical axis as well as most of the compo-nents in the setup (optics, mechanics, electronics, soft-ware, experimenters and even subjects), we expect thatthe inherent differences between H–S and LRT, as wellas their respective pros and cons, will become apparentfrom this study.
There are two main differences between H–S and LRT:H–S works in parallel with a fixed sampling pattern andmeasures the aberrations in the outgoing (second-pass)aerial beam, whereas LRT is sequential with a highlyflexible sampling pattern and measures aberrations of theincoming beam (first pass) at the retinal surface. Thesetwo important basic differences between LRT and H–Simply that they will have different pros and cons, depend-ing on the particular application. Part of this compara-tive study was already presented at the 1998 AnnualMeeting of the Optical Society of America.18
As we show below, the results of the comparison havebeen highly satisfactory, supporting the validity andequivalence of the two techniques.
2. GENERAL METHODSThe two methods that are compared in this work, theH–S sensor and LRT, are based on the same principle.They measure geometrical aberrations that are the tan-gents (or partial derivatives) of the wave aberration.Both techniques take a series of samples of the wave frontat the exit pupil, although the H–S sensor does it in par-allel, whereas LRT is sequential in time. In both meth-ods a set of spots is obtained, with each spot correspond-ing to the ith sample of the beam taken at a givenposition on the pupil plane with coordinates (j i , h i).The first step is to compute the centroid of the ith spot asa maximum-likelihood estimate of its position @X8(j i , h i),Y8(j i , h i)] at the image plane. In an aberration-free op-tical system, each spot would lie on its reference ideal po-sition, X8 5 X08 ; Y8 5 Y08 . In the presence of aberra-tions, the spots are displaced from their reference
positions; the geometrical aberration is defined simply bythe magnitude of these displacements:
Dx8~j i ,h i! 5X8~j i ,h i! 2 X08~j i ,h i!
f8;
Dy8~j i ,h i! 5Y8~j i ,h i! 2 Y08~j i ,h i!
f8. (1)
In this equation the displacements are given in dimen-sionless tangent units, by dividing by the focal length ofthe lens used for imaging the spots (CCD objective in Fig.1). This is especially relevant for double-pass measure-ments in the human eye, where we do not have access tothe retinal image plane and thus cannot measure lengthunits but only tangents or angles. For a given point ob-ject with coordinates (X0 , Y0 , Z0), we can plot the geo-metrical aberrations (Dxi , Dyi) to obtain a spot diagramrepresenting the geometrical aberrations of each sample(pencil of light) of the beam passing through the opticalsystem. The two methods, LRT and H–S, provide thesame type of primary data, and hence once we get this setof geometrical aberrations (Dxi , Dyi) with either tech-nique, we can apply exactly the same data processing toestimate the wave aberration (see Subsection 2.C). Fur-thermore, if we can apply the same pupil sampling pat-tern, then it is possible to compare these two methods di-rectly.
A. Laser Ray TracingThe basic principle of the LRT technique has been de-scribed before.12,15,19 It consists of delivering, sequen-tially, a bundle of light pencils (nonexpanded laserbeams) coming from the same point object (X0, Y0, Z0)but passing through different locations (j i , h i) at the exitpupil plane. In the experiments reported here, the tra-jectories of the light pencils (rays) are controlled bymeans of a two-dimensional XY optical scanner driven bymoving-magnet actuators and by additional optics (colli-mator) when needed. Different sampling patterns (hex-agonal, rectangular, polar) and steps can be easily pro-duced. The spot formed by each ray after passingthrough the artificial or the real eye under study is im-aged onto a CCD camera (see Fig. 1). Both the scannerand the camera are controlled and synchronized by meansof a personal computer, which is also used to analyze eachimage, computing the centroid of the spot. Since one ofthe main goals of this work was to compare the cases ofsingle and double pass, we built different experimentalconfigurations [Figs. 1(a)–1(d)]. One double-pass setup[Fig. 1(d)], dual for H–S and LRT, is employed for bothartificial and real eyes. Validation of the double-passversions of LRT and H–S is necessary because doublepass is required for making objective measurements inhuman eyes. There are also two single-pass versions(only for artificial eyes), I and II [Figs. 1(b) and 1(c)],which differ in that object and image spaces are inter-changed, and hence the rays propagate in opposite direc-tions. By reciprocity, the spot diagrams should be thesame in both versions, and hence these two measure-ments, I and II, can be used for studying the reliability ofthe method. Single-pass laser ray tracing had been usedbefore by Sivak and Kreuzer20 to study the spherical ab-erration of the lens in vitro.
976 J. Opt. Soc. Am. A/Vol. 17, No. 6 /June 2000 E. Moreno-Barriuso and R. Navarro
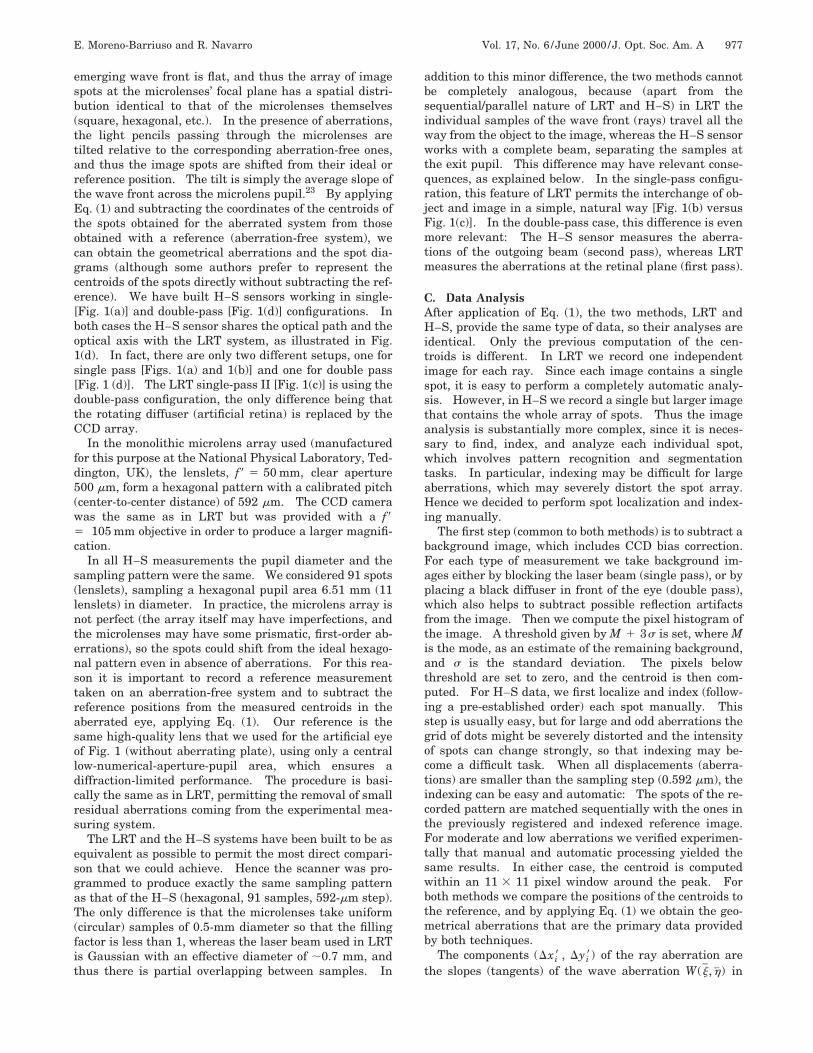
Fig. 1. Schematic diagrams of the experimental setups. The light source is a TEM00 polarized red He–Ne laser. The artificial eye iscomposed of a high-quality lens plus a removable aberrating plate. In all cases the experimental spots are recorded with a cooled digitalCCD camera (square pixels, 9-mm size). (a) Single-pass H–S sensor: The pinhole of a spatial filter acts as point object placed at thefocal plane of the artificial eye. Lenses L1 and L2 ( f8 5 148 mm) project the pupil (1:1 magnification) onto the microlens array. Thespots formed by the microlens array are imaged onto the CCD by means of lens L3 ( f8 5 200 mm) and the CCD objective ( f85 105 mm). (b) Single-pass LRT (version I): The scanner, placed at the artificial eye’s focal plane, delivers a divergent bundle of rays.Each spot is sequentially imaged onto the CCD by the objective ( f8 5 55 mm). (c) Single-pass LRT (version II): A set of rays (parallelafter passing through the collimator) is delivered onto the artificial eye. Each individual spot is recorded onto the naked CCD (no ob-jective), located at the focal plane. (d) Dual double-pass setup: For LRT the microlens array and L3 are removed. The scanner andthe collimator produce a set of parallel rays. Each ray, after being reflected off the rotating diffuser (artificial retina), goes through theeye’s pupil and is imaged onto the CCD. The pupil stop, conjugate to the eye’s pupil, limits the width of the beam. This stop is removedfor H–S measurements, and the scanner is set to zero-deflection angle. The unexpanded beam goes through the center of the artificialeye and is reflected off the rotating diffuser. The second pass (image recording) is the same as in (a).
In the single-pass configurations, the spot formed byeach ray (light pencil) is directly recorded by the CCDcamera at the image plane [Figs. 1(b) and 1(c)]. How-ever, in version I [Fig. 1(b)] the outgoing beam is colli-mated (as in the double-pass case) so that the imageplane is at infinity, and the CCD objective ( f85 55 mm) brings the image plane onto the CCD array.In the double-pass configuration, each light pencil forms aspot on the retina [a rotating diffuser in Fig. 1(d)]. Asthe entry pupil size is equal to the laser beam size at thepupil plane, ;0.7 mm (diffraction limited), the first-passretinal image is a small Gaussian spot (owing to theGaussian profile of the laser). The light reflected off the(artificial or real) retina passes again through the opticsof the eye and forms an aerial image of the retinal spotthat is recorded by the CCD camera. This aerial image isthe cross correlation between the retinal spot and the PSFof the eye in the second pass.21 Thus we have a blurredversion of the spot, but its displacement (i.e., centroid lo-cation) is the same as that of the single-pass retinal spot(Dxi , Dyi) when measured in tangent units [Eq. (1)].12
Nevertheless, we have confirmed this point here by a di-rect experimental comparison of single- and double-passmeasurements.
Although LRT is sequential, it is possible to deliverrays and to record the associated images reasonably fast.Our computer-controlled laser scanner can position thebeam and hence deliver rays with frequencies above 1kHz. Other factors such as the pixel readout of the CCD
camera used in the experiments (less than 4 MHz), expo-sure time (0.1–0.2 s), and electromechanical shutter of la-ser and camera, are currently limiting the working fre-quency to tracing and recording 4–5 rays/s. (At the timewe are writing this paper, we have faster electronics andwere able to attain frequencies above 20 rays/s in pilot ex-periments). One drawback associated with any conven-tional XY scanner is that the physical distance betweenmirrors (11 mm in our case) induces a slight amount ofastigmatism [almost 0.3 diopters (D) for the 200-mmfocal-length collimator]. It is easy to eliminate most of itby placing a cylindrical lens in front of the collimator orby using a single mirror on a gimbal mount. Here wehave used a 20.25-D cylinder trial lens (not shown in thefigures), and the residual astigmatism (0.05 D) is removednumerically a posteriori by taking a reference measure-ment with a diffraction-limited lens and applying Eq. (1).
B. Hartmann–Shack Wave-Front SensorThe operating principle of the H–S wave-front sensor iswell known,22,23 and its application to the human eye isbecoming widespread.1,11,16,24 In the H–S wave-frontsensor, instead of the samples being taken sequentially(as in LRT), a monolithic microlens array located in aplane conjugate to the exit pupil samples the wave frontin parallel. Each lenslet selects a light pencil (whose di-ameter is given by that of the lenslet) and forms a spot oflight at its focal plane [see Fig. 1(d)]. For an aberration-free system, if the object is at the focal point, then the
E. Moreno-Barriuso and R. Navarro Vol. 17, No. 6 /June 2000/J. Opt. Soc. Am. A 977
emerging wave front is flat, and thus the array of imagespots at the microlenses’ focal plane has a spatial distri-bution identical to that of the microlenses themselves(square, hexagonal, etc.). In the presence of aberrations,the light pencils passing through the microlenses aretilted relative to the corresponding aberration-free ones,and thus the image spots are shifted from their ideal orreference position. The tilt is simply the average slope ofthe wave front across the microlens pupil.23 By applyingEq. (1) and subtracting the coordinates of the centroids ofthe spots obtained for the aberrated system from thoseobtained with a reference (aberration-free system), wecan obtain the geometrical aberrations and the spot dia-grams (although some authors prefer to represent thecentroids of the spots directly without subtracting the ref-erence). We have built H–S sensors working in single-[Fig. 1(a)] and double-pass [Fig. 1(d)] configurations. Inboth cases the H–S sensor shares the optical path and theoptical axis with the LRT system, as illustrated in Fig.1(d). In fact, there are only two different setups, one forsingle pass [Figs. 1(a) and 1(b)] and one for double pass[Fig. 1 (d)]. The LRT single-pass II [Fig. 1(c)] is using thedouble-pass configuration, the only difference being thatthe rotating diffuser (artificial retina) is replaced by theCCD array.
In the monolithic microlens array used (manufacturedfor this purpose at the National Physical Laboratory, Ted-dington, UK), the lenslets, f8 5 50 mm, clear aperture500 mm, form a hexagonal pattern with a calibrated pitch(center-to-center distance) of 592 mm. The CCD camerawas the same as in LRT but was provided with a f85 105 mm objective in order to produce a larger magnifi-cation.
In all H–S measurements the pupil diameter and thesampling pattern were the same. We considered 91 spots(lenslets), sampling a hexagonal pupil area 6.51 mm (11lenslets) in diameter. In practice, the microlens array isnot perfect (the array itself may have imperfections, andthe microlenses may have some prismatic, first-order ab-errations), so the spots could shift from the ideal hexago-nal pattern even in absence of aberrations. For this rea-son it is important to record a reference measurementtaken on an aberration-free system and to subtract thereference positions from the measured centroids in theaberrated eye, applying Eq. (1). Our reference is thesame high-quality lens that we used for the artificial eyeof Fig. 1 (without aberrating plate), using only a centrallow-numerical-aperture-pupil area, which ensures adiffraction-limited performance. The procedure is basi-cally the same as in LRT, permitting the removal of smallresidual aberrations coming from the experimental mea-suring system.
The LRT and the H–S systems have been built to be asequivalent as possible to permit the most direct compari-son that we could achieve. Hence the scanner was pro-grammed to produce exactly the same sampling patternas that of the H–S (hexagonal, 91 samples, 592-mm step).The only difference is that the microlenses take uniform(circular) samples of 0.5-mm diameter so that the fillingfactor is less than 1, whereas the laser beam used in LRTis Gaussian with an effective diameter of ;0.7 mm, andthus there is partial overlapping between samples. In
addition to this minor difference, the two methods cannotbe completely analogous, because (apart from thesequential/parallel nature of LRT and H–S) in LRT theindividual samples of the wave front (rays) travel all theway from the object to the image, whereas the H–S sensorworks with a complete beam, separating the samples atthe exit pupil. This difference may have relevant conse-quences, as explained below. In the single-pass configu-ration, this feature of LRT permits the interchange of ob-ject and image in a simple, natural way [Fig. 1(b) versusFig. 1(c)]. In the double-pass case, this difference is evenmore relevant: The H–S sensor measures the aberra-tions of the outgoing beam (second pass), whereas LRTmeasures the aberrations at the retinal plane (first pass).
C. Data AnalysisAfter application of Eq. (1), the two methods, LRT andH–S, provide the same type of data, so their analyses areidentical. Only the previous computation of the cen-troids is different. In LRT we record one independentimage for each ray. Since each image contains a singlespot, it is easy to perform a completely automatic analy-sis. However, in H–S we record a single but larger imagethat contains the whole array of spots. Thus the imageanalysis is substantially more complex, since it is neces-sary to find, index, and analyze each individual spot,which involves pattern recognition and segmentationtasks. In particular, indexing may be difficult for largeaberrations, which may severely distort the spot array.Hence we decided to perform spot localization and index-ing manually.
The first step (common to both methods) is to subtract abackground image, which includes CCD bias correction.For each type of measurement we take background im-ages either by blocking the laser beam (single pass), or byplacing a black diffuser in front of the eye (double pass),which also helps to subtract possible reflection artifactsfrom the image. Then we compute the pixel histogram ofthe image. A threshold given by M 1 3s is set, where Mis the mode, as an estimate of the remaining background,and s is the standard deviation. The pixels belowthreshold are set to zero, and the centroid is then com-puted. For H–S data, we first localize and index (follow-ing a pre-established order) each spot manually. Thisstep is usually easy, but for large and odd aberrations thegrid of dots might be severely distorted and the intensityof spots can change strongly, so that indexing may be-come a difficult task. When all displacements (aberra-tions) are smaller than the sampling step (0.592 mm), theindexing can be easy and automatic: The spots of the re-corded pattern are matched sequentially with the ones inthe previously registered and indexed reference image.For moderate and low aberrations we verified experimen-tally that manual and automatic processing yielded thesame results. In either case, the centroid is computedwithin an 11 3 11 pixel window around the peak. Forboth methods we compare the positions of the centroids tothe reference, and by applying Eq. (1) we obtain the geo-metrical aberrations that are the primary data providedby both techniques.
The components (Dxi8 , Dyi8) of the ray aberration arethe slopes (tangents) of the wave aberration W( j,h) in
978 J. Opt. Soc. Am. A/Vol. 17, No. 6 /June 2000 E. Moreno-Barriuso and R. Navarro
both axes, where j 5 j/Rp , h 5 h/Rp are dimensionlesscanonical pupil coordinates and Rp is the pupil radius:
Dx8 51
Rp
]W~ j,h !
]j; Dy8 5
1
Rp
]W~ j,h !
]h. (2)
In this sense we can estimate W by integrating Eq. (2).However, instead of a direct integration that is numeri-cally unstable, it is better to consider an expansion of thewave aberration in terms of Zernike polynomials,22 whichare well suited to our problem. Here we have considereda seventh-order approximation, that is, 35 terms:
W~ j,h ! ' (k51
35
ZkPk~ j,h !, (3)
where Zk are the coefficients of the expansion, in mi-crometers and Pk are dimensionless Zernike polynomials(expressions and ordering of polynomials were taken fromMalacara22). Then to estimate W we substitute relation(3) into Eq. (2) to apply the standard method of comput-ing, for each pupil location of our data set, the partial de-rivatives of the Zernike expansion of W. Thus we obtainan overdetermined linear system of equations, where theZi are the unknowns and which can be solved by standardleast-squares fitting. Furthermore, from the estimatedW, we apply Eq. (2) to compute the derivatives (geometri-cal aberrations) again so as to compare the resulting ‘‘ad-justed’’ spot diagram with the original raw data points inorder to verify the goodness of the fitting.
The PSF, I(x8, y8), has also been computed in somecases (see Fig. 7 below) as the squared modulus of theFourier transform of the pupil function25:
I~x8, y8! 5 UFTXT~ j,h !expH 2iF2p
lW~ j,h !G J CU2
, (4)
where T( j,h) is the transmittance of the pupil, which hasbeen assumed to be uniform for the artificial eye, W( j,h)is the estimated wave aberration, and l is the wave-length.
3. ARTIFICIAL EYE: SINGLE ANDDOUBLE PASSIn this section we report experiments made on the artifi-cial eye to validate LRT and H–S. The artificial eye per-mits us to perform, for each method, a direct comparisonof single- versus double-pass measurements. The goal ofthis study is a direct and objective experimental valida-tion of these methods for application in real eyes in vivo,where we can measure only the light coming out (secondpass). We also compare LRT and H–S for reciprocal vali-dation. Nevertheless, in Section 4 we repeat this com-parison for a definitive validation in human eyes (doublepass only). Additional experiments were carried out toassess the influence of several factors, such as coherenceand speckle noise, entrance (H–S) and exit (LRT) pupilsizes.
As shown in Fig. 1, the optics of the artificial eye arecomposed of a low-numerical-aperture diffraction-limitedlens ( f8 5 250 mm) and an aberrating plate. This platewas made by stretching and twisting a heated microscope
glass slide. These deformations induce considerableamounts of low- and high-order aberrations. The plate ismounted on a micrometric translation stage so that it canbe displaced laterally outside the optical path and placedback precisely in the same position. The plate was takenout for all preliminary calibrations of the measuring sys-tems and for all reference measurements made with ourideal aberration-free version of the eye. Careful calibra-tions were made in all configurations by inducing knownamounts of defocus and/or astigmatism by using triallenses as aberrating plates. For double-pass measure-ments, a white rotating diffuser located at the focal planeof the artificial eye played the role of artificial retina.
A. Experimental ProcedureFive different aberration measurements were carried out:two for H–S (single and double pass) and three for LRT(single pass, versions I and II, and double pass; see Fig.1). The two methods share the same optical path as wellas most of the optical elements (camera, computer, etc.),so that we can switch them with minimal changes, as il-lustrated in Fig. 1(d). We checked the correct alignmentof both systems carefully by verifying that the chief ray insingle-pass LRT (version I) passes through the centrallenslet in the microlens array of the H–S sensor. The pu-pil sampling is fixed by the geometry of the microlens ar-ray (hexagonal, 91 samples, step 0.592 mm). The artifi-cial eye remains always in the same position to guaranteethat aberrations do not change during the study. Thelight source was a polarized TEM00 red (633-nm) He–Nelaser. The light intensity on the CCD was always keptwithin the camera’s dynamic range by means of neutraldensity filters. The exposure time was 2 s for each imagein H–S and 0.2 s for each ray in LRT. For each conditionfour measurements were made, and the mean and stan-dard deviation (SD) were computed. The means are usedto compare the different conditions, and the standard de-viation is used as an estimate of the experimental vari-ability within a given case, to be compared with the vari-ability among different cases.
The rotation of the diffuser permits us to removespeckle noise in the double-pass measurements. Never-theless, some additional measurements were made withthe diffuser static to study the effect of coherent (speckle)noise on both H–S and LRT measurements. In thedouble-pass case we also studied the effect of the entrancepupil size (for H–S) and of the exit pupil size (for LRT).
For additional validation of the aberration measure-ments, we performed a direct recording of the single-passPSF of the artificial eye. For this purpose we modifiedthe setup used for single-pass H–S [Fig. 1(a)] by simplyremoving the microlens array and lens L3. The PSF is aglobal reference to be compared with simulated PSF’scomputed from experimental aberration data (as ex-plained in Subsection 2.C).
B. Preliminary Experiments and Calibrations
1. Reference Measurements: Aberrations of theExperimental SetupsThe first control experiment was to determine the aberra-tions induced into the measuring systems by the optical
E. Moreno-Barriuso and R. Navarro Vol. 17, No. 6 /June 2000/J. Opt. Soc. Am. A 979
components, potential misalignments, etc. As we saidabove, the H–S systems can be affected by imperfectionsin the microlens array, whereas the two mirrors of the XYscanner induce astigmatism in LRT. The separation be-tween the two mirrors in the scanner, d 5 11 mm nomi-nal, causes the bundle of rays coming from the object to beaffected by astigmatism.19 The Sturm interval here isthe separation between mirrors, d. When a collimator offocal length f8 is used, the resulting astigmatism in diopt-ers is
D 5d
~ f8 1 d/2!~ f8 2 d/2!. (5)
In our case, f8 5 200 mm, the nominal astigmatism is0.31 D @ 90° owing to the XY orientation of the mirrors.The astigmatism measured experimentally was slightlylower, 0.28 D for single pass, and 0.25 D for double pass.This astigmatism affects only the fifth Zernike coefficient(Z5 ), and we have verified that it can be compensated ei-ther before (optically) or after (numerically) the measure-ments are taken. The optical compensation is carried outby placing a cylindrical lens next to the collimator. Weused a cylindrical trial lens, 20.25 D @ 90°, and thus theresidual astigmatism was always less than 0.05 D. (Thisastigmatism, as other residual aberrations in the system,are compensated numerically a posteriori simply by appli-cation of Eq. (1), where X08 , Y08 represent these residualaberrations obtained in the reference measurements).Apart from controlling the scanner’s astigmatism, refer-ence measurements helped to fine tune the focus andalignment of all the optical elements in the system. Al-though most coefficients were nonzero even in the refer-ence measurements (especially for H–S), the RMS wave-front error was below l/5 in all reference measurements.
2. Calibrations with Trial LensesAfter the reference measurements, we used trial lenses(sphere, cylinder, or both) of known refractive power asaberrating plates. In this way we produced controlledand known amounts of second-order aberrations (defocusand/or astigmatism). Measurements obtained in eightcases (powers of trial lenses ranging from 21 to 11 D) re-sulted in an average difference between measured andnominal values for defocus and astigmatism (estimatedfrom the Zernike coefficients) of 5%.
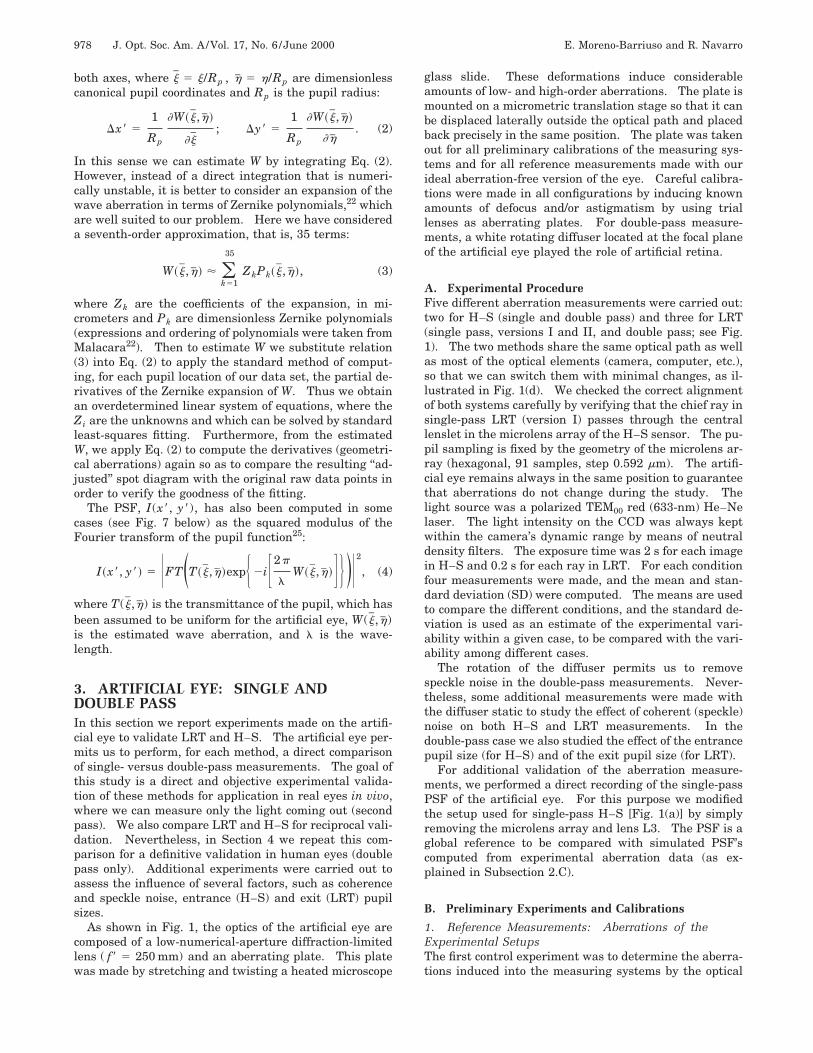
3. Coherent and Incoherent MeasurementsIt has been pointed out26 that speckle noise can be a seri-ous drawback in H–S measurements in the human eye.We wanted to study its effect in both H–S and LRT meth-ods. Speckle noise appears when a coherent beam isscattered by a diffuser. In the human eye there is a dif-fuse reflection at the retina, and thus coherent noise ap-pears in the second-pass aerial image. Eye movementshelp to blur speckle and break the coherence of the beamfor long-enough exposure times. However, for short ex-posures, speckle noise has a high contrast27,28 and canstrongly affect the measurements. We simulated longexposures in the artificial eye by using a rotating diffuseras artificial retina, and we measured the aberrations ofthe artificial eye by means of the double-pass H–S andLRT, both in the incoherent case (rotating diffuser) and in
the coherent one (diffuser static). The results obtainedare illustrated in Fig. 2. For the H–S, all the spots arecontained within one image (upper panel), whereas onlyone spot is stored in each LRT image (lower panels). Inthe latter case the spot corresponds to a marginal ray inthe coherent (left) and incoherent (right) cases. For LRTthe spots are much larger than the speckle grains, andhence the position of the centroid is not biased signifi-cantly by speckle noise. The relative RMS difference be-tween coherent and incoherent wave-aberration data wasas low as 1.4%. This result suggests a high robustnessagainst coherent noise. However, in the H–S image thespots appear smooth and distinct in the incoherent image,but in the coherent case the speckle grains have a sizecomparable to that of the spots, which are heavily dis-torted. Not only can this cause important biases in theposition of the centroid, but some spots appear mixed upand are even difficult to recognize. In fact we had to de-sist from analyzing this image.
4. Effect of Pupil SizeIn double-pass measurements the light crosses the opticsof the eye twice. Typically, one pass is used for measure-ment and the other (second pass in LRT and first pass inH–S) has an auxiliary role. The goal here is to study theeffect of this auxiliary pass. In the incoherent case thespots that we record are the cross correlation between thePSF’s of both passages.21 In LRT this is the cross corre-lation between the Gaussian spot formed by the laser pen-cil on the retina12,15 and the eye’s PSF in the second (aux-iliary) pass. Conversely, in H–S each spot is the crosscorrelation between the eye’s PSF (first, auxiliary pass)and that of a single microlens (second pass). In bothcases the size and shape of the spot, and hence the accu-racy in determining its location, depends on the eye’sPSF, which depends strongly, in turn, on the diameter of
Fig. 2. Effect of speckle noise in double-pass recordings: leftcolumn, coherent recordings; right column, incoherent record-ings. Upper panels, H–S; lower panels, LRT.
980 J. Opt. Soc. Am. A/Vol. 17, No. 6 /June 2000 E. Moreno-Barriuso and R. Navarro
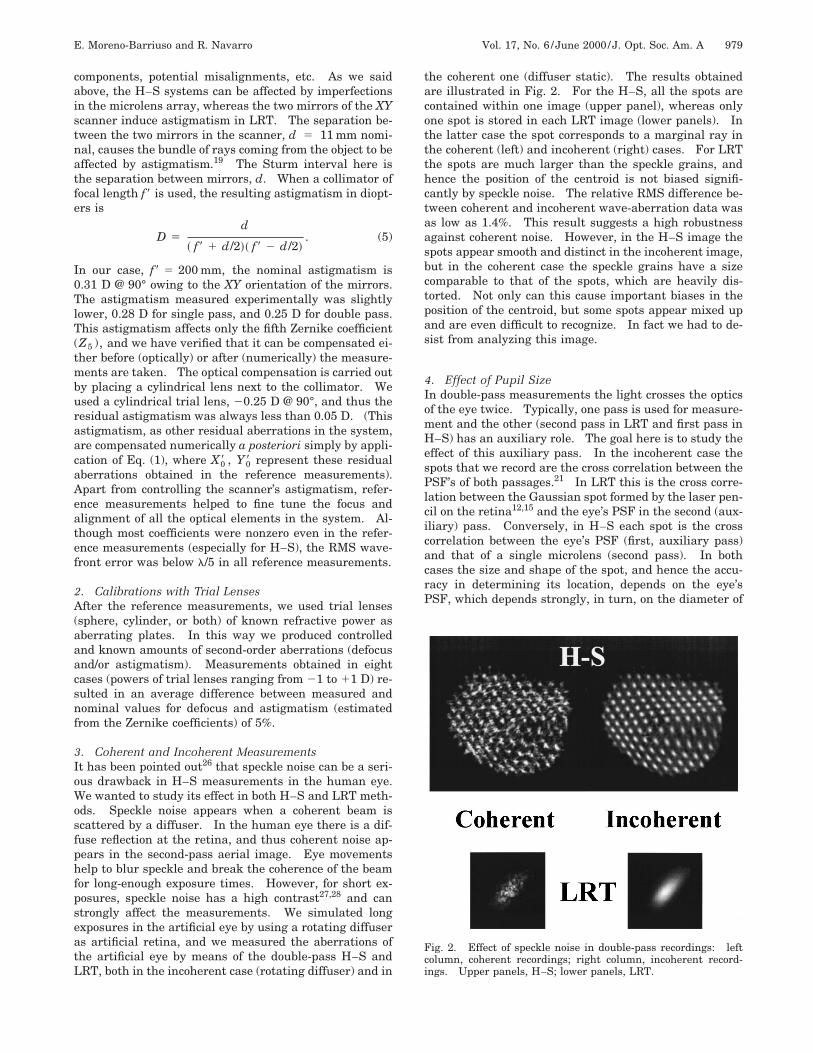
Fig. 3. Double-pass H–S recordings in the artificial eye, obtained with different entrance pupil diameters of 0.7 mm, 3 mm, and 6 mm.Blur increases with pupil size.
the auxiliary beam (entrance pupil in H–S and exit pupilin LRT). We studied this effect in the following controlexperiments.
We compared three different double-pass H–S mea-surements, modifying the entrance pupil diameter. Firstwe used the unexpanded beam, which correspondsroughly to a 0.7-mm pupil diameter [the case shown inFig. 1(d)]. For the other two measurements we used en-trance pupils of 3 and 6 mm for which the beam had to beexpanded. Figure 3 compares the three resulting H–Srecordings obtained, from left to right, for 0.7-, 3-, and6-mm pupils. It is clear that the location of the spotsdoes not change even though blur increases with pupilsize. For a 3-mm pupil, astigmatism of the artificial eyeproduces an elongation of the spots so that they are some-what mixed along the diagonal, which causes some extradifficulty in computing the centroids. For the 6-mm pu-
Fig. 4. Zernike coefficients (in micrometers) of the artificial eyeobtained with five different conditions. Error bars represent thevariability (standard error) obtained in four measurements.
pil, the blur is substantially higher, affecting the contrastand making it even harder to estimate the centroids. Asa result, the relative RMS difference in the wave-frontdistortion measured with 0.7- and 6-mm pupils was 17%.We attribute this 17% to the additional error that is dueto the inaccuracy in determining the centroids for thelargest entrance pupils. Consequently, we decided to usethe smallest, 0.7-mm pupil size in all subsequent mea-surements with this artificial eye.
For LRT there was an equivalent effect when wechanged the size of the exit pupil. The spots changed inthe same fashion as in H–S. However, since the differ-ent spots are recorded sequentially in different images,they do not interact, and hence we can tolerate larger ab-errations, that is, larger exit pupils. We recorded twomeasurements with exit pupils of 3 and 6 mm diameters.The relative RMS difference was ;4%. This difference isnot very high but is significant. For subsequent mea-surements we again chose the smallest pupil, of 3-mm di-ameter [see Fig. 1(d)]. In this case we did not try smallerpupils, because it is important to use as much of the en-ergy coming from the eye as possible. A 3-mm pupil rep-resents a good compromise; we had a reasonably good lo-calization of the centroids of spots while at the same timewe did not throw away too much light, which is especiallyimportant in measuring human eyes.
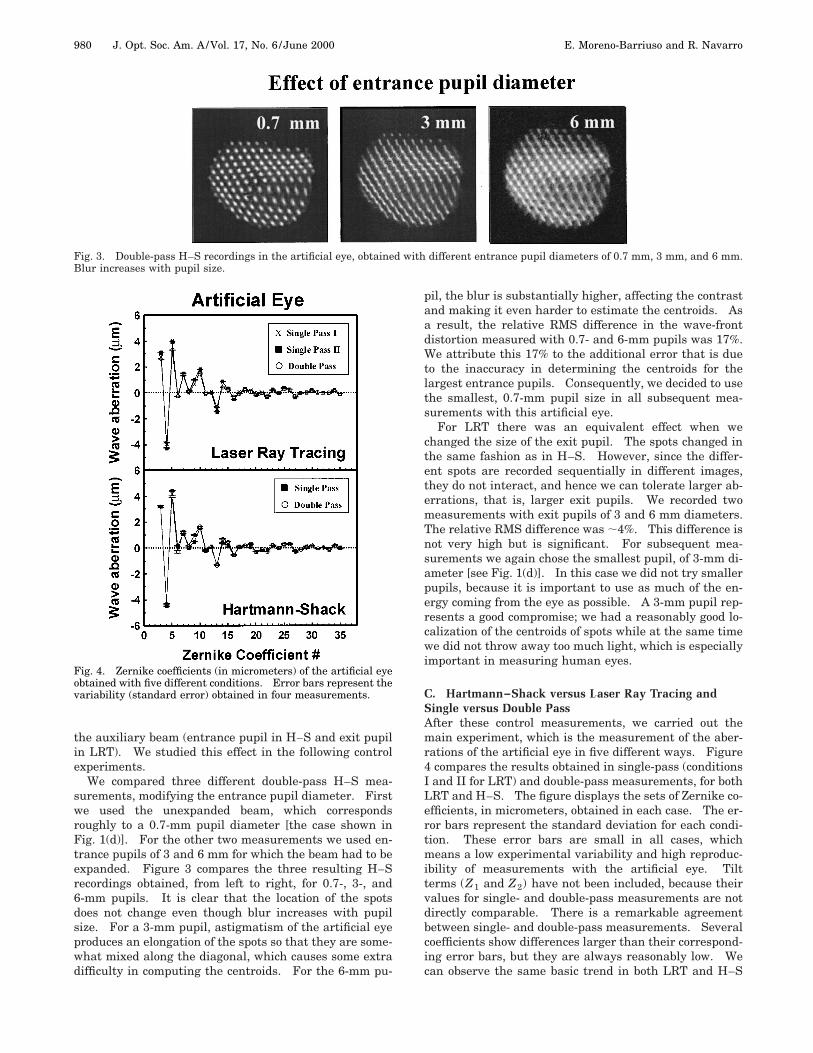
C. Hartmann–Shack versus Laser Ray Tracing andSingle versus Double PassAfter these control measurements, we carried out themain experiment, which is the measurement of the aber-rations of the artificial eye in five different ways. Figure4 compares the results obtained in single-pass (conditionsI and II for LRT) and double-pass measurements, for bothLRT and H–S. The figure displays the sets of Zernike co-efficients, in micrometers, obtained in each case. The er-ror bars represent the standard deviation for each condi-tion. These error bars are small in all cases, whichmeans a low experimental variability and high reproduc-ibility of measurements with the artificial eye. Tiltterms (Z1 and Z2) have not been included, because theirvalues for single- and double-pass measurements are notdirectly comparable. There is a remarkable agreementbetween single- and double-pass measurements. Severalcoefficients show differences larger than their correspond-ing error bars, but they are always reasonably low. Wecan observe the same basic trend in both LRT and H–S
E. Moreno-Barriuso and R. Navarro Vol. 17, No. 6 /June 2000/J. Opt. Soc. Am. A 981
cases. As expected, no coefficient associated with thedouble-pass measuring system seems to be systematicallybiased. Also expected, there is no partial cancellation ofasymmetrical aberrations because of the double pass ofthe light through the optics of the eye. In addition, ver-sions I and II of single-pass LRT measurements providealmost identical results, which is an additional validationof the reversibility and equivalence of the incoming andoutgoing beams in the double pass. Nevertheless, it isimportant to note that this comparison was made with in-coherent recordings and with limiting of the width of theauxiliary beam to control blur. These two factors canhave a strong influence on double-pass measurementsand need to be controlled, especially in H–S measure-ments.
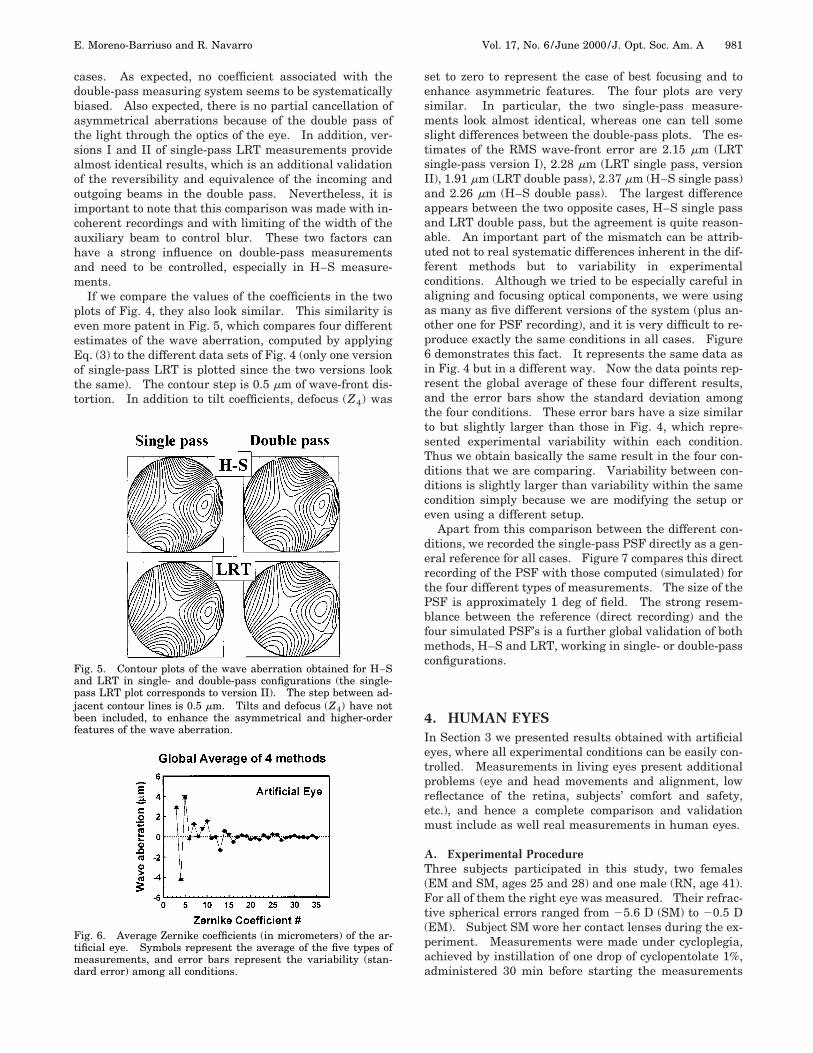
If we compare the values of the coefficients in the twoplots of Fig. 4, they also look similar. This similarity iseven more patent in Fig. 5, which compares four differentestimates of the wave aberration, computed by applyingEq. (3) to the different data sets of Fig. 4 (only one versionof single-pass LRT is plotted since the two versions lookthe same). The contour step is 0.5 mm of wave-front dis-tortion. In addition to tilt coefficients, defocus (Z4) was
Fig. 5. Contour plots of the wave aberration obtained for H–Sand LRT in single- and double-pass configurations (the single-pass LRT plot corresponds to version II). The step between ad-jacent contour lines is 0.5 mm. Tilts and defocus (Z4) have notbeen included, to enhance the asymmetrical and higher-orderfeatures of the wave aberration.
Fig. 6. Average Zernike coefficients (in micrometers) of the ar-tificial eye. Symbols represent the average of the five types ofmeasurements, and error bars represent the variability (stan-dard error) among all conditions.
set to zero to represent the case of best focusing and toenhance asymmetric features. The four plots are verysimilar. In particular, the two single-pass measure-ments look almost identical, whereas one can tell someslight differences between the double-pass plots. The es-timates of the RMS wave-front error are 2.15 mm (LRTsingle-pass version I), 2.28 mm (LRT single pass, versionII), 1.91 mm (LRT double pass), 2.37 mm (H–S single pass)and 2.26 mm (H–S double pass). The largest differenceappears between the two opposite cases, H–S single passand LRT double pass, but the agreement is quite reason-able. An important part of the mismatch can be attrib-uted not to real systematic differences inherent in the dif-ferent methods but to variability in experimentalconditions. Although we tried to be especially careful inaligning and focusing optical components, we were usingas many as five different versions of the system (plus an-other one for PSF recording), and it is very difficult to re-produce exactly the same conditions in all cases. Figure6 demonstrates this fact. It represents the same data asin Fig. 4 but in a different way. Now the data points rep-resent the global average of these four different results,and the error bars show the standard deviation amongthe four conditions. These error bars have a size similarto but slightly larger than those in Fig. 4, which repre-sented experimental variability within each condition.Thus we obtain basically the same result in the four con-ditions that we are comparing. Variability between con-ditions is slightly larger than variability within the samecondition simply because we are modifying the setup oreven using a different setup.
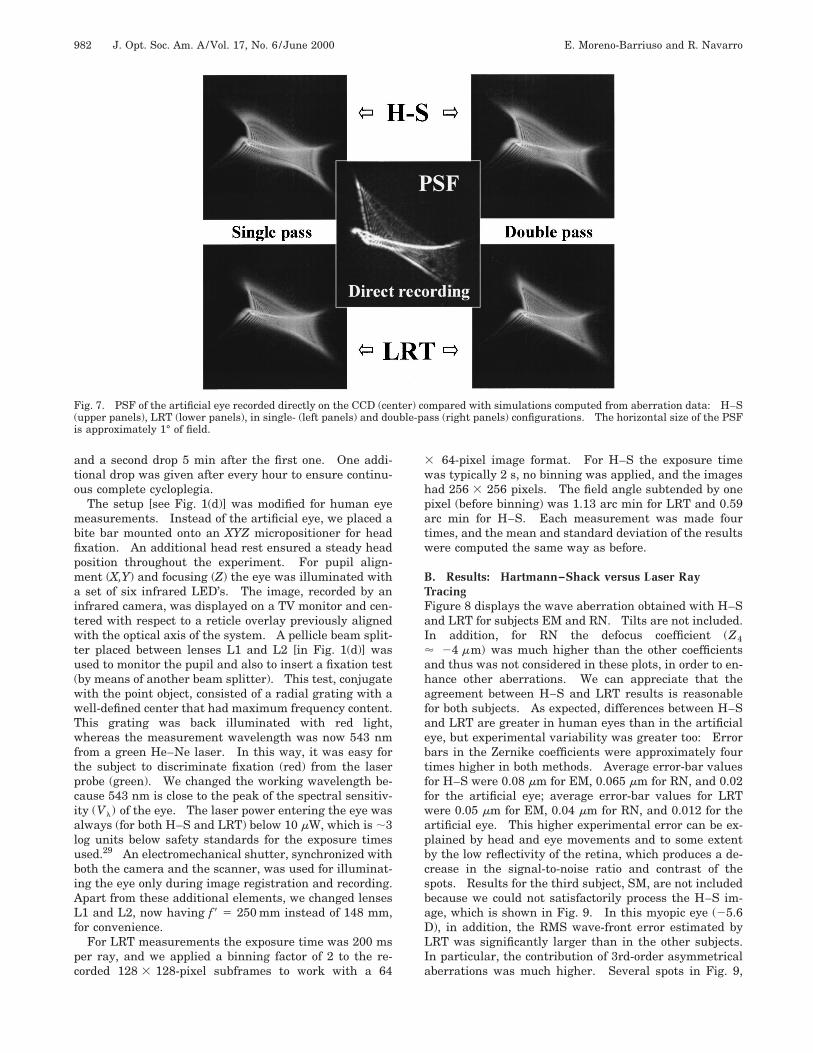
Apart from this comparison between the different con-ditions, we recorded the single-pass PSF directly as a gen-eral reference for all cases. Figure 7 compares this directrecording of the PSF with those computed (simulated) forthe four different types of measurements. The size of thePSF is approximately 1 deg of field. The strong resem-blance between the reference (direct recording) and thefour simulated PSF’s is a further global validation of bothmethods, H–S and LRT, working in single- or double-passconfigurations.
4. HUMAN EYESIn Section 3 we presented results obtained with artificialeyes, where all experimental conditions can be easily con-trolled. Measurements in living eyes present additionalproblems (eye and head movements and alignment, lowreflectance of the retina, subjects’ comfort and safety,etc.), and hence a complete comparison and validationmust include as well real measurements in human eyes.
A. Experimental ProcedureThree subjects participated in this study, two females(EM and SM, ages 25 and 28) and one male (RN, age 41).For all of them the right eye was measured. Their refrac-tive spherical errors ranged from 25.6 D (SM) to 20.5 D(EM). Subject SM wore her contact lenses during the ex-periment. Measurements were made under cycloplegia,achieved by instillation of one drop of cyclopentolate 1%,administered 30 min before starting the measurements
982 J. Opt. Soc. Am. A/Vol. 17, No. 6 /June 2000 E. Moreno-Barriuso and R. Navarro
Fig. 7. PSF of the artificial eye recorded directly on the CCD (center) compared with simulations computed from aberration data: H–S(upper panels), LRT (lower panels), in single- (left panels) and double-pass (right panels) configurations. The horizontal size of the PSFis approximately 1° of field.
and a second drop 5 min after the first one. One addi-tional drop was given after every hour to ensure continu-ous complete cycloplegia.
The setup [see Fig. 1(d)] was modified for human eyemeasurements. Instead of the artificial eye, we placed abite bar mounted onto an XYZ micropositioner for headfixation. An additional head rest ensured a steady headposition throughout the experiment. For pupil align-ment (X,Y) and focusing (Z) the eye was illuminated witha set of six infrared LED’s. The image, recorded by aninfrared camera, was displayed on a TV monitor and cen-tered with respect to a reticle overlay previously alignedwith the optical axis of the system. A pellicle beam split-ter placed between lenses L1 and L2 [in Fig. 1(d)] wasused to monitor the pupil and also to insert a fixation test(by means of another beam splitter). This test, conjugatewith the point object, consisted of a radial grating with awell-defined center that had maximum frequency content.This grating was back illuminated with red light,whereas the measurement wavelength was now 543 nmfrom a green He–Ne laser. In this way, it was easy forthe subject to discriminate fixation (red) from the laserprobe (green). We changed the working wavelength be-cause 543 nm is close to the peak of the spectral sensitiv-ity (Vl) of the eye. The laser power entering the eye wasalways (for both H–S and LRT) below 10 mW, which is ;3log units below safety standards for the exposure timesused.29 An electromechanical shutter, synchronized withboth the camera and the scanner, was used for illuminat-ing the eye only during image registration and recording.Apart from these additional elements, we changed lensesL1 and L2, now having f8 5 250 mm instead of 148 mm,for convenience.
For LRT measurements the exposure time was 200 msper ray, and we applied a binning factor of 2 to the re-corded 128 3 128-pixel subframes to work with a 64
3 64-pixel image format. For H–S the exposure timewas typically 2 s, no binning was applied, and the imageshad 256 3 256 pixels. The field angle subtended by onepixel (before binning) was 1.13 arc min for LRT and 0.59arc min for H–S. Each measurement was made fourtimes, and the mean and standard deviation of the resultswere computed the same way as before.
B. Results: Hartmann–Shack versus Laser RayTracingFigure 8 displays the wave aberration obtained with H–Sand LRT for subjects EM and RN. Tilts are not included.In addition, for RN the defocus coefficient (Z4' 24 mm) was much higher than the other coefficientsand thus was not considered in these plots, in order to en-hance other aberrations. We can appreciate that theagreement between H–S and LRT results is reasonablefor both subjects. As expected, differences between H–Sand LRT are greater in human eyes than in the artificialeye, but experimental variability was greater too: Errorbars in the Zernike coefficients were approximately fourtimes higher in both methods. Average error-bar valuesfor H–S were 0.08 mm for EM, 0.065 mm for RN, and 0.02for the artificial eye; average error-bar values for LRTwere 0.05 mm for EM, 0.04 mm for RN, and 0.012 for theartificial eye. This higher experimental error can be ex-plained by head and eye movements and to some extentby the low reflectivity of the retina, which produces a de-crease in the signal-to-noise ratio and contrast of thespots. Results for the third subject, SM, are not includedbecause we could not satisfactorily process the H–S im-age, which is shown in Fig. 9. In this myopic eye (25.6D), in addition, the RMS wave-front error estimated byLRT was significantly larger than in the other subjects.In particular, the contribution of 3rd-order asymmetricalaberrations was much higher. Several spots in Fig. 9,
E. Moreno-Barriuso and R. Navarro Vol. 17, No. 6 /June 2000/J. Opt. Soc. Am. A 983
mainly in the upper central part, present a too-low inten-sity and contrast and could not be analyzed properly. Al-though it was possible to localize most of the spots visu-ally, the error in estimating the centroid was too large,
Fig. 8. Contour plots of the wave aberration for subjects EMand RN, obtained with H–S and LRT. Tilt terms were not con-sidered, and for RN neither was defocus (Z4). The step betweenadjacent contour lines is 0.5 mm.
Fig. 9. H–S recording for subject SM, who presents low opticalquality and strong asymmetrical aberrations.
Fig. 10. Invariance against changes in the pupil sampling pat-tern for subject RN. The Zernike coefficients obtained with LRTand different sampling patterns (square and hexagonal) and stepsizes (0.6 and 1 mm), show basically the same values.
and the resulting H–S Zernike coefficients were not con-sistent and differed too much from LRT data.
These results evidence a partial validation of the meth-ods. The method has been validated for healthy normaleyes, where aberrations are not too high (RMS wave-fronterror 1.25 mm for EM and 0.51 mm—defocus notincluded—for RN). However, for a myopic subject withlarger aberrations (2.1-mm RMS), which constitute a clini-cally interesting case, we could not obtain a reliable mea-surement with H–S, and hence we could not validate theH–S method. In LRT each spot is recorded and pro-cessed independently, which makes it notably more ro-bust against noise and, more important, against largechanges in the magnitude of the input (aberrations).
C. Effect of Sampling PatternWe performed a final control experiment to study the in-fluence of pupil sampling pattern and frequency. Thishas an important practical interest because one typicallywants to optimize a method by using the simplest configu-ration that guarantees proper and reliable functioning.Until now, we were using a truncated Zernike polynomialexpansion with 35 terms but were recording 91 experi-mental samples. This means that we were possibly ei-ther oversampling the pupil or generating aliasing due toa truncation of the Zernike expansion. To study this is-sue experimentally, we repeated some measurementswith a smaller number of samples and with different pat-terns. This is especially easy with LRT, which permitsus high flexibility in the sampling pattern. We incre-mented the sampling step from 0.592 to 1 mm, which im-plies recording 37 samples (rays) for a 6.5-mm pupil. Inthis way we have a similar number of samples and poly-nomials, and thus we practically eliminate oversampling.Moreover, we compared hexagonal and square samplingpatterns (both with 1-mm step size).
Figure 10 shows the results for subject RN. Each sym-bol represents the average of four runs, and the solid linerepresents the average over the three conditions: 1-mmstep, square sampling (squares); 1-mm step, hexagonal(circles); 0.59-mm step, hexagonal (asterisks). Differ-ences between conditions are lower than the error bars formost coefficients, so that we cannot see any significantdifference between them. For the second subject tested,EM, the results were totally equivalent, except forslightly larger error bars (average value, 0.05 mm for EMversus 0.04 mm for RN). This result is not surprising innormal eyes, because as Liang and Williams14 pointedout, the magnitude of aberrations decreases monotoni-cally with the order of the Zernike polynomial (this decayis roughly exponential). For normal eyes the seventh-order coefficients are already small, so that truncationdoes not introduce large errors. For the two normal eyestested, the result was basically independent of samplingpattern and step. Nevertheless, this could be different insome clinical eyes with large amounts of high-orderaberrations.30
5. DISCUSSION AND CONCLUSIONSAmong the different objective methods available for mea-suring aberrations in the human eye, we have chosen to
984 J. Opt. Soc. Am. A/Vol. 17, No. 6 /June 2000 E. Moreno-Barriuso and R. Navarro
compare LRT with H–S for various reasons. (We havediscarded subjective methods, as explained in Section 1).The Foucault test9 has important drawbacks, includingnonlinearity, contamination of measurements byPurkinje images, and critical dependence on a perfectplacement of the knife edge. Although this was one ofthe first objective methods that provided interesting ex-perimental results, its use has been limited, probably as aresult of to these problems. The Howland aberroscope7
has been already compared with H–S (Ref. 17); the latterprovided both a finer sampling (resolution) and a higherrobustness. Finally, we have discarded other methodswhere aberrations are not directly measured but are in-ferred, for instance, by means of sophisticated phase re-trieval algorithms.13 On the other hand, H–S is probablybecoming the most popular technique in both basic11,14
and clinical24 studies, and hence we thought that it wasthe best method to choose as standard reference for thecomparison. Finally, we believe that LRT, having manyfeatures in common with H–S, may constitute an inter-esting alternative, especially in clinical applications, aswe discuss below.
In summary, both methods, Laser Ray Tracing and theHartmann–Shack wave-front sensor, have been validatedfor measuring ocular aberrations in a double-pass con-figuration. As a first step, the validation has been car-ried out on an artificial eye (having values of aberrationsof the same order of magnitude as normal human eyes),through a direct comparison between single- and double-pass configurations, as well as by directly comparing thetwo methods. A further comparison between the simu-lated PSF’s, computed from the wave-aberration data ob-tained with H–S and LRT, and the single-pass PSF re-corded directly on the CCD array as a primary referencepermits not only a relative but also a global validation.In order for us to complete this study, the two methods(double-pass configuration) needed as well to be validatedin real eyes. In this case we observed four-times-higherlevels of noise, roughly the same in both the H–S and theLRT cases, which we attribute to residual head and eyemovements and, to some extent, to the low reflectivity ofthe retina. In fact, with real eyes we could observe somelimitations of these methods. In H–S the range of aber-rations one can measure seems to be limited by the geom-etry of the sampling grid and the resolution of the micro-lenses. When either the grid or the spots are toodistorted (for highly aberrated eyes) the indexing or thecentroid computation, respectively, becomes difficult.This may limit the range of application of H–S, especiallyin some clinically interesting cases. LRT is significantlymore robust because each spot is recorded and processedindependently and much larger amounts of distortion (in-cluding speckle noise) can be tolerated. The main limi-tation in LRT comes from its sequential nature, so that itis less robust against temporal factors (eye movements,fluctuations of the accommodation, jittering of the laserscanner, etc.), and hence it is not well suited for real-timedynamic measurements.26 Interestingly, the noise leveland the experimental variability in the data were equiva-lent in H–S and LRT (except for subject SM, because itwas too difficult to estimate the centroids of several H–Sspots). This suggests that when both methods operate
within their valid ranges, there seems to be a sort of er-godicity so that the different sources of experimental er-rors and noise (spatial and temporal) have similar effectson average, despite the different nature—parallel orsequential—of the sampling. In both cases, it was impor-tant to limit the width of the auxiliary beam (first pass inH–S and second pass in LRT) by using artificial pupils.
Regarding other pros and cons, there are four main in-herent differences between the two techniques:
1. LRT measures image (retinal or first-pass) aberra-tions, and H–S measures object (aerial or second-pass)ones. However, we have obtained the same results in thetwo cases, which demonstrates the reversibility of lightpaths and the equivalence of the two types of measure-ments.
2. H–S uses a fixed monolithic microlens array,whereas the laser scanner can be programmed with highflexibility to change the sampling pattern in LRT. Con-versely, one can change the diameter of the microlenses(by using a different array or by changing magnification),whereas it is harder to modify the width of the laserbeam.
3. H–S recordings can be faster, ;1 s to blur speckle,although other techniques could be applied to take fasterreal-time dynamic recordings.26 LRT measurement islimited to a few rays per second, so a fine pupil samplingmay take several seconds. Jitter and eye movement canlimit the accuracy of the measurement.
4. In LRT, data analysis and centroid computation areeasier and more robust against noise and the presence oflarge aberrations, because each ray is recorded and pro-cessed independently. The sequential recording makesindexing a trivial task. In H–S when the grid, the spots,or both are too distorted, the measurement can be diffi-cult.
Concerning experimental difficulty, subjects’ comfort,alignment and fixation, etc., we have experienced no bigdifferences between LRT and H–S.
As a general conclusion, both methods are valid, andthey are similar but have significantly different features,so one may prefer one or the other depending on the ap-plication. H–S presents clear advantages in dynamicmeasurements, while the present study suggests thatLRT has advantages in clinical applications where onemay expect to find high values of aberrations.
ACKNOWLEDGEMENTSWe thank Susana Marcos for acting as a subject and mak-ing interesting suggestions. We also thank Mike Hutleyfor providing us with the microlens array used in the ex-periments. This research has been supported by theComision Interministerial de Ciencia y Tecnologıa ofSpain, grant TIC98-0925-C02-01.
E. Moreno-Barriuso and R. Navarro Vol. 17, No. 6 /June 2000/J. Opt. Soc. Am. A 985
REFERENCES1. J. Liang, D. R. Williams, and D. Miller, ‘‘Supernormal vi-
sion and high resolution retinal imaging through adaptiveoptics,’’ J. Opt. Soc. Am. A 14, 2884–2892 (1997).
2. L. Zhu, P. C. Sun, D.-U. Bartsch, W. R. Freeman, and Y.Fainman, ‘‘Adaptive control of a micromachinedcontinuous-membrane deformable mirror for aberrationcompensation,’’ Appl. Opt. 38, 168–176 (1999).
3. R. Navarro, E. Moreno-Barriuso, S. Bara, and T. Mancebo,‘‘Phase plates for wave-aberration compensation in the hu-man eye,’’ Opt. Lett. 25, 236–238 (2000).
4. T. Young, ‘‘On the mechanisms of the eye,’’ Philos. Trans. R.Soc. London 19, 23–88 (1801).
5. A. Ivanoff, Les aberrations de l’oeil. Leur role dansl’accommodation (Editions de la revue d’Optique Theoriqueet Instrumentale, Paris, 1953).
6. M. S. Smirnov, ‘‘Measurement of the wave aberration of thehuman eye,’’ Biofizika 6, 687–703 (1961); Biophysics 6,776–795 (1962) (English translation).
7. H. Howland and B. Howland, ‘‘A subjective method for themeasurement of monochromatic aberrations of the eye,’’ J.Opt. Soc. Am. A 67, 1508–1518 (1977).
8. J. C. He, S. Marcos, R. H. Webb, and S. A. Burns, ‘‘Measure-ment of the wave-front aberration of the eye by a fast psy-chophysical procedure,’’ J. Opt. Soc. Am. A 15, 2449–2456(1998).
9. F. Berny, ‘‘Etude de la formation des images retiniennes etdetermination de l’aberration de sphericite de l’oeil hu-main,’’ Vision Res. 9, 977–990 (1969).
10. G. Walsh, W. N. Charman, and H. C. Howland, ‘‘Objectivetechnique for the determination of monochromatic aberra-tions of the human eye,’’ J. Opt. Soc. Am. A 1, 987–992(1984).
11. J. Liang, B. Grimm, S. Golez, and J. Bille, ‘‘Objective mea-surement of wave aberrations of the human eye with theuse of a Hartmann–Shack wave-front sensor,’’ J. Opt. Soc.Am. A 11, 1949–1957 (1994).
12. R. Navarro and M. A. Losada, ‘‘Aberrations and relative ef-ficiency of light pencils in the living human eye,’’ Optom.Vision Sci. 74, 540–547 (1997).
13. I. Iglesias, E. Berrio, and P. Artal, ‘‘Estimates of the ocularwave aberration from pairs of double-pass retinal images,’’J. Opt. Soc. Am. A 15, 2466–2476 (1998).
14. J. Liang and D. R. Willians, ‘‘Aberrations and retinal imagequality of the normal human eye,’’ J. Opt. Soc. Am. A 14,2873–2883 (1997).
15. R. Navarro, E. Moreno, and C. Dorronsoro, ‘‘Monochromaticaberrations and point-spread functions of the human eye
across the visual field,’’ J. Opt. Soc. Am. A 15, 2522–2529(1998).
16. T. Salmon, L. Thibos, and A. Bradley, ‘‘Comparison of theeye’s wave-front aberration measured psychophysically andwith the Shack–Hartmann wave-front sensor,’’ J. Opt. Soc.Am. A 15, 2457–2465 (1998).
17. L. Thibos and X. Hong, ‘‘Comparison of monochromatic ab-errations of the human eye measured with the Howlandcrossed-cylinder aberroscope and the Shack–Hartmann ab-errometer,’’ presented at the OSA Annual Meeting, Septem-ber 26–October 1, 1999, Santa Clara, Calif.
18. R. Navarro and E. Moreno-Barriuso, ‘‘Laser ray-tracingversus Hartmann–Shack sensor for measuring aberrationsin the eye,’’ presented at the OSA Annual Meeting, October4–9, 1998, Baltimore, Md.
19. R. Navarro and E. Moreno-Barriuso, ‘‘Laser ray-tracingmethod for optical testing,’’ Opt. Lett. 24, 1–3 (1999).
20. J. G. Sivak and R. O. Kreuzer, ‘‘Spherical aberration of thecrystalline lens,’’ Vision Res. 23, 59–70 (1983).
21. P. Artal, R. Navarro, S. Marcos, and D. R. Williams, ‘‘Oddaberrations and double-pass measurements of retinal im-age quality,’’ J. Opt. Soc. Am. A 12, 195–201 (1995).
23. J. M. Geary, Introduction to Wavefront Sensors (SPIE Opti-cal Engineering Press, Bellingham, Wash., 1995).
24. M. W. Campbell, H. Haman, P. Simonet, and I. Brunette,‘‘Dependence of optical image quality on refractive error:eyes after excimer laser photorefractive keratectomy (prk)versus controls,’’ Invest. Ophthalmol. Visual Sci. 40(Suppl.), 7 (1999).
25. Hopkins and M. J. Yzuel, ‘‘The computation of diffractionpatterns in the presence of aberrations,’’ Opt. Acta 17, 157–182 (1970).
26. H. J. Hofer, J. Porter, and D. R. Williams, ‘‘Dynamic mea-surement of the wave aberration of the human eye,’’ Invest.Ophthalmol. Visual Sci. 39 (Suppl.), 203 (1998).
27. S. Marcos, R. Navarro, and P. Artal, ‘‘Coherent imaging ofthe cone mosaic in the living human eye,’’ J. Opt. Soc. Am.A 13, 897–905 (1996).
28. S. Marcos and R. Navarro, ‘‘Imaging the foveal cones in vivothrough ocular speckle interferometry theory and numeri-cal simulations,’’ J. Opt. Soc. Am. A 13, 2329–2340 (1996).
29. D. Sliney and M. Wolbarsht, Safety with Lasers and OtherOptical Sources, 1st ed. (Plenum, New York, 1980).
30. S. A. Burns, S. Marcos, J. McLellan, and R. H. Webb, ‘‘Roleof sampling pattern and size on measuring aberrations ofthe eye,’’ presented at the OSA Annual Meeting, September26–October 1, 1999, Santa Clara, Calif.