+ All Categories
Home > Documents > Lateglacial and Holocene paleoceanography of the central ...

Lateglacial and Holocene paleoceanography of the central ...

Date post: 05-Dec-2021
Category:
Upload: others
View: 2 times
Download: 0 times
Share this document with a friend
126
Lateglacial and Holocene paleoceanography of the central Nordic Seas Dissertation in fulfilment of the requirements for the degree „Dr. rer. nat.” of the Faculty of Mathematics and Natural Sciences at Kiel University submitted by Maciej Mateusz Telesiński Kiel, 2014
Transcript

Lateglacial and Holocene

paleoceanography

of the central Nordic Seas

Dissertation

in fulfilment of the requirements for the degree „Dr. rer. nat.”

of the Faculty of Mathematics and Natural Sciences

at Kiel University

submitted by

Maciej Mateusz Telesiński

Kiel, 2014

First referee: Prof. Dr. Martin Frank

Second referee: Prof. Dr. Dirk Nürnberg

Date of the oral examination: 29. 07. 2014

Approved for publication: 29. 07. 2014

___________________________________

Signed: Prof. Dr. Wolfgang J. Duschl, Dean

V

Summary

Five sediment cores of millennial to multicentennial resolution from the

Greenland and Lofoten basins, central Nordic Seas, were analyzed for planktic

foraminiferal fauna, planktic and benthic stable oxygen and carbon isotopes, and ice-

rafted debris. The Nordic Seas are an important region for the global oceanic system

because they constitute the main surface and the only deep water connection between the

Artic and North Atlantic oceans. They are also a crucial area for deepwater formation.

However, due to a lack of high resolution sediment records the paleoceanography of their

central part has been poorly investigated in close detail yet.

The results in this report show that on a larger spatial and temporal scale the

oceanographic evolution of the Nordic Seas is governed mainly by orbital forcing, but

other processes can play an equally important role in shorter-scale, more local changes.

The most important of these factors are the intensity of Polar and Atlantic waters inflow,

the influence of freshwater discharges, sea-ice processes and deep convection.

The circum-Nordic Seas marine-based ice sheets collapsed 18,000-16,000 years

before present, releasing large amounts of icebergs and freshwater, which affected the

overturning circulation and contributed to the Heinrich stadial 1. Between 12,800 and

11,700 years before present the central Nordic Seas were affected by the last major

freshwater outburst related with the Younger Dryas. Most likely it entered the area

through the Fram Strait, suggesting an Arctic origin for the trigger of this cold event.

The Holocene Thermal Maximum in the central Nordic Seas was delayed

compared to their eastern part and stretched well into the middle Holocene. The deep

convection, developing in the Greenland Basin since the early Holocene, reached its

VI

maximum intensity 7,000-6,000 years before present. Neoglacial cooling increased the

stratification of the water column and around 3,000 years before present it led to a drop in

the deepwater production rate. Ca. 2,000 years before present the subsurface water layer

in the central Nordic Seas was warmed by enhanced Atlantic Water inflow to a level

comparable with the Holocene Thermal Maximum.

VII

Zusammenfassung

An fünf Sedimentkernen aus dem Grönlandbecken und dem Lofotenbecken

(zentrales Europäisches Nordmeer) wurden die planktischen Foraminiferen, planktische

und benthische stabile Sauerstoff- und Kohlenstoffisotope und eistransportiertes Material

mit einer zeitlichen Auflösung von Jahrhunderten bis Jahrtausenden untersucht. Das

Europäische Nordmeer ist eine wichtige Region für das globale Ozeanzirkulationssystem,

weil es die wichtigste bzw. einzige Verbindung für den Austausch von Oberflächen- und

Tiefenwasser zwischen dem Arktischen und dem Atlantischen Ozean darstellt. Es ist auch

ein äußerst wichtiges Gebiet für die Tiefwasserbildung im Weltozean. Wegen nur

weniger vorhandener zeitlich hochauflösender Sedimentkerne ist der zentrale Teil des

Europäischen Nordmeeres bisher aber relativ unvollkommen untersucht.

Die Ergebnisse in dieser Arbeit zeigen, dass die ozeanographische Entwicklung

im Arbeitsgebiet großräumlich und auf längeren Zeitskalen vor allem durch orbitale

Veränderungen beeinflusst wird. Andere Faktoren können jedoch regional und auf

kürzeren Zeitskalen eine ebenso wichtige Rolle spielen. Die wichtigsten dieser Faktoren

sind die Intensität der Advektion von polaren und atlantischen Wassermassen, der

Einstrom von Süßwasser, sowie Prozesse in Zusammenhang mit der

Tiefenwassererneuerung und der Bildung von Meereis.

Die rund um das Europäische Nordmeer existierenden marinen Eisschelfe

kollabierten ca. 18,000-16,000 Jahre vor heute (J. v. h.). Sie setzten große Mengen von

Eisbergen und Süßwasser frei, die die thermohaline Zirkulation beeinflussten und zur

Entstehung des Heinrich-Stadials 1 beigetrugen. Zwischen 12.800 und 11.700 J. v. h.

wurde das zentrale Europäische Nordmeer vom letzten großen Süßwasserausstoß

betroffen, der mit der Jüngeren Dryas assoziiert war. Wahrscheinlich erreichte das

VIII

Süßwasser das Europäische Nordmeer durch die Framstraße, was auf einen arktischen

Ursprung für den Auslöser dieser kalten Klimaphase hindeutet.

Das holozäne Temperaturmaximum (HTM) im zentralen Europäischen Nordmeer

begann im Vergleich zu seinem östlichen Teil etwas verzögert und zog sich bis ins

mittleren Holozän hinein. Die Tiefenwassererneuerung, die sich im Grönlandbecken seit

dem frühen Holozän entwickelte, erreichte ihre maximale Intensität ca. 7,000-6,000 J. v.

h. Die neoglaziale Kühlung verstärkte die Schichtung der Wassersäule und führte ca.

3.000 J. v. h. zu einer Verringerung in der Tiefwasserproduktionsrate. Ab ca. 2000 J. v. h.

zeigen die Daten eine Erwärmung der oberflächennahen Schichten im zentralen

Europäischen Nordmeer ähnlich wie im HTM an, was auf einen erneuten verstärkten

Atlantikwasserzustrom deutet.

IX

Streszczenie

Pięć rdzeni osadów morskich o rozdzielczości rzędu stu do tysiąca lat,

pochodzących z basenów Grenlandzkiego i Lofockiego (centralna część Mórz

Nordyckich) zostało poddanych analizie mikropaleontologicznej (otwornice

planktoniczne), izotopowej (stabilne izotopy tlenu i węgla) oraz litologicznej. Morza

Nordyckie są regionem istotnym dla globalnego systemu oceanicznego, ponieważ

stanowią główne połączenie dla wód powierzchniowych, a jedyne dla wód głębinowych

pomiędzy Oceanem Arktycznym i północnym Atlantykiem. Są również kluczowym

obszarem formowania się wód głębinowych. Jednakże, z powodu braku zapisów

kopalnych o dostatecznej rozdzielczości, historia rozwoju oceanograficznego ich

centralnej części była dotychczas słabo poznana.

Przedstawione w tej pracy wyniki pokazują, że rozwój oceanograficzny Mórz

Nordyckich w dłuższej skali czasowej, jak i w większej skali geograficznej jest

determinowany głównie przez zmiany parametrów orbity ziemskiej. Jednakże w krótszej

skali czasowej i na miejszych obszarach inne czynniki mogą odgrywać równie znaczącą

rolę. Do najważniejszych z nich należą: intensywność napływu wód polarnych i

atlantyckich, wpływ wód o niskim zasoleniu, procesy związane z lodem morskim oraz

głęboka konwekcja.

Czoła lądolodów położonych wokół Mórz Nordyckich zaczęły wycofywać się 18-

16 tysięcy lat temu, uwalniając duże ilości gór lodowych oraz wody słodkiej, która

wpłynęła na cyrkulację termohalinową, przyczyniając się do genezy tzw. Zdarzenia

Heinricha 1. Pomiędzy 12,8 i 11,7 tys. lat temu, w czasie Młodszego dryasu, po raz

ostatni znaczące ilości wody słodkiej dotarły do centralnej części Mórz Nordyckich.

X

Najprawdopodobniej woda ta przedostała się w ten rejon od strony cieśniny Fram, co

sugeruje że źródła tej zimnej fazy klimatycznej należy szukać w Arktyce.

Optimum klimatyczne holocenu w centralnej części Mórz Nordyckich było

opóźnione w porównaniu z ich wschodnią częścią i trwało aż do środkowego holocenu.

Głęboka konwekcja, która rozwijała się w Basenie Grenlandzkim od wszesnego

holocenu, osiągnęła swoją maksymalną intensywność około 7-6 tys. lat temu.

Ochłodzenie neoglacjalne wzmocniło stratyfikację termohalinową wód i około 3 tys. lat

temu doprowadziło do spadku tempa produkcji wód głębinowych. Około 2 tys. lat temu

temperatura podpowierzchniowych warstw wód w centralnej części Mórz Nordyckich

wzrosła do poziomu porównywalnego z optimum klimatycznym holocenu w wyniku

zwiększonego napływu wód atlantyckich.

XI

Acknowledgements

My warm and sincere thanks go to:

Dr. Robert F. Spielhagen for introducing me to my work and supervising it, for his

kindness, support and countless advices,

Prof. Dr. Martin Frank for entrusting me this work, overseeing and examining it,

Prof. Dr. Dirk Nürnberg for being the co-referee,

Dr. Henning A. Bauch for numerous discussions, advices, his interest and criticism,

Dr. Kirstin Werner for valuable help and support, not only in scientific matters,

Dr. Christelle Not and Lulzim Haxhiaj for performing the stable isotope

measurements,

my co-authors, reviewers and others who helped me in this work,

the entire Arctic group at GEOMAR (aka “Kaffeerunde”) for discussions on almost

every possible subject as well as many moments of laugh and relax,

all the people involved in the CASE ITN – the PIs, ESRs, and visiting scientists – for

the time spent together in different places across the Europe, for the scientific input

and personal exchange,

Dr. Jacques Giraudeau and Isabelle Deme for coordinating the entire CASE project

and their kind support,

my family and friends for their invaluable support, encouragement during my work

and for moments of respite, especially to my Grandfather for his concern about my

forams,

my Parents – certainly more difficult than to earn a doctoral degree is to raise the

children in such a way that they can achieve it, so they deserve this title more than I

do.

This work is a contribution to the CASE Initial Training Network funded by the

European Community’s 7th Frame- work Programme FP7 2007/2013, Marie-Curie

Actions, under Grant Agreement no. 238111.

XII

XIII

Erklärung

Hiermit versichere ich an Eides statt, dass ich diese Dissertation selbständig und nur mit

Hilfe der angegebenen Quellen und Hilfsmittel und der Beratung durch meinen Betreuer

unter Einhaltung der Regeln guter wissenschaftlicher Praxis der Deutschen

Forschungsgemeinschaft angefertigt habe. Ferner versichere ich, dass der Inhalt dieser

Arbeit weder in dieser, noch in veränderter Form einer weiteren Prüfungsbehörde

vorliegt.

Kiel, den 5. Juni 2014

XIV

XV

Table of contents

1. Introduction 1

1.1. The Nordic Seas – morphology and geological evolution 1

1.2. “The heat pump” and “the lungs of the ocean” 4

1.3. State of the art: the Nordic Seas since the Last Glacial Maximum 5

1.4. Research questions and outline of the thesis 11

1.5. Synthesis/major results 14

References 20

2. Material and methods 29

2.1. Sediment cores 29

2.2. Sample preparation 31

2.3. Chronology 31

2.4. Planktic foraminifera counts 34

2.5. Subsurface temperature reconstruction 34

2.6. Ice-rafted debris and volcanic glass shards 35

2.7. Stable oxygen and carbon isotopes 36

References 36

3. A high-resolution Lateglacial and Holocene palaeoceanographic record from

the Greenland Sea 39

4. Water mass evolution of the Greenland Sea since late glacial times 53

5. Evolution of the central Nordic Seas over the last 20 thousand years 69

Abstract 70

5.1. Introduction 71

5.2. Study area 73

5.3. Material and methods 75

5.4. Chronology 78

5.5. Results 81

5.5.1. Planktic foraminifera and reconstructed subsurface temperatures 81

5.5.2. Stable isotopes 83

5.5.3. IRD 84

5.6. Discussion 84

5.6.1. Deglaciation 84

5.6.2. Holocene 91

5.7. Sumary and conclusions 101

Acknowledgements 103

References 103

XVI

1

1. Introduction

1. Introduction

1.1. The Nordic Seas – morphology and geological evolution

The Nordic Seas (Fig. 1.1.) is a collective name for the body of water consisting of

two deep ocean regions: the Norwegian Sea and the Greenland Sea. They are bordered by

Greenland to the west, the Svalbard archipelago to the northeast, the Scandinavian

Peninsula to the southeast and Iceland to the southwest. In the north the Nordic Seas have

a deep (sill depth ca. 2200 m, Hansen & Østerhus, 2000) connection with the Arctic

Ocean through Fram Strait. In the east they neighbor the shallow Barents Sea shelf. In the

south, the Greenland-Scotland Ridge forms a continuous barrier divided by Iceland and

the Faroe Islands into three gaps – the Denmark Strait, the Iceland-Faroe Ridge and the

Faroe-Shetland Channel – that connect the Nordic Seas with the North Atlantic (Hansen

and Østerhus, 2000).

The Norwegian Sea is separated from the Greenland Sea by submarine ridges –

the Mohns Ridge in the north and the Jan Mayen Ridge (or Microcontinent as it consists

of continental crust, cf. Talwani and Eldholm, 1977) in the south. It can be subdivided

into the southern Norwegian and northern Lofoten basins. Between them are the

northwest-southeast running Jan Mayen fracture zone (JMFZ) and the Vøring Plateau – a

marginal plateau of igneous origin (Mjelde et al., 2001). Characteristic features of the

eastern margin of the Norwegian Sea are glacigenic sediment fans (e.g., the Bear Island

Trough Mouth Fan).

The Greenland Sea is bordered to the west by the broad Greenland continental

shelf. Its northern part is divided by the northwest-southeast oriented Greenland fracture

zone into the northern Boreas and southern Greenland basins. The southernmost part of

2

1. Introduction

the Greenland Sea, also referred to as the Iceland Sea (Hansen and Østerhus, 2000) is

shallower compared to the rest of the Nordic Seas basins. It is cut by the northeast-

southwest stretching Kolbeinsey Ridge, an active section of the Mid-Atlantic Ridge, and

separated by the JMFZ from the rest of the Greenland Sea.

The early Tertiary lithospheric breakup between Eurasia and Greenland occurred

close to the Paleocene/Eocene boundary, ca. 56 milion years ago (Ma). The late syn-rift

phase led to extensive uplift and formation of a land area along the subsequent breakup

axis (Thiede et al., 1995). The Nordic Seas started to open in the early Eocene (Ypresian,

ca. 53 Ma) with a NNW-SSE relative displacement between the Greenland and European

plates (Dauteuil and Brun, 1993). The opening occurred along stable continental margins

without offsets across minor fracture zones (Olesen et al., 2007). The Mohns ridge

formed perpendicular to the spreading direction (Dauteuil and Brun, 1993). The

Greenland Sea only came into existence subsequent to about 38 Ma. Prior to this time a

land bridge existed between Svalbard and Greenland (Talwani and Eldholm, 1977).

During the Oligocene (27 Ma) a major reorganization of North Atlantic plate boundaries

occurred when spreading in the Labrador Sea ceased and the Greenland Plate rotated

counterclockwise relative to the Eurasian Plate. This kinematic change induced WNW-

ESE spreading. In the early Miocene (17.5 Ma) Fram Strait opened wide enough to

permit deepwater exchange and to turn the Arctic Ocean from an oxygen-poor ‘lake

stage’ to the fully ventilated ‘ocean’ phase (Jakobsson et al., 2007) From 12 to 5 Ma, the

spreading rate slowly decreased and then increased to its present value of 1.8 cm a-1

. In

spite of these kinematic changes, the Mohns Ridge retained its old trend and is now

oblique to the 110-120° spreading direction (Dauteuil and Brun, 1996, 1993).

3

1. Introduction

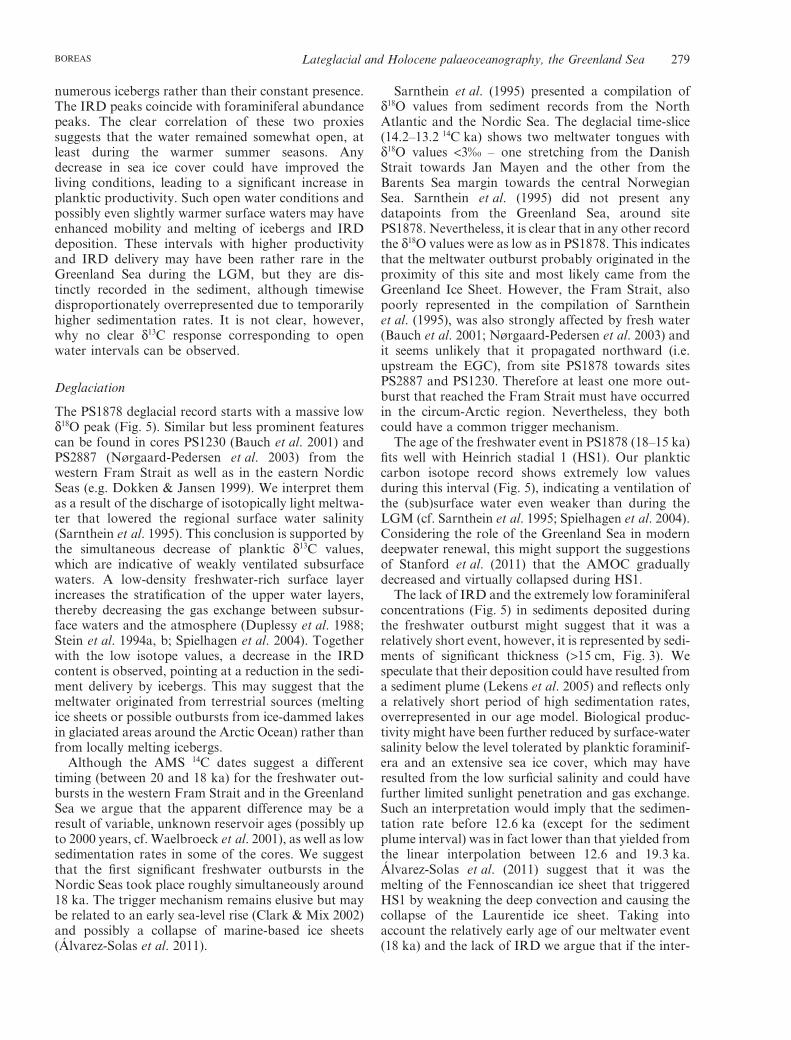
Fig. 1.1. Present day morphology and surface water circulation in the Nordic Seas. Cores

used in this study are marked with yellow dots. Red arrows indicate Atlantic Water, blue

arrows – Polar Water, white broken lines – oceanographic fronts. White arrow – present-

day deep convection (Marshall and Schott, 1999). BB - Boreas Basin, BITMF – Bear

Island Trough Mouth Fan, DS – Denmark Strait, EGC – East Greenland Current, FS –

Fram Strait, FSC - Faroe-Shetland Channel, GB – Greenland Basin, GFZ – Greenland

Fracture Zone, IFR – Iceland-Faroe Ridge, IS – Iceland Sea, JMFZ – Jan Mayen Fracture

Zone, KR – Kolbeinsey Ridge, NAC – North Atlantic Current, WSC – West Spitsbergen

Current, VP – Vøring Plateau. Bathymetry from The International Bathymetric Chart of

the Arctic Ocean (http://www.ibcao.org, 2012).

4

1. Introduction

1.2. “The heat pump” and “the lungs of the deep ocean”

The Nordic Seas have been termed “the heat pump” of the oceans (Weinelt, 1993)

because they play a key role in the warmth transport from low to high latitudes. They

constitute the main surface and the only deep water connection between the Artic and

North Atlantic oceans. Relatively warm, saline (T~6–11°C, S>35) Atlantic Water (AW)

is advected to the area by the North Atlantic Current (NAC) mainly through the Faroe-

Shetland Channel but also over the Iceland-Faroe Ridge and through the Denmark Strait.

The AW then flows northward along the Norwegian coast. Part of it enters the Barents

Sea while the rest continues northward along the shelf edge to eventually reach the Arctic

Ocean through the eastern Fram Strait. Cold, low saline (T<0°C, S<34.4) Polar Water

(PW) enters the Nordic Seas through the western Fram Strait and flows southward as the

East Greenland Current (EGC) along the Greenland shelf margin to finally leave the basin

through the Denmark Strait (Rudels et al., 1999). The EGC sends its branches into the

central part of the Nordic Seas (e.g., the Jan Mayen Current) where they meet western

branches of the NAC (e.g., the Return Atlantic Current). The distribution of surface water

masses in the Nordic Seas results in a threefold division of the basin. The eastern Atlantic

domain is separated by the Arctic Front from the central Arctic domain, an area of AW

and PW mixing (Swift, 1986). In the west, along the Greenland coast, is the Polar

domain, separated by the Polar Front. The AW is partially being subducted below the

EGC-derived Arctic Surface Water, supplying the Atlantic Intermediate Water. Below

resides the weakly stratified Greenland Sea Deep Water, a product of deep convection

(Marshall and Schott, 1999).

The Nordic Seas are also “the lungs of the deep ocean” (Weinelt, 1993) as they are

one of the major areas in the world where deep water convection takes place (e.g.,

Marshall and Schott, 1999; Rudels and Quadfasel, 1991). The western branches of the

5

1. Introduction

NAC and the eastern branches of the EGC create a cyclonic circulation in the Greenland

Sea (known as the Greenland Sea gyre) and lead to a doming of the upper water layers.

Sea ice plays an important preconditioning role in the Greenland Sea compared to other

convection areas. In early winter, the formation of sea ice leads to brine rejection. The

surface layer increases its density. The mixed layer under the ice cools to freezing

temperature and sinks to about 150 m by mid-January. The sea ice cover forms a wedge

(Is Odden) extending far to the northeast. Preconditioning continues later in the winter,

with mixed-layer deepening in the ice-free area (Nord Bukta) to 300–400 m, induced by

strong winds blown over the ice. Typically in March, near-surface densities are high

enough to develop deep convection (down to >2000 m) in the Greenland Sea, if the

meteorological conditions are favorable (Marshall and Schott, 1999). Subsequently, the

water leaves the Nordic Seas as the Denmark Strait and Iceland-Scotland Overflow

Waters (DSOW and ISOW, respectively) together with Arctic Ocean Intermediate and

Deep Water entering the Nordic Sea through the deeper parts of the Fram Strait (Hansen

and Østerhus, 2000).

1.3. State of the art: the Nordic Seas since the Last Glacial Maximum

A huge discrepancy in the state of knowledge exists between the eastern and the

central part of the Nordic Seas. While there are a lot of paleoceanographic studies from

sites located along the main NAC flow, little is known – despite its importance for the

global oceanographic system – about the evolution of the remaining part of the basin even

since the Last Glacial Maximum (LGM). One major reason is the difference in the

temporal resolution of the available sediment records. While a number of sites with

several meters thick marine Holocene sedimentary sequences are known from the eastern

6

1. Introduction

Nordic Seas – even far north, off Svalbard (e.g., Hald et al., 2007; Ślubowska-

Woldengen et al., 2007; Werner et al., 2013), there are very few records of submillennial

or higher temporal resolution from the central Nordic Seas (e.g., Bauch and Weinelt,

1997; Bauch et al., 2001a; Fronval and Jansen, 1997). The typical sedimentation rates in

this deep, cold and often ice-covered area hardly reach 5 cm kyr-1

(e.g., Nørgaard-

Pedersen et al., 2003). With such low sedimentation rates bioturbational mixing becomes

a severe problem, resulting in unusually old surface sediment ages (e.g., Bauch et al.,

2001a; Fronval and Jansen, 1997). Another matter is the accessibility of the sites. While

the eastern Nordic Seas can be reached relatively easily and in a short time from

Scandinavia or Svalbard, coring farther to the west requires long expeditions with ice-

strengthened research vessels.

Since the LGM, ca. 18-23 ka (Sarnthein et al., 2003a), the Nordic Seas

experienced an evolution from fully glacial climatic and oceanographic conditions to the

full interglacial. The LGM was an orbitally driven climax of the Weichselian glaciation.

As the sea-level was ca. 120 m lower than at present (Lambeck and Chappell, 2001), the

Nordic Seas constituted the only connection between the Arctic and Atlantic oceans. All

the land masses surrounding the Nordic Seas, including the Barents Sea shelf, were

covered with ice sheets (Funder and Hansen, 1996; Hubbard et al., 2006; Svendsen et al.,

2004). Despite such cold conditions, sea ice did not cover the entire basin but was

restricted to the northwestern margin of the Nordic Seas during summer and advanced to

the south of Iceland and Faroe during winter (Pflaumann et al., 2003). This was due to

AW, which continued to enter the Nordic Seas although the inflow was much more

unstable than during interstadials (Rasmussen and Thomsen, 2008). The AW subducted

under the cold and relatively fresh surface layer and was warming the deepwater masses.

7

1. Introduction

The deep convection and the outflow of deepwater from the Nordic Seas stopped

(Rasmussen and Thomsen, 2008, 2004).

Due to the rapidly increasing insolation, the ice sheets surrounding the Nordic

Seas started to retreat shortly after the LGM (Lehman et al., 1991). The early (ca. 19 ka)

deglaciation of the Fennoscandian Ice Sheet resulted in enhanced freshwater fluxes to the

North Atlantic and the Nordic Seas, forcing the ocean into a state with weak Atlantic

Meridional Overturning Circulation (AMOC) and NADW formation, similar to a stadial

period (Hall et al., 2006). This led to subsurface warming and a subsequent collapse of

the ice sheets and iceberg purges, a sequence of events known as Heinrich event 1 (H1)

(Álvarez-Solas et al., 2011; Stanford et al., 2011). The released freshwater (Sarnthein et

al., 1995) acted as a positive feedback for the entire process which led to the near or

complete elimination of the AMOC (Álvarez-Solas et al., 2011; McManus et al., 2004).

At 14.6 ka meltwater pulse 1A (mwp-1A) originating from the Antarctic Ice Sheet

raised the sea-level by ca. 20 m and caused a rapid reactivation of the AMOC, thereby

warming the North Atlantic region and initiating the Bølling-Allerød (BA) period

(McManus et al., 2004; Weaver et al., 2003).

The Younger Dryas (YD), spanning ca. 12.8–11.7 ka (Rasmussen et al., 2006),

was the coldest phase within the overall climate warming in the transition from the LGM

to the Holocene. This millennial-scale event involved a significant reduction in the

AMOC attributed to enhanced meltwater inputs into the North Atlantic (e.g., Broecker et

al., 2010; Not and Hillaire-Marcel, 2012). It is still unclear whether the freshwater pulse

reached the Nordic Seas as a sediment-loaded plume from the Hudson Strait (Rashid et

al., 2011), as a meltwater discharge through the St Lawrence river system and via the

Gulf Stream (e.g., Broecker et al., 1989) or through the Mackenzie River basin and via

8

1. Introduction

the Arctic Ocean (e.g., Not and Hillaire-Marcel, 2012; Tarasov and Peltier, 2006).

Despite a dispute on terrestrial evidence (Fisher and Lowell, 2012; Murton et al., 2010),

the latter concept has gained increasing support recently through modelling results of

Condron and Winsor (2012). They showed that only a meltwater discharge from the

Arctic, in contrast to the outflow through the St Lawrence Valley, was able to reach the

deepwater formation regions of the subpolar North Atlantic and weaken the AMOC

significantly.

The Holocene interglacial, which began after the YD (Rasmussen et al., 2006),

was climatically a relatively stable interval compared to the last glacial, especially when

looking at the ice core records (e.g., Grootes et al., 1993). Other proxy records, however,

reveal rapid variations of significant amplitude throughout the Holocene (e.g., Bond et al.,

1997; Mayewski et al., 2004). The onset of the Holocene was related to high insolation in

the high northern latitudes (Risebrobakken et al., 2011). After the transitional Preboreal

period, Northern Hemisphere insolation and AW advection into the Nordic Seas reached

their maximum (Risebrobakken et al., 2011). The Holocene Thermal Maximum (HTM),

the warmest part of the Holocene related with these maxima, occurred relatively early in

the eastern Nordic Seas, along the main NAC flow, and was quite short (11-9 ka,

Risebrobakken et al., 2011). In other parts of the Nordic Seas, however, the climatic

optimum was reached later and/or lasted much longer (e.g., Andersen et al., 2004b; Bauch

et al., 2001b; Sarnthein et al., 2003b; Werner et al., 2013). This delay partly resulted from

the influence of the melting Greenland Ice Sheet which acted as a negative feedback to

the orbitally forced climatic optimum (Blaschek and Renssen, 2013). On the other hand, it

was related to the development of the stable and modern-like oceanic circulation in the

Nordic Seas that was reached only ca. 7-8 ka (Bauch et al., 2001a; Hall et al., 2004;

Thornalley et al., 2010).

9

1. Introduction

Many studies report a number of relatively short events during the Holocene with

surface water cooling (Wanner et al., 2011; Werner et al., 2013), increased ice-rafting

(Bond et al., 2001, 1997) or reduced AMOC intensity (Hass, 2002) in the North Atlantic

region. Despite numerous attempts (Bond et al., 2001, 1997; Risebrobakken et al., 2003;

Sarnthein et al., 2003b) no clear cyclicity has been found and most of these events

apparently did not occur simultaneously on a global or even regional scale (Wanner et al.,

2011). Only the event at ca. 8.2 ka seems to be recorded worldwide, although the

anomalies in many records span 400 to 600 years (Rohling and Pälike, 2005). This so-

called ‘8.2 ka event’ is also recorded in Greenland ice cores where it appears as the most

prominent abrupt climatic event during the Holocene (Kobashi et al., 2007). This event,

characterized by a generally cool, dry and windy climate, is commonly assigned to the

final outburst drainage of proglacial lakes Agassiz and Ojibway into the North Atlantic

and a slowdown of NADW formation (Barber et al., 1999; Kobashi et al., 2007; Rohling

and Pälike, 2005). In the Nordic Seas it was associated with lower sea-surface

temperatures (Risebrobakken et al., 2003; Sarnthein et al., 2003b), salinities (Werner et

al., 2013), increased sea-ice and iceberg abundance (Bond et al., 1997; Müller et al.,

2012) and reduced ISOW flow speed (Hall et al., 2004).

Apparently, the 8.2 ka event interrupted the HTM but did not disturb the long-

term climatic and oceanographic evolution of the Holocene. Although in some areas the

orbitally induced (Andersen et al., 2004a) Neoglacial cooling started already after 9 ka

(Hald et al., 2007; Risebrobakken et al., 2011), in most of the Nordic Seas the climatic

optimum ended well after the 8.2 ka perturbation (e.g., Andersen et al., 2004b; Bauch et

al., 2001a; Fronval and Jansen, 1997; Sarnthein et al., 2003b). While at some sites the

cooling was gradual (e.g., Andersen et al., 2004a; Marchal et al., 2002), in other places it

showed a stepwise pattern (e.g., Calvo et al., 2002; Werner et al., 2013). The flooding of

10

1. Introduction

the Arctic shelves at 9-5 ka which increased the sea-ice production (Bauch et al., 2001b)

and the roughly contemporary shift of the Transpolar Drift in the Arctic Ocean that

increased the southward transport through the Fram Strait (Dyke et al., 1997; Prange and

Lohmann, 2003) may have triggered the stepwise cooling episodes (Werner et al., 2013).

At least since the establishment of the stable and modern-like oceanic circulation

in the Nordic Seas ca. 7-8 ka (Bauch et al., 2001a; Thornalley et al., 2010) open ocean

deep convection has taken place in the Nordic Seas (Marshall and Schott, 1999; Rudels

and Quadfasel, 1991). Benthic carbon isotope records (Bauch et al., 2001a; Sarnthein et

al., 2003b) indicate that ca. 6 ka it reached its maximum velocity and depth. The

development of convective activity was enabled by the activation of the Greenland Sea

gyre. The resulting increased inflow of both AW and PW strengthened the heat transport

to the eastern Nordic Seas (hence delaying the Neoglacial cooling) as well as enhanced

cooling and sea-ice delivery from the Arctic (Giraudeau et al., 2010).

Around 3 ka a strong solar irradiance minimum triggered another significant

oceanographic and climatic shift in the Nordic Seas (Renssen et al., 2006). The resulting

expansion of drift ice (Bond et al., 2001; Müller et al., 2012) not only changed the surface

water structure (stronger halocline) but also caused a perturbation in the AMOC (Hall et

al., 2004). This event is a sound stratigraphic time marker (Bauch and Weinelt, 1997) as it

is recorded all across the Nordic Seas as a distinct decrease in the planktic carbon isotope

ratios (Bauch et al., 2001a; Fronval and Jansen, 1997; Risebrobakken et al., 2011;

Sarnthein et al., 2003b; Vogelsang, 1990; Werner et al., 2013).

The late Holocene was a time of low insolation in the high northern latitudes

(Wanner et al., 2008). Several climatic and oceanographic fluctuations are known from

this time interval in the North Atlantic region. The Roman Warm Period (RWP), peaking

11

1. Introduction

ca. 2 ka, was a period of warm weather over the Northern Hemisphere (Ljungqvist, 2010)

as well as faster ISOW flow (Bianchi and McCave, 1999). It coincided with a major

change in the North Atlantic Oscillation mode from variable, intermittently negative to

generally positive (Olsen et al., 2012). The latter state is characterized by stronger

westerlies, which intensify the AW advection into the Nordic Seas. The RWP was

followed by the Dark Ages Cold Period and the Medieval Warm Period (or Medieval

Climate Anomaly), centered around 1.5 ka and 1 ka, respectively (Crowley and Lowery,

2000; Ljungqvist, 2010). Finally, the Little Ice Age, centered ca. 0.3 ka, was a period of

cooling and advances of mountain glaciers in the Northern Hemisphere. It occurred when

low summer insolation coincided with solar activity minima and several strong tropical

volcanic eruptions (Eddy, 1976; Wanner et al., 2008). Since ca. 0.2 ka the Northern

Hemisphere temperatures keep increasing (Kaufman et al., 2009; Moberg et al., 2005).

1.4. Research questions and outline of the thesis

The aim of this study was to reconstruct the paleoceanography of the central part

of the Nordic Seas with highest possible temporal resolution. For this purpose

undisturbed records from sites with sufficient sedimentation rates are needed. Due to the

scarcity of such sites, lower resolution records from the research area were also used to

obtain a better view of the spatial range of at least part of the observed processes. As the

target time interval the period between the LGM and present day was chosen as it

encompasses a full transition between glacial and interglacial climatic and oceanographic

conditions as well as the evolution of the present interglacial. To obtain a most

comprehensive image a set of different proxies was applied. Planktic and benthic stable

oxygen and carbon isotopes give hints on water temperature and salinity, ventilation and

12

1. Introduction

structure of the water column. Planktic foraminiferal assemblages allow to reconstruct

surface water temperature (also absolute temperatures by means of transfer functions),

bioproductivity (and thus, indirectly, ventilation, sea-ice coverage, food availability etc.)

and different water masses. Finally, ice rafted debris (IRD) informs on the abundance of

drift ice and the identification of its origin allows to reconstruct surface water currents.

The presented thesis addresses the following research questions:

- Is it possible to find sedimentary records of submillennial temporal resolution in the

central Nordic Seas? What are the problems with the stratigraphy, dating and

correlation of records from this region?

- How severe were the conditions in the central Nordic Seas during the LGM? Was

there any ice-free water? Did Atlantic Water (AW) reach the area?

- When did the deglaciation start? Was it synchronous across the area? What were the

sources of freshwater outbursts and how did they affect the oceanic circulation?

- How was the Younger Dryas expressed in the area? Are there any indications on the

origin of this cold event?

- Was the onset of the early Holocene warming simultaneous across the Nordic Seas?

How warm was the Holocene Thermal Maximum and did it affect the entire Nordic

Seas at the same time?

- Can any indications of the 8.2 ka event and other brief Holocene cooling events be

found in the central Nordic Seas records?

- When did the Neoglacial cooling start? Was it gradual or rapid/stepwise?

- How did the overturning circulation in the area develop throughout the Holocene?

13

1. Introduction

- What were the reasons, character and results of the oceanic circulation changes

around and after 3 ka? Were the effects of local or regional scale?

The thesis consists of two introductory sections (1. and 2.) and three sections in

the form of manuscripts that have either been published or are prepared for submission

(3.-5.). Section 1 describes the general morphological features of the Nordic Seas basin

and its geological history (1.1.), the present-day oceanography in the area (1.2.), the

current state of knowledge on the Nordic Seas paleoceanography from the LGM until

present (1.3.), the main research questions and the outline of the thesis (1.4.) as well as

summarizes the main results of our research (1.5.). Section 2 presents the material and

methods used in the study.

Section 3 presents a new high-resolution record of the surface water

paleoceanography of the central Greenland Sea (published in Boreas). My contribution

included the sampling of the sedimentary record, the preparation of the samples for AMS

14C dating and stable isotope analysis, counting planktic foraminifera and IRD,

interpreting the data, preparing the figures and writing the manuscript. Robert F.

Spielhagen contributed to the discussion and the improvement of the manuscript. Ewa M.

Lind performed the geochemical analysis of the volcanic glass shards, interpreted the

result, prepared one figure (Fig. 4) and contributed to the part of the manuscript

concerning the tephra layer.

In Section 4 the central Greenland Sea record (Section 3.), supplemented with

benthic stable isotope data and subsurface temperature reconstruction, is compared to

lower-resolution records from the northern Greenland Sea to gain a more complete

spatial image of the paleoceanography in the area, including the deep water environment

(published in Climate of the Past). I contributed to this section by sampling cores

14

1. Introduction

PS1878 and PS1910-1, preparing the material for AMS 14

C dating and stable isotope

analysis, counting planktic foraminifera and IRD (all cores), performing the transfer

function calculations, interpreting the data, preparing the figures and writing the

manuscript. Robert F. Spielhagen and Henning A. Bauch provided part of the data from

the northern Greenland Sea records (PS1894-7 and PS1906-1) and contributed to the

discussion and the improvement of the manuscript.

Section 5 compares two high-resolution records from the central Nordic Seas and

attempts to summarize the previous results to gain a paleoceanographic reconstruction of

the entire area. My contribution included the sampling of the sedimentary record, the

preparation of the samples for AMS 14

C dating and stable isotope analysis, counting

planktic foraminifera and IRD, interpreting the data, preparing the figures and writing the

manuscript. Henning A. Bauch and Robert F. Spielhagen contributed to the discussion

and the improvement of the manuscript. E. S. Kandiano performed the transfer function

calculations.

1.5. Synthesis/major results

Two sedimentary records of multicentennial resolution retrieved from the Lofoten

Basin, Norwegian Sea, and the central Greenland Sea are presented. As only a few

submillennial records are known from this region (Bauch et al., 2001a; Fronval and

Jansen, 1997), our results greatly improve the understanding of the paleoceanographic

evolution of the Nordic Seas on a higher spatial and temporal level. Due to the

importance of this region for the global ocean circulation, they also contribute to our

knowledge on the processes governing the global ocean-climate system.

15

1. Introduction

The results show that during the LGM the central Nordic Seas were strongly

affected by PW. Due to the perennial sea-ice cover the ocean-atmosphere gas exchange

and sunlight penetration were limited, resulting in poor ventilation of the upper water

layers and low bioproductivity dominated by polar species. Occasionally during the

warmer summer seasons the sea-ice cover diminished somewhat, allowing the

foraminiferal fauna to bloom. These open water events also increased the mobility of

icebergs and ice-rafted material delivery. It is impossible, however, to determine from the

data whether the events were simultaneous across the region.

The deglaciation in the Nordic Seas started already around 19 ka with a small but

conspicuous “precursor” freshwater event. It was probably caused by the sea-level rise

(Clark et al., 2004) and originated from multiple sources. Between 18 and 16 ka the main

deglacial event, associated with Heinrich stadial 1 (HS1), occurred roughly

simultaneously across the Nordic Seas. Massive freshwater discharges originated from

different circum-Nordic Seas ice sheets (Lekens et al., 2005; Nørgaard-Pedersen et al.,

2003; Sarnthein et al., 1995). The eastern Greenland Ice Sheet was a source of a

particularly strong outburst as in the central Greenland Sea the planktic 18

O values

during HS1 fell to almost 0‰, a level not observed in any other Nordic Seas or North

Atlantic record. Freshwater also affected deep parts of the Nordic Seas, either as

supercooled cascades descending down the continental slope (Lofoten Basin) or as fine

sediment-loaded hyperpycnal plumes (Greenland Basin), though these two mechanisms

do not exclude each other. The freshwater lid on top of the water column led to a collapse

of the AMOC during HS1 (Stanford et al., 2011). Our results suggest that the Nordic Seas

played a crucial role in this process and that the ice sheets surrounding them were an

important source of icebergs and freshwater. This is in contrast to many earlier studies

16

1. Introduction

(e.g., Broecker, 1994; Hemming, 2004) which regarded the Laurentide Ice Sheet and the

Labrador Sea as the key regions for the onset of HS1.

The HS1-related freshwater discharges ended ca. 16 ka. The following interval

(until ca. 13 ka) was still cold in the Nordic Seas and no indications of the Bølling-

Allerød warming can be found except for a slightly increased bioproductivity. On the

other hand, the AMOC was reactivated (Stanford et al., 2011) and the circulation system

in the area started to develop towards its modern shape. As the Barents Sea Ice Sheet had

already collapsed by this time (Bischof, 1994), the Greenland Ice Sheet remained the

main source for icebergs and freshwater, still releasing them in minor discharges.

During the YD interval (12.8-11.7 ka) the Nordic Seas were affected by the last

major freshwater discharge resulting from the drainage of glacial Lake Agassiz (Murton

et al., 2010). The presence of clear freshwater indications in the Greenland and Lofoten

basins as well as in the Fram Strait (Fahl and Stein, 2012) together with a lack of such

evidence farther to the south (e.g., Risebrobakken et al., 2003) points to the Arctic Ocean

as the source area of the freshwater and supports the hypothesis of a drainage through the

Mackenzie Valley (Condron and Winsor, 2012; Tarasov and Peltier, 2006) as the most

probable mechanism to trigger the YD cold event. Our results extend the range of the YD

freshwater plume to the central part of the Nordic Seas. Such a broad extent of the

freshwater lid is in agreement with the sharp AMOC decline (McManus et al., 2004) and

increased sea-ice abundance in the Nordic Seas (Cabedo-Sanz et al., 2013; Müller et al.,

2009) during the early YD.

The onset of the Holocene in the Nordic Seas was associated with a major

decrease in ice rafting, diminishing sea-ice cover, enhanced AW inflow and increasing

bioproductivity. After a short transitional period, subsurface water temperatures reached

17

1. Introduction

their maximum in the eastern Nordic Seas (Hald et al., 2007; Risebrobakken et al., 2011).

Our results, however, show that farther to the west the warming was more gradual and

somewhat delayed. This was, on the one hand, caused by the activation and stabilization

of the Greenland Sea gyre. On the other hand, the deglacial freshwater from the

Greenland Ice Sheet acted as a negative feedback to the warming and AMOC

development in the central Nordic Seas (Blaschek and Renssen, 2013). In the Lofoten

Basin the maximum Holocene temperatures were reached between 10 and 9 ka, while in

the central Greenland Sea only after 8 ka. Also the duration of the thermal maximum in

the central Nordic Seas was different than in the east. While along the eastern continental

margin the warmest interval was restricted to ca. 2 kyr (Hald et al., 2007; Risebrobakken

et al., 2011; Sarnthein et al., 2003b), farther to the west it stretched well into the middle

Holocene.

The early-mid Holocene thermal maximum was, however, not a uniform interval.

In the entire North Atlantic region it was interrupted by several short-scale cooling events

(Wanner et al., 2011; Werner et al., 2013), the most prominent and widespread of which

was the 8.2 ka event. In the central Nordic Seas it was reflected by a limited

bioproductivity. The cooling of the upper water layers was more pronounced in the

Lofoten Basin, probably due to the weakened AW transport (Born and Levermann, 2010),

as the temperatures in this area depend more on that factor than in the Greenland Sea. Our

data also indicate a modest freshwater influence in the Greenland Basin and suggest a

brief AMOC reduction at that time (cf. Hall et al., 2004). Several other events of cooling

and reduced bioproductivity can be found in our records but a correlation of them seems

difficult.

Our benthic isotope records indicate the development of deep convection in the

Greenland Sea at least since the early Holocene. Only after 8-7 ka, when the freshwater

18

1. Introduction

input from the Greenland Ice Sheet ceased (Blaschek and Renssen, 2013; Seidenkrantz et

al., 2012), the surface and deepwater circulation reached its modern pattern (Thornalley et

al., 2010). Around 7-6 ka the convection rates reached their maximum and remained on

this level until ca. 3 ka. The convection center was most probably located close to its

present-day location (cf. Marshall and Schott, 1999), migrating slightly together with the

sea-ice edge.

The transition between the thermal maximum and the Neoglacial cooling was

forced by the decreasing summer insolation in the high northern latitudes (Andersen et

al., 2004a). However, its course differed across the Nordic Seas. In the northern

Greenland Sea and, e.g., over the Vøring Plateau (Andersen et al., 2004a), surface water

cooled down with decreasing insolation. In other areas the cooling had a more stepwise

character. These rapid cooling steps were apparently triggered by different local or

regional forcings. The early termination of the thermal maximum in the eastern Nordic

Seas, for instance, was a result of a decrease in AW advection (Hald et al., 2007;

Risebrobakken et al., 2011; Sarnthein et al., 2003b). The rapid cooling in the eastern

Fram Strait (Werner et al., 2013) and in the central Greenland Sea coincided with – and

was probably a result of – an enhanced sea-ice production and export from the Arctic

Ocean caused by the flooding of the Siberian shelves (Bauch et al., 2001b; Werner et al.,

2013). In the Lofoten Basin the cooling started only after 4 ka and was likely delayed by

an enhanced AW advection into the Greenland Sea gyre related to the high convection

pace. The cooling led to the expansion of the sea-ice cover and a thickening of the low-

salinity surface layer in the Nordic Seas (Müller et al., 2012; Werner et al., 2013).

The Neoglacial cooling reached its apogee in the central Nordic Seas around 3 ka.

It resulted not only from decreasing insolation. Between 2.85 and 2.6 ka the strongest

Holocene solar irradiance minimum occurred (Renssen et al., 2006; Vonmoos et al.,

19

1. Introduction

2006). By amplifying the Neoglacial cooling, it caused a significant sea-ice expansion

(Müller et al., 2012). Our benthic isotope data suggest that this led to a decrease in the

rate and/or depth of convection. The convection center was probably also relocated

somewhat southeastwards together with the expanding sea-ice cover (Renssen et al.,

2006). The convection slowdown was recorded only at three sites located closest to the

convection center where the ventilation of the bottom water was most efficient. At other

sites the bottom waters were not as well ventilated before 3 ka and therefore the relative

decrease in ventilation was not large enough to be recorded in the sediment archive.

After 3 ka the water column in the Nordic Seas became more stratified and the

deep convection rate did not recover. Ca. 2 ka a variability analogous to the modern

North Atlantic Oscillation changed its mode from variable, intermittently negative to

generally positive, inducing stronger westerlies over the region (Olsen et al., 2012). This

enhanced the AW inflow into the Nordic Seas and, despite the ongoing, orbitally forced

cooling of the surface waters (e.g., Calvo et al., 2002; Marchal et al., 2002), it led to a

subsurface warming. Although the warming can be observed in records from across the

entire region (Andersen et al., 2004b; Giraudeau et al., 2010; Hald et al., 2007;

Risebrobakken et al., 2011; Werner et al., 2013), apparently most of the advected AW

was routed northwestwards towards the central Greenland Sea. As a result, the late

Holocene subsurface temperatures in this area were at a level comparable with the early-

middle Holocene thermal maximum.

The results show that the paleoceanographical evolution of the Nordic Seas was

much more complex than previously thought and that even the highest resolution records

from their eastern part are not representative for the entire region. While the insolation

was the primary factor controlling the environmental evolution on the supraregional and

millennial scale, the more local and shorter-scale variability was mostly controlled by the

20

1. Introduction

routing and intensity of AW inflow into the area. Other factors – such as sea-ice

processes, deep convection, freshwater discharges, etc. – also played an important role.

References

Álvarez-Solas, J., Montoya, M., Ritz, C., Ramstein, G., Charbit, S., Dumas, C.,

Nisancioglu, K., Dokken, T.M., Ganopolski, A., 2011. Heinrich event 1: an example

of dynamical ice-sheet reaction to oceanic changes. Clim. Past 7, 1297–1306.

Andersen, C., Koç, N., Jennings, A.E., Andrews, J.T., 2004a. Nonuniform response of the

major surface currents in the Nordic Seas to insolation forcing: Implications for the

Holocene climate variability. Paleoceanography 19, PA2003.

Andersen, C., Koç, N., Moros, M., 2004b. A highly unstable Holocene climate in the

subpolar North Atlantic : evidence from diatoms. Quat. Sci. Rev. 23, 2155–2166.

Barber, D.C., Dyke, A., Hillaire-Marcel, C., Jennings, A.E., Andrews, J.T., Kerwin,

M.W., Bilodeau, G., McNeely, R., Southon, J., Morehead, M.D., Gagnon, J.-M.,

1999. Forcing of the cold event of 8,200 years ago by catastrophic drainage of

Laurentide lakes. Nature 400, 344–348.

Bauch, H.A., Erlenkeuser, H., Spielhagen, R.F., Struck, U., Matthiessen, J., Thiede, J.,

Heinemeier, J., 2001a. A multiproxy reconstruction of the evolution of deep and

surface waters in the subarctic Nordic seas over the last 30,000 yr. Quat. Sci. Rev.

20, 659–678.

Bauch, H.A., Mueller-Lupp, T., Taldenkova, E., Spielhagen, R.F., Kassens, H., Grootes,

P.M., Thiede, J., Heinemeier, J., Petryashov, V. V., 2001b. Chronology of the

Holocene transgression at the North Siberian margin. Glob. Planet. Change 31, 125–

139.

Bauch, H.A., Weinelt, M.S., 1997. Surface water changes in the Norwegian Sea during

last deglacial and Holocene times. Quat. Sci. Rev. 16, 1115–1124.

Bianchi, G.G., McCave, I.N., 1999. Holocene periodicity in North Atlantic climate and

deep-ocean flow south of Iceland. Nature 397, 515–517.

Bischof, J.F., 1994. The decay of the Barents ice sheet as documented in nordic seas ice-

rafted debris. Mar. Geol. 117, 35–55.

Blaschek, M., Renssen, H., 2013. The Holocene thermal maximum in the Nordic Seas:

the impact of Greenland Ice Sheet melt and other forcings in a coupled atmosphere–

sea-ice–ocean model. Clim. Past 9, 1629–1643.

21

1. Introduction

Bond, G.C., Kromer, B., Beer, J., Muscheler, R., Evans, M.N., Showers, W., Hoffmann,

S., Lotti-Bond, R., Hajdas, I., Bonani, G., 2001. Persistent solar influence on North

Atlantic climate during the Holocene. Science 294, 2130–2136.

Bond, G.C., Showers, W., Cheseby, M., Lotti, R., Almasi, P., DeMenocal, P., Priore, P.,

Cullen, H., Hajdas, I., Bonani, G., 1997. A Pervasive Millennial-Scale Cycle in

North Atlantic Holocene and Glacial Climates. Science 278, 1257–1266.

Born, A., Levermann, A., 2010. The 8.2 ka event: Abrupt transition of the subpolar gyre

toward a modern North Atlantic circulation. Geochemistry, Geophys. Geosystems

11, Q06011.

Broecker, W.S., 1994. Massive iceberg discharges as triggers for global climate change.

Nature 372, 421–424.

Broecker, W.S., Denton, G.H., Edwards, R.L., Cheng, H., Alley, R.B., Putnam, A.E.,

2010. Putting the Younger Dryas cold event into context. Quat. Sci. Rev. 29, 1078–

1081.

Broecker, W.S., Kennett, J.P., Flower, B.P., Teller, J.T., Trumbore, S., Bonani, G.,

Wolfli, W., 1989. Routing of meltwater from the Laurentide Ice Sheet during the

Younger Dryas cold episode. Nature 341, 318–321.

Cabedo-Sanz, P., Belt, S.T., Knies, J., Husum, K., 2013. Identification of contrasting

seasonal sea ice conditions during the Younger Dryas. Quat. Sci. Rev. 79, 74–86.

Calvo, E., Grimalt, J., Jansen, E., 2002. High resolution U37K sea surface temperature

reconstruction in the Norwegian Sea during the Holocene 21, 1385–1394.

Clark, P.U., McCabe, A.M., Mix, A.C., Weaver, A.J., 2004. Rapid rise of sea level

19,000 years ago and its global implications. Science 304, 1141–1144.

Condron, A., Winsor, P., 2012. Meltwater routing and the Younger Dryas. Proc. Natl.

Acad. Sci. U. S. A. 109, 19928–19933.

Crowley, T.J., Lowery, T.S., 2000. How Warm Was the Medieval Warm Period? AMBIO

A J. Hum. Environ. 29, 51–54.

Dauteuil, O., Brun, J.-P., 1993. Oblique rifting in a slow-spreading ridge. Nature 361,

145–148.

Dauteuil, O., Brun, J.-P., 1996. Deformation partitioning in a slow spreading ridge

undergoing oblique extension: Mohns Ridge, Norwegian Sea. Tectonics 15, 870–

884.

Dyke, A.S., England, J., Reimnitz, E., Jetté, H., 1997. Changes in driftwood delivery to

the Canadian Arctic Archipelago: The hypothesis of postglacial oscillations of the

Transpolar Drift. Arctic 50, 1–16.

Eddy, J.A., 1976. The Maunder Minimum. Science 192, 1189–1202.

22

1. Introduction

Fahl, K., Stein, R., 2012. Modern seasonal variability and deglacial/Holocene change of

central Arctic Ocean sea-ice cover: New insights from biomarker proxy records.

Earth Planet. Sci. Lett. 351-352, 123–133.

Fisher, T.G., Lowell, T. V., 2012. Testing northwest drainage from Lake Agassiz using

extant ice margin and strandline data. Quat. Int. 260, 106–114.

Fronval, T., Jansen, E., 1997. Eemian and early Weichselian (140-60 ka)

paleoceanography and paleoclimate in the Nordic seas with comparisons to

Holocene conditions. Paleoceanography 12, 443–462.

Funder, S., Hansen, L., 1996. The Greenland ice sheet - a model for its culmination and

decay during and after the last glacial maximum. Bull. Geol. Soc. Denmark 42, 137–

152.

Giraudeau, J., Grelaud, M., Solignac, S., Andrews, J.T., Moros, M., Jansen, E., 2010.

Millennial-scale variability in Atlantic water advection to the Nordic Seas derived

from Holocene coccolith concentration records. Quat. Sci. Rev. 29, 1276–1287.

Grootes, P.M., Stuiver, M., White, J.W.C., Johnsen, S.J., Jouzel, J., 1993. Comparison of

oxygen isotope records from the GISP2 and GRIP Greenland ice cores. Nature 366,

552–554.

Hald, M., Andersson, C., Ebbesen, H., Jansen, E., Klitgaard-kristensen, D.,

Risebrobakken, B., Salomonsen, G.R., Sarnthein, M., Petter, H., Telford, R.J., 2007.

Variations in temperature and extent of Atlantic Water in the northern North Atlantic

during the Holocene. Quat. Sci. Rev. 26, 3423–3440.

Hall, I.R., Bianchi, G.G., Evans, J.R., 2004. Centennial to millennial scale Holocene

climate-deep water linkage in the North Atlantic. Quat. Sci. Rev. 23, 1529–1536.

Hall, I.R., Moran, S.B., Zahn, R., Knutz, P.C., Shen, C.-C., Edwards, R.L., 2006.

Accelerated drawdown of meridional overturning in the late-glacial Atlantic

triggered by transient pre-H event freshwater perturbation. Geophys. Res. Lett. 33,

L16616.

Hansen, B., Østerhus, S., 2000. North Atlantic–Nordic Seas exchanges. Prog. Oceanogr.

45, 109–208.

Hass, H.C., 2002. A method to reduce the influence of ice-rafted debris on a grain size

record from northern Fram Strait, Arctic Ocean. Polar Res. 21, 299–306.

Hemming, S.R., 2004. Heinrich events: Massive late Pleistocene detritus layers of the

North Atlantic and their global climate imprint. Rev. Geophys. 42, 1–43.

Hubbard, A., Sugden, D., Dugmore, A., Norddahl, H., Pétursson, H.G., 2006. A

modelling insight into the Icelandic Last Glacial Maximum ice sheet. Quat. Sci. Rev.

25, 2283–2296.

23

1. Introduction

Jakobsson, M., Backman, J., Rudels, B., Nycander, J., Frank, M., Mayer, L., Jokat, W.,

Sangiorgi, F., O’Regan, M., Brinkhuis, H., King, J., Moran, K., 2007. The early

Miocene onset of a ventilated circulation regime in the Arctic Ocean. Nature 447,

986–990.

Kaufman, D.S., Schneider, D.P., McKay, N.P., Ammann, C.M., Bradley, R.S., Briffa,

K.R., Miller, G.H., Otto-Bliesner, B.L., Overpeck, J.T., Vinther, B.M., 2009. Recent

warming reverses long-term arctic cooling. Science 325, 1236–9.

Kobashi, T., Severinghaus, J.P., Brook, E.J., Barnola, J.-M., Grachev, A.M., 2007.

Precise timing and characterization of abrupt climate change 8200 years ago from air

trapped in polar ice. Quat. Sci. Rev. 26, 1212–1222.

Lambeck, K., Chappell, J., 2001. Sea level change through the last glacial cycle. Science

292, 679–686.

Lehman, S.J., Jones, G.A., Keigwin, L.D., Andersen, E.S., Butenko, G., Østmo, S.R.,

1991. Initiation of Fennoscandian ice-sheet retreat during the last deglaciation.

Nature 349, 513–516.

Lekens, W.A.H., Sejrup, H.P., Haflidason, H., Petersen, G., Hjelstuen, B., Knorr, G.,

2005. Laminated sediments preceding Heinrich event 1 in the Northern North Sea

and Southern Norwegian Sea: Origin, processes and regional linkage. Mar. Geol.

216, 27–50.

Ljungqvist, F.C., 2010. A New Reconstruction of Temperature Variability in the Extra-

Tropical Northern Hemisphere During the Last Two Millennia. Geogr. Ann. Ser. A,

Phys. Geogr. 92, 339–351.

Marchal, O., Cacho, I., Stocker, T.F., Grimalt, J.O., Calvo, E., Martrat, B., Shackleton,

N., Vautravers, M., Cortijo, E., van Kreveld, S., Andersson, C., Koç, N., Chapman,

M.R., Sbaffi, L., Duplessy, J.-C., Sarnthein, M., Turon, J.-L., Duprat, J., Jansen, E.,

2002. Apparent long-term cooling of the sea surface in the northeast Atlantic and

Mediterranean during the Holocene. Quat. Sci. Rev. 21, 455–483.

Marshall, J., Schott, F., 1999. Open-ocean convection: Observations, theory, and models.

Rev. Geophys. 37, 1–64.

Mayewski, P.A., Rohling, E.E., Stager, J.C., Karle, W., Maasch, K.A., Meeker, L.D.,

Meyerson, E.A., Gasse, F., van Kreveld, S., Holmgren, K., Lee-thorp, J., Rosqvist,

G., Rack, F., Staubwasser, M., Schneider, R.R., Steig, E.J., 2004. Holocene climate

variability. Quat. Res. 62, 243–255.

McManus, J.F., Francois, R., Gherardi, J.-M., Keigwin, L.D., Brown-Leger, S., 2004.

Collapse and rapid resumption of Atlantic meridional circulation linked to deglacial

climate changes. Nature 428, 834–837.

Mjelde, R., Digranes, P., Schaack, M. Van, Shimamura, H., Shiobara, H., Kodaira, S.,

Naess, O., Sørenes, N., Vågnes, E., 2001. Crustal structure of the outer Vøring

24

1. Introduction

Plateau, offshore Norway, from ocean bottom seismic and gravity data. J. Geophys.

Res. 106, 6769–6791.

Moberg, A., Sonechkin, D.M., Holmgren, K., Datsenko, N.M., Karlén, W., 2005. Highly

variable Northern Hemisphere temperatures reconstructed from low- and high-

resolution proxy data. Nature 433, 613–617.

Müller, J., Massé, G., Stein, R., Belt, S.T., 2009. Variability of sea-ice conditions in the

Fram Strait over the past 30,000 years. Nat. Geosci. 2, 772–776.

Müller, J., Werner, K., Stein, R., Fahl, K., Moros, M., Jansen, E., 2012. Holocene cooling

culminates in sea ice oscillations in Fram Strait. Quat. Sci. Rev. 47, 1–14.

Murton, J.B., Bateman, M.D., Dallimore, S.R., Teller, J.T., Yang, Z., 2010. Identification

of Younger Dryas outburst flood path from Lake Agassiz to the Arctic Ocean.

Nature 464, 740–743.

Nørgaard-Pedersen, N., Spielhagen, R.F., Erlenkeuser, H., Grootes, P.M., Heinemeier, J.,

Knies, J., 2003. Arctic Ocean during the Last Glacial Maximum: Atlantic and polar

domains of surface water mass distribution and ice cover. Paleoceanography 18, 1–

19.

Not, C., Hillaire-Marcel, C., 2012. Enhanced sea-ice export from the Arctic during the

Younger Dryas. Nat. Commun. 3.

Olesen, O., Ebbing, J., Lundin, E., Mauring, E., Skilbrei, J.R., Torsvik, T.H., Hansen,

E.K., Henningsen, T., Midbøe, P., Sand, M., 2007. An improved tectonic model for

the Eocene opening of the Norwegian–Greenland Sea: Use of modern magnetic data.

Mar. Pet. Geol. 24, 53–66.

Olsen, J., Anderson, N.J., Knudsen, M.F., 2012. Variability of the North Atlantic

Oscillation over the past 5,200 years. Nat. Geosci. 5, 808–812.

Pflaumann, U., Sarnthein, M., Chapman, M.R., D’Abreu, L., Funnel, B., Huels, M.,

Kiefer, T., Maslin, M.A., Schulz, H., Swallow, J., van Kreveld, S., Vautravers, M.,

Vogelsang, E., Weinelt, M.S., 2003. Glacial North Atlantic: Sea-surface conditions

reconstructed by GLAMAP 2000. Paleoceanography 18, 1065.

Prange, M., Lohmann, G., 2003. Effects of mid-Holocene river runoff on the Arctic

ocean/sea-ice system: a numerical model study. The Holocene 13, 335–342.

Rashid, H., Piper, D.J.W., Flower, B.P., 2011. The role of Hudson Strait outlet in

Younger Dryas sedimentation in the Labrador Sea. Abrupt Clim. Chang. Patterns,

Impacts. Geophys. Monogr. Ser. 193, 93–110.

Rasmussen, S.O., Andersen, K.K., Svensson, A.M., Steffensen, J.P., Vinther, B.M.,

Clausen, H.B., Siggaard-Andersen, M.-L., Johnsen, S.J., Larsen, L.B., Dahl-Jensen,

D., Bigler, M., Röthlisberger, R., Fischer, H., Goto-Azuma, K., Hansson, M.E.,

Ruth, U., 2006. A new Greenland ice core chronology for the last glacial

termination. J. Geophys. Res. 111, D06102.

25

1. Introduction

Rasmussen, T.L., Thomsen, E., 2004. The role of the North Atlantic Drift in the

millennial timescale glacial climate fluctuations. Palaeogeogr. Palaeoclimatol.

Palaeoecol. 210, 101–116.

Rasmussen, T.L., Thomsen, E., 2008. Warm Atlantic surface water inflow to the Nordic

seas 34-10 calibrated ka B.P. Paleoceanography 23, PA1201.

Renssen, H., Goosse, H., Muscheler, R., 2006. Coupled climate model simulation of

Holocene cooling events: oceanic feedback amplifies solar forcing. Clim. Past 2, 79–

90.

Risebrobakken, B., Dokken, T.M., Smedsrud, L.H., Andersson, C., Jansen, E., Moros,

M., Ivanova, E. V., 2011. Early Holocene temperature variability in the Nordic Seas:

The role of oceanic heat advection versus changes in orbital forcing.

Paleoceanography 26, PA4206.

Risebrobakken, B., Jansen, E., Andersson, C., Mjelde, E., Hevrøy, K., 2003. A high-

resolution study of Holocene paleoclimatic and paleoceanographic changes in the

Nordic Seas. Paleoceanography 18, 1017.

Rohling, E.J., Pälike, H., 2005. Centennial-scale climate cooling with a sudden cold event

around 8,200 years ago. Nature 434, 975–979.

Rudels, B., Friedrich, H.J., Quadfasel, D., 1999. The Arctic Circumpolar Boundary

Current. Deep Sea Res. Part II Top. Stud. Oceanogr. 46, 1023–1062.

Rudels, B., Quadfasel, D., 1991. Convection and deep water formation in the Arctic

Ocean-Greenland Sea System. J. Mar. Syst. 2, 435–450.

Sarnthein, M., Gersonde, R., Niebler, S., Pflaumann, U., Spielhagen, R.F., Thiede, J.,

Wefer, G., Weinelt, M.S., 2003a. Overview of Glacial Atlantic Ocean Mapping

(GLAMAP 2000). Paleoceanography 18, 1030.

Sarnthein, M., Jansen, E., Weinelt, M.S., Arnold, M., Duplessy, J.C., Erlenkeuser, H.,

Flatøy, A., Johannessen, G., Johannessen, T., Jung, S.J.A., Koç, N., Labeyrie, L.D.,

Maslin, M., Pflaumann, U., Schulz, H., 1995. Variations in Atlantic surface ocean

paleoceanography, 50°-80°N: A time-slice record of the last 30,000 years.

Paleoceanography 10, 1063–1094.

Sarnthein, M., van Kreveld, S., Erlenkeuser, H., Grootes, P.M., Kucera, M., Pflaumann,

U., Schulz, M., 2003b. Centennial-to-millennial-scale periodicities of Holocene

climate and sediment injections off the western Barents shelf, 75°N. Boreas 32, 447–

461.

Seidenkrantz, M.-S., Ebbesen, H., Aagaard-Sørensen, S., Moros, M., Lloyd, J.M., Olsen,

J., Knudsen, M.F., Kuijpers, A., 2012. Early Holocene large-scale meltwater

discharge from Greenland documented by foraminifera and sediment parameters.

Palaeogeogr. Palaeoclimatol. Palaeoecol. 391, 71–81.

26

1. Introduction

Ślubowska-Woldengen, M., Rasmussen, T.L., Koç, N., Klitgaard-Kristensen, D., Nilsen,

F., Solheim, A., 2007. Advection of Atlantic Water to the western and northern

Svalbard shelf since 17,500 cal yr BP. Quat. Sci. Rev. 26, 463–478.

Stanford, J.D., Rohling, E.J., Bacon, S., Roberts, A.P., Grousset, F.E., Bolshaw, M.,

2011. A new concept for the paleoceanographic evolution of Heinrich event 1 in the

North Atlantic. Quat. Sci. Rev. 30, 1047–1066.

Svendsen, J.I., Alexanderson, H., Astakhov, V.I., Demidov, I., Dowdeswell, J.A., Funder,

S., Gataullin, V., Henriksen, M., Hjort, C., Houmark-Nielsen, M., Hubberten, H.W.,

Ingólfsson, Ó., Jakobsson, M., Kjær, K.H., Larsen, E., Lokrantz, H., Lunkka, J.P.,

Lyså, A., Mangerud, J., Matiouchkov, A., Murray, A., Möller, P., Niessen, F.,

Nikolskaya, O., Polyak, L., Saarnisto, M., Siegert, C., Siegert, M.J., Spielhagen,

R.F., Stein, R., 2004. Late Quaternary ice sheet history of northern Eurasia. Quat.

Sci. Rev. 23, 1229–1271.

Swift, J., 1986. The Arctic waters, in: Hurdle, B. (Ed.), The Nordic Seas. New York, pp.

129–151.

Talwani, M., Eldholm, O., 1977. Evolution of the Norwegian-Greenland sea. Geol. Soc.

Am. Bull. 88, 969–999.

Tarasov, L., Peltier, W.R., 2006. A calibrated deglacial drainage chronology for the North

American continent: evidence of an Arctic trigger for the Younger Dryas. Quat. Sci.

Rev. 25, 659–688.

Thiede, J., Myhre, A.M., Firth, J.V. and the S.S.P., 1995. Cenozoic northern hemisphere

polar and subpolar ocean paleoenvironments (summary of ODP Leg 151 drilling

results), in: Thiede, J., Myhre, A.M., Firth, J. V. (Eds.), Proceedings of the Ocean

Drilling Program, Initial Reports. Ocean Drilling Program, College Station, Texas,

pp. 397–420.

Thornalley, D.J.R., Elderfield, H., McCave, I.N., 2010. Intermediate and deep water

paleoceanography of the northern North Atlantic over the past 21,000 years.

Paleoceanography 25, 1–17.

Vogelsang, E., 1990. Paläo-Ozeanographie des Europäischen Nordmeeres an Hand

stabiler Kohlenstoff- und Sauerstoffisotope – Paleo- ceanography of the Nordic seas

on the basis of stable carbon and oxygen isotopes. Berichte aus dem

Sonderforschungsbereich 313 23, 136.

Vonmoos, M., Beer, J., Muscheler, R., 2006. Large variations in Holocene solar activity:

Constraints from 10 Be in the Greenland Ice Core Project ice core. J. Geophys. Res.

111, A10105.

Wanner, H., Beer, J., Bütikofer, J., Crowley, T.J., Cubasch, U., Flückiger, J., Goosse, H.,

Grosjean, M., Joos, F., Kaplan, J.O., Küttel, M., Müller, S.A., Prentice, I.C.,

Solomina, O., Stocker, T.F., Tarasov, P., Wagner, M., Widmann, M., 2008. Mid- to

Late Holocene climate change: an overview. Quat. Sci. Rev. 27, 1791–1828.

27

1. Introduction

Wanner, H., Solomina, O., Grosjean, M., Ritz, S.P., Jetel, M., 2011. Structure and origin

of Holocene cold events. Quat. Sci. Rev. 30, 3109–3123.

Weaver, A.J., Saenko, O.A., Clark, P.U., Mitrovica, J.X., 2003. Meltwater pulse 1A from

Antarctica as a trigger of the Bølling-Allerød warm interval. Science 299, 1709–

1713.

Weinelt, M.S., 1993. Veränderungen der Oberflächenzirkulation im Europäischen

Nordmeer während der letzten 60.000 Jahre. Berichte aus dem

Sonderforschungsbereich 313 41, 105.

Werner, K., Spielhagen, R.F., Bauch, D., Hass, H.C., Kandiano, E.S., 2013. Atlantic

Water advection versus sea-ice advances in the eastern Fram Strait during the last 9

ka: Multiproxy evidence for a two-phase Holocene. Paleoceanography 28, 283–295.

28

1. Introduction

29

2. Material and methods

2. Material and methods

2.1. Sediment cores

For the study presented here four giant box cores and two kasten cores taken at

five different sites (Table 2.1.) were used. All cores consisted of brown to olive grey

deep-sea sediments (clay to silty sand).

Table 2.1. Cores used in the study.

Core Latitude Longitude Water depth

(m)

Core

type

Analyzed core

length (cm)

PS1878-2

73°15.1 N 9°00.9 W 3038 BC 27

PS1878-3

73°15.3 N 9°00.7 W 3048 KC 108

PS1894-7

75°48.8 N 8°15.5 W 1992 BC 42

PS1906-1

76°50.5 N 2°09.0 W 2990 BC 33

PS1910-1

75°37.0 N 1°19.0 E 2448 BC 33

M17730-4 72°06.7’N 7°23.3’E 2749 KC 118

BC – giant box core, KC – kasten core

The Greenland Sea cores (PS1878-2, PS1878-3, PS1894-7, PS1906-1 and

PS1910-1) were retrieved during the ARK-VII/1 expedition of RV Polarstern to the

Greenland Sea in 1990 (Thiede and Hempel, 1991). Cores PS1878-2 and -3 were taken at

the southern, lower foot of Vesterisbanken seamount in the central Greenland Sea. The

location on the lee side (relative to ocean currents) of this volcano, which rises from the

abyssal plain to a water depth of only 133 m (Nowaczyk and Antonow, 1997), provided

relatively high sedimentation rates, possibly because velocities of southward-directed

ocean currents decrease behind the obstacle, allowing the settling of fine-grained

material. The site is, however, apparently located far enough from the steep seamount

slope to be protected from downslope mass flows. The cores were spliced to one

composite record (PS1878) using AMS 14

C dating and other proxies. The tie point was

30

2. Material and methods

located at 12.5 cm depth in core PS1878-2 and 11.5 cm in core PS1878-3. Thus the depth

scale of core PS1878-3 had to be shifted by 1 cm. All the depths referring to the compiled

record PS1878 are given on the composite depth scale. An 11-cm-thick dark tephra layer

was found at 47–58 cm core depth. Cores PS1894-7, PS1906-1 and PS1910-1 come from

the northern Greenland Sea and were retrieved on the Greenland continental slope, on the

northern and on the southern part of the Greenland Fracture Zone crest, respectively.

Core M17730-4 was taken during the M13/2 expedition of RV Meteor in 1990. It

was retrieved from the northern part of the Lofoten Basin, west of the Bear Island Trough

Mouth Fan and southeast of the Mohns Ridge. It has previously been studied by Weinelt

(1993) and Bauch and Weinelt (1997) but with a lower temporal resolution. As the

original depth scale of the core (Weinelt, 1993) did not fit with our measurements (likely

due to some drying up and some shrinking of the material during storage) we had to

correlate the two depth scales using characteristic lithological horizons in the actual core

material and in the original core photographs to be able to apply the 14

C dates of Weinelt

(1993) to our record. Thus, a new depth scaling was established (Table 2.2.) and all the

depths given here refer to it unless otherwise indicated.

Table 2.2. Tie points between the original depth scale of core M17730-4 (Weinelt, 1993)

and the depth scale used in this study.

Depth (Weinelt, 1993) (cm) Depth (this study) (cm)

21,0 21,5

32,0 32,5

64,6 63,5

88,5 85,5

110,0 104,5

131,0 123,5

31

2. Material and methods

2.2. Sample preparation

The cores were sampled continuously every 1 cm. Additionally, surface sediments

of cores PS1894, PS1906 and PS1910 were analyzed. Further preparation included

freeze-drying, wet-sieving with deionized water through a 63µm mesh, and dry-sieving

into size fractions using 100, 125, 250, 500 and 1000 µm sieves. Each size fraction was

weighed.

2.3. Chronology

Age control of the records is based on AMS 14

C dates performed on monospecific

samples of Neogloboquadrina pachyderma (sin.) (Table 2.3.). All radiocarbon ages were

corrected for a reservoir age of 400 years, calibrated using Calib Rev 6.1.0 software

(Stuiver and Reimer, 1993) and the Marine09 calibration curve (Reimer et al., 2009), and

are given in thousand calendar years before AD 1950 (ka).

Assuming that the tephra layer found at 47–58 cm in core PS1878 (volcanic glass

shards making up >75% of a sample) reflects a short-term volcanic event (duration less

than ca. 5 yr), we set its sedimentation time to zero. Linear interpolation assigned the

tephra layer an age of 11.9 ka. The interval between 73.5 and 96.5 cm shows a

sedimentation rate that is anomalously high for this record (see Chapters 3-5). To estimate

the age of the lowermost section of the core by extrapolation we used the same

sedimentation rate as for the 59.5 to 73.5 cm interval. This gave an age of 24.4 ka for the

end of the analyzed interval and an average sedimentation rate of ca. 4.7 cm kyr-1

(including the tephra layer) or ca. 4.2 cm kyr-1

(without the tephra).

32

2. Material and methods

Table 2.3. AMS 14C measurements and their calibrated ages for the cores used in the study.

Lab. no. Depth, cm 14

C Age ± Standard deviation Calibrated Age BP

Core PS1878-2

Poz-45376 0.5 775 ± 35 426

Poz-45377 12.5 3300 ± 40 3143

Core PS1878-3

Poz-45378 11.5 3295 ± 35 3139

Poz-45380 19.5 4525 ± 35 4746

Poz-54381 25.5 5580 ± 50 5961

Poz-54382 30.5 6760 ± 50 7295

Poz-45384 39.5 8410 ± 60 9028

Poz-45385 58.5 11100 ± 60 12613

Beta-367894 72.5 14050 ± 60 16800

KIA 47284 95.5 16620 ± 110 19266

Core PS1894-7

KIA 7088 0.5 3845 ± 40 3794

KIA 47258 5.5 5390 ± 35 5773

KIA 7089 9.5 5745 ± 40 6174

KIA 47259 16.5 8075 ± 45 8528

KIA 7090 21.5 8910 ± 55 9564

KIA 7091 35.5 14430 ± 70 17051

Core PS1906-1

KIA 7084 4.5 4360 ± 30 4482

KIA 7083 11.5 7965 ± 40 8420

KIA 7082 22.5 17040 ± 80 19731

KIA 7081 32.5 19130 ± 90 22334

Core PS1910-1

KIA 44390 0.5 2655 ± 30 2336

Poz-45386 4.5 4820 ± 35 5122

Poz-45387 11.5 6950 ± 50 7457

KIA 44393 17.5 11340 ± 50 12794

Poz-45388 30.5 16880 ± 100 19625

Core M17730-4

Beta-367895 12.5 2240 ± 30 1850

(Weinelt, 1993) 20.5 3330 ± 100 3200

(Weinelt, 1993) 40.1 5610 ± 70 5990

(Weinelt, 1993) 49.7 6800 ± 110 7320

(Weinelt, 1993) 68.5 8470 ± 90 9080

Beta-367896 78.5 8980 ± 40 9620

(Weinelt, 1993) 95.6 9520 ± 590 10400

Beta-367897 101.5 10490 ± 50 11690

(Weinelt, 1993) 106.3 11590 ± 100 13110

(Weinelt, 1993) 116.3 13030 ± 120 15000

Beta-367898 125.5 15590 ± 60 18540

33

2. Material and methods

The three box cores from the northern Greenland Sea (PS1894-7, PS1906-1 and

PS1910-1) have average sedimentation rates of 1.5–2.0 cm kyr−1

. These low rates,

together with bioturbation and uncertain reservoir ages, make age models for these

records unreliable if based only on 14

C datings. This is best illustrated by relatively old

ages yielded from the surface samples of these cores (2.3–3.8 ka). However, as the

surface sample of core PS1878 yielded a younger age (0.426 ka) and contained living

(rose bengal stained) benthic foraminifera, we assume that sedimentation in the entire

study area did not terminate in the late Holocene. To account for the apparent inaccuracy

of the 14

C-based age models we attempted to improve them by correlating the stable

isotope data (and, in a few cases, also other proxies) and using linear interpolation

between correlated points and reliable 14

C-dated samples. In addition to our own data, we

also used three nearby records of comparable sedimentation rates, time range and water

depths. These include cores PS2887 (Nørgaard-Pedersen et al., 2003) as well as PS1230

from the western Fram Strait and PS1243 from the SW Norwegian Sea (Bauch et al.,

2001). As the base for the correlation we used core PS1878, which has a relatively high

temporal resolution and a reliable chronological framework based on 14

C datings in the

younger part of the record. Due to poorer 14

C age control and more speculative reservoir

ages in the older part of the records, the improved age models for the northern Greenland

Sea records are restricted to the last 15 kyr.

The average sedimentation rate of core M17730-4 amounts to ca. 6.6 cm kyr−1

and

the record represents the time period between 19.6 and 1.9 ka. The dating at 95.6 cm

(Weinelt, 1993; original depth 100 cm) gave an anomalously large error (±590 14

C years

BP). The obtained calibrated age (10.4 ka) fits relatively well into our age model and thus

we did not leave out this dating. However, it should be kept in mind that the possible age

at this level varies from 9.6 to 11.1 ka (1 range).

34

2. Material and methods

2.4. Planktic foraminifera counts

Counts of planktic foraminiferal assemblages were conducted on representative

splits (>300 specimens). In the Arctic environment subpolar foraminiferal species (e.g.,

Turborotalita quinqueloba) reach smaller test sizes compared to warmer conditions

(Bauch, 1994; Kandiano and Bauch, 2002). To obtain representative results, in records

from the Arctic domain (all cores from the Greenland Sea) we used the 100–250 μm size

fraction, while in core M17730-4, located in the Atlantic domain, the >150 μm size

fraction was analyzed. Individual species were identified and counted. Samples

containing less than 100 specimens were excluded from the statistical analysis. The

number of planktic foraminifera per 1 g dry sediment was calculated to serve as a

semiquantitative proxy for bioproductivity.

2.5. Subsurface temperature reconstruction

Absolute summer subsurface temperatures (SSTs) at 100 m water depth were

calculated at site PS1878 between 15 and 0 ka using transfer functions based on a modern

training set from the Arctic (Husum and Hald, 2012) and the C2 software, version 1.7.2

(Juggins, 2011). A weighted average partial least-squares statistical model with three

components (WA-PLS C3) and leave-one-out (“jack knifing”) cross validation was used.

The root mean-squared error of prediction is 0.52°C. Unlike Husum and Hald (2012),

who used the >100µm size fraction, we ran the transfer function using the 100–250 µm

size fraction. Although the coarser sediments contained relatively few foraminifera, we

acknowledge that this might have slightly biased the results. Further, reconstructed SSTs

below 2°C are considered to be uncertain as the modern training set contains very few

data points below 2°C (Husum and Hald, 2012).

35

2. Material and methods

To retrieve SSTs from foraminiferal census data in core M17730-4 the SIMMAX

technique, a variation of the modern analogue technique (MAT) approach, was applied.

The relation between foraminiferal diversities and SSTs was established by using the

North Atlantic part of the surface sediment samples foraminiferal database (Pflaumann et

al., 2003) linked to oceanographic atlas SST data of 100 m water depth layer (Levitus and

Boyer, 1994). The used winter and summer temperatures represent average values for

February to April and August to October, respectively.

2.6. Ice-rafted debris and volcanic glass shards

Mineral grains >250 μm (in Greenland Sea cores) or >150 μm (M17730-4) were

identified and counted to provide information on ice-rafting and tephra layers. As ice-

rafted debris (IRD) we interpret all lithic grains >250/150 μm, except for unweathered

volcanic glass. Such coarse particles are transported into an ice-covered deep ocean basin

preferentially by icebergs while sea ice mainly transports finer material (Nürnberg et al.,

1994). To provide clues on the origin of IRD, in cores PS1878 and M17730-4 several

types were identified, the most common of them being crystalline and clastic rock

fragments. Organic-rich clastic IRD grains are common in glacial sediments from the

eastern Nordic Seas (e.g., Bischof, 1994; Bischof et al., 1997) and are interpreted as

originating from the wide and shallow western Eurasian shelves (Wagner and Henrich,

1994). The unweathered volcanic glass shards were used to identify tephra layers. The

geochemistry of the tephra layer found in core PS1878 was analyzed by Ewa M. Lind

(University of Stockholm).

36

2. Material and methods

2.7. Stable oxygen and carbon isotopes

For the analysis of stable oxygen and carbon isotopes, specimens of the planktic

foraminiferal species N. pachyderma (sin.) (all cores) and two benthic species – the

epibenthic Cibicidoides wuellerstorfi and the shallow infaunal Oridorsalis umbonatus

(cores PS1878, PS1894, PS1910 and M17730-4) – were used. Because of departures from

isotopic calcite equilibrium, the measured δ18

O values of the two latter species were

corrected by +0.64 and +0.36‰, respectively (cf. Duplessy et al., 1988). Approximately

twenty-five specimens were picked from the 125–250µm (N. pachyderma (sin.) and O.

umbonatus) and 250–500µm (C. wuellerstorfi) size fractions. All stable isotope analyses

were carried out in the isotope laboratories of the GEOMAR Helmholtz Centre for Ocean

Research Kiel and the Leibniz Laboratory, University of Kiel, on Finnigan MAT 251 and

Thermo MAT 253 mass spectrometer systems and a Kiel IV Carbonate Preparation

Device. Results are expressed in the δ notation referring to the PDB (Pee Dee Belemnite)

standard and are given as δ18

O and δ13

C with an analytical accuracy of <0.06 and

<0.03‰, respectively.

References

Bauch, H.A., 1994. Significance of variability in Turborotalita quinqueloba (Natland)

test size and abundance for paleoceanographic interpretations in the Norwegian-

Greenland Sea. Mar. Geol. 121, 129–141.

Bauch, H.A., Erlenkeuser, H., Spielhagen, R.F., Struck, U., Matthiessen, J., Thiede, J.,

Heinemeier, J., 2001. A multiproxy reconstruction of the evolution of deep and

surface waters in the subarctic Nordic seas over the last 30,000 yr. Quat. Sci. Rev.

20, 659–678.

Bauch, H.A., Weinelt, M.S., 1997. Surface water changes in the Norwegian Sea during

last deglacial and Holocene times. Quat. Sci. Rev. 16, 1115–1124.

37

2. Material and methods

Bischof, J.F., 1994. The decay of the Barents ice sheet as documented in nordic seas ice-

rafted debris. Mar. Geol. 117, 35–55.

Bischof, J.F., Lund, J.J., Ecke, H.-H., 1997. Palynomorphs of ice rafted clastic

sedimentary rocks in Late Quaternary glacial marine sediments of the Norwegian

Sea as provenance indicators. Palaeogeogr. Palaeoclimatol. Palaeoecol. 129, 329–

360.

Duplessy, J.C., Labeyrie, L.D., Blanc, P.L., 1988. Norwegian Sea Deep Water Variations

over the Last Climatic Cycle: Paleo-Oceanographical Implications, in: Wanner, H.,

Siegenthaler, U. (Eds.), Long and Short Term Variability of Climate. Springer, New

York, pp. 83–116.

Husum, K., Hald, M., 2012. Arctic planktic foraminiferal assemblages: Implications for

subsurface temperature reconstructions. Mar. Micropaleontol. 96-97, 38–47.

Juggins, S., 2011. C2, Software for Ecological and Palaeoecological Data Analysis and

Visualization.

Kandiano, E.S., Bauch, H.A., 2002. Implications of planktic foraminiferal size fractions

for the glacial-interglacial paleoceanography of the polar North Atlantic. J.

Foraminifer. Res. 32, 245–251.

Levitus, S., Boyer, T.P., 1994. World Ocean Atlas 1994, vol. 4, Temperature, NOAA

Atlas, U.S. Department of Commerce, Washington, D.C.

Nørgaard-Pedersen, N., Spielhagen, R.F., Erlenkeuser, H., Grootes, P.M., Heinemeier, J.,

Knies, J., 2003. Arctic Ocean during the Last Glacial Maximum: Atlantic and polar

domains of surface water mass distribution and ice cover. Paleoceanography 18, 1–

19.

Nowaczyk, N.R., Antonow, M., 1997. High-resolution magnetostratigraphy of four

sediment cores from the Greenland Sea-I. Identification of the Mono Lake

excursion, Laschamp and Biwa I/Jamaica geomagnetic polarity events. Geophys. J.

Int. 131, 310–324.

Nürnberg, D., Wollenburg, I., Dethleff, D., Eicken, H., Kassens, H., Letzig, T., Reimnitz,

E., Thiede, J., 1994. Sediments in Arctic sea ice: Implications for entrainment,

transport and release. Mar. Geol. 119, 185–214.

Pflaumann, U., Sarnthein, M., Chapman, M.R., D’Abreu, L., Funnel, B., Huels, M.,

Kiefer, T., Maslin, M.A., Schulz, H., Swallow, J., van Kreveld, S., Vautravers, M.,

Vogelsang, E., Weinelt, M.S., 2003. Glacial North Atlantic: Sea-surface conditions

reconstructed by GLAMAP 2000. Paleoceanography 18, 1065.

Reimer, P.J., Baillie, M.G.L., Bard, E., Bayliss, A., 2009. IntCal09 and Marine09

radiocarbon age calibration curves, 0–50,000 years cal BP. Radiocarbon 51, 1111–

1150.

38

2. Material and methods

Stuiver, M., Reimer, P.J., 1993. Radiocarbon calibration program. Radiocarbon 35, 215–

230.

Thiede, J., Hempel, G., 1991. Die Expedition ARKTIS-VII/1 mit FS “Polarstern” 1990.

Berichte zur Polarforsch. 80, 137pp.

Wagner, T., Henrich, R., 1994. Organo-and lithofacies of glacial-interglacial deposits in

the Norwegian-Greenland Sea: Responses to paleoceanographic and paleoclimatic

changes. Mar. Geol. 120, 335–364.

Weinelt, M.S., 1993. Veränderungen der Oberflächenzirkulation im Europäischen

Nordmeer während der letzten 60.000 Jahre. Berichte aus dem

Sonderforschungsbereich 313 41, 105.

3. A high-resolution Lateglacial and Holocene

palaeoceanographic record from the Greenland Sea

From [Telesiński, M.M., Spielhagen, R.F., Lind, E.M., 2014. A high-resolution

Lateglacial and Holocene palaeoceanographic record from the Greenland Sea. Boreas 43,

273–285.]. Reprinted with permission from John Wiley & Sons, Inc.

Data available online at http://doi.pangaea.de/10.1594/PANGAEA.832384

A high-resolution Lateglacial and Holocene palaeoceanographic recordfrom the Greenland Sea

MACIEJ M. TELESINSKI, ROBERT F. SPIELHAGEN AND EWA M. LIND

Telesinski, M. M., Spielhagen, R. F. & Lind, E. M. 2014 (April): A high-resolution Lateglacial and Holocenepalaeoceanographic record from the Greenland Sea. Boreas, Vol. 43, pp. 273–285. 10.1111/bor.12045. ISSN0300-9483.

We present an unprecedented multicentennial sediment record from the foot of Vesterisbanken Seamount, centralGreenland Sea, covering the past 22.3 thousand years (ka). Based on planktic foraminiferal total abundances,species assemblages, and stable oxygen and carbon isotopes, the palaeoenvironments in this region of moderndeepwater renewal were reconstructed. Results show that during the Last Glacial Maximum the area was affectedby harsh polar conditions with only episodic improvements during warm summer seasons. Since 18 ka extremefreshwater discharges from nearby sources occurred, influencing the surface water environment. The last majorfreshwater event took place during the Younger Dryas. The onset of the Holocene was characterized by animprovement of environmental conditions suggesting warming and increasing ventilation of the upper waterlayers. The early Holocene saw a stronger Atlantic waters advection to the area, which began around 10.5 andended quite rapidly at 5.5 ka, followed by the onset of Neoglacial cooling. Surface water ventilation reached amaximum in the middle Holocene. Around 3 ka the surface water stratification increased leading to subsequentamplification of the warming induced the North Atlantic Oscillation at 2 ka.

Maciej M. Telesinski ([email protected]), GEOMAR Helmholtz Centre for Ocean Research Kiel,Wischhofstrasse 1-3, 24148 Kiel, Germany; Robert F. Spielhagen, GEOMAR Helmholtz Centre for Ocean ResearchKiel, Wischhofstrasse 1-3, 24148 Kiel, Germany and Academy of Sciences, Humanities, and Literature, 53151Mainz, Germany; Ewa M. Lind, Department of Physical Geography and Quaternary Geology, Stockholm Univer-sity, SE 106 91 Stockholm, Sweden; received 27th May 2013, accepted 1st September 2013.

The Greenland Sea is an important region for the Atlan-tic Meridional Overturning Circulation (AMOC), andthus the global ocean circulation, as deep water convec-tion takes place here (e.g. Marshall & Schott 1999),leading to the formation of North Atlantic Deep Water(NADW). It also plays an important role as the maingateway for the surface- and deep-water exchangebetween the Arctic and North Atlantic oceans (e.g.Hansen & Østerhus 2000). Despite its importance, littleis known so far about the palaeoceanographic evolutionin this area since the Last Glacial Maximum (LGM). Indeep, cold, often ice-covered environments sedimenta-tion rates are generally low (e.g. Nørgaard-Pedersenet al. 2003). Therefore high-resolution, undisturbedsediment records from the Greenland Sea are lacking, incontrast to the eastern Nordic Seas (e.g. Sarnthein et al.2003; Hald et al. 2007; Risebrobakken et al. 2011;Werner et al. 2013). The only published record ofsubmillennial-scale resolution from the central, deepGreenland Sea stems from core HM94-34 (Fronval &Jansen 1997; Fig. 1), which holds ∼40 cm of Holocenesediments. However, the surface sample from this sitewas dated to ∼3000 14C years before present, which indi-cates strong sediment mixing by bioturbation.

Here we present a palaeoceanographic record ofunprecedented high resolution from the southern footof Vesterisbanken seamount in the central GreenlandSea, covering the past 22 300 years (22.3 ka). Recordsof planktic foraminifer associations and stable isotopesallow reconstruction of the Lateglacial and Holocene

palaeoceanography of the central Greenland Sea on amulticentennial time scale.

Study area

The oceanographic regime of the Nordic Seas is gov-erned by two major surface-water masses (Fig. 1).Relatively warm, saline (T∼6–11°C, S>35 psu) AtlanticWater (AW) is advected to the area by the North Atlan-tic Current (NAC) and eventually reaches the ArcticOcean through the eastern Fram Strait and across theBarents Sea. Cold, low saline (T<0°C, S<34.4 psu)Polar Water (PW) flows southward as the East Green-land Current (EGC) along the Greenland shelf margin.Both NAC and EGC show a relatively small seasonalvariability (Foldvik et al. 1988; Hansen & Østerhus2000; Sutherland & Pickart 2008) but significantdecadal variations (Hansen & Østerhus 2000; Eldeviket al. 2009). The central part of the Nordic Seas is thedomain of Arctic Water, a result of PW and AWmixing (Swift 1986). It is an area of deep-water forma-tion, as AW cools down when it mixes with PW andsubsequently sinks to the bottom (Hansen & Østerhus2000). Arctic Water is separated from PW by the PolarFront and from AW by the Arctic Front.

Today, the site PS1878 investigated in this study islocated within the Arctic Water domain, which is mostsensitive to changes in the relative influence of PW andAW. The temperature and salinity of the surface water

bs_bs_banner

DOI 10.1111/bor.12045 © 2013 The Boreas Collegium

can change significantly within a short distance and isclosely related to the lack or presence of sea ice. In theice-covered areas the temperature amounts to ∼0°C atthe surface, increases to ∼2°C at 50–100 m water depthand decreases to −1–0°C in the deeper parts. The salinityincreases with depth from 32–34 at the surface to ∼35 psubelow 50–100 m. Further to the east, in the ice free areas,the temperature reaches 2–3°C and decreases to ∼−1°Cbelow 50 m, while the salinity increases from ∼34 psu atthe surface to ∼35 psu below 50 m (Thiede & Hempel1991).

The core was retrieved from the southern, lower footof Vesterisbanken seamount in the central GreenlandSea. The location on the lee side of this volcano, whichrises from the abyssal plain to a water depth of only133 m (Nowaczyk & Antonow 1997), may provide rela-tively high sedimentation rates, possibly because veloci-ties of southward-directed ocean current decreasebehind the obstacle, allowing the settling of fine-grained material. The site is, however, apparentlylocated far enough from the steep seamount slope tobe protected from downslope mass flows.

Material and methods

Sediment core PS1878 (73°15′N, 9°01′W, water depth3048 m) was retrieved during the ARK-VII/1 expedi-

tion of RV Polarstern in 1990. It is compiled from giantbox core PS1878-2 and a kasten core PS1878-3. Thematerial consisted of brown to olive grey sediments ofsilty clay to silty sand. A 11-cm-thick dark tephra layerwas found at 47–58 cm core depth. Sediment sampleswere taken continuously as 1-cm-thick slabs from theuppermost 114 cm of PS1878. Samples were freeze-dried, weighed, wet-sieved with deionized waterthrough a 63 μm mesh, and subsequently split into sizefractions using 100, 125, 250, 500 and 1000 μm sieves.

Counts of planktic foraminiferal assemblages wereconducted on representative splits (>300 specimens) ofthe 100–250 μm size fraction. Samples containing lessthan 100 specimens were excluded from the statisticalanalysis. Individual species were identified andcounted. The number of planktic foraminifera per 1 gdry sediment was calculated.

Unweathered volcanic glass and other rock frag-ments >250 μm were distinguished and counted, pro-viding information on the intensity of ice-rafting andallowing the identification of the tephra layer. As IRDwe interpret all lithic grains >250 μm (except forunweathered volcanic glass). Such coarse particles willbe transported into a deep ocean basin preferentially byicebergs while sea ice mainly transports finer material(Nürnberg et al. 1994).

Stable oxygen and carbon isotope analyses wereconducted on planktic species Neogloboquadrinapachyderma (sin.). Twenty-five specimens were pickedfrom the 125–250 μm size fraction. All stable isotopeanalyses were carried out in the stable isotope labora-tory of GEOMAR. Results are expressed in the δnotation referring to the PDB standard and are givenas δ18O and δ13C. Analysis for tephra geochemistrywas performed on the 100–250 μm size fraction at49–50 cm core depth. Fresh-looking shards weremounted in epoxy and the preparation of slides formicroprobe analysis followed Dugmore et al. (1995).Dataset outliers with abnormal geochemical composi-tion that could reflect microlites or impurities in theglass were removed and totals below 95% wereomitted. Analysed tephra was compared with pub-lished tephra horizons from Iceland and Jan Mayenon the basis of a TAS plot (total alkali vs. silica),K2O, CaO, MgO and SiO2. All plots of geochemicaldata were normalized to 100%.

Chronology

Age control of PS1878 is based on nine AMS 14C datesmeasured on N. pachyderma (sin.) (Table 1). All radio-carbon ages were corrected for a reservoir age of 400years, calibrated using Calib Rev 6.1.0 software(Stuiver & Reimer 1993) and the Marine09 calibrationcurve (Reimer et al. 2009), and are given in thousandcalendar years before ad 1950 (ka).

EG

C

NA

CN

AC

WS

C

SVALBARD

SC

AN

DIN

AV

IA

AR

CT

IC F

R

ONT

PO

LA

R F

RO

NT

PS1878PS1878HM94-34HM94-34

GREENLAND

ICELAND

Fig. 1. Present day surface water circulation in the Nordic Seas.Cores PS1878 (this study) and HM94-34 (Fronval & Jansen 1997) aremarked with yellow dots. Red arrows indicate Atlantic Water (AW),blue arrows – Polar Water (PW), white broken lines – oceanographicfronts. White arrow – present-day deep convection (Marshall &Schott 1999). EGC = East Greenland Current; NAC = North Atlan-tic Current; WSC = West Spitsbergen Current. Bathymetry from TheInternational Bathymetric Chart of the Arctic Ocean (http://www.ibcao.org, 2012).

274 Maciej M. Telesinski et al. BOREAS

The age–depth relation of PS1878 is shown in Fig. 2.The average sedimentation rate amounts to∼5.1 cm ka−1. Assuming that the tephra layer found at47–58 cm in the core (volcanic glass shards making up>75% of a sample) reflects a short-term event, we setits sedimentation time to zero. Linear interpolationassigned the tephra layer an age of 11.9 ka. The obtainedcalibrated AMS 14C dates, together with the proxyrecords, were used to compile a composite record(PS1878) from the giant box core and the kasten core atthe depth of 12.5 cm below the sea floor. As the calcu-lated sedimentation rate was relatively stable through-out the record (except for the tephra interval) weextrapolated the age beyond the oldest dated sample(19.3 ka at 96.5 cm) using the sedimentation rate of theabove interval (59.5–96.5 cm; ∼5.6 cm ka−1) and

extended the age model back to 22.3 ka at 113.5 cm.However, as discussed below, it is possible that there wasa short interval of increased sedimentation rate in thedeglacial part of our record (∼18 ka). If this was indeedthe case, then the ‘normal’ sedimentation rate in theremaining part of the >12.6 ka interval would have beenlower and the extrapolation would give an older age ofthe bottom of the record. Due to these uncertainties weconsider the older part of the age model (>12.6 ka) asuncertain and interpret it with caution. Nevertheless, thebottom of the record is certainly older than 19.3 ka.

The surface sample yielded a comparatively youngage (0.426 ka) and contained living (rose bengalstained) benthic foraminifera. Therefore we assumethat the record represents the time period between22.3 ka and the retrieval year ad 1990.

Results

Planktic foraminifera and ice-rafted debris

The record starts in the Last Glacial Maximum (LGM)with low foraminiferal abundances. The fauna isstrongly dominated by N. pachyderma (sin.) (Fig. 3), apolar species dwelling at water depths of ∼50–200 m(Carstens et al. 1997). However, there are a numberof prominent, short-lived peaks of relatively highforaminiferal abundance. The IRD content is relativelyhigh and seems to be positively correlated with theforaminiferal abundance. The peaks in both proxiescoincide clearly (59.5, 73.5, 89.5, 96.5, 99.5, 105.5 and111.5 cm below the sea floor).

The Holocene part of the record (after 12 ka) con-tains generally little IRD. The foraminiferal abundanceis significantly higher than in the earlier part. It reachesa maximum around 9 ka and remains high until 5.5 ka.Subsequently it decreases quite rapidly, but remainshigher than in the pre-Holocene part of the record.Finally, the abundance increases again after 2 ka.Superimposed on these longer-term changes, a quasi-millennial scale variability of a comparable magnitudeis observed.

Table 1. AMS 14C measurements and calibrated ages of core PS1878.

Laboratory number Depth (cm) Species dated 14C age±error Calibrated age (ka)

Core PS1878-2Poz-45376 0.5 N. pachyderma (sin.) 775±35 426Poz-45377 12.5 N. pachyderma (sin.) 3300±40 3143Core PS1878-3Poz-45378 11.5 N. pachyderma (sin.) 3295±35 3139Poz-45380 19.5 N. pachyderma (sin.) 4525±35 4746Poz-54381 25.5 N. pachyderma (sin.) 5580±50 5961Poz-54382 30.5 N. pachyderma (sin.) 6760±50 7295Poz-45384 39.5 N. pachyderma (sin.) 8410±60 9028Poz-45385 58.5 N. pachyderma (sin.) 11 100±60 12 613KIA 47284 95.5 N. pachyderma (sin.) 16 620±110 19 266

TEPHRA

0 5 10 15 20 25

Dep

th (

cm

)

0

20

40

60

80

100

Gia

nt b

ox c

ore

Kas

ten

cor e

PS

1878

-3

0.4 ka (BC)

PS

1878

-2

3.1 ka (BC & KC)

4.7 ka (KC)

6.0 ka (KC)

7.3 ka (KC)9.0 ka (KC)

12.6 ka (KC)

19.3 ka (KC)

tie

0 5 10

?

Calibrated age (ka)

Sedimentation rate (cm ka-1)

Fig. 2. PS1878 age–depth plot.

Lateglacial and Holocene palaeoceanography, the Greenland Sea 275BOREAS

The changes in species composition show similaritiesto the abundance record. The percentage of subpolarspecies (mainly N. pachyderma (dex) and Turborotalitaquinqueloba) increases gradually to reach its maximum(30–40%) between 10.5 and 5.5 ka. Afterwards, the per-centage of N. pachyderma (sin.) increases again andreturns to the pre-Holocene values of >80–90%.Another significant and relatively rapid increase in sub-polar fauna occurs after 2.5 ka (up to >30%).

We did not find any significant signs of dissolutionin the studied foraminifera. Both tests of robustN. pachyderma and more fragile subpolar species arewell preserved throughout the cores.

Stable isotopes

The planktic oxygen isotope record reveals relativelyheavy and stable values of 4.3–4.9‰ in its older part(Fig. 3). After ∼18 ka sharp peaks of very light values(minimum 0.15‰) occur and a trend towards lowerδ18O values commences that lasts until the end of therecord. A distinct, though irregular, variability within

the trend can be observed. The most prominent lightisotope excursion within this trend occurs at 12.8–11.9 ka and reaches 3.4‰.

The glacial part of the planktic carbon isotope record(>18 ka) exhibits low and stable values around 0.0–0.3‰ (Fig. 3). Simultaneous with the light δ18O peaksthe δ13C values decrease slightly and a trend of increas-ing values commences thereafter. Around 7 ka the δ13Cvalues reach a high plateau of 0.8–1.0‰, which lastsuntil 3 ka and ends with a relatively sudden drop. After1.5 ka the values decrease again and become more vari-able.

Geochemical analysis of the tephra

Analysed shards have a basanitic to tephritic com-position according to the TAS plot (Le Bas et al.1986; Fig. 4A). The analysed tephra can be distin-guished from both the Icelandic tephras and the JanMayen tephra on the basis of its higher K2O (1–6wt%) and decreasing trend of MgO (7–2 wt%)(Fig. 4B, C).

0

10

20

30

40

50

60

70

80

90

100

110

0 10 0005000

0200

IRD g-1

TEPHRA

0 10050 5.0 4.0 3 2 1 0

d18O (‰)

-0.5 1.00.50.0

d13C (‰)

Plank. forams g-1 Species %D

ep

th (

cm

)

T. quinqueloba

N. pachyderma (dex.)

N. pachyderma (sin.)

Gia

nt b

ox c

ore

Kas

ten

core

PS

1878

-3

PS

1878

-2 tie

Fig. 3. PS1878 proxy records versus depth: total abundance of planktic foraminifera, total abundance of IRD, relative abundance of threedominant planktic foraminiferal species, stable carbon and oxygen isotope ratios of planktic foraminifer N. pachyderma (sin). Black trianglesmark the AMS 14C dates. Grey bar indicates the tephra layer. This figure is available in colour at http://www.boreas.dk.

276 Maciej M. Telesinski et al. BOREAS

Discussion

Last Glacial Maximum

Our central Greenland Sea planktic δ18O record showsLGM values (Fig. 5) that are typical for this intervalin the Nordic Seas. They indicate the presence of rela-tively high-salinity waters and can be interpreted asAW advected to the north (Sarnthein et al. 1995;Nørgaard-Pedersen et al. 2003). The low foraminiferalabundance and species diversity indicates a low bio-logical productivity in the LGM. Following Duplessyet al. (1988) we interpret the low planktic δ13C valuesas suggesting a poorly ventilated water mass as the

habitat for the foraminifers. From these lines of evi-dence we propose that the study area was largelycovered with sea ice, which strongly inhibited the pen-etration of sunlight, reduced the productivity of phy-toplankton that the foraminifera feed on, and limitedthe air–sea gas exchange. As even today the sea iceedge is located close to site PS1878, we consider itunlikely that conditions were significantly morefavourable in the LGM.

The amount of coarse ice-rafted debris in sedimentsfrom the LGM is relatively high (Fig. 5), suggestingthe presence of numerous icebergs originating fromthe circum-Arctic ice sheets. However, the record ishighly variable suggesting repeated occurrences of

Fig. 4. Major element plots of different Nordic Seas tephras: Vesterisbanken tephra from PS1878 at 49–50 cm (this study), Vesterisbankentephra from PS1878-3 at 116 cm (Haase et al. 1996), Saksunarvatn Ash (Davies et al. 2012), the basaltic component of the Vedde Ash (Davieset al. 2001) and Jan Mayen tephra (Abbott et al. 2012). All major data are plotted as normalized values. A. Total alkali–silica plot (after LeBas et al. 1986). B and C. Selected bi-plots. This figure is available in colour at http://www.boreas.dk.

Lateglacial and Holocene palaeoceanography, the Greenland Sea 277BOREAS

late

Ho

loc

en

e

wa

rm i

nte

rva

l

early Holocene

warm interval

Yo

un

ge

r D

rya

s

fre

sh

wa

ter

ev

en

t

Te

ph

ra

‘8.2

ka e

ven

t’

Neoglacial

-41

-37

-33

GIS

P2

d1

8O

(‰

)

0

5k

10kP

lan

k.

fora

m.

g-1

0

250

IRD

g-1

0.0

1.0

-0.5

d13C

(‰

)

1.5

0

50

100

Sp

ecie

s %

T. quinqueloba N. pachyderma (dex)

N. pachyderma (sin)

3.0

4.0

5.0

0.0

d18O

(‰

)

Age (ka)

0 205 10 15

HOLOCENE YD DEGLACIATION LGM

Fig. 5. PS1878 palaeoceanographic record: total abundance of planktic foraminifera, total abundance of IRD, relative abundance of threedominant planktic foraminiferal species, stable oxygen and carbon isotope ratios of planktic foraminifer N. pachyderma (sin). Also plotted isthe oxygen isotope record from the GISP2 ice-core (Grootes et al. 1993).

278 Maciej M. Telesinski et al. BOREAS

numerous icebergs rather than their constant presence.The IRD peaks coincide with foraminiferal abundancepeaks. The clear correlation of these two proxiessuggests that the water remained somewhat open, atleast during the warmer summer seasons. Anydecrease in sea ice cover could have improved theliving conditions, leading to a significant increase inplanktic productivity. Such open water conditions andpossibly even slightly warmer surface waters may haveenhanced mobility and melting of icebergs and IRDdeposition. These intervals with higher productivityand IRD delivery may have been rather rare in theGreenland Sea during the LGM, but they are dis-tinctly recorded in the sediment, although timewisedisproportionately overrepresented due to temporarilyhigher sedimentation rates. It is not clear, however,why no clear δ13C response corresponding to openwater intervals can be observed.

Deglaciation

The PS1878 deglacial record starts with a massive lowδ18O peak (Fig. 5). Similar but less prominent featurescan be found in cores PS1230 (Bauch et al. 2001) andPS2887 (Nørgaard-Pedersen et al. 2003) from thewestern Fram Strait as well as in the eastern NordicSeas (e.g. Dokken & Jansen 1999). We interpret themas a result of the discharge of isotopically light meltwa-ter that lowered the regional surface water salinity(Sarnthein et al. 1995). This conclusion is supported bythe simultaneous decrease of planktic δ13C values,which are indicative of weakly ventilated subsurfacewaters. A low-density freshwater-rich surface layerincreases the stratification of the upper water layers,thereby decreasing the gas exchange between subsur-face waters and the atmosphere (Duplessy et al. 1988;Stein et al. 1994a, b; Spielhagen et al. 2004). Togetherwith the low isotope values, a decrease in the IRDcontent is observed, pointing at a reduction in the sedi-ment delivery by icebergs. This may suggest that themeltwater originated from terrestrial sources (meltingice sheets or possible outbursts from ice-dammed lakesin glaciated areas around the Arctic Ocean) rather thanfrom locally melting icebergs.

Although the AMS 14C dates suggest a differenttiming (between 20 and 18 ka) for the freshwater out-bursts in the western Fram Strait and in the GreenlandSea we argue that the apparent difference may be aresult of variable, unknown reservoir ages (possibly upto 2000 years, cf. Waelbroeck et al. 2001), as well as lowsedimentation rates in some of the cores. We suggestthat the first significant freshwater outbursts in theNordic Seas took place roughly simultaneously around18 ka. The trigger mechanism remains elusive but maybe related to an early sea-level rise (Clark & Mix 2002)and possibly a collapse of marine-based ice sheets(Álvarez-Solas et al. 2011).

Sarnthein et al. (1995) presented a compilation ofδ18O values from sediment records from the NorthAtlantic and the Nordic Sea. The deglacial time-slice(14.2–13.2 14C ka) shows two meltwater tongues withδ18O values <3‰ – one stretching from the DanishStrait towards Jan Mayen and the other from theBarents Sea margin towards the central NorwegianSea. Sarnthein et al. (1995) did not present anydatapoints from the Greenland Sea, around sitePS1878. Nevertheless, it is clear that in any other recordthe δ18O values were as low as in PS1878. This indicatesthat the meltwater outburst probably originated in theproximity of this site and most likely came from theGreenland Ice Sheet. However, the Fram Strait, alsopoorly represented in the compilation of Sarntheinet al. (1995), was also strongly affected by fresh water(Bauch et al. 2001; Nørgaard-Pedersen et al. 2003) andit seems unlikely that it propagated northward (i.e.upstream the EGC), from site PS1878 towards sitesPS2887 and PS1230. Therefore at least one more out-burst that reached the Fram Strait must have occurredin the circum-Arctic region. Nevertheless, they bothcould have a common trigger mechanism.

The age of the freshwater event in PS1878 (18–15 ka)fits well with Heinrich stadial 1 (HS1). Our plankticcarbon isotope record shows extremely low valuesduring this interval (Fig. 5), indicating a ventilation ofthe (sub)surface water even weaker than during theLGM (cf. Sarnthein et al. 1995; Spielhagen et al. 2004).Considering the role of the Greenland Sea in moderndeepwater renewal, this might support the suggestionsof Stanford et al. (2011) that the AMOC graduallydecreased and virtually collapsed during HS1.

The lack of IRD and the extremely low foraminiferalconcentrations (Fig. 5) in sediments deposited duringthe freshwater outburst might suggest that it was arelatively short event, however, it is represented by sedi-ments of significant thickness (>15 cm, Fig. 3). Wespeculate that their deposition could have resulted froma sediment plume (Lekens et al. 2005) and reflects onlya relatively short period of high sedimentation rates,overrepresented in our age model. Biological produc-tivity might have been further reduced by surface-watersalinity below the level tolerated by planktic foraminif-era and an extensive sea ice cover, which may haveresulted from the low surficial salinity and could havefurther limited sunlight penetration and gas exchange.Such an interpretation would imply that the sedimen-tation rate before 12.6 ka (except for the sedimentplume interval) was in fact lower than that yielded fromthe linear interpolation between 12.6 and 19.3 ka.Álvarez-Solas et al. (2011) suggest that it was themelting of the Fennoscandian ice sheet that triggeredHS1 by weakning the deep convection and causing thecollapse of the Laurentide ice sheet. Taking intoaccount the relatively early age of our meltwater event(18 ka) and the lack of IRD we argue that if the inter-

Lateglacial and Holocene palaeoceanography, the Greenland Sea 279BOREAS

pretation of the sediment plume in PS1878 is correct,then the Greenland ice sheet might have also played aninitiating role in weakening of the deep convection (asthe freshwater outburst occurred close to the Green-land Sea convection centre) and could have contributedto the onset of HS1.

Following the freshwater events, planktic δ18Oreturned to values around 4‰ (Fig. 5), indicating thatthe freshwater influence had decreased by this time.Also the increasing δ13C values suggest that the venti-lation of (subsurface) water was reactivated. Althoughsome minor negative excursions in the planktic δ18Orecord after the main freshwater event suggest thatmeltwater discharges still occurred in the centralGreenland Sea, their amplitude decreases, indicatingthat the development of a more stable oceanographicsystem commenced. We associate this interval with theBølling–Allerød (B/A) period. At its onset, the freshwater was purged out of the Nordic Seas and theAMOC was rapidly re-established (McManus et al.2004; Stanford et al. 2011). In our record, the HS1–B/Atransition seems to be relatively gradual. This might bethe result of the stronger EGC influence on site PS1878compared with the areas further to the south.

Younger Dryas

The Younger Dryas (YD), spanning ∼12.8–11.7 ka(Rasmussen et al. 2006), was a cold period within theoverall climate warming in the transition from theLGM to the Holocene. This millennial-scale eventinvolved a significant reduction in the AMOC attrib-uted to enhanced meltwater inputs into the NorthAtlantic (e.g. Broecker et al. 2010; Not & Hillaire-Marcel 2012). It is still unclear whether the freshwaterimpulse reached the Nordic Seas as a sediment-loadedplume from the Hudson Strait (Rashid et al. 2011), as ameltwater discharge through the St Lawrence riversystem and via the Gulf Stream (e.g. Broecker et al.1989) or through the Mackenzie River basin and via theArctic Ocean (e.g. Tarasov & Peltier 2006; Not &Hillaire-Marcel 2012). Despite lacking terrestrial evi-dence (Fisher & Lowell 2012), the latter concept hasgained increasing support recently through modellingresults of Condron & Winsor (2012). They showed thatonly a meltwater discharge from the Arctic, in contrastto the outflow through the St Lawrence Valley, wasable to reach the deep-water-formation regions ofthe subpolar North Atlantic and weaken the AMOCsignificantly.

In our planktic oxygen isotope record we observe astrong negative excursion at 12.8–11.9 ka that we asso-ciate with the YD (Fig. 5). This age fits well with thetiming of this cold event in Greenland ice cores(Rasmussen et al. 2006) as well as in high-resolutionterrestrial and marine records (e.g. Bakke et al. 2009;Cabedo-Sanz et al. 2012) and may suggest that the res-

ervoir age (400 years) applied for dating of PS1878 islargely correct for this time interval. This value, sug-gested also for the central Nordic Seas (Bauch et al.2001), is significantly lower than the estimates of1000 years for the Norwegian Sea (Björck et al. 2003)and 700–800 (Bard et al. 1994) or ∼1000–1500 years(Waelbroeck et al. 2001) for the North Atlantic. Theproposed low reservoir age, together with rather highplanktic δ13C, indicates relatively strong subsurfacewater ventilation. The explanation could be a thickerbut weaker halocline. The strong halocline in themodern Arctic Ocean is maintained by a large contri-bution of fresh river water (Prange & Gerdes 1999).During cold periods such as the YD, however, thissource was significantly limited (Rasmussen &Thomsen 2004) and fresh water originated only frommore local and episodic sources (e.g. freshwater out-bursts). Because of the weaker halocline the stratifica-tion was probably considerably weaker than at present.This could have increased the subsurface water venti-lation and resulted in higher planktic δ13C values. Thestrong negative planktic δ18O excursion in PS1878during the YD together with a similar decrease in thewestern Fram Strait (Bauch et al. 2001) suggests anArctic source of the freshwater discharge that could beconsidered as a trigger for the YD (an ‘Arctic’ trigger inthe sense of Condron & Winsor 2012).

Holocene

The onset of the Holocene is marked in our record by athick (11 cm), dark tephra layer (Figs 2, 3). The interpo-lated age of the layer (11.9 ka) is close to the age of theVedde Ash (12 171±114 GICC05 a b2k in the NGRIPice core; Rasmussen et al. 2006), one of the most widelyspread Icelandic isochrones for the Lateglacial–earlyHolocene in the North Atlantic region (Mortensen et al.2005; Lane et al. 2012). It is also close in time to theSaksunarvatn Ash in the NGRIP ice core (10 347±89 GICC05 a b2k; Rasmussen et al. 2006), anotherwidespread Icelandic tephra (Lind & Wastegård 2011;Davies et al. 2012). However, the concentrations of thefresh-looking volcanic shards with sharp edges inPS1878 (up to 99% of non-biogenic grains >250 μm) andthe thickness of the layer suggest a nearby and primarysource. The geochemical analysis of the tephra confirmsthis presumption (Fig. 4). The higher K2O and lowerCaO concentrations of the PS1878 tephra distinguish itfrom the tephra originating from Jan Mayen (Hunt2004; Abbott et al. 2012). The Icelandic tephras, includ-ing Vedde Ash and Saksunarvatn Ash (Mangerud et al.1984, 1986; Davies et al. 2001), can be clearly distin-guished from the PS1878 tephra based on the TAS-plotbut also by the lower CaO concentrations. On the otherhand, our tephra shows a strong correlation to an olderVesterisbanken tephra found in core PS1878-3 at116 cm (Haase et al. 1996). Therefore we suggest that

280 Maciej M. Telesinski et al. BOREAS

the PS1878 tephra is a local tephra originating from theVesterisbanken volcano whose eruptions were frequentduring the past 60 ka (Haase et al. 1996).

In general, the Holocene part of our record is char-acterized by higher abundances of planktic foraminif-era and higher percentages of the subpolar fauna(Fig. 5). These proxies indicate higher bioproductivityand higher water temperatures. Together with the lowIRD content, they also suggest limited ice-rafting andsea ice cover. Our carbon isotope record shows risingvalues until c. 5 ka, which accords with a trend com-monly observed in the Nordic Seas (e.g. Vogelsang1990; Fronval & Jansen 1997; Bauch et al. 2001;Sarnthein et al. 2003) indicating increasing ventilationof subsurface waters (Lubinski et al. 2001). However,the changes are not linear and a significant internalvariability in the different proxy records can beobserved.

From the planktic faunal distribution record a three-fold division of the Holocene can be applied (Fig. 5). Aperiod characterized by high percentages of subpolarspecies and high foraminiferal abundances (∼11–5.5 ka)is followed by a transition to a fauna similar to that ofthe Lateglacial (5.5–2 ka). Finally, around 2 ka, a returnof subpolar species and an abundance increase is found.

The PS1878 faunal record shows a strongly differentimage of the Holocene palaeoenvironmental evolutioncompared with the ice-core records, for example,GISP2 (Grootes et al. 1993). The GISP2 δ18O record(Fig. 5), which generally reflects the temperature of iceformation (Johnsen et al. 1992), shows very little vari-ability during the Holocene, with only a slight trendtowards more negative values (i.e. cooling) in theyounger part. Even though the more recent reconstruc-tion of the Greenland Holocene temperature (Vintheret al. 2009) reveals a more pronounced Holocene cli-matic optimum, it still shows very little shorter-scalevariability. In contrast, the faunal PS1878 record indi-cates that the intra-Holocene long-term variability aswell as millennial-scale changes had a magnitude onlyslightly lower than the glacial–interglacial transition.This comparison shows that the open-ocean environ-ment was much more susceptible to changes (resultingboth from external forcing and internal oscillation)than the climate on top of a large ice-sheet.

We associate the period of highest subpolar faunapercentages (10–5.5 ka) with the Holocene ThermalMaximum (HTM) and the relatively warm intervalthereafter (e.g. Werner et al. 2013), which we collec-tively term the early Holocene warm interval (EHWI).Its onset (Fig. 5) accords with that of HTM in manyother records from the Nordic Seas (e.g. Bauch et al.2001; Sarnthein et al. 2003; Giraudeau et al. 2010;Risebrobakken et al. 2011; Husum & Hald 2012).While the onset of the HTM is roughly simultaneous inthe northern Nordic Seas and occurred shortly after theinsolation peak at high northern latitudes (Laskar et al.

2004), the subsequent cooling is more gradual anddiffers among the individual study sites. These regionaldifferences are the expression of the general Holoceneevolution of water masses and associated frontalsystems combined with local and regional feedbackmechanisms (Bauch et al. 2001; Risebrobakken et al.2011; Werner et al. 2013). However, in our record theEHWI termination was relatively abrupt and tookplace around 5.5 ka.

The presence of the subpolar species T. quinqueloba,which reaches up to 30% of the planktic fauna duringthe EHWI (Fig. 5), indicates an increased influence ofAtlantic waters. In comparison to the Lateglacial theHolocene IRD record shows a significant decrease.Probably only few icebergs penetrated into the centralGreenland Sea during the EHWI. The westward shiftof the Greenland Sea gyre due to the Atlantic watersadvection could have additionally prevented icebergsfrom reaching the central Greenland Sea (Sarntheinet al. 1995).

According to our record, conditions in the centralGreenland Sea were variable during the EHWI. Themost prominent changes can be observed between ∼8.6and 8.2 ka (Fig. 5). The percentage of polar speciesincreases, reaching highest values of the HTM andindicating a cooling of the (sub)surface water. Thefaunal composition changes coincide with an intervalof decreasing foraminiferal abundance, suggestingdecreasing productivity, and are preceded by a lightδ18O peak (indicating freshwater influence) accompa-nied by a decrease in δ13C values (pointing to a weakersubsurface water ventilation). Although this mustbe regarded as relatively obscure evidence for afreshwater-related cooling event, the findings are gen-erally consistent with those from other palaeoclimaticand palaeoceanographic archives recording the cool‘8.2 ka event’, which was caused by the drainage ofLake Agassiz into the Labrador Sea and further intothe North Atlantic, with a subsequent AMOC collapse(Rohling & Pälike 2005; Risebrobakken et al. 2003 andreferences therein; Hillaire-Marcel et al. 2007).

No clear evidence of the 8.2 ka event was found inother central and western Nordic Seas records (e.g.Fronval & Jansen 1997; Bauch et al. 2001), possiblyattributed to the low temporal resolution of theserecords in the Holocene and the use of the >150 μmfraction for planktic foraminiferal counts of coreHM94-34 (Fronval & Jansen 1997). This size fractionmisses a significant part of the subpolar specimensbecause the subpolar species (e.g. T. quinqueloba) oftendo not reach such large test sizes in the Arctic environ-ment (Bauch 1994; Kandiano & Bauch 2002). There-fore the record of Fronval & Jansen (1997) mightunderestimate indications of the Holocene temperatureand water mass variations in the Holocene GreenlandSea. However, our finding that the 8.2 ka event is onlyweakly expressed in the central Greenland Sea might

Lateglacial and Holocene palaeoceanography, the Greenland Sea 281BOREAS

indicate that the event did not affect the western NordicSeas significantly, in contrast to the eastern NordicSeas where it is clearly recorded (Hald et al. 2007;Risebrobakken et al. 2003; Werner et al. 2013). Themiddle Holocene (between ∼5.5 and 3 ka) was charac-terized by the return of a more polar planktic faunastrongly dominated by N. pachyderma (sin) (Fig. 5).Also the foraminiferal abundance decreased signifi-cantly but remained higher than in the Lateglacial sedi-ments. These changes may indicate the onset of theNeoglacial cooling induced by decreasing insolation(e.g. Andersen et al. 2004a). The generally stableoxygen isotope ratios (8–3 ka) can be interpreted asopposing effects of cooling and freshening of the (sub-)surface water, though significant short-term variabilityoccurs in this interval as well. The observed changes aresimilar to those in other records (e.g. Jennings et al.2002; Werner et al. 2013) but the increase in the IRDdeposition in our record is not as prominent as on theEast Greenland shelf (Jennings et al. 2002). This isprobably due to the larger distance from the icebergsources.

The δ13C values reach their maximum between 7 and3 ka (Fig. 5) indicating intensive water mass ventila-tion. High δ13C values are common in the Nordic Seasduring this interval (Vogelsang 1990; Fronval & Jansen1997; Bauch et al. 2001; Sarnthein et al. 2003) andmight indicate maximum ventilation of the subsurfacewaters and/or reflect relatively stable and modern-likeenvironmental conditions in terms of the oceanic circu-lation (Bauch et al. 2001; Sarnthein et al. 2003), as wellas weak surface-water stratification (Bauch & Weinelt1997). Hall et al. (2004) report an interval of relativelyfast Iceland–Scotland Overflow Water (ISOW) flowbetween 7 and 4 ka, indicating AMOC strengthening.At first sight this may appear inconsistent with a middleHolocene cooling in the Greenland Sea at ∼5.5 kabecause an intensified AMOC may require an increasedAW inflow. However, as noticed by Giraudeau et al.(2010), AW inflow to the Norwegian Sea is on thesuborbital scale positively correlated to the PW outflowfrom the Arctic Ocean to the Greenland Sea. Thus,AMOC intensification might have brought coolersurface waters to the Greenland Sea, intensifying theactivity of the gyre system.

Around 3 ka planktic carbon isotopes show a signifi-cant decrease (Fig. 5). This change to lower δ13C valueshas been noted before (Bauch & Weinelt 1997) and canbe recognized as a basinwide stratigraphic featureamong many isotope records from the Nordic Seas (e.g.Vogelsang 1990; Bauch et al. 2001; Sarnthein et al. 2003;Risebrobakken et al. 2011). It is not visible in the recordfrom core HM94-34 from the Greenland Sea (Fronval &Jansen 1997), most probably due to the low sedimenta-tion rates and mixing of the uppermost sediment layersby bioturbation. Sarnthein et al. (1995, 2003) interpretthe δ13C drop as the result of an increase in AW advec-

tion. However, Hall et al. (2004) report that the ISOWflow started to decrease around 4 ka (indicating AMOCslow down) and reached a minimum at 2.7 ka. Thisprecludes an intensification of AW inflow and suggests adecrease in water mass ventilation and strengthening ofthe surface-water stratification as the reasons for theδ13C drop. The onset of the orbitally forced Neoglacialafter ∼5.5 ka caused a general cooling in the high north-ern latitudes and increasing sea ice occurrence (Mülleret al. 2012). The sea ice and the cold, low salinity (andthus low density) surface layer associated with it mayhave acted as a lid on top of the water column andlimited its vertical mixing. In the Greenland Sea thisdevelopment was amplified by the more intensive PWinflow (percentages of polar species N. pachyderma(sin.) reach the pre-Holocene values), which probablyled to even stronger surface water stratification. Possiblyaround 3 ka the abundance of sea ice and the thicknessof the freshwater lid reached a threshold and led to astepwise AMOC slow down.

In PS1878 we observe distinct changes in almost allavailable proxies for the past 2–3 ka (Fig. 5). The per-centage of subpolar foraminifera increases steadilybetween 2.5 and 1.5 ka, reaching values similar to thoseof the HTM (>30%). Parallel to the subpolar faunareappearance, an increase in the total abundance of theforaminiferal fauna occurs. Significant changes are alsofound in the stable isotope records. After a relativelyshort stable interval (2.5–1.5 ka) the carbon isotoperatio decreases and becomes more variable. This mightsuggest an increase in water-column stratification and adecreasing ventilation of the subsurface water. Theoxygen isotope values begin to decrease after the stableinterval of the middle Holocene, which might suggestwarming of the subsurface water.

Our data fit well in the broader image of the lateHolocene in the circum-Nordic Seas region. Variousice-core (e.g. Johnsen et al. 2001), terrestrial (e.g.McDermott et al. 2001) and marine records (e.g.Sarnthein et al. 2003; Andersen et al. 2004a, b;Giraudeau et al. 2010; Spielhagen et al. 2011; Werneret al. 2013) indicate warming and/or an increase in AWinflow into the Nordic Seas starting 3–2 ka and peaking1.5–1.0 ka.

Our data (Fig. 5) suggest two possible mechanismsexplaining the observed late Holocene changes – awarming of more stratified water masses and/or anincrease in lateral warm Atlantic waters advection. Astronger stratification could be the result of the densesea-ice cover and the low salinity surface layer, asalready discussed for the 3 ka δ13C drop. Strongerstratification of the upper water column would cer-tainly ease the warming of the subsurface water.However, due to the albedo being increased by the seaice cover and the low insolation during the late Holo-cene (Laskar et al. 2004), solar radiation must beexcluded as a possible heat source. A possible solution

282 Maciej M. Telesinski et al. BOREAS

is a stronger inflow of relatively warm Atlantic waters.This mechanism does not exclude a stronger stratifica-tion of the water column (Andersen et al. 2004a), as thewarm and saline AW is stable between the low salinitysurface layer and cold and saline deep waters and mostof it does not participate in deepwater formation, butbecomes part of outflowing water masses at shallowand intermediate depths (Mauritzen 1996). The Atlan-tic waters also could be responsible for the furtherdecrease of planktic δ13C after 2 ka as AW is generallypoorly ventilated (Sarnthein et al. 2003). However, themechanisms behind the basinwide drop in planktic δ13Caround 3 ka seem not fully understood yet and needfurther investigations.

The fact that similar late Holocene changes describedabove are observed in many records from the NordicSeas suggests that they were a regional phenomenon ofAW inflow intensification, rather than just a change inrelative strength of individual NAC branches (althoughthe Atlantic waters did not necessarily reach the entirebasin at the sea surface). A reconstruction of the NorthAtlantic Oscillation (NAO) over the past 5.2 ka (Olsenet al. 2012) shows that around 2 ka the NAO changedfrom variable, intermittently negative to generally posi-tive conditions. The positive NAO situation is charac-terized by stronger westerlies, which can explain theintensification of the AW inflow into the Nordic Seas.

Our central Greenland Sea record is unusual com-pared with other circum-Nordic Seas records becausethe faunal data suggest a late Holocene (after 2 ka)onset of HTM-comparable conditions in the upperwater layers. We suppose that the stronger surfacewater stratification after 3 ka amplified the effect of theenhanced Atlantic waters inflow into the area at 2 ka.PS1878 is the first multicentennial record from thedeep, central part of the Nordic Sea that documents alate Holocene warming in this area. The unusual char-acter of the observed changes, together with the rela-tively high temporal resolution, makes it an interestingsite for further studies.

Conclusions

Our record from the deep central Greenland Sea allowsus to reconstruct the palaeoceanographic evolution ofthe area since the Last Glacial Maximum on an unprec-edented multicentennial scale.

• In the LGM, the Greenland Sea was strongly influ-enced by Polar Water. The basin was predominantlyice-covered and intensive ice-rafting took place. Theice lid together with a cold, low-salinity surface layerlimited subsurface water ventilation. These condi-tions resulted in a low biological productivityreflected by a poor planktic fauna dominated by thepolar species. Occasionally during the warmer

summer seasons the sea ice cover diminishedsomewhat, significantly improving planktic livingconditions.

• Deglaciation started around 18 ka with a freshwaterdischarge directly from the Greenland Ice Sheet.It lowered the surface salinity and decreased thesurface water ventilation leading to a further impov-erishment of the planktic fauna.

• The last major freshwater event is recorded in thecentral Greenland Sea during the Younger Dryas(12.8–11.9 ka) and supports the hypothesis of an‘Arctic’ trigger for this cool event.

• The earliest Holocene (11.9–7 ka) was an interval ofsurface-water warming, increasing productivity andimproving surface water ventilation.

• The early Holocene warm interval (∼10–5.5 ka) wascharacterized by high biologic productivity andabundant subpolar foraminiferal species. The inter-val was interrupted by short-term events, forexample, the cool 8.2 ka event.

• Due to the decreasing insolation, the middle Holo-cene (7–3 ka) was a time of the Neoglacial cooling,amplified by Polar Water inflow. The record indi-cates that the ventilation of the upper water layerswas more intense than at present.

• Thickening of the cold, low salinity surface layer asa result of Neoglacial cooling led to a relativelyrapid decrease of the ventilation and a strongerstratification of the upper water layer at 3 ka. Thisamplified the subsequent late Holocene warmingcaused by the NAO-induced strengthening of theAtlantic Water inflow into the Nordic Seas at ∼2 ka.

Acknowledgements. – This work is a contribution to the CASE InitialTraining Network funded by the European Community’s 7th Frame-work Programme FP7 2007/2013, Marie-Curie Actions, under GrantAgreement no. 238111. We thank Henning Bauch and Leonid Polyakfor valuable discussions and suggestions and two anonymous review-ers for their constructive criticism, which improved the manuscript.We are grateful to Lulzim Haxhiaj for performing the stable isotopemeasurements and to the Leibniz Laboratory, Kiel University, andthe Poznan Radiocarbon Laboratory for the AMS 14C dating.

References

Abbott, P. M., Davies, S. M., Steffensen, J. P., Pearce, N. J. G.,Bigler, M., Johnsen, S. J., Seierstad, I. K., Svensson, A. &Wastegård, S. 2012: A detailed framework of Marine IsotopeStages 4 and 5 volcanic events recorded in two Greenland ice-cores.Quaternary Science Review 36, 59–77.

Álvarez-Solas, J., Montoya, M., Ritz, C., Ramstein, G., Charbit, S.,Dumas, C., Nisancioglu, K., Dokken, T. M. & Ganopolski, A.2011: Heinrich event 1: an example of dynamical ice-sheet reactionto oceanic changes. Climate of the Past 7, 1297–1306.

Andersen, C., Koç, N., Jennings, A. E. & Andrews, J. T. 2004a:Nonuniform response of the major surface currents in theNordic Seas to insolation forcing: implications for the Holoceneclimate variability. Paleoceanography 19, PA2003, doi: 10.1029/2002PA000873.

Andersen, C., Koç, N. & Moros, M. 2004b: A highly unstable Holo-cene climate in the subpolar North Atlantic: evidence fromdiatoms. Quaternary Science Reviews 23, 2155–2166.

Lateglacial and Holocene palaeoceanography, the Greenland Sea 283BOREAS

Bakke, J., Lie, Ø., Heegaard, E., Dokken, T., Haug, G. H., Birks, H.H., Dulski, P. & Nilsen, T. 2009: Rapid oceanic and atmosphericchanges during the Younger Dryas cold period. Nature Geoscience2, 202–205.

Bard, E., Arnold, M., Mangerud, J., Paterne, M., Labeyrie, L.,Duprat, J., Mélières, M.-A., Sønstegaard, E. & Duplessy, J. 1994:The North Atlantic atmosphere–sea surface 14C gradient duringthe Younger Dryas climatic event. Earth and Planetary ScienceLetters 126, 275–287.

Bauch, H. A. 1994: Significance of variability in Turborotalitaquinqueloba (Natland) test size and abundance forpaleoceanographic interpretations in the Norwegian–GreenlandSea. Marine Geology 121, 129–141.

Bauch, H. A. & Weinelt, M. S. 1997: Surface water changes in theNorwegian Sea during last deglacial and Holocene times. Quater-nary Science Reviews 16, 1115–1124.

Bauch, H. A., Erlenkeuser, H., Spielhagen, R. F., Struck, U.,Matthiessen, J., Thiede, J. & Heinemeier, J. 2001: A multiproxyreconstruction of the evolution of deep and surface waters in thesubarctic Nordic seas over the last 30,000 yr. Quaternary ScienceReviews 20, 659–678.

Björck, S., Koç, N. & Skog, G. 2003: Consistently large marinereservoir ages in the Norwegian Sea during the Last Deglaciation.Quaternary Science Reviews 22, 429–435.

Broecker, W. S., Denton, G. H., Edwards, R. L., Cheng, H., Alley, R.B. & Putnam, A. E. 2010: Putting the Younger Dryas cold eventinto context. Quaternary Science Reviews 29, 1078–1081.

Broecker, W. S., Kennett, J. P., Flower, B. P., Teller, J. T.,Trumbore, S., Bonani, G. & Wolfli, W. 1989: Routing of meltwaterfrom the Laurentide Ice Sheet during the Younger Dryas coldepisode. Nature 341, 318–321.

Cabedo-Sanz, P., Belt, S. T., Knies, J. & Husum, K. 2012: Identifi-cation of contrasting seasonal sea ice conditions during theYounger Dryas. Quaternary Science Reviews. Doi: 10.1016/j.quascirev.2012.10.028. In press.

Carstens, J., Hebbeln, D. & Wefer, G. 1997: Distribution of plankticforaminifera at the ice margin in the Arctic (Fram Strait). MarineMicropaleontology 29, 257–269.

Clark, P. U. & Mix, A. C. 2002: Ice sheets and sea level of the LastGlacial Maximum. Quaternary Science Reviews 21, 1–7.

Condron, A. & Winsor, P. 2012: Meltwater routing and the YoungerDryas. Proceedings of the National Academy of Sciences 6, 1–6.

Davies, S. M., Abbott, P. M., Pearce, N. J. G., Wastegård, S. &Blockley, S. P. E. 2012: Integrating the INTIMATE records usingtephrochronology: rising to the challenge. Quaternary ScienceReview 36, 11–27.

Davies, S. M., Turney, C. S. M. & Lowe, J. J. 2001: Identification andsignificance of a visible, basalt-rich Vedde Ash layer in a Late-glacial sequence on the Isle of Skye, Inner Hebrides, Scotland.Journal of Quaternary Science 16, 99–104.

Dokken, T. M. & Jansen, E. 1999: Rapid changes in the mechanismof ocean convection during the last glacial period. Nature 401,458–461.

Dugmore, A. J., Larsen, G. & Newton, A. J. 1995: Seven TephraIsochrones in Scotland. The Holocene 5, 257–266.

Duplessy, J.-C., Shackleton, N. J., Fairbanks, R. G., Labeyrie, L. D.,Oppo, D. & Kallel, N. 1988: Deepwater source variations duringthe last climatic cycle and their impact on the global deepwatercirculation. Paleoceanography 3, 343–360.

Eldevik, T., Nilsen, J. E. Ø., Iovino, D., Anders Olsson, K., Sandø,A. B. & Drange, H. 2009: Observed sources and variability ofNordic seas overflow. Nature Geoscience 2, 406–410.

Fisher, T. G. & Lowell, T. V. 2012: Testing northwest drainage fromLake Agassiz using extant ice margin and strandline data. Quater-nary International 260, 106–114.

Foldvik, A., Aagaard, K. & Tørresen, T. 1988: On the velocity fieldof the East Greenland Current. Deep Sea Research 35, 1335–1354.

Fronval, T. & Jansen, E. 1997: Eemian and early Weichselian (140–60 ka) paleoceanography and paleoclimate in the Nordic seas withcomparisons to Holocene conditions. Paleoceanography 12, 443–462.

Giraudeau, J., Grelaud, M., Solignac, S., Andrews, J. T., Moros, M.& Jansen, E. 2010: Millennial-scale variability in Atlantic wateradvection to the Nordic Seas derived from Holocene coccolithconcentration records. Quaternary Science Reviews 29, 1276–1287.

Grootes, P. M., Stuiver, M., White, J. W. C., Johnsen, S. J. & Jouzel,J. 1993: Comparison of oxygen isotope records from the GISP2and GRIP Greenland ice cores. Nature 366, 552–554.

Haase, K. M., Hartmann, M. & Wallrabe-Adams, H.-J. 1996: Thegeochemistry of ashes from Vesterisbanken Seamount, GreenlandBasin: implications for the evolution of an alkaline volcano.Journal of Volcanology and Geothermal Research 70, 1–19.

Hald, M., Andersson, C., Ebbesen, H., Jansen, E.,Klitgaard-kristensen, D., Risebrobakken, B., Salomonsen, G. R.,Sarnthein, M., Sejrup, H. P. & Telford, R. J. 2007: Variations intemperature and extent of Atlantic Water in the northern NorthAtlantic during the Holocene. Quaternary Science Reviews 26,3423–3440.

Hall, I. R., Bianchi, G. G. & Evans, J. R. 2004: Centennial to mil-lennial scale Holocene climate–deep water linkage in the NorthAtlantic. Quaternary Science Reviews 23, 1529–1536.

Hansen, B. & Østerhus, S. 2000: North Atlantic–Nordic Seasexchanges. Progress in Oceanography 45, 109–208.

Hillaire-Marcel, C., de Vernal, A. & Piper, D. J. W. 2007: LakeAgassiz Final drainage event in the northwest North Atlantic.Geophysical Research Letters 34, L15601.

Hunt, J. B. 2004: Tephrostratigraphical evidence for the timing ofPleistocene explosive volcanism at Jan Mayen. Journal of Quater-nary Science 19, 121–136.

Husum, K. & Hald, M. 2012: Marine Mmicropaleontology Arcticplanktic foraminiferal assemblages: implications for subsurfacetemperature reconstructions. Marine Micropaleontology 96–97,38–47.

Jennings, A. E., Knudsen, K. L., Hald, M., Hansen, C. V. &Andrews, J. T. 2002: A mid-Holocene shift in Arctic sea-ice vari-ability on the East Greenland Shelf. The Holocene 12, 49–58.

Johnsen, S. J., Clausen, H. B., Dansgaard, W., Fuhrer, K.,Gundestrup, N., Hammer, C. U., Iversen, P., Jouzel, J., Stauffer,B. & Steffensen, J. 1992: Irregular glacial interstadials recorded ina new Greenland ice core. Nature 359, 311–313.

Johnsen, S. J., Dahl-Jensen, D., Gundestrup, N., Steffensen, J. P.,Henrik, B., Miller, H., Masson-Delmotte, V., Sveinbjörnsdottir,A. E. & White, J. 2001: Oxygen isotope and palaeotemperaturerecords from six Greenland ice-core stations: camp century, Dye-3,GRIP, GISP2, Renland and NorthGRIP. Journal of QuaternaryScience 16, 299–307.

Kandiano, E. S. & Bauch, H. A. 2002: Implications of plankticforaminiferal size fractions for the glacial-interglacialpaleoceanography of the polar North Atlantic. The Journal ofForaminiferal Research 32, 245–251.

Lane, C. S., Blockley, S. P. E., Mangerud, J., Smith, V. C., Lohne, O.S., Tomlinson, E. L., Matthews, I. P. & Lotter, A. F. 2012: Was the12.1 ka Icelandic Vedde Ash one of a kind? Quaternary ScienceReview 33, 87–99.

Laskar, J., Robutel, P., Joutel, F., Gastineau, M., Correia, A. C. M. &Levrard, B. 2004: A long term numerical solution for the insolationquantities of the Earth. Astronomy & Astrophysics 428, 261–285.

Le Bas, M. J., Le Maitre, R. W. & Streckeisen, A. 1986: A chemicalclassification of volcanic rocks based on the total alkali-silicadiagram. Journal of Petrology 27, 745–750.

Lekens, W. A. H., Sejrup, H. P., Haflidason, H., Petersen, G.,Hjelstuen, B. & Knorr, G. 2005: Laminated sediments precedingHeinrich event 1 in the Northern North Sea and Southern Norwe-gian Sea: origin, processes and regional linkage. Marine Geology216, 27–50.

Lind, E. M. & Wastegård, S. 2011: Tephra horizons contemporarywith short early Holocene climate fluctuations: new results fromthe Faroe Islands. Quaternary International 246, 157–167.

Lubinski, D. J., Polyak, L. & Forman, S. L. 2001: Freshwater andAtlantic water inflows to the deep northern Barents and Kara seassince ca 13 14C ka: foraminifera and stable isotopes. QuaternaryScience Reviews 20, 1851–1879.

284 Maciej M. Telesinski et al. BOREAS

Mangerud, J., Furnes, H. & Johansen, J. 1986: A 9000-year-old ashbed on the Faroe Islands. Quaternary Research 26, 262–265.

Mangerud, J., Lie, S. E., Furnes, H., Krisiansen, I. L. & Lomo, L.1984: A Younger Dryas ash bed in Western Norway, and itspossible correlations with tephra in cores from the Norwegian Seaand the North-Atlantic. Quaternary Research 21, 85–104.

Marshall, J. & Schott, F. 1999: Open-ocean convection: observa-tions, theory, and models. Reviews of Geophysics 37, 1–64.

Mauritzen, C. 1996: Production of dense overflow waters feeding theNorth Atlantic across the Greenland–Scotland Ridge. Part 1: evi-dence for a revised circulation scheme. Deep Sea Research 43,769–806.

McDermott, F., Mattey, D. P. & Hawkesworth, C. 2001: Centennial-scale Holocene climate variability revealed by a high-resolutionspeleothem δ18O record from SW Ireland. Science 294, 1328–1331.

McManus, J. F., Francois, R., Gherardi, J.-M., Keigwin, L. D. &Brown-Leger, S. 2004: Collapse and rapid resumption of Atlanticmeridional circulation linked to deglacial climate changes. Nature428, 834–837.

Mortensen, A. K., Bigler, M., Grönvold, K., Steffensen, J. P. &Johnsen, S. J. 2005: Volcanic ash layers from the Last GlacialTermination in the NGRIP ice core. Journal of Quaternary Science20, 209–219.

Müller, J., Werner, K., Stein, R., Fahl, K., Moros, M. & Jansen, E.2012: Holocene cooling culminates in sea ice oscillations in FramStrait. Quaternary Science Reviews 47, 1–14.

Nørgaard-Pedersen, N., Spielhagen, R. F., Erlenkeuser, H., Grootes,P. M., Heinemeier, J. & Knies, J. 2003: Arctic Ocean during theLast Glacial Maximum: Atlantic and polar domains of surfacewater mass distribution and ice cover. Paleoceanography 18, 1–19.

Not, C. & Hillaire-Marcel, C. 2012: Enhanced sea-ice export from theArctic during the Younger Dryas. Nature Communications 3, 647,doi: 10.1038/ncomms1658.

Nowaczyk, N. R. & Antonow, M. 1997: High-resolutionmagnetostratigraphy of four sediment cores from the GreenlandSea-I. Identification of the Mono Lake excursion, Laschamp andBiwa I/Jamaica geomagnetic polarity events. Geophysical JournalInternational 131, 310–324.

Nürnberg, D., Wollenburg, I., Dethleff, D., Eicken, H., Kassens, H.,Letzig, T., Reimnitz, E. & Thiede, J. 1994: Sediments in Arctic seaice: implications for entrainment, transport and release. MarineGeology 104, 185–214.

Olsen, J., Anderson, N. J. & Knudsen, M. F. 2012: Variability of theNorth Atlantic Oscillation over the past 5,200 years. Nature Geo-science 5, 808–812.

Prange, M. & Gerdes, R. 1999: Influence of Arctic river runoff on thecirculation in the Arctic Ocean, the Nordic Seas and the NorthAtlantic. ICES ASC 1999 – CM 1999/L:11 (Nordic SeasExchanges), 1–5.

Rashid, H., Piper, D. & Flower, B. 2011: The role of Hudson Straitoutlet in Younger Dryas sedimentation in the Labrador Sea.Abrupt Climate Change: Mechanisms, Patterns, and Impacts. Geo-physical Monograph Series 193, 93–110.

Rasmussen, S. O., Andersen, K. K., Svensson, A. M., Steffensen, J.P., Vinther, B. M., Clausen, H. B., Siggaard-Andersen, M.-L.,Johnsen, S. J., Larsen, L. B., Dahl-Jensen, D., Bigler, M.,Röthlisberger, R., Fischer, H., Goto-Azuma, K., Hansson, M. E.& Ruth, U. 2006: A new Greenland ice core chronology for the lastglacial termination. Journal of Geophysical Research 111, D06102.

Rasmussen, T. L. & Thomsen, E. 2004: The role of the North Atlan-tic Drift in the millennial timescale glacial climate fluctuations.Palaeogeography, Palaeoclimatology, Palaeoecology 210, 101–116.

Reimer, P., Baillie, M., Bard, E., Bayliss, A., Beck, J. W., Blackwell,P. G., Bronk Ramsey, C., Buck, C. E., Burr, G. S., Edwards, R. L.,Friedrich, M., Grootes, P. M., Guilderson, T. P., Hajdas, I.,Heaton, T. J., Hogg, A. G., Hughen, K. A., Kaiser, K. F., Kromer,B., McCormac, F. G., Manning, S. W., Reimer, R. W., Richards,D. A., Southon, J. R., Talamo, S., Turney, C. S. M., van der Plicht,J. & Weyhenmeyer, C. E. 2009: IntCal09 and Marine09 radiocar-bon age calibration curves, 0–50,000 years cal BP. Radiocarbon 51,1111–1150.

Risebrobakken, B., Jansen, E., Andersson, C., Mjelde, E., & Hevrøy,K. 2003: A high-resolution study of Holocene paleoclimatic andpaleoceanographic changes in the Nordic Seas. Paleoceanography18, 1017.

Risebrobakken, B., Dokken, T., Smedsrud, L. H., Andersson, C.,Jansen, E., Moros, M. & Ivanova, E. V. 2011: Early Holocenetemperature variability in the Nordic Seas: the role of oceanic heatadvection versus changes in orbital forcing. Paleoceanography 26,PA4206, Doi: 10.1029/2011PA002117.

Rohling, E. J. & Pälike, H. 2005: Centennial-scale climate coolingwith a sudden cold event around 8,200 years ago. Nature 434,975–979.

Sarnthein, M., Jansen, E., Weinelt, M., Arnold, M., Duplessy, J. C.,Erlenkeuser, H., Flatøy, A., Johannessen, G., Johannessen, T.,Jung, S., Koc, N., Labeyrie, L., Maslin, M., Pflaumann, U. &Schulz, H. 1995: Variations in Atlantic surface oceanpaleoceanography, 50°–80°N: a time-slice record of the last 30,000years. Paleoceanography 10, 1063–1094.

Sarnthein, M., van Kreveld, S., Erlenkeuser, H., Grootes, P. M.,Kucera, M., Pflaumann, U. & Schulz, M. 2003: Centennial-to-millennial-scale periodicities of Holocene climate and sedimentinjections off the western Barents shelf, 75°N. Boreas 32, 447–461.

Spielhagen, R. F., Baumann, K.-H., Erlenkeuser, H., Nowaczyk, N.R., Nørgaard-Pedersen, N., Vogt, C. & Weiel, D. 2004: ArcticOcean deep-sea record of northern Eurasian ice sheet history. Qua-ternary Science Reviews 23, 1455–1483.

Spielhagen, R. F., Werner, K., Aagaard-Sørensen, S., Zamelczyk, K.,Kandiano, E., Budeus, G., Husum, K., Marchitto, T. M. & Hald,M. 2011: Enhanced modern heat transfer to the Arctic by warmAtlantic water. Science 331, 450–453.

Stanford, J. D., Rohling, E. J., Bacon, S., Roberts, A. P., Grousset,F. E. & Bolshaw, M. 2011: A new concept for thepaleoceanographic evolution of Heinrich event 1 in the NorthAtlantic. Quaternary Science Reviews 30, 1047–1066.

Stein, R., Nam, S. I., Schubert, C., Vogt, C., Ftitterer, D. &Heinemeier, J. 1994a: The last deglaciation event in the easterncentral Arctic Ocean. Science 264, 692–696.

Stein, R., Schubert, C., Vogt, C. & Ftitterer, D. 1994b: Stable isotopestratigraphy, sedimentation rates and paleosalinity in the latestPleistocene to Holocene central Arctic Ocean. Marine Geology 119,333–355.

Stuiver, M. & Reimer, P. J. 1993: Radiocarbon calibration program.Radiocarbon 35, 215–230.

Sutherland, D. A. & Pickart, R. S. 2008: The East Greenland CoastalCurrent: structure, variability, and forcing. Progress in Oceanog-raphy 78, 58–77.

Swift, J. 1986: The Arctic waters. In Hurdle, B. (ed.): The NordicSeas, 129–151. Springer, New York.

Tarasov, L. & Peltier, W. R. 2006: A calibrated deglacial drainagechronology for the North American continent: evidence of anArctic trigger for the Younger Dryas. Quaternary Science Reviews25, 659–688.

Thiede, J. & Hempel, G. 1991: The expedition ARKTIS-VII/1 of RV‘POLARSTERN’ in 1990. Berichte zur Polarforschung 80, 1–137.

Vinther, B. M., Buchardt, S. L., Clausen, H. B., Dahl-Jensen, D.,Johnsen, S. J., Fisher, D. A., Koerner, R. M., Raynaud, D.,Lipenkov, V., Andersen, K. K., Blunier, T., Rasmussen, S. O.,Steffensen, J. P. & Svensson, A. M. 2009: Holocene thinning of theGreenland ice sheet. Nature 461, 385–388.

Vogelsang, E. 1990: Paläo-Ozeanographie des EuropäischenNordmeeres anhand stabiler Kohlenstoff- und Sauerstoffisotope.Berichte aus dem Sonderforschungsbereich 313, 1–136. Universityof Kiel, Kiel.

Waelbroeck, C., Duplessy, J. C., Michel, E., Labeyrie, L., Paillard,D. & Duprat, J. 2001: The timing of the last deglaciation in NorthAtlantic climate records. Nature 412, 724–727.

Werner, K., Spielhagen, R. F., Bauch, D., Hass, H. C. & Kandiano,E. 2013: Atlantic Water advection versus sea-ice advances in theeastern Fram Strait during the last 9 ka – multiproxy evidence fora two-phase Holocene. Paleoceanography 28, 283–295.

Lateglacial and Holocene palaeoceanography, the Greenland Sea 285BOREAS

4. Water mass evolution of the Greenland Sea

since late glacial times

From [Telesiński, M.M., Spielhagen, R.F., Bauch, H.A., 2014. Water mass evolution of

the Greenland Sea since late glacial times. Clim. Past 10, 123–136.]. Reprinted under

Creative Commons license.

Data available online at http://doi.pangaea.de/10.1594/PANGAEA.832368

54

4. Water mass evolution of the Greenland Sea since late glacial times

Clim. Past, 10, 123–136, 2014www.clim-past.net/10/123/2014/doi:10.5194/cp-10-123-2014© Author(s) 2014. CC Attribution 3.0 License.

Climate of the Past

Open A

ccess

Water mass evolution of the Greenland Sea since late glacial times

M. M. Telesinski1, R. F. Spielhagen1,2, and H. A. Bauch1,2

1GEOMAR Helmholtz Centre for Ocean Research Kiel, Wischhofstrasse 1–3, 24148 Kiel, Germany2Academy of Sciences, Humanities, and Literature, 53151 Mainz, Germany

Correspondence to:M. M. Telesinski ([email protected])

Received: 15 August 2013 – Published in Clim. Past Discuss.: 30 August 2013Revised: 21 November 2013 – Accepted: 6 December 2013 – Published: 16 January 2014

Abstract. Four sediment cores from the central and northernGreenland Sea basin, a crucial area for the renewal of NorthAtlantic deep water, were analyzed for planktic foraminiferalfauna, planktic and benthic stable oxygen and carbon iso-topes as well as ice-rafted debris to reconstruct the environ-mental variability in the last 23 kyr. During the Last GlacialMaximum, the Greenland Sea was dominated by cold andsea-ice bearing surface water masses. Meltwater dischargesfrom the surrounding ice sheets affected the area during thedeglaciation, influencing the water mass circulation. Duringthe Younger Dryas interval the last major freshwater eventoccurred in the region. The onset of the Holocene interglacialwas marked by an increase in the advection of Atlantic Wa-ter and a rise in sea surface temperatures (SST). Although thethermal maximum was not reached simultaneously across thebasin, benthic isotope data indicate that the rate of overturn-ing circulation reached a maximum in the central GreenlandSea around 7 ka. After 6–5 ka a SST cooling and increas-ing sea-ice cover is noted. Conditions during this so-called“Neoglacial” cooling, however, changed after 3 ka, probablydue to enhanced sea-ice expansion, which limited the deepconvection. As a result, a well stratified upper water columnamplified the warming of the subsurface waters in the centralGreenland Sea, which were fed by increased inflow of At-lantic Water from the eastern Nordic Seas. Our data revealthat the Holocene oceanographic conditions in the Green-land Sea did not develop uniformly. These variations werea response to a complex interplay between the Atlantic andPolar water masses, the rate of sea-ice formation and meltingand its effect on vertical convection intensity during times ofNorthern Hemisphere insolation changes.

1 Introduction

The Nordic Seas are an important region for the globaloceanic system. First of all, they are the main gateway be-tween the Arctic and North Atlantic oceans (Hansen andØsterhus, 2000). They also play a fundamental role in theoverturning circulation being one of the deep water forma-tion regions (Marshall and Schott, 1999). Paleoceanographicstudies in this area are crucial to improve our understandingof the pace and amplitude of natural variability during thelast glacial–interglacial transition and within the Holocene.While a significant number of detailed studies focuses onthe eastern part of the region, along the North Atlantic Cur-rent (NAC) flow (e.g., Hald et al., 2007; Risebrobakken etal., 2011), less effort has been devoted to its central andwestern parts (e.g., Fronval and Janssen, 1997; Bauch et al.,2001). Problems with the accessibility due to the ice coverand low sedimentation rates (Nørgaard-Pedersen et al., 2003;Telesinski et al., 2013), which do not allow high resolutionstudies, are among the main reasons here.

Recently, Telesinski et al. (2013) presented a new recordfrom the central Greenland Sea that allowed studying theoceanographic changes since the late glacial (22.3 ka) ina relatively high temporal resolution. That study revealedsignificant variability of the oceanic environment on mul-ticentennial to multimillennial timescales. Although therecord was generally in agreement with earlier studies, italso revealed some unusual features such as, e.g., an ex-treme freshwater-related planktic low-δ18O spike during thedeglaciation and microfossil evidence for a late Holocenewarming. Here we now correlate and compare that recordwith three other sediment cores from the northern Green-land Sea and with other paleoceanographic archives from theNordic Seas to reconstruct the paleoceanography on a larger

Published by Copernicus Publications on behalf of the European Geosciences Union.

124 M. M. Telesinski et al.: Water mass evolution of the Greenland Sea since late glacial times

regional scale. Furthermore, subsurface temperature recon-structions and a first high-resolution benthic stable isotoperecord from the Greenland Sea are presented and allow as-sessing the spatial range of variability found in the centralGreenland Sea and the history of the overturning circulationin the area.

2 Study area

The Nordic Seas constitute the only deep-water connectionbetween the North Atlantic and the Arctic oceans (Fig. 1).Relatively warm and saline (T ∼ 6–11◦C, S > 35) AtlanticWater (AW) flows north along the Norwegian, Barents Seaand Svalbard continental margins and enters the Arcticthrough the Fram Strait and Barents Sea. In the west, cold,low-saline (< 0◦C, < 34.4) Polar Water (PW) flows souththrough the Fram Strait and along the Greenland continen-tal margin to enter the North Atlantic through the DenmarkStrait (Rudels et al., 1999). The strong gradient betweenthese two main surface water masses makes the Nordic Seassensitive to climatic changes. The central part of the NordicSeas is the domain of Arctic Water (ArW), a result of PW andAW mixing. ArW is separated from PW by the Polar Frontand from AW by the Arctic Front (Swift, 1986).

The vertical structure of the water column in the centralGreenland Sea consists of three layers. At the surface, thereis a thin layer of Arctic Surface Water originating from theEast Greenland Current (EGC). Underneath, a layer of At-lantic Intermediate Water exists, which is supplied from theNAC. The weakly stratified Greenland Sea Deep Water, aproduct of deep convection, is found below (Marshall andSchott, 1999).

The Nordic Seas are one of the areas where deep waterconvection and the formation of North Atlantic Deep Wa-ter (NADW) take place today (e.g., Rudels and Quadfasel,1991; Marshall and Schott, 1999). The western branches ofthe NAC and the eastern branches of the EGC create a cy-clonic circulation in the Greenland Sea and lead to domingof the upper water layers. As the two water masses mix, theyincrease their density and sink to the bottom (Hansen andØsterhus, 2000). Subsequently, the water leaves the NordicSeas as the Denmark Strait and Iceland-Scotland OverflowWaters.

Sea ice plays an important preconditioning role in theGreenland Sea compared to other convectional areas. In earlywinter, the formation of sea ice leads to brine rejection.The surface layer increases its density and sinks to about150 m by mid-January. The sea-ice cover forms a wedge (IsOdden) extending far to the northeast, also over the Vester-isbanken area. Preconditioning continues later in the win-ter, with mixed-layer deepening in the ice-free area (NordBukta) to 300–400 m, induced by strong winds blown overthe ice. Typically in March, near-surface densities are highenough to develop deep convection (down to> 2000 m) in

Fig. 1. Present day surface water circulation in the Nordic Seas.Cores used in this study are marked by yellow dots; other coresmentioned in text are marked by orange dots. Red arrows indi-cate Atlantic Water, blue arrows – Polar Water, white broken lines– oceanographic fronts. White arrow – present-day deep convec-tion (Marshall and Schott, 1999). EGC – East Greenland Current,NAC – North Atlantic Current, WSC – West Spitsbergen Current,GFZ – Greenland Fracture Zone. Bathymetry from The Interna-tional Bathymetric Chart of the Arctic Ocean (http://www.ibcao.org, 2012).

the Greenland Sea, if the meteorological conditions are fa-vorable (Marshall and Schott, 1999).

At present, the sites investigated in this study are all lo-cated within the ArW domain. A detailed description of sitePS1878 was given by Telesinski et al. (2013). The threesites from the northern Greenland Sea, PS1894, PS1906 andPS1910, are located on the Greenland continental slope, onthe northern and on the southern part of the Greenland Frac-ture Zone crest, respectively.

3 Material and methods

The sediment cores used in this study were retrieved duringthe ARK-VII/1 expedition of RVPolarsternin 1990 (Fig. 1).Core PS1878 is compiled from a giant box core PS1878-2and a kasten core PS1878-3 (Telesinski et al., 2013), whereasthe three others are giant box cores (Table 1). All cores con-sisted of brown to olive grey sediments of clay to silty sand.They were sampled continuously every 1 cm. Additionally,surface sediments of cores PS1894, PS1906 and PS1910were collected. Further preparation included freeze-drying,wet-sieving with deionized water through a 63 µm mesh, anddry-sieving into size fractions using 100, 125, 250, 500 and1000 µm sieves. Each size fraction was weighed.

In representative splits (> 300 specimens) of the 100–250 µm size fraction planktic foraminifera were counted.Samples containing less than 100 specimens were not used

Clim. Past, 10, 123–136, 2014 www.clim-past.net/10/123/2014/

M. M. Telesinski et al.: Water mass evolution of the Greenland Sea since late glacial times 125

Table 1.Cores used in the study.

Core Latitude Longitude Water Core Coredepth type length(m) (cm)

PS1878-2 73◦15.1′ N 9◦00.9′ W 3038 BCa 27PS1878-3 73◦15.3′ N 9◦00.7′ W 3048 KCb 113PS1894-7 75◦48.8′ N 8◦15.5′ W 1992 BCa 42PS1906-1 76◦50.5′ N 2◦09.0′ W 2990 BCa 33PS1910-1 75◦37.0′ N 1◦19.0′ E 2448 BCa 33

a BC – giant box core,b KC – kasten core.

for the relative species abundance analysis. The number ofplanktic foraminifera per 1 g dry sediment was calculated toserve as a semiquantitative proxy for bioproductivity.

Identification and counting of several mineral grain types> 250 µm was used as a proxy for the intensity of ice-raftingand the identification of tephra layers. As ice-rafted debris(IRD) we interpret all lithic grains> 250 µm, except for un-weathered volcanic glass. In the high latitudes, such coarseparticles can be transported into a deep ocean basin prefer-entially by icebergs while sea ice mainly transports finer ma-terial (Clark and Hanson, 1983; Nürnberg et al., 1994).

For the analysis of stable oxygen and carbon isotopes,specimens of the planktic foraminiferal speciesNeoglobo-quadrina pachyderma(sin.) (all cores) and two benthicspecies – the epibenthicCibicidoides wuellerstorfiand theshallow infaunal Oridorsalis umbonatus(cores PS1894,PS1910 and PS1878) – were used. Because of departuresfrom isotopic calcite equilibrium, the measuredδ18O valuesof these two species were corrected by+0.64 and+0.36 ‰,respectively (cf. Duplessy et al., 1988). Twenty-five spec-imens were picked from the 125–250 µm (N. pachyderma(sin.) andO. umbonatus) and 250–500 µm (C. wuellerstorfi)size fractions. All stable isotope analyses were carried out inthe isotope laboratories of GEOMAR Helmholtz Centre forOcean Research Kiel and the University of Kiel on FinniganMAT 251 and Thermo MAT 253 mass spectrometers. Resultsare expressed in theδ notation referring to the PDB (Pee DeeBelemnite) standard and are given asδ18O andδ13C with ananalytical accuracy of< 0.06 and< 0.03 ‰, respectively.

Absolute summer subsurface temperatures (100 m waterdepth) were calculated at site PS1878 between 15 and 0 kausing transfer functions based on a modern training set fromthe Arctic (Husum and Hald, 2012) and the C2 software,version 1.7.2 (Juggins, 2011). A weighted average partialleast-squares statistical model with three components (WA-PLS C3) and leave-one-out (“jack knifing”) cross valida-tion was used. The root mean-squared error of predictionis 0.52◦C. Unlike Husum and Hald (2012), who used the> 100 µm size fraction, we ran the transfer function usingthe 100–250 µm size fraction. Although the coarser sedi-ments contained relatively few foraminifera, we acknowl-edge that this might have slightly biased the results. Further,

Table 2. AMS 14C measurements and their calibrated ages for thecores used in the study (BP – before present).

Lab. no. Depth 14C age± Calibrated(cm) standard age

deviation (yr BP)

Core PS1878-2

Poz-45376 0.5 775± 35 426Poz-45377 12.5 3300± 40 3143

Core PS1878-3

Poz-45378 11.5 3295± 35 3139Poz-45380 19.5 4525± 35 4746Poz-54381 25.5 5580± 50 5961Poz-54382 30.5 6760± 50 7295Poz-45384 39.5 8410± 60 9028Poz-45385 58.5 11 100± 60 12 613KIA 47284 95.5 16 620± 110 19 266

Core PS1894-7

KIA 7088 0.5 3845± 40 3794KIA 47258 5.5 5390± 35 5773KIA 7089 9.5 5745± 40 6174KIA 47259 16.5 8075± 45 8528KIA 7090 21.5 8910± 55 9564KIA 7091 35.5 14 430± 70 17 051

Core PS1906-1

KIA 7084 4.5 4360± 30 4482KIA 7083 11.5 7965± 40 8420KIA 7082 22.5 17 040± 80 19 731KIA 7081 32.5 19 130± 90 22 334

Core PS1910-1

KIA 44390 0.5 2655± 30 2336Poz-45386 4.5 4820± 35 5122Poz-45387 11.5 6950± 50 7457KIA 44393 17.5 11 340± 50 12 794Poz-45388 30.5 16 80± 100 19 625

reconstructed temperatures below 2◦C are considered to beuncertain as the modern training set does contain very fewdata points below 2◦C (Husum and Hald, 2012).

4 Chronology

AMS 14C datings were performed on monospecific samplesof N. pachyderma(sin.) (Table 2). All radiocarbon ages werecorrected for a reservoir age of 400 yr, calibrated using CalibRev 6.1.0 software (Stuiver and Reimer, 1993) and the Ma-rine09 calibration curve (Reimer et al., 2009) and are givenin thousand calendar years before 1950 AD (ka).

The records cover the last ca. 20–23 kyr. The threebox cores from the northern Greenland Sea have average

www.clim-past.net/10/123/2014/ Clim. Past, 10, 123–136, 2014

126 M. M. Telesinski et al.: Water mass evolution of the Greenland Sea since late glacial times

0

5

10

15

20

25

30

35

40

45

50

55

60

11.09 ka

11.1 ka

13.1 ka

13.8 ka

18.4 ka18.7 ka

19.1 ka

19.6 ka20.5 ka

21.5 ka

5.0 4.0 3.0 2.00

5

10

15

20

25

30

35

40

45

50

2.2 ka

8.3 ka

12.4 ka

15.1 ka

18.8 ka

19.2 ka

23.5 ka

27.4 ka

26.1 ka

32.9 ka

5.0 4.0 3.0 2.00

5

10

15

20

25

30

35

40

45

5.0 3.04.03.8 ka

5.8 ka

6.2 ka

8.5 ka

9.6 ka

17.1 ka

0

5

10

15

20

25

30

35

5.0 3.04.02.3 ka

5.1 ka

7.5 ka

12.8 ka

19.6 ka

PS2887 PS1230 PS1894

0

10

20

30

40

50

60

70

80

1.2 ka

3.8 ka

5.7 ka

8.5 ka

7.3 ka

10.3 ka

12.0 ka

23.0 ka

14.0 ka 13.2 ka

19.3 ka

24.4 ka

27.9 ka

29.9 kaPS1243

5.0 3.04.00

10

20

30

40

50

60

70

80

90

100

110

5.0 34.0 0120.4 ka

3.1 ka

4.7 ka

6.0 ka

7.3 ka

9.0 ka

12.6 ka

19.3 ka

PS1878

TEPHRA

PS19101.0-0.5 0.0 0.5 1.0-0.5 0.0 0.5 1.0-0.5 0.0 0.5 1.0-0.5 0.0 0.5 1.0-0.5 0.0 0.5 1.0-0.5 0.0 0.5 1.0-0.5 0.0 0.5

0

5

10

15

20

25

30

35

4.5 ka

8.4 ka

19.7 ka

22.3 ka

5.0 4.0 3.0

PS1906

?

?

?

?

?

?

?

?

*

*

Dep

th (c

m)

δ18O (‰)

δ13C (‰)

δ18O (‰) δ18O (‰) δ18O (‰) δ18O (‰) δ18O (‰) δ18O (‰)

δ13C (‰)δ13C (‰)δ13C (‰)δ13C (‰)δ13C (‰)δ13C (‰)

Fig. 2. Planktic oxygen and carbon stable isotope records of cores from the Nordic Seas and suggested correlation. Calibrated AMS14Cdates are shown. Dates excluded from the correlation are marked in pale red. Light grey shadings indicate the light carbon and oxygen isotopeexcursions interpreted as freshwater discharges, marking the onset of the deglaciation.

sedimentation rates of 1.5–2.0 cm kyr−1. These low rates, to-gether with bioturbation and uncertain reservoir ages, makeage models of these records unreliable if based only on14Cdatings. This is best illustrated by relatively old ages yieldedfrom the surface samples of these cores (2.3–3.8 ka). How-ever, the surface sample of core PS1878 yielded a youngerage (0.426 ka) and contained recent sediments (Telesinski etal., 2013). Therefore we assume that sedimentation in theentire study area did not terminate in the late Holocene.To account for the apparent inaccuracy of part of the AMS14C dates we attempted to improve the consistency of theage models of these cores by correlating the stable iso-tope data (and, in a few cases, also other proxies) and us-ing linear interpolation between correlated points and reli-able14C-dated samples. In addition to our own data, we alsoused three nearby records of comparable sedimentation rates,time range and water depths. These include cores PS2887(Nørgaard-Pedersen et al., 2003) as well as PS1230 from thewestern Fram Strait and PS1243 from the SW NorwegianSea (Bauch et al., 2001). As the base for the correlation weused core PS1878, which has the highest temporal resolutionand a reliable chronological framework based on14C datingsin the younger part of the record (Fig. 2). Due to poorer14Cage control and more speculative reservoir ages in the olderpart of the records, our improved age model is restricted tothe last 15 kyr.

5 Results

5.1 Planktic foraminifera, ice-rafted detritus (IRD) andreconstructed subsurface temperatures

Four of our faunal records from the Greenland Sea showsignificantly different planktic foraminiferal abundances(Fig. 3), most likely due to different sedimentation rates.Therefore, absolute numbers of foraminiferal specimensin individual samples are not a meaningful proxy whencores are compared with one another. The records beginwith relatively low abundances of the foraminiferal faunastrongly dominated byN. pachyderma(sin.) (Fig. 4, betweenca. 23 and 12 ka), a polar species dwelling at water depths ofca. 50–200 m (Carstens et al., 1997). There are, however, anumber of prominent, short-lived peaks of high foraminiferalabundance. They are most common and most prominent incore PS1878, supposedly due to its highest time resolution,but they are also noticeable in cores PS1906 and PS1894.

A significant early change among the faunal data is ob-served in core PS1894. Here, an increase to 20–30 % is foundfor the subpolar speciesN. pachyderma(dex.) andTurboro-talita quinquelobaalready around 17 ka. In the other coresa similar change is not noted until ca. 12 ka when both thepercentages of subpolar species and the total abundance in-crease. Throughout the remaining part of the records theabundance stays high although significant variability can beobserved. The portions of subpolar species remain high for

Clim. Past, 10, 123–136, 2014 www.clim-past.net/10/123/2014/

M. M. Telesinski et al.: Water mass evolution of the Greenland Sea since late glacial times 127

?

???

??

?

**

0

5

10

15

20

25

30

35

40

45

0 15k5k 10k3.8 ka

5.8 ka

6.2 ka

8.5 ka

9.6 ka

0 200 400PS1894

0

10

15

20

25

30

35

0 40k20k

0 200 400

679►

2.3 ka

5.1 ka

7.5 ka

12.8 ka

19.6 ka

5

PS1910

0

10

20

30

40

50

60

70

80

90

100

110

0 10k5k

PS18780 200 400

0.4 ka

3.1 ka

4.7 ka 6.0 ka

7.3 ka

9.0 ka

12.6 ka

19.3 ka

TEPHRA

0

5

10

15

20

25

30

35 0 200 400

0 20k 40k 60k

PS1906

4.5 ka

8.4 ka

22.3 ka

19.7 ka

17.1 ka

Dep

th (c

m)

Planktic foraminifera/g

IRD/g

PS12430 200 400

0

10

20

30

40

50

60

70

80

3.8 ka

5.7 ka

8.5 ka

7.3 ka

10.3 ka

12.0 ka

23.0 ka

14.0 ka 13.2 ka

19.3 ka

24.4 ka

27.9 ka

29.9 ka

1.2 ka0 20k 40k 60k

Fig. 3.Planktic foraminifera and IRD abundance (per 1 g dry sediment) of cores used in this study and core PS1243. Correlation and ages asin Fig. 2.

? ??

?

?

?

?

**

0

5

10

15

20

25

30

35

40

45

0% 100%50%3.8 ka

5.8 ka

6.2 ka

8.5 ka

9.6 ka

17.1 ka

PS1894

0

5

10

15

20

25

30

35

0% 100%50%2.3 ka

5.1 ka

7.5 ka

12.8 ka

19.6 ka

PS1910

0

10

20

30

40

50

60

70

80

90

100

110

0% 100%50%0.4 ka

3.1 ka

4.7 ka6.0 ka7.3 ka

9.0 ka

12.6 ka

19.3 ka

PS1878

TEPHRA

0% 100%50%0

5

10

15

20

30

35

25

4.5 ka

8.4 ka

19.7 ka

22.3 kaPS1906

Dep

th (c

m)

N.p.(s)

N.p.(d)

T.q.

>125µm80-150µm

0

10

20

30

40

50

60

70

80

0% 100%50%

3.8 ka

5.7 ka

8.5 ka

7.3 ka

10.3 ka

12.0 ka

23.0 ka

14.0 ka 13.2 ka

19.3 ka

24.4 ka

27.9 ka 29.9 ka

1.2 ka

PS1243

Fig. 4. Relative abundances of the three most common planktic foraminifera species in cores used in this study and core PS1243.N.p. (s)– N. pachyderma(sin.), N.p. (d) – N. pachyderma(dex.),T.q. – T. quinqueloba. Correlation and ages as in Fig. 2. Note the different sizefractions used in core PS1243.

a few thousand years and then decrease gradually and un-simultaneously to reach pre-Holocene values (< 10–20 %)again after ca. 5 ka. A second, major increase can be ob-served after 3 ka in core PS1878 and, less clearly, PS1894.We did not find any significant signs of dissolution in thestudied foraminifera. Both tests of robustN. pachydermaandmore fragile subpolar species are generally well preservedthroughout the cores.

As expected, the IRD records show high amounts of coarselithogenic grains in the glacial part and low numbers during

the Holocene (Fig. 3). Only the IRD content of core PS1894remains relatively high throughout the entire record withslightly lower values between ca. 17 and 10 ka. In corePS1894, as well as in the lower part of cores PS1906 andPS1878, the IRD content seems to be positively correlatedwith the foraminiferal abundance, while in core PS1910 andin the upper part of PS1906 and PS1878 these two proxiesappear inversely correlated.

The subsurface temperature record of core PS1878 showsvalues steadily increasing from around 2◦C around 15 ka

www.clim-past.net/10/123/2014/ Clim. Past, 10, 123–136, 2014

128 M. M. Telesinski et al.: Water mass evolution of the Greenland Sea since late glacial times

to a maximum of 3–3.5◦C between 8 and 5.7 ka (Fig. 7).Thereafter it decreases stepwise to values around 2◦C be-tween 3.8 and 2.3 ka. Subsequently the record shows rapidlyincreasing temperatures with a peak value of ca. 3.5◦C at1.3 ka and a decrease to ca. 3◦C until today.

5.2 Stable isotopes

The planktic oxygen isotope records start with relativelyheavy and stable values of 4.3–4.9 ‰ (Fig. 2). After ca. 18 ka,sharp peaks of very light values (min. 0.15 ‰) occur (mostpronounced in cores PS1906 and PS1878). Similar peaks arealso found in cores PS1230, PS1243 (Bauch et al., 2001) andPS2887 (Nørgaard-Pedersen et al., 2003) that we used for thecorrelation. A trend towards lowerδ18O values commencesthereafter and lasts until the end of the record. A distinct,though irregular, variability can be observed within the trend(Figs. 2, 5).

The oldest part of all planktic carbon isotope records(> 18 ka) exhibits low and stable values around 0.0–0.3 ‰.Simultaneous with the lightδ18O peaks, theδ13C values de-crease slightly and a trend of increasing values commencesthereafter. Around 7 ka theδ13C values reach a high plateauof 0.7–1.0 ‰, which lasts until 3 ka and ends with a relativelysudden drop.

BecauseO. umbonatusand C. wuellerstorfiwere partlyabsent in the lowermost parts of our cores, the benthic sta-ble isotope records cover only the last 16 kyr (Fig. 6). Theoxygen isotope ratios of both benthic species generally showa decreasing trend parallel to the planktic record with val-ues ca. 0.7–1.0 ‰ heavier than those ofN. pachyderma(sin.). The epibenthic (C. wuellerstorfi) δ13C data follows theplankticδ13C records in terms of the main trends, but valuesare 0.2–1.0 ‰ higher and changes are of lower amplitude.The only major exception is the youngest (< 3 ka) part ofrecord PS1894 in which benthicδ13C values continue to riseslightly while the planktic record decreases. All data sets areavailable fromhttp://www.pangaea.de.

6 Discussion

6.1 Last Glacial Maximum (LGM)

The heavyδ18O values of> 4.5 ‰ in the Greenland Seaplanktic records (Fig. 2) are typical for the late LGM wa-ters in the Nordic Seas and Fram Strait (e.g., Sarnthein et al.,1995; Nørgaard-Pedersen et al., 2003). The low foraminiferalabundance and species diversity (Figs. 3, 4) are evidence of alow biological productivity in the Greenland Sea during theLGM. The latter might be a result of a perennial sea-ice coverthat would strongly limit the penetration of sunlight and re-duce the growth of phytoplankton that the foraminifera feedon.

Low δ13C values might suggest that the foraminifera livedin poorly ventilated water (cf. Duplessy et al., 1988), which

Age (ka)0 155 10

0.0

0.5

1.0

-0.5

0.0

0.5

1.0

0.0

0.5

1.0

0.0

0.5

1.0

0.0

0.5

1.0

-0.5

0.0

0.5

1.0

-0.5

2.5

3.0

3.5

4.0

4.5

2.5

3.0

3.5

3.0

3.5

4.0

3.0

3.5

4.0

3.0

3.5

4.0

4.5

2.5

3.0

3.5

4.0

4.5

2.5

3.0

3.5

4.0

4.5

δ13C (‰)

0.0

0.5

1.0

PS1878

PS2887

PS1243

PS1910

PS1894

PS1906

PS1230

Dissolution

Strong corrosion

δ18O (‰)

δ18O (‰)

δ18O (‰)

δ18O (‰)

δ18O (‰)

δ18O (‰)

δ18O (‰)

δ13C (‰)

δ13C (‰)

δ13C (‰)

δ13C (‰)

δ13C (‰)

Fig. 5. Planktic oxygen and carbon stable isotope records of coresfrom the Nordic Seas plotted vs. age (since 15 ka).

seems obvious in a perennially ice-covered ocean. However,relatively highδ13C values (> 0.7 ‰) are found at presentalso in the perennially ice-covered areas of the central Arc-tic Ocean (Spielhagen and Erlenkeuser, 1994). Therefore, wehesitate to relate the lowδ13C solely to the sea ice and/orstrong stratification of the upper water layers. In addition,the carbon cycle in the glacial ocean may have been much

Clim. Past, 10, 123–136, 2014 www.clim-past.net/10/123/2014/

M. M. Telesinski et al.: Water mass evolution of the Greenland Sea since late glacial times 129

1.0

1.5

Age (ka)0 155 10

4.04.0

4.5

5.0

4.04.0

4.5

5.0

PS1878

PS1910

δ18O (‰) δ13C (‰)

1.0

1.5

barren

modern

δ18O (‰)

δ13C (‰)

4.5

5.0

1.0

1.5

PS1894δ18O (‰)

δ13C (‰)

4.04.0

4.5

5.0

1.0

1.5modern

PS1243

δ18O (‰) δ13C (‰)

Fig. 6. Benthic oxygen (light and dark blue forC. wuellerstorfiandO. umbonatus, respectively) and carbon (red,C. wuellerstorfi)stable isotope records (in ‰ vs. PDB) of cores PS1894, PS1910,PS1878 and PS1243 vs. age (since 16 ka). Broken lines in PS1878and PS1243 mark modern (core-top)δ13C values ofC. wueller-storfi from the central Greenland Sea and site PS1243, respectively(Bauch and Erlenkeuser, 2003).

different than at present, which makes it difficult to unam-biguously interpret the carbon isotope record in this interval.

The LGM sediments, especially in cores PS1906 andPS1910, contain high amounts of coarse ice-rafted debris ifcompared to younger layers (Fig. 3). This indicates that nu-merous icebergs were passing the area and dropping partsof their freight. The IRD concentration is highly variableand marked by numerous prominent peaks. These peaksclearly coincide with foraminiferal abundance peaks in coresPS1894, PS1878 and partly in core PS1906. As already dis-cussed previously at site PS1878, the IRD peaks may repre-sent sporadic and relatively short intervals of somewhat ame-liorated conditions during times of decreased seasonal sea iceand slightly warmer surface water that resulted in a higher bi-ological productivity, an increased IRD delivery, and thus, ahigher sedimentation rate (Telesinski et al., 2013). The du-ration of these intervals may be overrepresented in the sedi-ment record, the most compelling example being the IRD andforaminiferal peaks in core PS1906 at ca. 25–30 cm (ca. 20–22 ka). Variable sedimentation rates and the uncertainties inour age models for the LGM make it difficult to say whether

the ameliorated conditions occurred basin wide or had a di-achronous nature.

6.2 Deglaciation

Prominent lowδ18O peaks accompanied by lowδ13C valuesare recorded in the deglacial parts of cores PS1878 (ca. 18 ka)and PS1906 (19.7 ka), as well as PS1230 (19.2 ka, Bauchet al., 2001) and PS2887 (19.6–18.7 ka, Nørgaard-Pedersenet al., 2003). Similar, though more obscure features can betraced in cores PS1894 and PS1910 (Fig. 2). We interpretthem as a result of the occurrence of isotopically light fresh-water that lowered the regional surface and near-surface wa-ter salinity (Sarnthein et al., 1995; Spielhagen et al., 2004;Telesinski et al., 2013). In cores PS1906 and PS1878 thehigh amplitude of theδ18O peaks is accompanied by low IRDabundance in the respective intervals, which may suggest thatthe freshwater originated from catastrophic discharges fromremote and/or terrestrial sources (e.g., outbursts from ice-dammed or subglacial lakes) rather than from a delivery bymelting icebergs or nearby glaciers.

On the other hand, in the well-dated record from corePS2887 (Nørgaard-Pedersen et al., 2003)δ18O values re-mained low for more than 2 kyr and the interpolated age ofthe spike in PS1878 (18–15 ka) fits well with the duration ofthe Heinrich stadial 1 (HS1). This may suggest that the fresh-water persisted in the Greenland Sea for several thousandyears and that the low foraminiferal abundance during thistime might be a result of a salinity decrease below the leveltolerated by planktic foraminifers. The lack of IRD mightthen be caused by a decrease in iceberg mobility and meltrate due to a rigid sea-ice cover that is expected to grow ontop of a cold and freshened water surface.

We realize that the reservoir ages during the deglacia-tion, especially in the event when massive freshwater dis-charges rapidly affected the ocean’s surface, remain highlyuncertain and may have been considerably larger than atpresent (Waelbroeck et al., 2001; Hanslik et al., 2010; Sternand Lisiecki, 2013). Although the low sedimentation rates insome of our cores increase the uncertainty of the14C-basedage models, our regional comparison shows that the majordeglacial freshwater discharges into the western Nordic Seaswere roughly coeval. We consider that these events werelikely triggered by the global sea level rise that started around20 ka (Clark and Mix, 2002) and came from the GreenlandIce Sheet and, perhaps, other circum-Arctic ice sheets (e.g.,Sarnthein et al., 1995).

The low carbon isotope ratios during these freshwaterevents (Fig. 2) might be an indication of a reduced venti-lation of the upper water column that was forced by a sta-ble, highly stratified surface water lid (cf. Sarnthein et al.,1995; Spielhagen et al., 2004). If the surface stratification ofthe Greenland Sea was indeed a basin-wide phenomenon, asshown by our records, it supports the interpretation of a slow-down of the Atlantic Meridional Overturning Circulation

www.clim-past.net/10/123/2014/ Clim. Past, 10, 123–136, 2014

130 M. M. Telesinski et al.: Water mass evolution of the Greenland Sea since late glacial times

(AMOC) during HS1 (McManus et al., 2004; Stanford et al.,2011; Telesinski et al., 2013). Furthermore, it also gives arough chronological framework for the onset of the deglacia-tion (ca. 18 ka).

Although our benthic oxygen isotope records do not coverthe initial part of HS1, theδ18O data ofO. umbonatusindi-cate, like the planktic record, a distinct decrease around 15.5–15.0 ka in PS1878 (Fig. 6). Such simultaneously occurringsurface and bottom water depletions inδ18O are often inter-preted as a result of brines rejected during sea-ice formation(e.g., Dokken and Jansen, 1999; Hillaire-Marcel and de Ver-nal, 2008). The likelihood that such brines formed in this wayand could sink into intermediate or even much greater depthswithout significant dilution remains unproven (for a discus-sion see also Bauch and Bauch, 2001; Rasmussen and Thom-sen, 2009). More recently, another scenario was proposed toexplain the occurrence of lightδ18O excursions during HS1(Stanford et al., 2011). It suggests that meltwater loaded withfine sediments entered the Nordic Seas below the sea sur-face as a hyperpycnal flow. In our record, the negative ben-thic δ18O excursion at 15.5–15.0 ka may result from such amechanism. However, in the record studied by Stanford etal. (2011), the benthic oxygen isotope depletion has an am-plitude larger than the planktic record, which is not observedin our record. Stanford et al. (2011) explain that, after los-ing the sediment load, the remaining relatively fresh, lowdensity and low-δ18O water rose towards the surface (whilestrongly mixing with ambient water), resulting in the am-plitude difference. Possibly the freshwater event in or closeto the Greenland Sea released both a sediment-loaded and alargely sediment-free freshwater plume, which in combina-tion may explain the strong near-surface and weaker bottomwater δ18O decreases. The sediment-loaded plume mecha-nism may also explain the significant thickness of the layersin cores PS1878 and PS2887 with lightδ18O values. Whilethe plume was losing its load, sedimentation rates likely in-creased dramatically in the affected areas, resulting in rela-tively thick fine-grained deposits. The duration of the fresh-water outbursts was probably significantly shorter than whatappears from the linear age interpolation between the datingpoints. However, sea ice may have played a role as a furtherfreshwater supplier by extending the range and duration ofthe freshwater event.

Following the freshwater event(s), plankticδ18O valuesincreased to∼ 4 ‰ or more (Figs. 2, 5), indicating that thefreshwater influence had decreased by this time. Also, theincreasingδ13C values may further suggest that either theventilation and/or the subsurface water structure with respectto stratification and bioproductivity had changed again.

The gradual and low–amplitude changes in the oxygen iso-tope record of PS1910 make it likely that the site was notdirectly influenced by major freshwater discharges. Short-lived freshwater events like those recorded in PS1878 be-tween 15 and 13 ka may have taken place at site PS1910 (aswell as PS1906 after the major event) but may be obscured by

the core’s low resolution. The generally heavyδ18O valuesthroughout the deglaciation, as well as later on, do indicate anotable inflow of Atlantic waters to this area.

Site PS1894 is located on the Greenland continental slope,in direct proximity to the EGC and under the sea-ice cover.Thus, the lowestδ18O values in this record might result fromthe weakest influence of AW and the lowest salinity, com-pared to other sites. Today, the salinity at site PS1894 is1–2 psu (practical salinity units) lower than farther to theeast, in the ice-free areas (Thiede and Hempel, 1991). Incontrast to the other sites, the main onset of the deglacia-tion (after 17 ka) seems to be characterized by a warming ofthe (sub)surface water rather than by a freshwater inflow, asthe oxygen isotope ratio decrease is accompanied by the ap-pearance of subpolar foraminiferal species (Figs. 2, 4). It ispossible that a minor enhancement of the Atlantic Water in-flow into the northwestern Greenland Sea coincided with andprobably also contributed to the termination of LGM-typeconditions and to the onset of deglacial changes at this site. Itmight seem counterintuitive that at this site, which is the onemost affected by PW today, the subpolar species appearedso early and in such high amounts (around 20 %), especiallysince even in late Holocene sediments this group constituteless than 20 % of the planktic fauna in this area (Husum andHald, 2012). However, an occurrence of subpolar species, inparticular those of smaller sizes, might indicate the advectionof Atlantic waters subducted below stratified and sea-ice cov-ered surface water layers (Bauch et al., 2001). Such a mech-anism is confirmed by modern oceanographic measurementson a W–E profile across the Greenland Sea, showing highersubsurface temperatures at stations covered with sea ice thanin ice-free areas (Thiede and Hempel, 1991).

Although the PS1894 oxygen isotope record does not in-dicate any major direct freshwater discharges in this area(Fig. 2), surface water salinity was apparently lower than atthe other sites, as indicated by the lowδ18O values, probablyas a result of the proximity of the ice margin and the EGC.

6.3 Younger Dryas (YD)

Only core PS1878 contains a clear lightδ18O excursion(12.8–11.9 ka) that, according to our age model, fits into thetime span of the YD (12.9–11.7 ka, cf. Broecker et al., 2010).However, less prominent oxygen isotope peaks of the sameage can be found in cores PS1906 and PS1910, as well asin PS1230 and PS1243 (Bauch et al., 2001). We associatethese peaks also with the YD and used them for the correla-tion of the cores (Figs. 2, 5). The oxygen isotope record ofcore PS1894 contains no indications that could be linked tothe YD cooling. However, as already mentioned above, thisrecord exhibits generally lowδ18O values (< 3.5 ‰ acrossthe YD interval), often lower than those of the lightδ18O ex-cursions in the other records. It indicates that this site was un-der a constant influence of relatively fresh PW, which makesthe identification of a YD freshwater signal difficult.

Clim. Past, 10, 123–136, 2014 www.clim-past.net/10/123/2014/

M. M. Telesinski et al.: Water mass evolution of the Greenland Sea since late glacial times 131

In general, the origin and cause of the YD has been a mat-ter of debate for decades now (e.g., Broecker et al., 1989;Teller et al., 2005; Murton et al., 2010; Fahl and Stein, 2012;Fisher and Lowell, 2012; Not and Hillaire-Marcel, 2012). Adischarge of large amounts of freshwater from the deglacialLake Agassiz to the North Atlantic and, in particular, tothe areas of deep water convection is still considered themost likely cause for the YD (Broecker et al., 2010). Whilea rerouting from the Gulf of Mexico to the St. LawrenceRiver was proposed earlier as one triggering mechanism(Broecker et al., 1989), recent modeling results of Condronand Winsor (2012) indicate that only a freshwater dischargeto the Arctic (probably via the Mackenzie Valley; cf. Tarasovand Peltier, 2006) was able to reach the deep water formationregions in the North Atlantic (including our study area) andweaken the AMOC sufficiently to trigger the YD. Our find-ing of a coeval lowδ18O signal at∼ 13 ka in Fram Strait andGreenland Sea records is in support of hypotheses that sug-gest the Arctic region (including the East Greenland margin)as the main source area for the freshwater pulse. It seems un-likely that a large-volume freshwater transport occurred fromthe south, i.e., opposite to the dominant flow direction in theGreenland Sea. Following the modeling results of Condronand Winsor (2012), our data make the hypothesis of an Arc-tic trigger for the YD cold event more convincing.

6.4 Holocene

Although the onset of the Holocene in our records isexpressed by the typical proxy changes for a glacial–interglacial transition, it looks different at the individualsites. In the southern Fram Strait (site PS1906) both theforaminiferal abundance and the percentage of subpolarspecies increased relatively rapidly around 12 ka. This waspossibly related to the onset of enhanced surface flow of theNAC branch along the eastern Nordic Seas following shortlyupon the YD (e.g., Sarnthein et al., 2003; Hald et al., 2007;Risebrobakken et al., 2011). Farther south, at sites PS1910and PS1878, that increase was much more gradual and high-est values there were reached between 10 and 8 ka. Subsur-face waters at site PS1878 also warmed more slowly reach-ing∼ 3◦C only around 8 ka (Fig. 7). This confirms that in theearliest Holocene the influence of the melting Greenland IceSheet was strong and acted as a negative feedback to the or-bitally forced climatic optimum (cf. Blaschek and Renssen,2013). The decrease of IRD deposition at three of our sites(PS1906, PS1910, PS1878) indicates that only few icebergsstill reached the southeastern Greenland Sea due to a north-westward expansion of the warmer water masses. The de-crease in IRD deposition was less prominent in the southernFram Strait at this time, most probably due to the proximityof the Transpolar Drift which still brought numerous icebergsfrom the Arctic Ocean into this region. Site PS1894 showedthe least significant changes at the onset of the Holocene(Figs. 8, 9). The proxy data indicate that the eastern part of

Planktic δ18O (‰)

0

5k

10k

Age (ka)0 155 10

2.0

3.0

4.0

2.5

3.0

3.5

4.0

4.5

Subsurface temperature(100 m) (oC)

Planktic foraminifera/g

Fig. 7.Absolute subsurface temperatures calculated using the trans-fer function of Husum and Hald (2012) on planktic foraminiferafrom core PS1878 and planktic oxygen isotope and total plank-tic foraminiferal abundance records. Calculated temperatures below2◦C should be considered uncertain.

the Greenland Sea remained under polar conditions with coldsurface water, numerous icebergs and sea-ice cover for mostof the time.

For the entire study area it is difficult to determine a co-eval thermal maximum, which we define as the interval withthe highest percentage of subpolar species (or highest abso-lute temperatures in core PS1878). Not only the course of theinitial warming but also the duration and termination of thewarmest interval differed between the individual sites. In thesouthern Fram Strait (site PS1906) the thermal maximum in-terval apparently started already around 11.5 ka and endedgradually between 7 and 3 ka. At sites PS1894, PS1910and PS1878 it was significantly shorter and can be dated toca. 11–9.5, 10.5–7 and 8–5.5 ka, respectively. This might atleast in part be attributed to uncertainties in the correlationbetween the records, which was mainly based on the iso-tope records. Nevertheless, the onset of the warmest intervalaround 11–9 ka accords with many other Nordic Seas records(e.g., Bauch et al., 2001; Sarnthein et al., 2003; Giraudeauet al., 2010; Risebrobakken et al., 2011; Husum and Hald,2012) where the beginning of the Holocene thermal maxi-mum (HTM) was related to maximum insolation in the highlatitudes (e.g., Andersen et al., 2004; Risebrobakken et al.,2011) and the maximum in northward oceanic heat trans-port by the NAC (Risebrobakken et al., 2011). The late onsetof the thermal maximum at site PS1878 might have resultedfrom the large distance between the site and the core of theNAC (Fig. 1). Since this onset was time-transgressive alongthe main pathway of the NAC (Hald et al., 2007), a similardevelopment may also be expected westward. In principle,the presence of freshwater in the earliest Holocene (Fig. 5)

www.clim-past.net/10/123/2014/ Clim. Past, 10, 123–136, 2014

132 M. M. Telesinski et al.: Water mass evolution of the Greenland Sea since late glacial times

0

5k

10k

0

10k

20k

0

5k

10k

30k

15k

0

100

200

300

400

0

100

200

300

0

100

200

300

0

100

200

300

400

400

400

Age (ka)0 155 10

Planktic foraminifera/g IRD/g

PS1878

PS1910

PS1894

PS1906

0

60k

20k

40k

Fig. 8. Planktic foraminifera and IRD abundance (per 1 g dry sedi-ment) of cores used in this study, plotted vs. age (since 15 ka).

may have had a cooling effect, but this should have also beenthe case at the other three sites. Furthermore, the relativeproximity of the remnant Greenland Ice Sheet, still deliveringcold meltwater, could have acted as a negative feedback forthe early Holocene warming (Blaschek and Renssen, 2013).The transfer function yielded temperatures of 3–3.5◦C at100 m water depth between 8 and 5.5 ka. This is significantlywarmer than modern temperatures at this depth in the Vester-isbanken area (max. 2◦C, Thiede and Hempel, 1991) andindicates that the advection of Atlantic waters to the areabetween 8 (or even 10.5) and 5.5 ka was stronger than atpresent.

The transition between the thermal maximum and theNeoglacial cooling as found in our records between ca. 6–5 and 3 ka was also not simultaneous and, with the exceptionof PS1878, was much more gradual than the early Holocenewarming (Figs. 7, 9). Although in cores PS1906 and PS1878relatively late, such a timing is in good general agreementwith other studies (e.g., Bauch et al., 2001; Sarnthein et al.,2003; Hald et al., 2007; Giraudeau et al., 2010; Rasmussenand Thomsen, 2010; Husum and Hald, 2012; Werner et al.,2013; for some remarkable exceptions see Risebrobakken et

0%

50%

100%

0%

50%

0%

50%

0%

50%

100%

100%

100%

Age (ka)0 155 10

T.q.

N.p.(s)

N.p.(d)

PS1878

PS1910

PS1894

PS1906

Fig. 9. Relative abundance of the three most common plankticforaminifera species in cores used in this study, plotted vs. age(since 15 ka). Abbreviations as in Fig. 4. Asterisks mark the modern(core-top) values (own data).

al., 2011). The Neoglacial cooling was very likely forcedprimarily by decreasing insolation (Andersen et al., 2004),while the regional variations in its timing and scale are amanifestation of the reorganization of the specific water massconfiguration in the Nordic Seas. This reorganization in-volved, e.g., changes in the strength and routing of the in-dividual NAC and EGC branches, the amount of meltwater,and the relocation of the convection centers and eventuallyresulted in the establishment of a type of overall water massdistribution and circulation as we see it today (Bauch et al.,2001).

Theδ13C “plateau” between ca. 7 and 3 ka (Fig. 5) is com-mon in Nordic Seas records (e.g., Vogelsang, 1990; Fronvaland Jansen, 1997; Bauch et al., 2001; Sarnthein et al., 2003;Risebrobakken et al., 2011; Werner et al., 2013) and re-flects a period of maximum ventilation of subsurface wa-ters, relatively stable and modern-like environmental condi-tions (Bauch et al., 2001; Sarnthein et al., 2003), and per-haps a significantly changed surface water structure (Bauchand Weinelt, 1997). Its onset also corresponds to the es-tablishment of the modern Iceland–Scotland Overflow Wa-ter (Thornalley et al., 2010) and AMOC strengthening (Hall

Clim. Past, 10, 123–136, 2014 www.clim-past.net/10/123/2014/

M. M. Telesinski et al.: Water mass evolution of the Greenland Sea since late glacial times 133

et al., 2004). Our benthicδ13C records (Fig. 6) and otherbenthic records from the Nordic Seas (Bauch et al., 2001;Sarnthein et al., 2003) also exhibit relatively high values inthis interval. This implies good ventilation of the bottom wa-ter and suggests that intensive deep water convection tookplace in the Nordic Seas between 7 and 3 ka. An AMOCintensification after 7 ka would also imply enhanced inflowof AW and PW into the Greenland Sea since the increasedconvection rate must be compensated by an increased in-flow of both saline AW from the south and cold PW fromthe north. The increasing influence of cold PW amplified theNeoglacial cooling in the area, which might explain the rel-atively rapid warm–cold transition at site PS1878 at 5.5 ka,similar to what was found in the eastern Fram Strait (Werneret al., 2013). The cooling, in turn, likely enhanced sea-iceformation and strong winds, which opened up ice leads andprovoked super-cooling processes further intensifying deepwater formation. The bottom water at site PS1878 was par-ticularly well ventilated compared to other Holocene recordsfrom the Nordic Seas (Fig. 6, cf. Bauch et al., 2001; Sarntheinet al., 2003). This indicates that deep convection was takingplace in the central Greenland Sea, in the proximity of thissite, with maximum vigor between 7 and 3 ka.

The plankticδ13C decrease after around 3 ka, observedin all our records (Fig. 5), appears to be a sound strati-graphic time marker in many Nordic Seas records (Bauch andWeinelt, 1997). Moreover, as it occurs all across the NordicSeas including the Barents Sea (e.g., Vogelsang, 1990;Fronval and Jansen, 1997; Bauch et al., 2001; Sarnthein etal., 2003; Risebrobakken et al., 2011; Werner et al., 2013)this event clearly bears a supraregional implication. A recon-struction of sea-ice conditions in the Fram Strait (Müller etal., 2012) revealed increasing sea-ice coverage since 8 ka. Atabout 3 ka a further significant expansion of the sea-ice coveroccurred and sea-ice conditions became more fluctuating. Al-though in the record from the East Greenland Shelf (Mülleret al., 2012) no increase in sea-ice coverage is observed be-fore 3 ka (perhaps because this area was strongly influencedby sea ice during the entire Holocene), the total sea-ice coverin the Nordic Seas was probably increasing. A similar timingin ice increase is also confirmed for the western Barents Seaslope (Sarnthein et al., 2003). Renssen et al. (2006) indicatedthat a negative solar irradiance anomaly and associated cool-ing may cause an expansion of sea ice and a temporary relo-cation of deep water formation sites in the Nordic Seas. Oneof the strongest anomalies in the Holocene occurred between2.85 and 2.6 ka and could have triggered the sudden increasein sea-ice extent, increased the stratification of the upper wa-ter layers and decreased the ventilation of the subsurface wa-ter. This solar irradiance anomaly may also have triggeredthe increase in ice rafting in the North Atlantic around thattime (Bond et al., 2001; Renssen et al., 2006).

In two of our benthic carbon isotope records (PS1910 andPS1878, Fig. 6) we observe a decrease of values around 3 ka,which paralleled that in the planktic record. This is, however,

not generally the case elsewhere (e.g., at site PS1894 orin the central and eastern Nordic Seas; Bauch et al., 2001;Sarnthein et al., 2003; Werner et al., 2013). The decrease inbenthicδ13C values suggests that, probably as a result of amore extensive sea-ice cover and a stronger stratification ofthe upper water layers, deep convection diminished or didnot reach down to maximum depth of the basins any longer(Renssen et al., 2006). Sites PS1910 and PS1878 were mostlikely located closest to the convection center and the de-crease in convection rate or depth was recorded here as abenthicδ13C decrease. At other sites that were located far-ther from the convection center, the bottom waters were notas well ventilated before 3 ka and therefore the relative de-crease in ventilation was not large enough to be recorded inthe sediment archive.

As described earlier (Telesinski et al., 2013), significantchanges are observed in core PS1878 since 3 ka. The totalforaminiferal abundance (Fig. 8) and percentage of subpo-lar species (Fig. 9) increase and planktic carbon and oxygenisotope ratios decrease. These changes were interpreted asevidence of a warming of subsurface waters caused by anNAO-induced increase in AW inflow, amplified by strongerupper water layers stratification (Telesinski et al., 2013). Thebenthic data from core PS1878 show that the planktic and thetwo benthic oxygen isotope records, which in the older partof the record ran roughly parallel to each other, diverge after3 ka (Figs. 5, 6). The planktic values begin to decrease afterthe stable interval of the Middle Holocene andO. umbonatusvalues start to increase, whileC. wuellerstorfioxygen iso-tope ratios follow the earlier slightly decreasing trend. As aresult of the decrease in convection rate and depth, probablynot only the surface and bottom waters began to differentiatefrom each other, but also, at a smaller scale, the epibenthicand infaunal biotopes became more distinct than before dueto more stagnant conditions.

In the other records from the Greenland Sea the changesafter 3 ka are not as obvious. At site PS1894, strongly af-fected by PW, the conditions seem to be similar to those atother sites during the LGM, with at least seasonally openwater conditions and somewhat warmer upper water layers(Figs. 5, 8, 9; see discussion above). Virtually no indicationsof warming or increased AW influence can be found at sitesPS1906 and PS1910 at that time.

The high-resolution subsurface temperature reconstruc-tion from site PS1878 indicates a warming from ca. 2◦C at2.5 ka to 3.5◦C at 1.5 ka, confirming that conditions in thecentral Greenland Sea in the late Holocene were compara-ble to the early Holocene warm interval (cf. Telesinski etal., 2013). The scale of this warming (1.5◦C) is comparableto that of the modern warming in the Arctic (e.g., Spielha-gen et al., 2011) though, of course, on a significantly longertimescale. A comparison with the faunal data from otherGreenland Sea cores (Fig. 9) shows that this phenomenonwas confined to the central part of the Greenland Sea andmay have resulted from the co-occurrence of the stronger

www.clim-past.net/10/123/2014/ Clim. Past, 10, 123–136, 2014

134 M. M. Telesinski et al.: Water mass evolution of the Greenland Sea since late glacial times

water column stratification and the enhanced inflow of At-lantic waters to the site.

7 Summary and conclusions

With the records presented in this study we were able here toreconstruct for the first time a millennial- to multicentennial-scale image of the late glacial and Holocene paleoceano-graphic evolution in the northern and central Greenland Sea.Despite the low sedimentation rates in the northern part ofthe study area and the related chronological uncertainties,the correlation and comparison with a high resolution recordPS1878 (Telesinski et al., 2013) allowed us to study the spa-tial and temporal variability of the most important oceano-graphic processes. The integration of surface, subsurface andbottom water proxies gave an almost complete image.

During the LGM environmental conditions were to alarge extent similar across the Greenland Sea. Cold con-ditions with a dense sea-ice cover, numerous icebergs andlow biological productivity prevailed in the area. During thedeglaciation the Greenland Sea was affected by freshwaterdischarges. Although we argue that they were roughly simul-taneous (between 18 and 15 ka) and may have had a com-mon trigger mechanism, their sources and character wereprobably different. During the YD the Greenland Sea was af-fected by a major deglacial freshwater discharge most prob-ably originating from the Arctic. Our data suggest a thickerbut weaker halocline and a deepening of AW.

The onset, duration and decline of the early Holocenewarm interval were apparently different in age and scale ateach site, reflecting regional differences in the reorganiza-tion of the ocean circulation of the area. As peak warmingoccurred not simultaneously at all sites, the thermal max-imum in the central Greenland Sea was not reached untilca. 8 ka, which is relatively late compared to other NordicSeas records. Maximum subsurface temperatures (> 3◦C)were higher than at present, indicating a strong influence ofAtlantic waters. Since 7 ka highδ13C values, both plankticand benthic, indicate the establishment of the modern oceancirculation system in the Nordic Seas with maximum deepconvection in the Greenland Sea. Despite a strong AMOC,decreasing insolation led to the Neoglacial cooling and anincrease in sea-ice coverage. At 3–2.8 ka a solar irradianceminimum may have triggered a rapid expansion of the sea-icecover that led to a stronger stratification of the upper waterlayers and, subsequently, to a weakening of deep convectionin the Greenland Sea and of the AMOC. Eventually, an in-crease in AW inflow into the Nordic Seas led to subsurfacewarming in the central Greenland Sea (site PS1878). Proba-bly due to a relatively stable water stratification, as well as in-creased presence of sea ice (and thus an isolation of the sub-surface water from the atmosphere and other water masses),subsurface temperatures rose again to a level comparablewith the early Holocene thermal maximum at this site.

Comparison of the Greenland Sea records suggests inso-lation to be the primary driver controlling the regional pa-leoceanographic evolution while the routing and intensity ofAW inflow seems to control the spatial variability in the area.Other processes – such as sea-ice formation, deep convec-tion, freshwater discharges, etc. – also played an importantrole in the observed local differences.

Acknowledgements.This work is a contribution to the CASEInitial Training Network funded by the European Community’s7th Framework Programme FP7 2007/2013, Marie Curie Ac-tions, under Grant Agreement no. 238111. We thank reviewersJuliane Müller and Thomas Cronin, as well as Christelle Notand Kirstin Werner for their constructive criticism and sugges-tions which improved the manuscript. Our gratitude goes toKatrine Husum for her help with performing the transfer func-tion calculations. We are grateful to Lulzim Haxhiaj as well asHelmut Erlenkeuser and his staff for performing the stable isotopemeasurements and to the Leibniz Laboratory, Kiel University, andthe Poznan Radiocarbon Laboratory for the AMS14C datings.

The service charges for this open access publicationhave been covered by a Research Centre of theHelmholtz Association.

Edited by: H. Renssen

References

Andersen, C., Koç, N., Jennings, A. E., and Andrews, J.T.: Nonuniform response of the major surface currents inthe Nordic Seas to insolation forcing: Implications for theHolocene climate variability, Paleoceanography, 19, PA2003,doi:10.1029/2002PA000873, 2004.

Bauch, D. and Bauch, H. A.: Last glacial benthic foraminiferalδ18Oanomalies in the polar North Atlantic: A modern analogue eval-uation, J. Geophys. Res., 106, 9135–9143, 2001.

Bauch, H. A. and Erlenkeuser, H.: Interpreting Glacial-InterglacialChanges in Ice Volume and Climate From Subarctic Deep Wa-ter Foraminiferalδ18O, in: Earth’s Climate and Orbital Eccen-tricity: The Marine Isotope Stage 11 Question, Geoph. Monog.Series 137, edited by: Droxler, L. H., Poore, A. W., and Burckle,R. Z., American Geophysical Union, Washington, D.C., 87–102,2003.

Bauch, H. A. and Weinelt, M. S.: Surface water changes in the Nor-wegian Sea during last deglacial and Holocene times, QuaternarySci. Rev., 16, 1115–1124, 1997.

Bauch, H. A., Erlenkeuser, H., Spielhagen, R. F., Struck, U.,Matthiessen, J., Thiede, J., and Heinemeier, J.: A multiproxy re-construction of the evolution of deep and surface waters in thesubarctic Nordic seas over the last 30,000 yr, Quaternary Sci.Rev., 20, 659–678, 2001.

Blaschek, M. and Renssen, H.: The Holocene thermal maximumin the Nordic Seas: the impact of Greenland Ice Sheet melt andother forcings in a coupled atmosphere–sea-ice–ocean model,Clim. Past, 9, 1629–1643, doi:10.5194/cp-9-1629-2013, 2013.

Clim. Past, 10, 123–136, 2014 www.clim-past.net/10/123/2014/

M. M. Telesinski et al.: Water mass evolution of the Greenland Sea since late glacial times 135

Bond, G. C., Kromer, B., Beer, J., Muscheler, R., Evans, M.N., Showers, W., Hoffmann, S., Lotti-Bond, R., Hajdas, I.,and Bonani, G.: Persistent solar influence on North At-lantic climate during the Holocene, Science, 294, 2130–2136,doi:10.1126/science.1065680, 2001.

Broecker, W. S., Kennett, J. P., Flower, B. P., Teller, J. T., Trum-bore, S., Bonani, G., and Wolfli, W.: Routing of meltwater fromthe Laurentide Ice Sheet during the Younger Dryas cold episode,Nature, 341, 318–321, 1989.

Broecker, W. S., Denton, G. H., Edwards, R. L., Cheng, H., Al-ley, R. B., and Putnam, A. E.: Putting the Younger Dryascold event into context, Quaternary Sci. Rev., 29, 1078–1081,doi:10.1016/j.quascirev.2010.02.019, 2010.

Carstens, J., Hebbeln, D., and Wefer, G.: Distribution of plankticforaminifera at the ice margin in the Arctic (Fram Strait), Mar.Micropaleontol., 29, 257–269, 1997.

Clark, D. L. and Hanson, A.: Central Arctic Ocean sediment tex-ture: A key to ice transport mechanism, in: Glacial-marine sed-imentation, edited by: Molnia, B. F., Plenum Press, New York,301–330, 1983.

Clark, P. U. and Mix, A. C.: Ice sheets and sea level ofthe Last Glacial Maximum, Quaternary Sci. Rev., 21, 1–7,doi:10.1016/S0277-3791(01)00118-4, 2002.

Condron, A. and Winsor, P.: Meltwater routing and theYounger Dryas, P. Natl. Acad. Sci. USA, 109, 19928–19933,doi:10.1073/pnas.1207381109, 2012.

Dokken, T. M. and Jansen, E.: Rapid changes in the mechanismof ocean convection during the last glacial period, Nature, 401,458–461, 1999.

Duplessy, J. C., Labeyrie, L. D., and Blanc, P. L.: Norwegian SeaDeep Water Variations over the Last Climatic Cycle: Paleo-Oceanographical Implications, in: Long and Short Term Vari-ability of Climate, edited by: Wanner, H. and Siegenthaler, U.Springer, New York, 83–116, 1988.

Fahl, K. and Stein, R.: Modern seasonal variability anddeglacial/Holocene change of central Arctic Ocean sea-ice cover:New insights from biomarker proxy records, Earth Planet. Sc.Lett., 351-352, 123–133, doi:10.1016/j.epsl.2012.07.009, 2012.

Fisher, T. G. and Lowell, T. V.: Testing northwest drainage fromLake Agassiz using extant ice margin and strandline data,Quatern. Int., 260, 106–114, doi:10.1016/j.quaint.2011.09.018,2012.

Fronval, T. and Jansen, E.: Eemian and early Weichselian (140–60 ka) paleoceanography and paleoclimate in the Nordic seaswith comparisons to Holocene conditions, Paleoceanography, 12,443–462, 1997.

Giraudeau, J., Grelaud, M., Solignac, S., Andrews, J. T., Moros,M., and Jansen, E.: Millennial-scale variability in Atlantic wa-ter advection to the Nordic Seas derived from Holocene coccol-ith concentration records, Quaternary Sci. Rev., 29, 1276–1287,doi:10.1016/j.quascirev.2010.02.014, 2010.

Hald, M., Andersson, C., Ebbesen, H., Jansen, E., Klitgaard-Kristensen, D., Risebrobakken, B., Salomonsen, G. R., Sarn-thein, M., Sejrup, H. P., and Telford, R. J.: Variations in tem-perature and extent of Atlantic Water in the northern North At-lantic during the Holocene, Quaternary Sci. Rev., 26, 3423–3440,doi:10.1016/j.quascirev.2007.10.005, 2007.

Hall, I. R., Bianchi, G. G., and Evans, J. R.: Centennialto millennial scale Holocene climate-deep water linkage inthe North Atlantic, Quaternary Sci. Rev., 23, 1529–1536,doi:10.1016/j.quascirev.2004.04.004, 2004.

Hansen, B. and Østerhus, S.: North Atlantic–Nordic Seas ex-changes, Prog. Oceanogr., 45, 109–208, doi:10.1016/S0079-6611(99)00052-X, 2000.

Hanslik, D., Jakobsson, M., Backman, J., Björck, S., Sel-lén, E., O’Regan, M., Fornaciari, E., and Skog, G.: Quater-nary Arctic Ocean sea ice variations and radiocarbon reser-voir age corrections, Quaternary Sci. Rev., 29, 3430–3441,doi:10.1016/j.quascirev.2010.06.011, 2010.

Hillaire-Marcel, C. and de Vernal, A.: Stable isotope clue toepisodic sea ice formation in the glacial North Atlantic, EarthPlanet. Sc. Lett., 268, 143–150, doi:10.1016/j.epsl.2008.01.012,2008.

Husum, K. and Hald, M.: Arctic planktic foraminiferalassemblages: Implications for subsurface temperaturereconstructions, Mar. Micropaleontol., 96–97, 38–47,doi:10.1016/j.marmicro.2012.07.001, 2012.

Juggins, S.: C2, Version 1.7.2, Software for Ecological and Palaeoe-cological Data Analysis and Visualization,http://www.campus.ncl.ac.uk/staff/Stephen.Juggins/index.html, University of New-castle, Newcastle upon Tyne, UK, 2011.

Marshall, J. and Schott, F.: Open-ocean convection: Observations,theory, and models, Rev. Geophys., 37, 1–64, 1999.

McManus, J. F., Francois, R., Gherardi, J.-M., Keigwin, L. D.,and Brown-Leger, S.: Collapse and rapid resumption of Atlanticmeridional circulation linked to deglacial climate changes, Na-ture, 428, 834–837, doi:10.1038/nature02494, 2004.

Müller, J., Werner, K., Stein, R., Fahl, K., Moros, M., andJansen, E.: Holocene cooling culminates in sea ice os-cillations in Fram Strait, Quaternary Sci. Rev., 47, 1–14,doi:10.1016/j.quascirev.2012.04.024, 2012.

Murton, J. B., Bateman, M. D., Dallimore, S. R., Teller, J. T., andYang, Z.: Identification of Younger Dryas outburst flood pathfrom Lake Agassiz to the Arctic Ocean, Nature, 464, 740–743,doi:10.1038/nature08954, 2010.

Nørgaard-Pedersen, N., Spielhagen, R. F., Erlenkeuser, H., Grootes,P. M., Heinemeier, J., and Knies, J.: Arctic Ocean during the LastGlacial Maximum: Atlantic and polar domains of surface wa-ter mass distribution and ice cover, Paleoceanography, 18, 1–19,doi:10.1029/2002PA000781, 2003.

Not, C. and Hillaire-Marcel, C.: Enhanced sea-ice export fromthe Arctic during the Younger Dryas, Nature Comm., 3, 647,doi:10.1038/ncomms1658, 2012.

Nürnberg, D., Wollenburg, I., Dethleff, D., Eicken, H., Kassens,H., Letzig, T., Reimnitz, E., and Thiede, J.: Sediments in Arc-tic sea ice: implications for entrainment, transport and release,Mar. Geol., 104, 185–214, 1994.

Rasmussen, T. L. and Thomsen, E.: Stable isotope signalsfrom brines in the Barents Sea: Implications for brine for-mation during the last glaciation, Geology, 37, 903–906,doi:10.1130/G25543A.1, 2009.

Rasmussen, T. L. and Thomsen, E.: Holocene tempera-ture and salinity variability of the Atlantic Water in-flow to the Nordic seas, Holocene, 20, 1223–1234,doi:10.1177/0959683610371996, 2010.

www.clim-past.net/10/123/2014/ Clim. Past, 10, 123–136, 2014

136 M. M. Telesinski et al.: Water mass evolution of the Greenland Sea since late glacial times

Reimer, P., Baillie, M., Bard, E., Bayliss, A., Beck, J. W., Blackwell,P. G., Bronk Ramsey, C., Buck, C. E., Burr, G. S., Edwards, R.L., Friedrich, M., Grootes, P. M., Guilderson, T. P., Hajdas, I.,Heaton, T. J., Hogg, A. G., Hughen, K. A., Kaiser, K. F., Kromer,B., McCormac, F. G., Manning, S. W., Reimer, R. W., Richards,D. A., Southon, J. R., Talamo, S., Turney, C. S. M., van der Plicht,J., and Weyhenmeyer, C. E.: IntCal09 and Marine09 radiocarbonage calibration curves, 0–50,000 years cal BP, Radiocarbon, 51,1111–1150, 2009.

Renssen, H., Goosse, H., and Muscheler, R.: Coupled climate modelsimulation of Holocene cooling events: oceanic feedback am-plifies solar forcing, Clim. Past, 2, 79–90, doi:10.5194/cp-2-79-2006, 2006.

Risebrobakken, B., Dokken, T., Smedsrud, L. H., Andersson, C.,Jansen, E., Moros, M., and Ivanova, E. V.: Early Holocene tem-perature variability in the Nordic Seas: The role of oceanic heatadvection versus changes in orbital forcing, Paleoceanography,26, PA4206, doi:10.1029/2011PA002117, 2011.

Rudels, B. and Quadfasel, D.: Convection and deep water formationin the Arctic Ocean-Greenland Sea System, J. Mar. Syst., 2, 435–450, doi:10.1016/0924-7963(91)90045-V, 1991.

Rudels, B., Friedrich, H. J., and Quadfasel, D.: The Arctic Circum-polar Boundary Current, Deep Sea-Res. Pt. II, 46, 1023–1062,doi:10.1016/S0967-0645(99)00015-6, 1999.

Sarnthein, M., Jansen, E., Weinelt, M., Arnold, M., Duplessy, J.C., Erlenkeuser, H., Flatøy, A., Johannessen, G., Johannessen, T.,Jung, S., Koc, N., Labeyrie, L., Maslin, M., Pflaumann, U., andSchulz, H.: Variations in Atlantic surface ocean paleoceanogra-phy, 50◦–80◦ N: A time-slice record of the last 30,000 years, Pa-leoceanography, 10, 1063–1094, 1995.

Sarnthein, M., van Kreveld, S., Erlenkeuser, H., Grootes, P. M.,Kucera, M., Pflaumann, U., and Schulz, M.: Centennial-to-millennial-scale periodicities of Holocene climate and sedimentinjections off the western Barents shelf, 75◦ N, Boreas, 32, 447–461, doi:10.1080/03009480310003351, 2003.

Spielhagen, R. F. and Erlenkeuser, H.: Stable oxygen and car-bon isotopes in planktic foraminifers from Arctic Ocean sur-face sediments: Reflection of the low salinity surface water layer,Mar. Geol., 119, 227–250, doi:10.1016/0025-3227(94)90183-X,1994.

Spielhagen, R. F., Baumann, K.-H., Erlenkeuser, H., Nowaczyk,N. R., Nørgaard-Pedersen, N., Vogt, C., and Weiel, D.:Arctic Ocean deep-sea record of northern Eurasian icesheet history, Quaternary Sci. Rev., 23, 1455–1483,doi:10.1016/j.quascirev.2003.12.015, 2004.

Spielhagen, R. F., Werner, K., Aagaard-Sørensen, S., Zamel-czyk, K., Kandiano, E., Budeus, G., Husum, K., Marchitto,T. M., and Hald, M.: Enhanced Modern Heat Transfer tothe Arctic by Warm Atlantic Water, Science, 331, 450–453,doi:10.1126/science.1197397, 2011.

Stanford, J. D., Rohling, E. J., Bacon, S., Roberts, A. P., Grousset,F. E., and Bolshaw, M.: A new concept for the paleoceanographicevolution of Heinrich event 1 in the North Atlantic. QuaternarySci. Rev., 30, 1047–1066, doi:10.1016/j.quascirev.2011.02.003,2011.

Stern, J. V. and Lisiecki, L. E.: North Atlantic circulation and reser-voir age changes over the past 41,000 years, Geophys. Res. Lett.,40, 3693–3697, doi:10.1002/grl.50679, 2013.

Stuiver, M. and Reimer, P. J.: Radiocarbon calibration program, Ra-diocarbon, 35, 215–230, 1993.

Swift, J.: The Arctic Waters, in: The Nordic Seas, edited by: Hurdle,B., Springer, New York, 129–151, 1986.

Tarasov, L. and Peltier, W. R.: A calibrated deglacial drainagechronology for the North American continent: evidence of anArctic trigger for the Younger Dryas, Quaternary Sci. Rev., 25,659–688, doi:10.1016/j.quascirev.2005.12.006, 2006.

Telesinski, M. M., Spielhagen, R. F., and Lind, E. M.: A high-resolution Late Glacial and Holocene paleoceanographic recordfrom the Greenland Sea, Boreas, doi:10.1111/bor.12045, inpress, 2013.

Teller, J. T., Boyd, M., Yang, Z., Kor, P. S. G., andMokhtari Fard, A.: Alternative routing of Lake Agassiz over-flow during the Younger Dryas: new dates, paleotopography,and a re-evaluation, Quaternary Sci. Rev., 24, 1890–1905,doi:10.1016/j.quascirev.2005.01.008, 2005.

Thiede, J. and Hempel, G.: The Expedition ARKTIS-VII/1 of RV“POLARSTERN” in 1990, Ber. Polarforsch., 80, 137 pp., 1991.

Thornalley, D. J. R., Elderfield, H., and McCave, I. N.: Intermedi-ate and deep water paleoceanography of the northern North At-lantic over the past 21,000 years, Paleoceanography, 25, 1–17,doi:10.1029/2009PA001833, 2010.

Vogelsang, E.: Paläo-Ozeanographie des Europäischen Nordmeeresan Hand stabiler Kohlenstoff- und Sauerstoffisotope – Paleo-ceanography of the Nordic seas on the basis of stable carbonand oxygen isotopes, Berichte aus dem Sonderforschungsbere-ich 313, Nr. 23, Univ. Kiel, Kiel, 1990.

Waelbroeck, C., Duplessy, J. C., Michel, E., Labeyrie, L., Pail-lard, D., and Duprat, J.: The timing of the last deglacia-tion in North Atlantic climate records, Nature, 412, 724–727,doi:10.1038/35089060, 2001.

Werner, K., Spielhagen, R. F., Bauch, D., Christian Hass, H., andKandiano, E.: Atlantic Water advection versus sea-ice advancesin the eastern Fram Strait during the last 9 ka: Multiproxy ev-idence for a two-phase Holocene, Paleoceanography, 28, 283–295, doi:10.1002/palo.20028, 2013.

Clim. Past, 10, 123–136, 2014 www.clim-past.net/10/123/2014/

5. Evolution of the central Nordic Seas

over the last 20 thousand years

70

5. Evolution of the central Nordic Seas over the last 20 thousand years

Evolution of the central Nordic Seas

over the last 20 thousand years

M. M. Telesiński1, H. A. Bauch

1, 2, R. F. Spielhagen

1, 2, and E. S. Kandiano

1, 3

1 GEOMAR Helmholtz Centre for Ocean Research Kiel, Wischhofstrasse 1-3,

24148 Kiel, Germany,

2 Academy of Sciences, Humanities, and Literature, 53151 Mainz, Germany

3 Currently: Royal Netherlands Institute for Sea Research, Texel, The Netherlands

Abstract

The deep and surface water paleoceanographic evolution of the central Nordic

Seas over the last 20 thousand years was reconstructed using various

micropaleontological, isotopic and lithological proxy data. The comparison with other

records from the region shows high spatial and temporal complexity of the oceanic

circulation in the region. During the early deglaciation a roughly simultaneous collapse of

the ice sheets surrounding the Nordic Seas released large amounts of freshwater that

affected both the surface and bottom water circulation and significantly contributed to

Heinrich stadial 1. During the Younger Dryas the central Nordic Seas were affected by

the last major freshwater plume originating most probably from the Arctic Ocean. After

ice rafting ceased around 11 ka subsurface temperatures started to rise. Enhanced Atlantic

Water advection and subsurface temperatures reached their maximum later than in the

eastern Nordic Seas due to the gradual re-routing of the Atlantic Water flow

71

5. Evolution of the central Nordic Seas over the last 20 thousand years

and the establishment of the Greenland Sea gyre. A distinct temperature and

bioproductivity anomaly related with the 8.2 ka event was observed, especially in the

Lofoten Basin. The Holocene thermal maximum ended in the Greenland Basin ca. 5.5 ka,

triggered by an increase in sea-ice export from the Arctic. In the Lofoten Basin the

cooling occurred later, after 4 ka, and was associated with a weakening of the overturning

circulation. The Neoglacial cooling was reached ca. 3 ka, together with low solar

irradiance, expanding sea-ice and a weakened deep convection. At ca. 2 ka subsurface

temperatures began to rise again due to increasing influence of Atlantic Waters.

5.1. Introduction

The transition from the Last Glacial Maximum (LGM) into the Holocene and the

paleoceanographic evolution of the present interglacial in the Nordic Seas have been a

focus of numerous studies (e.g., Hald et al., 2007; Lekens et al., 2005; Müller et al., 2009;

Nørgaard-Pedersen et al., 2003; Rasmussen et al., 2013; Risebrobakken et al., 2011;

Weinelt et al., 2003; Werner et al., 2013). However, apart from a small number of

exceptions (Bauch and Weinelt, 1997; Bauch et al., 2001a; Fronval and Jansen, 1997;

Müller et al., 2012), most of the studies concentrate on records from along the

Norwegian-Svalbard continental margin. The central part of the basin, despite its

importance for the overturning circulation (Marshall and Schott, 1999; Rudels and

Quadfasel, 1991), remains largely unexplored in terms of the oceanographic

development. The two main reasons for this situation are the difficult accessibility of the

appropriate study areas and problems to find high resolution, undisturbed sedimentary

sequences in this remote, cold and largely sea ice-covered region.

72

5. Evolution of the central Nordic Seas over the last 20 thousand years

A study of high resolution sedimentary records from the central Nordic Seas helps

to gain a better understanding of processes and forcings that govern the oceanographic

evolution not only of the basin itself, but of the overall North Atlantic region in general.

Freshwater outbursts from glaciated areas and melting icebergs affected the proximal

ocean environment increasingly since the onset of the last deglaciation (Álvarez-Solas et

al., 2011; Condron and Winsor, 2012; Seidenkrantz et al., 2012). That situation enhanced

surface stratification, weakened the overturning circulation, and the resulting surface

freshening enabled more seasonal sea-ice production. However, the intensity of these

meltwater events, their sources and their influence on the climate evolution remains

largely unknown (e.g., Sarnthein et al., 1995; Tarasov and Peltier, 2006). While the onset

of the Holocene warmth was to a large extent induced by high summer insolation in the

northern polar latitudes, a detailed image of the deglacial-interglacial transition appears

much more complex (Andersen et al., 2004a; Risebrobakken et al., 2011). The exact

timing of the warming, the duration and amplitude of the thermal maximum and the

character of its termination depended largely on the intensity and routing of the Atlantic

Water advected into the Nordic Seas (e.g., Giraudeau et al., 2010) and feedbacks from the

remnant ice sheets (Blaschek and Renssen, 2013) or sea ice (Müller et al., 2009). The

Holocene, earlier considered a relatively stable interval (Grootes et al., 1993), was

punctuated by numerous cooling events (Andersen et al., 2004b; Renssen et al., 2006;

Rohling and Pälike, 2005; Wanner et al., 2011; Werner et al., 2013). Even the late

Holocene, the most recent part of the present interglacial, still seems to bear some

mysteries (Aagaard-Sørensen et al., 2014a; Spielhagen et al., 2011) and also requires

further studies to be better understood.

In previous studies Telesiński et al. (2014a, 2014b) investigated a multicentennial

record from the central Greenland Sea, which shed some more light on the

73

5. Evolution of the central Nordic Seas over the last 20 thousand years

paleoceanographic evolution of this area. However, due to the high oceanographic

complexity of the Nordic Seas a major gap remained between this cold Greenland Basin

and the area farther east, the Lofoten Basin where the warm Norwegian Atlantic Current

passes through on its way into the Arctic Ocean. Here we present the relatively high

resolution core M17730-4 from the Lofoten Basin, in the northern Norwegian Sea. We

compare it with core PS1878 from the Greenland Basin (Telesiński et al., 2014b) as well

as other high-resolution records from the region to relate the evolution of the Greenland

Sea and the eastern Nordic Seas and to obtain a more complete view on the evolution of

the Nordic Seas since the LGM.

5.2. Study area

At present, the Nordic Seas are bathed by two main surface-water currents

(Fig. 5.1.). The main flow of the North Atlantic Current (NAC) propagates northward

from the Faroe-Shetland Channel, along the Norwegian and Barents Sea continental

margins and through the eastern Fram Strait where it enters the Arctic Ocean, transporting

relatively warm and saline Atlantic Water (AW). The East Greenland Current (EGC)

enters the Nordic Seas from the north through the western Fram Strait, flows southward

along the Greenland continental margin, and leaves through the Denmark Strait. It

transports cold and low-saline Polar Water (PW) carrying sea-ice and icebergs from the

Arctic Ocean. Due to this oceanographic pattern a strong east-west gradient across the

Nordic Seas exists both in surface water temperature and salinity. Two north-south

trending oceanographic fronts run roughly parallel to the main current flow directions.

The Polar Front separates PW from Arctic Water (ArW), a product of PW and AW

mixing, while the Arctic Front constitutes a boundary between ArW and AW (Swift,

74

5. Evolution of the central Nordic Seas over the last 20 thousand years

1986). The strong zonation of the Nordic Seas makes them highly susceptible to any

changes in the oceanographic pattern.

Fig. 5.1. Present day surface water circulation in the Nordic Seas. Cores used in this study

are marked by yellow dots. Red arrows indicate Atlantic Water, blue arrows – Polar

Water, white broken lines – oceanographic fronts. White arrow – present-day deep

convection (Marshall and Schott, 1999). EGC – East Greenland Current, GB – Greenland

Basin, LB – Lofoten Basin, NAC – North Atlantic Current, NB – Norwegian Basin, WSC

– West Spitsbergen Current. Bathymetry from The International Bathymetric Chart of the

Arctic Ocean (http://www.ibcao.org, 2012).

The ArW domain between the Polar and Arctic fronts is the area where branches

of NAC and EGC create a cyclonic gyre and where deep water convection and formation

of North Atlantic Deep Water (NADW) takes place, with sea-ice playing a decisive

preconditioning role (Marshall and Schott, 1999). In early winter the formation of sea-ice

leads to brine rejection, an increase in surface layer density, and cooling of the mixed

layer. Later in winter, the ice forms a wedge (the Is Odden) enclosing an ice-free bay (the

Nord Bukta) – a result of the southward ice transport by winds. Subsequently, the mixed

layer deepens to 300-400 m, also as a result of strong winds. Finally, typically around

75

5. Evolution of the central Nordic Seas over the last 20 thousand years

March, preconditioning is advanced enough for the deep (>2000 m) convection to

develop in the ice-free areas (Marshall and Schott, 1999; Rudels and Quadfasel, 1991).

At present, site M17730-4 is located under the direct influence of the NAC and its

westerly branches but relatively close to the Arctic Front. Site PS1878 belongs to the

ArW domain and is located near the convection center (Telesiński et al., 2014b). Thus,

paleoceanographic records from these sites will allow a comparative study of the

temporal evolution of the Greenland Sea gyre and westward advection of AW into the

central Nordic Seas.

5.3. Material and methods

Core M17730-4 (72°06.7’N, 07°23.3’E, 2749 m water depth) is a kasten core

retrieved from the Lofoten Basin in the northern Norwegian Sea (Fig. 5.1.). It has

previously been studied by Weinelt (1993) and Bauch and Weinelt (1997) but with a

lower sampling resolution. Similar to core PS1878 (Telesiński et al., 2014a, 2014b), it

was sampled continuously every 1 cm. Samples were freeze-dried, wet-sieved with

deionized water through a 63 μm mesh, and dry-sieved into size fractions using 125 μm,

150 μm, 250 μm, 500 μm and 1000 μm mesh sizes. Each size fraction was weighed.

As the original, onboard-made depth scale of the core (Weinelt, 1993) did not

quite match with our new measurements (likely due to some drying up and shrinking of

the material during storage) we had to correlate the two depth scales using characteristic

lithological horizons in the actual core material and in the original core photographs to be

able to apply the 14

C dates of Weinelt (1993) to our record. Thus, a new depth scaling was

76

5. Evolution of the central Nordic Seas over the last 20 thousand years

established (Table 5.1.) and all the depths given here refer to it unless otherwise indicated

(Fig. 5.2.).

Table 5.1. Tie points between the original depth scale of core M17730-4 (Weinelt, 1993)

and the depth scale used in this study.

Depth (Weinelt, 1993) (cm) Depth (this study) (cm)

21,0 21,5

32,0 32,5

64,6 63,5

88,5 85,5

110,0 104,5

131,0 123,5

Planktic foraminifera census counts were conducted on representative splits (>300

specimens) of the >150 μm size fraction and were used to calculate the absolute faunal

abundances (specimens per 1 g dry sediment) and relative abundances of individual

species.

Rock grains >150 μm were counted every 1-2 cm and provided information on

ice-rafting. As ice-rafted debris (IRD) we interpret here all lithic grains >150 μm. Such

coarse particles can be transported into a deep ocean basin preferentially by icebergs

while sea ice often transports finer material (Nürnberg et al., 1994). To provide clues on

the origin of IRD, several types were identified, the most common of them being

crystalline and clastic rock fragments. Organic-rich, clastic IRD is common in glacial

sediments from the eastern Nordic Seas (e.g., Bischof, 1994; Bischof et al., 1997) and is

interpreted as originating from the wide and shallow western Eurasian shelves (Bauch et

al., 2001a; Wagner and Henrich, 1994). For comparison we present similar data from core

PS1878 but for the >250 μm size fraction.

77

5. Evolution of the central Nordic Seas over the last 20 thousand years

Fig. 5.2. M17730-4 proxy records versus depth: oxygen (blue) and carbon (red) isotope

ratios of planktic foraminifera N. pachyderma (sin), >63 µm fraction content (black).

Black triangles mark the AMS 14

C dates.

Stable oxygen and carbon isotope analyses were performed on planktic species

Neogloboquadrina pachyderma (sin.) and two benthic species - the epibenthic

Cibicidoides wuellerstorfi and the shallow infaunal Oridorsalis umbonatus. Twenty-five

specimens were picked from the 125–250 μm (N. pachyderma (sin) and O. umbonatus) or

250-500 μm (C. wuellerstorfi) size fraction and crushed to minimize the risk of

78

5. Evolution of the central Nordic Seas over the last 20 thousand years

performing the measurements on reworked/anomalous material. All stable isotope

analyses were carried out in the stable isotope laboratory of GEOMAR using a Finnigan

MAT 253 mass spectrometer system and a Kiel IV Carbonate Preparation Device. Results

are expressed in the δ notation referring to the PDB standard and are given as δ18

O and

δ13

C. Because of departures from isotopic calcite equilibrium, the measured δ18

O values

of C. wuellerstorfi and O. umbonatus were corrected by +0.64 and +0.36‰, respectively

(Duplessy et al., 1988).

To retrieve subsurface temperatures (SSTs) from foraminiferal census data the

SIMMAX technique, a variation of the modern analogue technique (MAT) approach, was

applied. The relation between foraminiferal diversities and SSTs was established by using

the North Atlantic part of the surface sediment samples foraminiferal database

(Pflaumann et al., 2003) linked to oceanographic atlas SST data of 100 m water depth

layer (Levitus and Boyer, 1994). The used winter and summer temperatures represent

average values for February to April and August to October, respectively. It should be

noted that below 3°C SIMMAX tends to overestimate temperatures (Pflaumann et al.,

2003).

5.4. Chronology

Details on the age control of core PS1878 were given by Telesiński et al. (2014b).

For the present study we obtained an additional date at 73.5 cm (corrected core depth) to

improve the older part of the age model. The chronology of core 17730-4 is based on

eleven AMS 14

C dates measured on N. pachyderma (sin.) (Table 5.2.). Seven of them

were taken from Bauch and Weinelt (1997) while the other four are from this study and

were obtained to improve and verify the previous age model. All radiocarbon ages were

79

5. Evolution of the central Nordic Seas over the last 20 thousand years

corrected for a reservoir age of 400 years, calibrated using Calib Rev 6.1.0 software

(Stuiver and Reimer, 1993) and the Marine09 calibration curve (Reimer et al., 2009), and

are given in thousand calendar years before AD 1950 (ka).

Table 5.2. AMS 14C measurements and their calibrated ages for the cores used in the study.

The age–depth relations and sedimentation rates of both cores are shown in Fig.

5.3. The interval between 73.5 and 96.5 cm in core PS1878 shows a sedimentation rate

that is anomalously high for this record, as discussed below. Therefore, to extrapolate the

age of the lowermost section of the core we used the sedimentation rate of the 59.5 to

73.5 cm interval. As a result, the yielded age of the bottom of the core (24.4 ka) is ca. 2

kyr older than the one reported by Telesiński et al. (2014b). The average sedimentation

Lab. no.

Original depth

(cm)

Corrected depth

(cm)

14C age

± error

Calibrated

age (a BP)

Core PS1878-2

Poz-45376 0,5 0,5 775 ± 35 426

Poz-45377 12,5 12,5 3300 ± 40 3143

Core PS1878-3

Poz-45378 11,5 12,5 3295 ± 35 3139

Poz-45380 19,5 20,5 4525 ± 35 4746

Poz-54381 25,5 26,5 5580 ± 50 5961

Poz-54382 30,5 31,5 6760 ± 50 7295

Poz-45384 39,5 40,5 8410 ± 60 9028

Poz-45385 58,5 59,5 11100 ± 60 12613

Beta-367894 72,5 73,5 14050 ± 60 16800

KIA 47284 95,5 96,5 16620 ± 110 19266

Core M17730-4

Beta-367895 12,0 12,5 2240 ± 30 1850

(Weinelt, 1993) 20,0 20,5 3330 ± 100 3200

(Weinelt, 1993) 40,0 40,1 5610 ± 70 5990

(Weinelt, 1993) 50,0 49,7 6800 ± 110 7320

(Weinelt, 1993) 70,0 68,5 8470 ± 90 9080

Beta-367896 81,0 78,5 8980 ± 40 9620

(Weinelt, 1993) 100,0 95,6 9520 ± 590 10400

Beta-367897 106,6 101,5 10490 ± 50 11690

(Weinelt, 1993) 112,0 106,3 11590 ± 100 13110

(Weinelt, 1993) 123,0 116,3 13030 ± 120 15000

Beta-367898 133,2 125,5 15590 ± 60 18540

80

5. Evolution of the central Nordic Seas over the last 20 thousand years

rate of core 17730-4 amounts to ~6.6 cm kyr−1

and the record represents the time period

between 19.6 and 1.8 ka. The dating at 95.6 cm (Weinelt, 1993; original depth 100 cm)

gave an unusually large error (±590 14

C years BP). Because the obtained calibrated age

(10.4 ka) fits relatively well into our new age model, we did not leave this date out.

However, it should still be kept in mind that the possible age range at this level may vary

from 9.6 to 11.1 ka (1 range).

Fig. 5.3. Age-depth plot (thick lines with squares) and sedimentation rates (thin lines) of

cores M17730-4 (black lines) and PS1878 (gray lines).

81

5. Evolution of the central Nordic Seas over the last 20 thousand years

5.5. Results

As the results from core PS1878 were already described in detail by Telesiński et al.

(2014a, 2014b) here we briefly present only some additional, new data from that core

(crystalline and clastic IRD counts) and focus on core M17730-4.

5.5.1. Planktic foraminifera and reconstructed subsurface temperatures

The lowermost part of core M17730-4 contains a fauna which is dominated by the polar

species N. pachyderma (sin) (Fig. 5.4.). The foraminiferal abundances remained low

between 20 and 16.5 ka. They then increased slightly until 11 ka showing four broad

peaks. Between 11 and 9.5 ka the abundances decreased again and reached an absolute

minimum around 10 ka. In this period, subpolar species (mainly N. pachyderma (dex) but

also Turborotalita quinqueloba, Globigerina bulloides and others) increased in relative

abundance. Most significantly, the percentage of N. pachyderma (dex) rose to almost

30% around 9.8 ka. This is followed by a massive peak in foraminiferal abundance and

percentage of T. quinqueloba at 9.1 ka. Both proxies reached their absolute maximum

values. The following interval (9.1-1.9 ka) was characterized by high variability in both

proxies. Intervals with high foraminiferal abundances (9.3-8.4, 8-7, 6.4-3.5 and after 2 ka)

are also characterized by high percentages of subpolar species (mainly T. quinqueloba, up

to 50-60%). They are separated by intervals with lower abundances and higher N.

pachyderma (sin) percentages.

The reconstructed summer SSTs are generally ca. 0.6°C higher than the winter

temperatures. Before 17 ka the summer SSTs increased slightly slightly above 1°C.

Subsequently they decreased to ca. 0.5-1°C and remained at this level until ca. 10.5 ka. A

warm episode centered around 10.2 ka with summer SSTs of up to 3.7°C was followed by

a cooling around 10 ka. Subsequently, the SSTs reached their maximum of up to 6.3°C

82

5. Evolution of the central Nordic Seas over the last 20 thousand years

Fig. 5.4. M17730-4 paleoceanographic record: stable carbon (red, thin line – raw data,

thick lines – five-point running means) and oxygen (blue) isotope ratios of planktic

foraminifera N. pachyderma (sin), epibenthic C. wuellerstorfi and infaunal O. umbonatus,

total abundance of planktic foraminifera, relative abundance of four dominant planktic

foraminiferal species, reconstructed subsurface (100 m) summer (red) and winter (blue)

temperatures, total abundance of crystalline (black) and clastic (brown) IRD, and relative

abundance of IRD (vs. all grains >150 µm, 12-9 ka).

83

5. Evolution of the central Nordic Seas over the last 20 thousand years

(summer) between 9.8 and 9 ka. A major cooling between 8.9 and 7.9 ka (summer SSTs

down to 0.6°C) was followed by a relatively stable warm interval (summer SSTs 4-4.5°C)

interrupted only by a cooling between 7.5 and 6.5 ka. After 4 ka the SSTs began to

decrease to reach a minimum between 3.4 and 3 ka and they increased towards the end of

the record.

5.5.2. Stable isotopes

The planktic oxygen isotope record shows relatively heavy values typical for the

LGM (>4.5‰) in its oldest part (Fig. 5.4.). A small but remarkable excursion with light

values was noted around 19 ka. The second, much stronger excursion peaked around 17

ka. Thereafter the values decreased with another distinct excursion around 12.6 ka and

remained relatively stable after ca. 9 ka. The planktic carbon isotope record shows

significant variability. Values were low until 16 ka. They were then increasing until 12 ka

and subsequently decreasing. Since ca. 10 ka the carbon isotope ratio continued to rise to

reach highest values after 7 ka and began to decrease after 3 ka.

Heavy 18

O values (>5‰) were recorded for the benthic infaunal species (O.

umbonatus). Contemporaneous with the planktic record, also a light benthic isotope

excursion is found around 17 ka. The values then returned to the previous high level and

remained relatively stable until 13.5 ka. The epibenthic 18

O record (C. wuellerstorfi)

starts only around 17 ka due to the absence of this species in the older interval. It also

reveals the relatively light value peak noted in the other two species records, but rapidly

increased values until ca. 13.5 ka. After that both benthic records run roughly parallel to

each other. A trend towards lower values dominates the remaining part of the record with

only minor variability. Epibenthic carbon isotope data (C. wuellerstorfi) show a steadily

84

5. Evolution of the central Nordic Seas over the last 20 thousand years

increasing trend between 17 and 6.5 ka. The values remained relatively high until ca. 3.5

ka from when on they decreased in a stepwise manner.

5.5.3. IRD

Between 20 and 11 ka IRD content in core M17730-4 was high, the majority

being crystalline fragments of various rock types (Fig. 5.4.). There are, however, a

number of prominent peaks in the clastic IRD record (18, 17, 16 and 15 ka). Although

after 11 ka the IRD concentration became extremely low, around 10 ka there is a

prominent peak in the percentage record of IRD (predominantly crystalline) relative to all

grains >150 μm (mineral grains and foraminifera).

The IRD record of core PS1878 is generally dominated by crystalline rock

fragments (Fig. 5.5.). Only around 14.5 ka the amount of clastic IRD exceeded that of the

crystalline grains. The total IRD content was high between 25 and 11 ka, with numerous

prominent peaks. The younger part of the sedimentary record contains little IRD.

5.6. Discussion

5.6.1. Deglaciation

The first major deglacial freshwater event was centered at 17 ka (e.g., Bond et al.,

1997; Hemming, 2004; Stanford et al., 2011; Telesiński et al., 2014b). However, a small,

but conspicuous “precursor” 18

O event occurred just prior to it. It is well recorded in

cores PS1878 and M17730-4 around 19 ka (Figs. 5.4. and 5.5.) and can also be identified

in other records from the Norwegian Sea (Lekens et al., 2005; Weinelt et al., 2003),

Denmark Strait (Voelker et al., 2000) and Fram Strait (Nørgaard-Pedersen et al., 2003).

85

5. Evolution of the central Nordic Seas over the last 20 thousand years

Fig. 5.5. PS1878 paleoceanographic record: stable carbon (red) and oxygen (blue) isotope

ratios of planktic foraminifera N. pachyderma (sin), epibenthic C. wuellerstorfi and

infaunal O. umbonatus, total abundance of planktic foraminifera, relative abundance of

three dominant planktic foraminiferal species, reconstructed subsurface (100 m) summer

temperatures, and total abundance of crystalline (black) and clastic (brown) IRD.

86

5. Evolution of the central Nordic Seas over the last 20 thousand years

Although at the latter location the age of the event seems to be significantly older (ca. 21

ka), the difference might be attributable to variations in reservoir ages during the

deglaciation (Stern and Lisiecki, 2013; Waelbroeck et al., 2001). The prevalence of this

event across the entire Nordic Seas region, despite its low amplitude, suggests that it may

have had multiple sources but a common trigger mechanism. As suggested by proxy (Hall

et al., 2006) and modeling results (Álvarez-Solas et al., 2011), the Atlantic Meridional

Overturning Circulation (AMOC) is sensitive to small-scale freshwater perturbations.

Thus the “precursor” light 18

O excursions at 19 ka could have been induced by a first,

slight sea-level rise (cf. Clark et al., 2004) which resulted in transient and localized

freshwater fluxes to the North Atlantic. This in turn may have led to a first weakening of

the AMOC and NADW formation and subsurface warming (Fig. 5.4.) that ca. 1.2-1.3 kyr

later caused ice shelves collapse and iceberg purges – events known as Heinrich stadial 1

(HS1) (Álvarez-Solas et al., 2011; Hall et al., 2006; Marcott et al., 2011).

The new dating result of core PS1878 just above the main deglacial light 18

O

excursion (Table 5.1.) limits the duration of the freshwater event attributed to HS1 to ca.

1.8 kyr (18.5-16.7 ka, Fig. 5.5.). This is comparable to the length of the event in core

M17730-4 (ca. 2.0 kyr, 18-16 ka, Fig. 5.4.). The apparent difference in timing is likely a

result of variable reservoir ages (Telesiński et al., 2014a). However, the HS1 freshwater

event seems to have had a different character at each of the two sites. In the Greenland

Basin (Fig. 5.5.) the event probably resulted from a discharge of fine sediment-loaded

freshwater from the Greenland Ice Sheet (GIS), which caused a massive increase in

sedimentation rates (cf. Hjelstuen et al., 2004; Lekens et al., 2005), thereby diluting the

concentrations of IRD and planktic foraminifera (Evans et al., 2002; Lekens et al., 2005;

Telesiński et al., 2014b). In the record from the Lofoten Basin (Fig. 5.4.) we observe only

a slight decrease in IRD delivery during the event, but also a distinct peak of clastic

87

5. Evolution of the central Nordic Seas over the last 20 thousand years

grains. This increase in the clastic IRD input suggests the western Eurasian shelves as the

source of the ice-rafted material and connects the freshwater event with a partial collapse

of the Barents Sea Ice Sheet (BSIS) (Bischof, 1994; Elverhøi et al., 1995). These

differences clearly show that although the events were simultaneous and had a common

trigger mechanism (see above), the sources of freshwater must have been different.

Sarnthein et al. (1995) identified two deglacial freshwater tongues – one in the Denmark

Strait and another southwest of the Barents Sea margin. The latter one probably also

reached site M17730-4. The freshwater outburst recorded in PS1878 originated more

likely from the GIS to the west (Telesiński et al., 2014b) whereas other records from

farther north and south would indicate a freshwater outflow from the Arctic Ocean and/or

the Fram Strait region (Nørgaard-Pedersen et al., 2003) and the Norwegian Channel

(Lekens et al., 2005), respectively. Thus, there were at least five different freshwater

sources around the Nordic Seas during the early deglaciation. Such a synchronized

collapse, including the Laurentide (Hemming, 2004) and circum-Nordic Seas ice sheets,

points to an external trigger mechanism (Bond et al., 1997) rather than internal

instabilities of the individual ice sheets (Broecker, 1994) as a cause of HS1. Our

observations confirm a significant contribution of the circum-Nordic Seas ice sheets to

HS1 (Bond et al., 1997; Hemming, 2004), in contrast to earlier studies which indicated

the Laurentide Ice Sheet as the only contributor (e.g., Broecker, 1994).

Contrary to core PS1878, the isotope record of the infaunal species O. umbonatus

in M17730-4 is complete and covers the entire studied period (Figs. 5.4. and 5.5.). It

reveals that the 18

O decrease between 18 and 16 ka, although of lower amplitude, was

simultaneous with the planktic shift. The epibenthic record also shows a decrease but it

does not cover the entire 18

O event. For the Greenland Sea, Telesiński et al. (2014b)

suggested that the light oxygen isotope signal in PS1878 was injected into the bottom

88

5. Evolution of the central Nordic Seas over the last 20 thousand years

water layers with a hyperpycnal (sediment-loaded) plume (cf. Stanford et al., 2011). A

similar explanation seems less supportive for the Lofoten Basin record, as we do not

observe any decrease neither in the concentration of planktic foraminifera or IRD nor in

the >63 µm size fraction (Fig. 5.2.), as it is the case in core PS1878. The plume in the

Lofoten Basin was likely associated with the partial collapse of the BSIS (see above),

which partly explains why ice rafting did not decrease. Another mechanism that could

result in the light benthic 18

O values is the formation of supercooled water under the ice

shelf, a process observed nowadays in the Weddell Sea (Bauch and Bauch, 2001). A

relatively warm and saline water mass, in our case the AW, could subduct under the ice

shelf, increasing its melting (Straneo and Heimbach, 2013; Straneo et al., 2010). The

admixture of relatively small amounts of fresh, cold, and isotopically extremely light

meltwater into the AW, combined with brine release, would altogether produce a low

18

O, but sufficiently dense (cold and saline) water mass capable of sinking to the bottom

of an ocean basin (Bauch and Bauch, 2001). In the Lofoten Basin, the cascading of such

water masses down the Barents Sea continental slope could also explain the peak in >63

µm size fraction content just prior to the light isotope excursion in core M17730-4 (Fig.

5.2.), as the finer material could be winnowed by the cascades. These two mechanisms

(the hyperpycnal plume and the formation of supercooled water) do not exclude each

other and might have both taken place at both sites, although with different relative

importance.

During the time interval after the main freshwater event (between ca. 16 and 13

ka) core M17730-4 (Fig. 5.4.) reveals planktic 18

O values similar to those in the

Greenland Basin records (Telesiński et al., 2014a). However, the PS1878 record is much

more variable, indicating that minor freshwater events were much more common in the

western Nordic Seas, in the proximity of the GIS (Fig. 5.5.). Most of the BSIS (except for

89

5. Evolution of the central Nordic Seas over the last 20 thousand years

the Svalbard Ice Sheet) had already disappeared by then (Bischof, 1994). Thus, the GIS

remained the main source of freshwater thereafter, releasing it during smaller-scale

discharges. A small but significant increase in the clastic IRD delivery to sites PS1878,

M17730-4, as well as PS1243 (Bauch et al., 2001a) between 14.5 and 15 ka was most

probably related to the advance of the Svalbard Ice Sheet at that time (Elverhøi et al.,

1995). The arrival of Svalbard icebergs to the Greenland and Lofoten basins might

therefore indicate the AMOC recovery at the onset of the Bølling-Allerød interval

(Stanford et al., 2011).

The SST reconstructions in the deglacial part of both records indicate cold and

relatively stable thermal conditions (Figs. 4 and 5). Both applied transfer functions do not

perform well in low temperatures (Husum and Hald, 2012; Pflaumann et al., 2003; below

ca. 2°C and 3°C, respectively), which may in part explain such results. However, the

foraminiferal fauna composition also remained stable in the pre-Holocene part of the

records and was strongly dominated by polar species. This might indicate that the water

temperature at the planktic foraminiferal habitat depth was indeed low and relatively

stable during the deglaciation. In our records, no indications of warming during Bølling-

Allerød (B-A) can be found. B-A was an interval of relatively high air temperatures

recorded at 14.7-12.9 ka over Greenland (Johnsen et al., 2001; Rasmussen et al., 2006)

and Europe (e.g., Ammann et al., 2013; Friedrich et al., 2001). The lack of a distinct B-A

warming in paleoceanographic records from the Nordic Seas is a common feature (e.g.,

Rasmussen et al., 2007), although the warming is found in the North Atlantic records

(Waelbroeck et al., 2001). The onset of the B-A interstadial was concurrent with

meltwater pulse 1A (mwp-1A, Weaver et al., 2003). The source area of mwp-1A remains

unknown, ranging from Antarctica to the Laurentide or Fennoscandian ice sheets (Weaver

et al., 2003). Our records do not contain indications of any prominent freshwater

90

5. Evolution of the central Nordic Seas over the last 20 thousand years

discharges during the B-A interstadial, which seems to exclude the circum-Nordic Seas

ice sheets as potential mwp-1A sources. It is possible, however, that significant amounts

of freshwater were still present in the basin since HS1 due to the continuous

replenishment from the surrounding melting ice sheets or advected into the area as a

result of mwp-1A. The freshwater could have maintained a strong halocline and isolated

the subsurface waters from the atmospheric warming during B-A.

Between 14 and 13 ka the offset between both benthic 18

O records in core

M17730-4 decreased and in the younger part of the records both species exhibit similar

values (after correction for vital effects, Fig. 5.4.). This cannot be observed in core

PS1878, due to the incompleteness of the records, but is a common feature in other

Nordic Seas records during Marine Isotope Stage (MIS) 2 and Termination I (Bauch et

al., 2001a; Telesiński et al., 2014a), as well as during MIS 6 and Termination II (Bauch et

al., 2000). Although the reason for this shift still remains elusive, it might be an effect of

a change in overall circulation in the Nordic Seas or a different ecology, and thus a

specific change of the vital effect of these benthic foraminifera during times of enhanced

IRD deposition (Bauch and Erlenkeuser, 2003).

During the Younger Dryas (YD) interval the central Nordic Seas were once again

affected by some freshwater (Figs. 5.4. and 5.5.). Both cores show time-coeval planktic

18

O peaks with a maximum around 12.6 ka, suggesting a rapid propagation of freshwater

from the north (e.g., Fram Strait; Fahl and Stein, 2012) towards the south (cf. Condron

and Winsor, 2012). The presence of a YD low 18

O signal in the Lofoten Basin, together

with the 18

O data compilation of Sarnthein et al. (1995), might also indicate a southern

origin. However, Sarnthein et al. (1995) showed a time slice from the late YD (ca. 12.3-

11.3 ka), while the freshwater plume reached the Nordic Seas earlier (peak ca. 12.6 ka).

91

5. Evolution of the central Nordic Seas over the last 20 thousand years

Besides, their map compilation contains very few data points from the northern and

western Nordic Seas, the area most affected by the plume if the meltwater had come from

the North. Absence of freshwater indications in high resolution records farther to the

south (Risebrobakken et al., 2003) and their unambiguous occurrences in the northern

part of the Nordic Seas (Bauch et al., 2001a; Fahl and Stein, 2012; Telesiński et al.,

2014a) suggest the Arctic as an important or even the main source area. Our Lofoten

Basin site seems to be the southeasternmost locality in the Nordic Seas which recorded a

clear YD freshwater signal (Fig. 5.1.). This record therefore sets a geographical limit of

the southward freshwater propagation into the Nordic Seas, but extending it beyond the

area suggested by Condron and Winsor (2012). Such a broad spatial expansion of the

freshwater lid might be in agreement with the paradigm of AMOC decline (McManus et

al., 2004) and it certainly conforms to the regional reconstructions of increased sea-ice

abundance in the Norwegian Sea and in the Fram Strait (Cabedo-Sanz et al., 2013; Müller

et al., 2009) during the early YD.

5.6.2. Holocene

Iceberg rafting ceased almost completely in the central Nordic Seas shortly after

the YD, as indicated by low IRD content in the sediments (Figs. 5.4. and 5.5.). This time

was associated with an improvement of surface water conditions and the disappearance of

the perennial sea-ice cover, as shown by increasing faunal abundances. While in the

Greenland Basin the bioproductivity continued to increase almost continuously until ca. 9

ka, in the Lofoten Basin the foraminiferal concentration decreased again between 11 and

9.5 ka. This decline can at least partly be attributed to an increase in sedimentation rate

around that time (Fig. 5.3.) - especially if the dated sample from 95.6 cm is in fact older

than 10.4 ka. Large amounts of fine-grained material may have been delivered to the site

during the final stage of the decay of the nearby Scandinavian Ice Sheet (SIS). Although

92

5. Evolution of the central Nordic Seas over the last 20 thousand years

the ice rafting generally ceased at that time, as the ice front retreated from the coastline,

continental runoff could have still provided significant amounts of suspended material

(Mangerud, 2004).

A distinct, light-brown layer was observed at 86.5-84.5 cm depth (age around 9.95

ka) in core M17730-4. It is characterized by light 18

O and heavy 13

C peaks, both

planktic and benthic, a slightly elevated IRD content and is almost barren of foraminifera

(Fig. 5.4.). As the BSIS had already retreated at that time (Elverhøi et al., 1995, 1993;

Svendsen et al., 2004) the emerged shallow shelf sea was an environment where sea-ice

and brine formation must have occurred, at least seasonally. The final retreat of the SIS

(Mangerud, 2004) mobilized sediment material, of which the finer size fractions possibly

remained suspended in the water further increasing its density and allowing the water to

cascade down the continental slope and into the deeper parts of the Lofoten Basin where

the fine sediments were deposited. Thus we interpret this layer as a result of dense water

cascading from the Barents Sea shelf. The brine formation and cascading around 10 ka

could also have increased the ventilation of the subsurface and bottom water, as indicated

by elevated planktic and benthic 13

C values, respectively. Although the temperature

reconstruction indicates a cooling around that time, it might be a result of selective

winnowing and/or abrasion of the small, thin-walled subpolar foraminiferal tests.

The early Holocene SST increase in the Lofoten Basin started ca. 10.5 ka. The

strengthening of the AW advection is reflected in consecutive peaks in the relative

abundance record of N. pachyderma (dex), G. bulloides and T. quinqueloba (Fig. 5.4.).

While the former species is the main warm counterpart of N. pachyderma (sin) in the

Nordic Seas – with a present-day dominance in the SE Norwegian Sea region (Bauch and

Kandiano, 2007) – the latter two species are directly related to the inflow of AW. Their

93

5. Evolution of the central Nordic Seas over the last 20 thousand years

specific sequence of occurrence indicates either a gradual strengthening of the AW inflow

or a westward lateral migration of the AW core towards our study site.

Although SSTs had already increased and reached a maximum by 9.8 ka in the

Lofoten Basin, enhanced advection of AW occurred later, ca. 9.2 ka. This is similar in

time to the northern Greenland Basin but earlier than in its central part (Telesiński et al.,

2014a). Still, it appears relatively late compared to the records from other sites located

near the main flow path of the NAC where it is found around 10 ka (Fig. 5.6., e.g., Hald

et al., 2007; Risebrobakken et al., 2011). Most likely this illustrates the gradual

decoupling of an AW branch from the main NAC and a re-routing of AW flow from a

northward to a northwestward direction. The delay of AW advection in the central and

western part of the Nordic Seas may also be a result of the activation ('an overshoot of the

AMOC' suggested by Risebrobakken et al., 2011) and subsequent stabilization of the

Greenland Sea gyre at this time. In addition, a deglacial freshwater input from the GIS

may have also delayed the warming in the central Nordic Seas, thereby influencing the

AMOC development in general (Blaschek and Renssen, 2013; Seidenkrantz et al., 2012).

Only after 8-7 ka, when the freshwater input had ceased completely and the modern

surface ocean circulation pattern and the flow strength of the AMOC were reached

(Thornalley et al., 2010), did the heat advected into the Nordic Seas by the AW reach also

significantly farther to the west, as seen in our Greenland Basin record (Fig. 5.5.). The

absence or weakness of a westward heat transport during the early Holocene might have

been also responsible for the high amplitude of the Holocene Thermal Maximum in

paleotemperature records from the eastern and northeastern Nordic Seas (Fig. 5.6., e.g.,

Hald et al., 2007; Risebrobakken et al., 2011).

Similar to the situation in the eastern Nordic Seas (Risebrobakken et al., 2011), in

the Lofoten Basin the thermal maximum seems to be at least partly decoupled from the

94

5. Evolution of the central Nordic Seas over the last 20 thousand years

maximum AW advection indicated by the maximum abundances of subpolar species (Fig.

5.4.). However, while at the Norwegian and Barents Sea margins the SST maximum is

delayed compared to the AW advection, in the Lofoten Basin it begins ca. 600 years

earlier. The surface waters close to the Norwegian coast were affected by freshwater from

the retreating SIS, which could have delayed the surface warming. Site M17730-4,

located farther to the northwest, was probably less influenced by freshwater at that time

and the high summer insolation caused the warming before the maximum AW advection

was reached.

Between ca. 9 and 6 ka the foraminiferal concentration records in the Lofoten and

Greenland basins seem to be in phase (Figs. 5.4. and 5.5.). However, while at site

M17730-4 high faunal abundances corresponded with intervals rich in subpolar fauna, in

core PS1878 these two proxies seem to be unrelated. While the relative proportions of

subpolar species might be more directly related to temperature and salinity in the upper

water layers (e.g., Hald et al., 2007), the changes in total foraminiferal productivity more

likely depend on factors such as food availability, water ventilation, variations in sea-ice

cover etc. The Lofoten Basin (Figs. 5.1. and 5.4.) was directly influenced by the NAC,

and its changing intensity was the dominant factor for the environmental conditions (e.g.,

Giraudeau et al., 2010; Risebrobakken et al., 2011; Werner et al., 2013). By comparison,

in the Greenland Basin (Figs. 5.1. and 5.5.) the oceanographic situation was more

complex due to the interplay of NAC and EGC branches, the Greenland Sea gyre, the

intensity of deep convection as well as the sea ice exported from the Arctic through the

Fram Strait (Telesiński et al., 2014a, 2014b). Therefore the bioproductivity in this area,

which resulted from these complex relationships, might have not been directly linked to

the water temperature, but rather to the intensity of the AW inflow.

95 5. Evolution of the central Nordic Seas over the last 20 thousand years

M17

730-

4

PS

1243

MD

95-2

011

M23

258

PS

1878

MS

M5/

5-71

2

Age

(ka)

020

510

15Ag

e (k

a)0

510

15

046 2SST °C

0.5

1.5

1.0

δ13C (‰)

M17

730-

4

4 SST °C 23

1.5

1.0

δ13C (‰)

PS18

78

1.0

1.5

δ13C (‰)

024 SST °C

PS12

43

1357 SST °C

MSM

5/5-

712

13579 SST °C

M23

258

3579 SST °C13 11M

D95

-201

1DEEP CONVECTION

?

??

b)

d)

c)

f)

a)

e)

96

5. Evolution of the central Nordic Seas over the last 20 thousand years

Fig. 6. (previous page) Comparison of high-resolution Nordic Seas records. a)-c) Central

Nordic Seas SST and epibenthic 13

C records. a) PS1878 (Telesiński et al., 2014),

summer SST at 100 m water depth. b) M17730-4 (this study), summer SST at 100 m. c)

PS1243 (Bauch et al., 2001a; Kandiano et al., 2012), winter SST at 100 m. d)-f) Eastern

Nordic Seas SST records. d) MSM5/5-712 (gray line - Aagaard-Sørensen et al., 2014b;

black line - Werner et al., 2013, dotted line - Werner et al., 2011), summer SST at 50 m.

e) M23258 (Sarnthein et al., 2003), summer SST at 10 m, smoothed. f) MD95-2011

(Andersson et al., 2010), summer SST at 10 m, smoothed. Light gray shadings indicate

early, middle and/or late Holocene warm intervals.

The sediments deposited between 9 and 6 ka, generally rich in planktic

foraminifera, reveal two prominent intervals of impoverished fauna centered around 8.2

and 6.6 ka (Figs. 5.4. and 5.5.). The earlier one spans the interval of the 8.2 ka event, a

widespread cooling event often related to a catastrophic freshwater release into the

Labrador Sea and disruption of NADW formation (e.g., Rohling and Pälike, 2005). As

shown by model simulations, the freshwater outburst strengthened the Atlantic subpolar

gyre but apparently weakened the transport of AW into the Nordic Seas (Born and

Levermann, 2010). This caused a cold and dry climate with overregional implications

(Kobashi et al., 2007; Rohling and Pälike, 2005). At both of our sites, a SST decrease

occurred around 8.2 ka (Fig. 5.6.). The cooling was much more pronounced in the

Lofoten Basin, perhaps because the preceding early Holocene warming was much

stronger here and because this area was more directly influenced by the intensity of the

AW inflow than the Greenland Basin. A time-coeval increase in planktic 13

C at site

M17730-4 might either reflect the decreased inflow of poorly ventilated AW (cf.

Sarnthein et al., 2003) or be related to enhanced sea-ice formation from the cool and fresh

surface water (Müller et al., 2012, 2009) indicating that during the 8.2 ka event conditions

in the Lofoten Basin resembled those in the present-day Arctic Ocean (cf. Spielhagen and

Erlenkeuser, 1994). Low benthic 13

C values indicate limited deep water renewal in

accordance with a brief decrease in ISOW flow and AMOC collapse at that time (Hall et

97

5. Evolution of the central Nordic Seas over the last 20 thousand years

al., 2004). The anomalies related to the 8.2 ka event in our records extend over several

hundred years, which is in accordance with data from many other records. It corroborates

that the sudden climate changes related with the freshwater outburst were probably

superimposed on a longer-term climatic trend (Rohling and Pälike, 2005).

During the younger foraminifer-poor interval (6.8-6.4 ka) the decrease in

foraminiferal abundance was of similar amplitude as during the 8.2 ka event (Figs. 5.4.

and 5.5.). In the Greenland Basin it fell within the maximum of the early Holocene warm

interval (Telesiński et al., 2014a) and no indications of cooling can be seen in the planktic

assemblages. In the Lofoten Basin the cooling was significantly weaker than during the

8.2 ka event (Fig. 5.6.), but it was still one of the most pronounced cold Holocene

anomalies, similar in scale to a brief cooling around 7.3 ka, accompanied by only a minor

bioproductivity decrease. An event simultaneous to the 6.8-6.4 ka cooling is recorded in

the northern Nordic Seas (Müller et al., 2012; Sarnthein et al., 2003; Werner et al., 2013),

where it was associated with (sub)surface water cooling, expanded sea-ice occurrence and

decreased bioproductivity. The event also coincides with an interval of lower current

speed in the northern Fram Strait, possibly related to a slowdown of the overturning

circulation (Hass, 2002). A decrease in our Lofoten Basin benthic 13

C record confirms a

possible brief AMOC weakening. It is difficult to determine unambiguously the cause and

nature of this event, as indications of any kind of local (e.g., freshwater) or global (e.g.,

solar irradiance) forcing cannot be found around that time. Apparently the event was

more of a local perturbation, restricted mainly to the northeastern Nordic Seas, perhaps

related to internal oceanic variability (cf. Wanner et al., 2011).

Except for the two abovementioned events, the benthic carbon isotope values kept

increasing at both sites, at least since the onset of the Holocene, and reached maximum

98

5. Evolution of the central Nordic Seas over the last 20 thousand years

values between 7 and 6 ka (Fig. 5.6.). The same is true for the planktic 13

C record. As

already discussed by Telesiński et al. (2014a), this is a basin-wide feature that illustrates

the development of deep convection in the Greenland Sea. The following interval (7-6

until 3 ka) was characterized by high convection rates as shown by high carbon isotope

ratios, both planktic and benthic, in most areas of the Nordic Seas (e.g., Bauch et al.,

2001a; Sarnthein et al., 2003). Sediment grain size data and modelling results also seem

to support this interpretation (Thornalley et al., 2013). The fact that the convected water

influenced the bottom environment not only of the Greenland Basin (Telesiński et al.,

2014a) but also of the Lofoten Basin indicates a broad spreading of the well ventilated

deepwater on both sides of the oceanic ridge separating the Greenland and Lofoten basins

before flowing southward across the Greenland-Scotland Ridge and into the North

Atlantic (cf. Mauritzen, 1996).

The middle Holocene warm interval lasted in the Greenland Basin until ca. 5.5 ka

In the Lofoten Basin the cooling started ca. 4 ka, but its main phase occurred only ca. 3.5

ka (Fig. 5.6.). Such a long and late warm phase is in good agreement with numerous other

Nordic Seas records (Andersen et al., 2004b; Bauch et al., 2001a; Giraudeau et al., 2010;

Telesiński et al., 2014a; Werner et al., 2013). It differs from several eastern Nordic Seas

records (Hald et al., 2007; Rasmussen et al., 2007; Risebrobakken et al., 2011) which

show a relatively short thermal maximum in subsurface waters during the early Holocene.

However, even at these sites the sea surface temperatures indicate a later and longer warm

phase. Most probably, only in the areas directly influenced by the AW inflow there was a

warm interval restricted to the period of maximum advection, which terminated shortly

after. In other areas and/or water layers this warm phase was extended by the still

relatively high summer insolation and, perhaps, other feedback mechanisms

(Risebrobakken et al., 2011).

99

5. Evolution of the central Nordic Seas over the last 20 thousand years

Interestingly, the termination of the middle Holocene warm interval in core

PS1878 around 5.5 ka coincides with the time when the flooding of the vast Siberian

shelves was concluded (Bauch et al., 2001b). The reach of the Holocene sea level

highstand in the Arctic immensely increased sea-ice production on these Arctic shelves

and its export through Fram Strait (Werner et al., 2013). This probably acted as a positive

feedback for the Neoglaciation after the mid-Holocene, especially in the northwestern

Nordic Seas. In the Lofoten Basin there was no cooling at that time as the Arctic sea ice

probably did not expand that far south. Strong convection (maximum between ca. 7-6 and

3 ka, Telesiński et al., 2014a) might have also played a role in delaying the cooling in the

Lofoten Basin as it required an enhanced inflow of Atlantic waters into the convection

center (Marshall and Schott, 1999) that had to pass over site M17730-4. However, the

decrease in foraminiferal abundance, especially of the subpolar species T. quinqueloba,

between 5 and 4 ka might indicate some deterioration of the planktic foraminiferal

environment in the Lofoten Basin. The subsequent cooling ca. 3.5 ka and the Neoglacial

thermal minimum in the central Nordic Seas around 3 ka, which was very likely enforced

or amplified by decreased solar irradiance (Renssen et al., 2006), also coincided with an

increase in sea-ice occurrence in the northern Nordic Seas (Müller et al., 2012) and a

weakening of deep convection in the Greenland Sea (Telesiński et al., 2014a).

Sediment grain size records and modelling results (Thornalley et al., 2013)

suggest a rather gradual shoaling of deep convection in the Nordic Seas through the

middle-late Holocene. Our results, however, show that there was a stepwise decrease in

the convection strength around 3 ka (Telesiński et al., 2014a), perhaps superimposed on a

longer-term trend starting in the middle Holocene (Fig. 5.6.). Even at sites farther from

the convection center, where this stepwise decrease was not recorded, a brief reduction in

the AMOC strength can be observed around 3 ka, indicating some kind of disruption to

100

5. Evolution of the central Nordic Seas over the last 20 thousand years

the convection mechanism (Bauch et al., 2001a; Hall et al., 2004; Sarnthein et al., 2003;

Werner et al., 2013). The highest benthic 13

C values and their stepwise decrease ca. 3 ka,

recorded only in cores PS1878, PS1910 (Telesiński et al., 2014a) and M17730-4, suggest

that the convection center was located close to these sites. This means that the convection

center was situated more or less in the same area as at present (Fig. 5.1., cf. Marshall and

Schott, 1999). The location of the convection center strongly depends on the position of

the ice edge and the Polar Front, as the interplay between ice-covered and ice-free areas is

crucial for the deep convection preconditioning (Marshall and Schott, 1999). Therefore

we suggest that, if during the Neoglacial cooling climax around 3 ka the ice edge was

located farther to the southeast, the convection center was probably also shifted into this

direction, as suggested earlier by modelling results of Renssen et al. (2006).

Although our Lofoten Basin record does not cover the last ca. 1.8 kyr, a warming

trend is noticeable after 3 ka (Fig. 5.6.). After ca. 2 ka the SSTs reached a level

comparable with the early and mid-Holocene thermal maxima. This implies that the

warming of the subsurface waters reflected in data from core PS1878 (Telesiński et al.,

2014a) was not a local phenomenon but affected a broader area. It may have been related

to an increase in AW advection into the Nordic Seas due to a shift in the variability

analogous to the modern North Atlantic Oscillation (Giraudeau et al., 2010; Olsen et al.,

2012). In the southeastern Norwegian Sea (Giraudeau et al., 2010) and at our two sites the

observed changes had an amplitude comparable to that of the Holocene thermal

maximum (Telesiński et al., 2014a). In other areas of the Nordic Seas where a warming or

an increase of AW inflow can also be observed in the late Holocene (e.g., Andersen et al.,

2004a, 2004b; Hald et al., 2007; Werner et al., 2013), it was clearly much weaker than

during the early/middle Holocene. However, a Mg/Ca subsurface temperature

reconstruction from the eastern Fram Strait (Aagaard-Sørensen et al., 2014a) indicates

101

5. Evolution of the central Nordic Seas over the last 20 thousand years

that also in the northeastern Nordic Seas the early and late Holocene warming may have

been equally strong. In contrast to the early Holocene, during the last 2-3 kyr the summer

insolation in the high northern latitudes was low and therefore the warming must have

been entirely forced by the AW advection aided by stronger water column stratification.

These reconstructions differ from the common view of the Holocene climatic and

oceanographic evolution with an orbitally-induced early Holocene thermal maximum and

a gradual cooling thereafter (e.g., Andersen et al., 2004a). It shows that short-scale

dynamical processes can play a very important role on a regional scale which decouples

them from larger-scale, long-term trends (Wanner et al., 2011).

5.1. Summary and conclusions

The study of the central Nordic Seas records shows that the paleoceanographic

evolution of this area was significantly different from that in the well-explored eastern

part of the basin. It illustrates the complexity of the oceanographic variability in the

region, both on the spatial and temporal scale (Fig. 5.6.).

The deglaciation in the Nordic Seas started ca. 19 ka with non-catastrophic

freshwater discharges. These were likely caused by an early sea-level rise and led to a

first weakening of the AMOC, enhanced subsurface warming, and eventually, to a

dramatic collapse of circum-Nordic Seas marine-based ice sheets and the major deglacial

freshwater discharge (ca. 18-16 ka). This strong freshwater outburst in the region, which

was crucial to the deepwater formation processes, indicate that the Nordic Seas

significantly contributed to the onset of HS1. When the BSIS had disintegrated, the GIS

remained the main source of freshwater releasing it in minor quantities into the Greenland

Sea. The last major freshwater plume which affected the northern and central Nordic Seas

102

5. Evolution of the central Nordic Seas over the last 20 thousand years

occurred during the early YD (ca. 12.6 ka). Most probably it came from the Arctic Ocean

and reached as far as the Lofoten Basin, thereby affecting the AMOC.

Ice rafting and sea-ice cover in the central Nordic Seas diminished after the YD,

but the subsurface warming started only ca. 10.5 ka. The thermal maximum and the

maximum in AW advection were reached later in the Lofoten Basin (ca. 9.8 and 9.2 ka,

respectively) than in the eastern Nordic Seas. This was caused by the gradual re-routing

of an AW branch towards the northwest. In the Greenland Basin it was even later (after 8

ka) due to the activation of the Greenland Sea gyre and the negative influence of the GIS,

still delivering freshwater. A distinct temperature and bioproductivity anomaly, related to

the 8.2 ka event and spanning a few centuries, stood out in the central Nordic Seas,

predominantly in the Lofoten Basin. It was most probably related to a weakening of AW

transport into the Nordic Seas. A similar, though less distinct and probably more local

cold event occurred in the area ca. 6.6 ka. The thermal maximum ended in the Greenland

Basin quite abruptly ca. 5.5 ka in connection with the increasing sea-ice export from the

Arctic. In the Lofoten Basin the cooling started only after 4 ka as the Arctic sea ice did

not reach that far.

Deep convection developed in the central Nordic Seas since the early Holocene

and reached its maximum strength 7-6 ka. The convection center was located

approximately in the same area as at present, migrating slightly together with the sea-ice

edge. At 3 ka, a solar irradiance minimum fostered an expansion of seasonal sea ice,

which in turn significantly limited the convection rate. These events correspond to the

thermal minimum in the central Nordic Seas. Since ca. 2 ka a shift in the variability

analogous to the North Atlantic Oscillation enhanced the AW inflow into the well-

stratified Nordic Seas. Most of the warmth was then routed into the central Nordic Seas

103

5. Evolution of the central Nordic Seas over the last 20 thousand years

resulting in subsurface temperatures comparable with the early-middle Holocene thermal

maximum.

Acknowledgements

This work is a contribution to the CASE Initial Training Network funded by the

European Community’s 7th Framework Programme FP7 2007/2013, Marie Curie

Actions, under Grant Agreement no. 238111. We are grateful to Lulzim Haxhiaj and

Christelle Not for performing the stable isotope measurements and to the Poznan

Radiocarbon Laboratory, Beta Analytic, and the Leibniz Laboratory, Kiel University, for

the AMS 14

C datings.

References

Aagaard-Sørensen, S., Husum, K., Hald, M., Marchitto, T.M., Godtliebsen, F., 2014a.

Sub sea surface temperatures in the Polar North Atlantic during the Holocene:

Planktic foraminiferal Mg/Ca temperature reconstructions. The Holocene 24, 93–

103.

Aagaard-Sørensen, S., Husum, K., Werner, K., Spielhagen, R.F., Hald, M., Marchitto,

T.M., 2014b. A Late Glacial-early Holocene multiproxy record from the eastern

Fram Strait, Polar North Atlantic. Mar. Geol. in press.

Álvarez-Solas, J., Montoya, M., Ritz, C., Ramstein, G., Charbit, S., Dumas, C.,

Nisancioglu, K., Dokken, T.M., Ganopolski, A., 2011. Heinrich event 1: an example

of dynamical ice-sheet reaction to oceanic changes. Clim. Past 7, 1297–1306.

Ammann, B., van Raden, U.J., Schwander, J., Eicher, U., Gilli, A., Bernasconi, S.M., van

Leeuwen, J.F.N., Lischke, H., Brooks, S.J., Heiri, O., Nováková, K., van

Hardenbroek, M., von Grafenstein, U., Belmecheri, S., van der Knaap, W.O.,

Magny, M., Eugster, W., Colombaroli, D., Nielsen, E., Tinner, W., Wright, H.E.,

2013. Responses to rapid warming at Termination 1a at Gerzensee (Central Europe):

104

5. Evolution of the central Nordic Seas over the last 20 thousand years

Primary succession, albedo, soils, lake development, and ecological interactions.

Palaeogeogr. Palaeoclimatol. Palaeoecol. 391, 111–131.

Andersen, C., Koç, N., Jennings, A.E., Andrews, J.T., 2004a. Nonuniform response of the

major surface currents in the Nordic Seas to insolation forcing: Implications for the

Holocene climate variability. Paleoceanography 19, PA2003.

Andersen, C., Koç, N., Moros, M., 2004b. A highly unstable Holocene climate in the

subpolar North Atlantic : evidence from diatoms. Quat. Sci. Rev. 23, 2155–2166.

Andersson, C., Pausata, F.S.R., Jansen, E., Risebrobakken, B., Telford, R.J., 2010.

Holocene trends in the foraminifer record from the Norwegian Sea and the North

Atlantic Ocean. Clim. Past 6, 179–193.

Bauch, D., Bauch, H.A., 2001. Last glacial benthic foraminiferal δ18

O anomalies in the

polar North Atlantic: A modern analogue evaluation. J. Geophys. Res. 106, 9135–

9143.

Bauch, H.A., Erlenkeuser, H., 2003. Interpreting Glacial-Interglacial Changes in Ice

Volume and Climate From Subarctic Deep Water Foraminiferal δ18

O, in: Droxler,

A.W., Poore, R.Z., Burckle, L.H. (Ed.), Earth’s Climate and Orbital Eccentricity:

The Marine Isotope Stage 11 Question. American Geophysical Union, Washington,

D. C., pp. 87–102.

Bauch, H.A., Erlenkeuser, H., Jung, S.J.A., Thiede, J., 2000. Surface and deep water

changes in the subpolar North Atlantic during Termination II and the last

interglaciation. Paleoceanography 15, 76–84.

Bauch, H.A., Erlenkeuser, H., Spielhagen, R.F., Struck, U., Matthiessen, J., Thiede, J.,

Heinemeier, J., 2001a. A multiproxy reconstruction of the evolution of deep and

surface waters in the subarctic Nordic seas over the last 30,000 yr. Quat. Sci. Rev.

20, 659–678.

Bauch, H.A., Kandiano, E.S., 2007. Evidence for early warming and cooling in North

Atlantic surface waters during the last interglacial. Paleoceanography 22, PA1201.

Bauch, H.A., Mueller-Lupp, T., Taldenkova, E., Spielhagen, R.F., Kassens, H., Grootes,

P.M., Thiede, J., Heinemeier, J., Petryashov, V. V., 2001b. Chronology of the

Holocene transgression at the North Siberian margin. Glob. Planet. Change 31, 125–

139.

Bauch, H.A., Weinelt, M.S., 1997. Surface water changes in the Norwegian Sea during

last deglacial and Holocene times. Quat. Sci. Rev. 16, 1115–1124.

Bischof, J.F., 1994. The decay of the Barents ice sheet as documented in nordic seas ice-

rafted debris. Mar. Geol. 117, 35–55.

Bischof, J.F., Lund, J.J., Ecke, H.-H., 1997. Palynomorphs of ice rafted clastic

sedimentary rocks in Late Quaternary glacial marine sediments of the Norwegian

105

5. Evolution of the central Nordic Seas over the last 20 thousand years

Sea as provenance indicators. Palaeogeogr. Palaeoclimatol. Palaeoecol. 129, 329–

360.

Blaschek, M., Renssen, H., 2013. The Holocene thermal maximum in the Nordic Seas:

the impact of Greenland Ice Sheet melt and other forcings in a coupled atmosphere–

sea-ice–ocean model. Clim. Past 9, 1629–1643.

Bond, G.C., Showers, W., Cheseby, M., Lotti, R., Almasi, P., DeMenocal, P., Priore, P.,

Cullen, H., Hajdas, I., Bonani, G., 1997. A Pervasive Millennial-Scale Cycle in

North Atlantic Holocene and Glacial Climates. Science 278, 1257–1266.

Born, A., Levermann, A., 2010. The 8.2 ka event: Abrupt transition of the subpolar gyre

toward a modern North Atlantic circulation. Geochemistry, Geophys. Geosystems

11, Q06011.

Broecker, W.S., 1994. Massive iceberg discharges as triggers for global climate change.

Nature 372, 421–424.

Cabedo-Sanz, P., Belt, S.T., Knies, J., Husum, K., 2013. Identification of contrasting

seasonal sea ice conditions during the Younger Dryas. Quat. Sci. Rev. 79, 74–86.

Clark, P.U., McCabe, A.M., Mix, A.C., Weaver, A.J., 2004. Rapid rise of sea level

19,000 years ago and its global implications. Science 304, 1141–1144.

Condron, A., Winsor, P., 2012. Meltwater routing and the Younger Dryas. Proc. Natl.

Acad. Sci. U. S. A. 109, 19928–19933.

Duplessy, J.C., Labeyrie, L.D., Blanc, P.L., 1988. Norwegian Sea Deep Water Variations

over the Last Climatic Cycle: Paleo-Oceanographical Implications, in: Wanner, H.,

Siegenthaler, U. (Eds.), Long and Short Term Variability of Climate. Springer, New

York, pp. 83–116.

Elverhøi, A., Andersen, E.S., Dokken, T.M., Hebbeln, D., Spielhagen, R.F., Svendsen,

J.I., Sorflaten, M., Rornes, A., Hald, M., Forsberg, C.F., 1995. The growth and decay

of the Late Weichselian ice sheet in western Svalbard and adjacent areas based on

provenance studies of marine sediments. Quat. Res. 44, 303–316.

Elverhøi, A., Fjeldskaar, W., Solheim, A., Nyland-Berg, M., Russwurm, L., 1993. The

Barents Sea Ice Sheet—a model of its growth and decay during the last ice

maximum. Quat. Sci. Rev. 12, 863–873.

Evans, J., Dowdeswell, J.A., Grobe, H., Niessen, F., Stein, R., Hubberten, H.W.,

Whittington, R.J., 2002. Late Quaternary sedimentation in Kejser Franz Joseph Fjord

and the continental margin of east Greenland, in: Dowdeswell, J.A., Ó Cofaigh, C.

(Eds.), Glacier-Influenced Sedimentation on High-Latitude Continental Margins.

The Geological Society of London, London, pp. 149–179.

Fahl, K., Stein, R., 2012. Modern seasonal variability and deglacial/Holocene change of

central Arctic Ocean sea-ice cover: New insights from biomarker proxy records.

Earth Planet. Sci. Lett. 351-352, 123–133.

106

5. Evolution of the central Nordic Seas over the last 20 thousand years

Friedrich, M., Kromer, B., Kaiser, K.F., Spurk, M., Hughen, K.A., Johnsen, S.J., 2001.

High-resolution climate signals in the Bølling–Allerød Interstadial (Greenland

Interstadial 1) as reflected in European tree-ring chronologies compared to marine

varves. Quat. Sci. Rev. 20, 1223–1232.

Fronval, T., Jansen, E., 1997. Eemian and early Weichselian (140-60 ka)

paleoceanography and paleoclimate in the Nordic seas with comparisons to

Holocene conditions. Paleoceanography 12, 443–462.

Giraudeau, J., Grelaud, M., Solignac, S., Andrews, J.T., Moros, M., Jansen, E., 2010.

Millennial-scale variability in Atlantic water advection to the Nordic Seas derived

from Holocene coccolith concentration records. Quat. Sci. Rev. 29, 1276–1287.

Grootes, P.M., Stuiver, M., White, J.W.C., Johnsen, S.J., Jouzel, J., 1993. Comparison of

oxygen isotope records from the GISP2 and GRIP Greenland ice cores. Nature 366,

552–554.

Hald, M., Andersson, C., Ebbesen, H., Jansen, E., Klitgaard-kristensen, D.,

Risebrobakken, B., Salomonsen, G.R., Sarnthein, M., Petter, H., Telford, R.J., 2007.

Variations in temperature and extent of Atlantic Water in the northern North Atlantic

during the Holocene. Quat. Sci. Rev. 26, 3423–3440.

Hall, I.R., Bianchi, G.G., Evans, J.R., 2004. Centennial to millennial scale Holocene

climate-deep water linkage in the North Atlantic. Quat. Sci. Rev. 23, 1529–1536.

Hall, I.R., Moran, S.B., Zahn, R., Knutz, P.C., Shen, C.-C., Edwards, R.L., 2006.

Accelerated drawdown of meridional overturning in the late-glacial Atlantic

triggered by transient pre-H event freshwater perturbation. Geophys. Res. Lett. 33,

L16616.

Hass, H.C., 2002. A method to reduce the influence of ice-rafted debris on a grain size

record from northern Fram Strait, Arctic Ocean. Polar Res. 21, 299–306.

Hemming, S.R., 2004. Heinrich events: Massive late Pleistocene detritus layers of the

North Atlantic and their global climate imprint. Rev. Geophys. 42, 1–43.

Hjelstuen, B.O., Sejrup, H.P., Haflidason, H., Nygård, A., Berstad, I.M., Knorr, G., 2004.

Late Quaternary seismic stratigraphy and geological development of the south

Vøring margin, Norwegian Sea. Quat. Sci. Rev. 23, 1847–1865.

Husum, K., Hald, M., 2012. Arctic planktic foraminiferal assemblages: Implications for

subsurface temperature reconstructions. Mar. Micropaleontol. 96-97, 38–47.

Kandiano, E.S., Bauch, H. a., Fahl, K., Helmke, J.P., Röhl, U., Pérez-Folgado, M., Cacho,

I., 2012. The meridional temperature gradient in the eastern North Atlantic during

MIS 11 and its link to the ocean–atmosphere system. Palaeogeogr. Palaeoclimatol.

Palaeoecol. 333-334, 24–39.

107

5. Evolution of the central Nordic Seas over the last 20 thousand years

Kobashi, T., Severinghaus, J.P., Brook, E.J., Barnola, J.-M., Grachev, A.M., 2007.

Precise timing and characterization of abrupt climate change 8200 years ago from air

trapped in polar ice. Quat. Sci. Rev. 26, 1212–1222.

Lekens, W.A.H., Sejrup, H.P., Haflidason, H., Petersen, G., Hjelstuen, B., Knorr, G.,

2005. Laminated sediments preceding Heinrich event 1 in the Northern North Sea

and Southern Norwegian Sea: Origin, processes and regional linkage. Mar. Geol.

216, 27–50.

Levitus, S., Boyer, T.P., 1994. World Ocean Atlas 1994, vol. 4, Temperature, NOAA

Atlas. ed. U.S. Department of Commerce, Washington, D.C.

Mangerud, J., 2004. Ice sheet limits on Norway and the Norwegian continental shelf, in:

Ehlers, J., Gibbard, P.L. (Eds.), Quaternary Glaciations: Extent and Chronology,

Vol. 1, Europe. Elsevier, Oxford, pp. 271–294.

Marcott, S.A., Clark, P.U., Padman, L., Klinkhammer, G.P., Springer, S.R., Liu, Z., Otto-

Bliesner, B.L., Carlson, A.E., Ungerer, A., Padman, J., He, F., Cheng, J., Schmittner,

A., 2011. Ice-shelf collapse from subsurface warming as a trigger for Heinrich

events. Proc. Natl. Acad. Sci. U. S. A. 108, 13415–13419.

Marshall, J., Schott, F., 1999. Open-ocean convection: Observations, theory, and models.

Rev. Geophys. 37, 1–64.

Mauritzen, C., 1996. Production of dense overflow waters feeding the North Atlantic

across the Greenland-Scotland Ridge. Part 1: Evidence for a revised circulation

scheme. Deep Sea Res. 43, 769–806.

McManus, J.F., Francois, R., Gherardi, J.-M., Keigwin, L.D., Brown-Leger, S., 2004.

Collapse and rapid resumption of Atlantic meridional circulation linked to deglacial

climate changes. Nature 428, 834–837.

Müller, J., Massé, G., Stein, R., Belt, S.T., 2009. Variability of sea-ice conditions in the

Fram Strait over the past 30,000 years. Nat. Geosci. 2, 772–776.

Müller, J., Werner, K., Stein, R., Fahl, K., Moros, M., Jansen, E., 2012. Holocene cooling

culminates in sea ice oscillations in Fram Strait. Quat. Sci. Rev. 47, 1–14.

Nørgaard-Pedersen, N., Spielhagen, R.F., Erlenkeuser, H., Grootes, P.M., Heinemeier, J.,

Knies, J., 2003. Arctic Ocean during the Last Glacial Maximum: Atlantic and polar

domains of surface water mass distribution and ice cover. Paleoceanography 18, 1–

19.

Nürnberg, D., Wollenburg, I., Dethleff, D., Eicken, H., Kassens, H., Letzig, T., Reimnitz,

E., Thiede, J., 1994. Sediments in Arctic sea ice: Implications for entrainment,

transport and release. Mar. Geol. 119, 185–214.

Olsen, J., Anderson, N.J., Knudsen, M.F., 2012. Variability of the North Atlantic

Oscillation over the past 5,200 years. Nat. Geosci. 5, 808–812.

108

5. Evolution of the central Nordic Seas over the last 20 thousand years

Pflaumann, U., Sarnthein, M., Chapman, M.R., D’Abreu, L., Funnel, B., Huels, M.,

Kiefer, T., Maslin, M.A., Schulz, H., Swallow, J., van Kreveld, S., Vautravers, M.,

Vogelsang, E., Weinelt, M.S., 2003. Glacial North Atlantic: Sea-surface conditions

reconstructed by GLAMAP 2000. Paleoceanography 18, 1065.

Rasmussen, T.L., Thomsen, E., Skirbekk, K., Ślubowska-Woldengen, M., Klitgaard

Kristensen, D., Koç, N., 2013. Spatial and temporal distribution of Holocene

temperature maxima in the northern Nordic seas: interplay of Atlantic-, Arctic- and

polar water masses. Quat. Sci. Rev.

Rasmussen, T.L., Thomsen, E., Ślubowska, M.A., Jessen, S., Solheim, A., Koç, N., 2007.

Paleoceanographic evolution of the SW Svalbard margin (76°N) since 20,000 14

C yr

BP. Quat. Res. 67, 100–114.

Reimer, P.J., Baillie, M.G.L., Bard, E., Bayliss, A., 2009. IntCal09 and Marine09

radiocarbon age calibration curves, 0–50,000 years cal BP. Radiocarbon 51, 1111–

1150.

Renssen, H., Goosse, H., Muscheler, R., 2006. Coupled climate model simulation of

Holocene cooling events: oceanic feedback amplifies solar forcing. Clim. Past 2, 79–

90.

Risebrobakken, B., Dokken, T.M., Smedsrud, L.H., Andersson, C., Jansen, E., Moros,

M., Ivanova, E. V., 2011. Early Holocene temperature variability in the Nordic Seas:

The role of oceanic heat advection versus changes in orbital forcing.

Paleoceanography 26, PA4206.

Risebrobakken, B., Jansen, E., Andersson, C., Mjelde, E., Hevrøy, K., 2003. A high-

resolution study of Holocene paleoclimatic and paleoceanographic changes in the

Nordic Seas. Paleoceanography 18, 1017.

Rohling, E.J., Pälike, H., 2005. Centennial-scale climate cooling with a sudden cold event

around 8,200 years ago. Nature 434, 975–979.

Rudels, B., Quadfasel, D., 1991. Convection and deep water formation in the Arctic

Ocean-Greenland Sea System. J. Mar. Syst. 2, 435–450.

Sarnthein, M., Jansen, E., Weinelt, M.S., Arnold, M., Duplessy, J.C., Erlenkeuser, H.,

Flatøy, A., Johannessen, G., Johannessen, T., Jung, S.J.A., Koç, N., Labeyrie, L.D.,

Maslin, M., Pflaumann, U., Schulz, H., 1995. Variations in Atlantic surface ocean

paleoceanography, 50°-80°N: A time-slice record of the last 30,000 years.

Paleoceanography 10, 1063–1094.

Sarnthein, M., van Kreveld, S., Erlenkeuser, H., Grootes, P.M., Kucera, M., Pflaumann,

U., Schulz, M., 2003. Centennial-to-millennial-scale periodicities of Holocene

climate and sediment injections off the western Barents shelf, 75°N. Boreas 32, 447–

461.

Seidenkrantz, M.-S., Ebbesen, H., Aagaard-Sørensen, S., Moros, M., Lloyd, J.M., Olsen,

J., Knudsen, M.F., Kuijpers, A., 2012. Early Holocene large-scale meltwater

109

5. Evolution of the central Nordic Seas over the last 20 thousand years

discharge from Greenland documented by foraminifera and sediment parameters.

Palaeogeogr. Palaeoclimatol. Palaeoecol. 391, 71–81.

Spielhagen, R.F., Erlenkeuser, H., 1994. Stable oxygen and carbon isotopes in planktic

foraminifers from Arctic Ocean surface sediments: Reflection of the low salinity

surface water layer. Mar. Geol. 119, 227–250.

Spielhagen, R.F., Werner, K., Aagaard-Sørensen, S., Zamelczyk, K., Kandiano, E.S.,

Budeus, G., Husum, K., Marchitto, T.M., Hald, M., 2011. Enhanced Modern Heat

Transfer to the Arctic by Warm Atlantic Water. Science 331, 450–453.

Stanford, J.D., Rohling, E.J., Bacon, S., Roberts, A.P., Grousset, F.E., Bolshaw, M.,

2011. A new concept for the paleoceanographic evolution of Heinrich event 1 in the

North Atlantic. Quat. Sci. Rev. 30, 1047–1066.

Stern, J. V., Lisiecki, L.E., 2013. North Atlantic circulation and reservoir age changes

over the past 41,000 years. Geophys. Res. Lett. 40, 3693–3697.

Straneo, F., Hamilton, G.S., Sutherland, D.A., Stearns, L.A., Davidson, F., Hammill,

M.O., Stenson, G.B., Rosing-Asvid, A., 2010. Rapid circulation of warm subtropical

waters in a major glacial fjord in East Greenland. Nat. Geosci. 3, 182–186.

Straneo, F., Heimbach, P., 2013. North Atlantic warming and the retreat of Greenland’s

outlet glaciers. Nature 504, 36–43.

Stuiver, M., Reimer, P.J., 1993. Radiocarbon calibration program. Radiocarbon 35, 215–

230.

Svendsen, J.I., Alexanderson, H., Astakhov, V.I., Demidov, I., Dowdeswell, J.A., Funder,

S., Gataullin, V., Henriksen, M., Hjort, C., Houmark-Nielsen, M., Hubberten, H.W.,

Ingólfsson, Ó., Jakobsson, M., Kjær, K.H., Larsen, E., Lokrantz, H., Lunkka, J.P.,

Lyså, A., Mangerud, J., Matiouchkov, A., Murray, A., Möller, P., Niessen, F.,

Nikolskaya, O., Polyak, L., Saarnisto, M., Siegert, C., Siegert, M.J., Spielhagen,

R.F., Stein, R., 2004. Late Quaternary ice sheet history of northern Eurasia. Quat.

Sci. Rev. 23, 1229–1271.

Swift, J., 1986. The Arctic waters, in: Hurdle, B. (Ed.), The Nordic Seas. New York, pp.

129–151.

Tarasov, L., Peltier, W.R., 2006. A calibrated deglacial drainage chronology for the North

American continent: evidence of an Arctic trigger for the Younger Dryas. Quat. Sci.

Rev. 25, 659–688.

Telesiński, M.M., Spielhagen, R.F., Bauch, H.A., 2014a. Water mass evolution of the

Greenland Sea since late glacial times. Clim. Past 10, 123–136.

Telesiński, M.M., Spielhagen, R.F., Lind, E.M., 2014b. A high-resolution Lateglacial and

Holocene palaeoceanographic record from the Greenland Sea. Boreas 43, 273–285.

110

5. Evolution of the central Nordic Seas over the last 20 thousand years

Thornalley, D.J.R., Blaschek, M., Davies, F.J., Praetorius, S., Oppo, D.W., McManus,

J.F., Hall, I.R., Kleiven, H., Renssen, H., McCave, I.N., 2013. Long-term variations

in Iceland–Scotland overflow strength during the Holocene. Clim. Past 9, 2073–

2084.

Thornalley, D.J.R., Elderfield, H., McCave, I.N., 2010. Intermediate and deep water

paleoceanography of the northern North Atlantic over the past 21,000 years.

Paleoceanography 25, 1–17.

Voelker, A.H.L., Grootes, P.M., Nadeau, M.-J., Sarnthein, M., 2000. Radiocarbon Levels

in the Iceland Sea From 25-53 kyr and their Link to the Earth’s Magnetic Field

Intensity. Radiocarbon 42, 437–452.

Waelbroeck, C., Duplessy, J.C., Michel, E., Labeyrie, L., Paillard, D., Duprat, J., 2001.

The timing of the last deglaciation in North Atlantic climate records. Nature 412,

724–727.

Wagner, T., Henrich, R., 1994. Organo-and lithofacies of glacial-interglacial deposits in

the Norwegian-Greenland Sea: Responses to paleoceanographic and paleoclimatic

changes. Mar. Geol. 120, 335–364.

Wanner, H., Solomina, O., Grosjean, M., Ritz, S.P., Jetel, M., 2011. Structure and origin

of Holocene cold events. Quat. Sci. Rev. 30, 3109–3123.

Weaver, A.J., Saenko, O.A., Clark, P.U., Mitrovica, J.X., 2003. Meltwater pulse 1A from

Antarctica as a trigger of the Bølling-Allerød warm interval. Science 299, 1709–

1713.

Weinelt, M.S., 1993. Veränderungen der Oberflächenzirkulation im Europäischen

Nordmeer während der letzten 60.000 Jahre. Berichte aus dem

Sonderforschungsbereich 313 41, 105.

Weinelt, M.S., Vogelsang, M., Kucera, M., Pflaumann, U., Sarnthein, M., Voelker,

A.H.L., Erlenkeuser, H., Malmgren, B.A., 2003. Variability of North Atlantic heat

transfer during MIS 2. Paleoceanography 18, 1071.

Werner, K., Spielhagen, R.F., Bauch, D., Hass, H.C., Kandiano, E.S., 2013. Atlantic

Water advection versus sea-ice advances in the eastern Fram Strait during the last 9

ka: Multiproxy evidence for a two-phase Holocene. Paleoceanography 28, 283–295.

Werner, K., Spielhagen, R.F., Bauch, D., Hass, H.C., Kandiano, E.S., Zamelczyk, K.,

2011. Atlantic Water advection to the eastern Fram Strait — Multiproxy evidence

for late Holocene variability. Palaeogeogr. Palaeoclimatol. Palaeoecol. 308, 264–

276.


Recommended