Signal Processing: Image Communication 89 (2020) 116005
LrKMa
b
c
d
A
KQVLHF
1
fat(iteob
f(wttst
hRA0
Contents lists available at ScienceDirect
Signal Processing: Image Communication
journal homepage: www.elsevier.com/locate/image
atency impact on Quality of Experience in a virtual reality simulator foremote control of machinesjell Brunnström a,b,∗, Elijs Dima b, Tahir Qureshi c, Mathias Johanson d, Mattias Andersson b,årten Sjöström b
RISE Research Institutes of Sweden AB, Kista, SwedenMid Sweden University, Sundsvall, SwedenHIAB AB, Hudiksvall, SwedenAlkit Communications AB, Mölndal, Sweden
R T I C L E I N F O
eywords:uality of Experience (QoE)irtual realityatencyead-Mounted Displays (HMD)orestry crane
A B S T R A C T
In this article, we have investigated a VR simulator of a forestry crane used for loading logs onto atruck. We have mainly studied the Quality of Experience (QoE) aspects that may be relevant for taskcompletion, and whether there are any discomfort related symptoms experienced during the task execution.QoE experiments were designed to capture the general subjective experience of using the simulator, and tostudy task performance. The focus was to study the effects of latency on the subjective experience, with regardsto delays in the crane control interface. Subjective studies were performed with controlled delays added to thedisplay update and hand controller (joystick) signals. The added delays ranged from 0 to 30 ms for the displayupdate, and from 0 to 800 ms for the hand controller. We found a strong effect on latency in the display updateand a significant negative effect for 800 ms added delay on latency in the hand controller (in total approx. 880ms latency including the system delay). The Simulator Sickness Questionnaire (SSQ) gave significantly higherscores after the experiment compared to before the experiment, but a majority of the participants reportedexperiencing only minor symptoms. Some test subjects ceased the test before finishing due to their symptoms,particularly due to the added latency in the display update.
. Introduction
Virtual and Augmented reality (VR, AR) are emerging technologiesor assisting or solving real world industrial problems. In this case were considering immersive techniques, where the user is visually in-eracting with the physical environment using Head-Mounted DisplaysHMD), also popularly denoted as ‘‘VR goggles’’. Potentially, this willmply that workers will be using such goggles for extended periods ofime; not only the same day, but most likely every working day for anxtended period. Therefore, the quality related issues are crucial, notnly because they are tied to performance and task completion, but alsoecause they affect the well-being of the worker.
In this study, we investigate a VR simulator of a forestry crane usedor loading logs onto a truck, mainly looking at Quality of ExperienceQoE) [1,2] aspects that may be relevant for task completion, but alsohether there are any discomfort related symptoms experienced during
ask execution. The target is an immersive video based system withhe ambition to also become an AR system that lets the crane operatortay in the truck cabin or a remote location, while loading logs ontohe truck, aided by a 270◦ HMD video view generated from four video
∗ Corresponding author at: RISE Research Institutes of Sweden AB, Kista, Sweden.E-mail address: [email protected] (K. Brunnström).
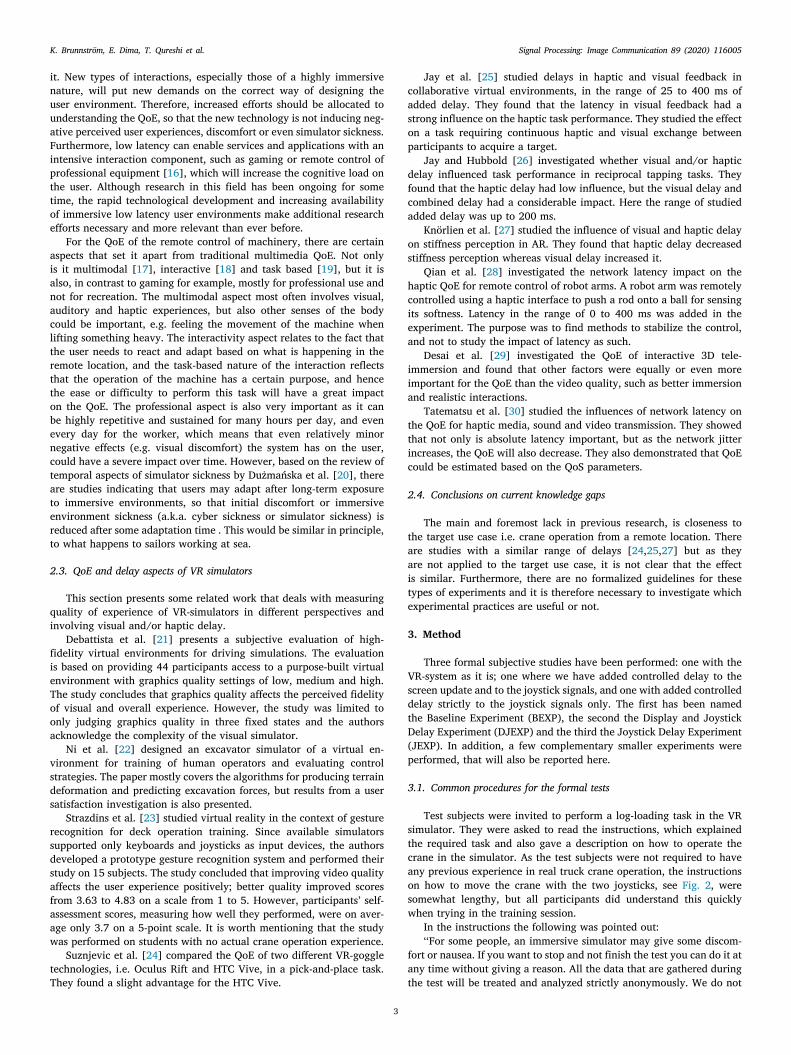
cameras mounted on the crane (see Fig. 1). The benefits of this systemare that the crane does not need to be equipped with an operator cabin,as well as improved safety and comfort for the operator. Connectedto the development of the system, a desktop simulator has also beendeveloped (see Fig. 2), which instead of displaying live video views,generates a virtual view using a 3D gaming engine. The VR simulatoris used as an educational tool and should simulate the authentic cranesystem as closely as possible. The present QoE study has focused on theVR simulator, with the intention to also be a starting point for assessingthe subjective experience of the AR system. Both the AR system and theVR simulator have the same crane control devices (joysticks) as the realones used in the truck cabin, and an Oculus Rift HMD for the visualpresentation.
QoE tests have been designed to capture the general subjectiveexperience of using the simulator, and to study the task completionrate. Moreover, a specific focus has been to study the effects of latencyon the subjective experience, with regards both to delays in the cranecontrol interface as well as lag in the visual scene that is rendered inthe HMD. Latency is of particular interest for two reasons: Firstly, it isa crucial design parameter for the AR system, since the processing of
K. Brunnström, E. Dima, T. Qureshi et al. Signal Processing: Image Communication 89 (2020) 116005
o
vapewtwtwhrffadic
Vtcpcoc
ecaa
2
2
tqwvb
tpiacu
Fig. 1. Photo, provided by HIAB AB, of VR-goggle based crane operation from a remote location. Left: Operator with a VR headset and two joysticks. Operator’s view is shownn the adjacent display. Right: The remotely operated crane.
ideo signals to generate the visual HMD scene is very CPU-consumingnd the tolerable delay serves as a performance requirement for therocessing hardware of the system. Secondly, we are interested inxploring the possibility of controlling a crane from a remote location,hich requires the video signals, as well as the crane control signals,
o be transmitted over a (typically wireless) network connection, whichill introduce delays. Hence, the delay tolerance strongly influences
he feasibility of such an approach. Subjective studies were performedhere we have added controlled delays to the display update andand controller (joystick) signals in the VR-simulator. The added delaysanged from 0 to 30 ms for the display update and from 0 to 800 msor the hand controller. The selected range of delays were obtainedrom the literature review (see below), and is supported by pre-testss well as the progression of the experiments where different ranges ofelays have been incorporated. That is based on the experiences gainedn previous studies [3,4] to cover a wider range of effective delaysompared to related works.
This paper builds upon two previous papers published at the Humanision and Electronic Imaging Conference [3,4]. It brings the results
ogether, adds analysis not previously published, including a deeperomparison between inexperienced and experienced log lifters, andossible effects of delay inertia, learning effect and time-in-test. It alsoontains an extended introduction and a more comprehensive reviewf the background and related state of the art. The discussion andonclusions sections are also extended.
Our work is unique in the sense that the simulator provides thexperience of the same real-world scenario, as the simulator is a digitallone of an actual product commercially available on the market. Inddition to this, the study includes participants from both academiand industry.
. Background
.1. Augmented telepresence
To highlight the focus and the direction of our work we are using theerm Augmented Telepresence (AT) to denote applications where highuality video-mediated communication is the enabling technology, buthere additional data can be superimposed on or merged with theideo as in Augmented Reality. It is not yet a commonly used term,ut has been used by a few authors [5,6].
AT is similar to augmented reality in that it tries to present addi-ional information on top of the image view as seen by the user. Itrimarily differs from augmented reality in that the user is presentn a remote location and is observing the augmented view, but maylso include the case where a two-way audio and/or audio-visualommunication channel is being retained at the same time with theser seeing the augmented view.
2
2.2. Quality of experience
Quality of Experience (QoE) is the degree of delight or annoyance ofthe user of an application or service. It results from the fulfillment of hisor her expectations with respect to the utility and/or enjoyment of theapplication or service in light of the user’s personality and current state,as defined by EU Cost Action 1003 Qualinet [2] and standardized by theInternational Telecommunication Union (ITU) [1]. A comprehensiveoverview of the field can be found in the recent QoE book by Möllerand Raake [7].
The above definition of QoE, which is also pointed out by Möllerand Raake [7], goes beyond the traditional QoE and Quality of Service(QoS) research and makes a clear overlap with the User Experience(UX) research tradition. These two fields originate from two differ-ent technoscientific communities, i.e. Telecommunications and HumanComputer Interaction (interaction design) respectively. The QoE com-munity is still in the process of embracing some of the more user-centricand UX-like methods.
Traditionally, in QoE research, the methods to gain insight intothe delivered quality of a service and the users’ experience of it havebeen conducted through controlled laboratory experiments, where theopinions of multiple panels of users have been collected. The results aretypically reported as Mean Opinion Scores (MOS). These methods areusually referred to as subjective quality assessment methods and thereare standardized ways of conducting them, e.g. for visual quality ITU-RRec. BT.500-13 [8] or ITU-T Rec. P.910 [9]. They have been criticizedfor not providing enough ecological validity [10]. Improvements havebeen done for example in ITU-T Rec. P.913 [11]. Investigations into3D video quality a few years ago, when the 3D TV hype was the mostintense, resulted in new Recommendations from the ITU [12–14]. Itwas discovered that if care was not taken, several users experiencedissues such as discomfort, and visual fatigue may occur. The Recom-mendations give some guidance on how to minimize these. An attemptto build an experimental framework for QoE of AR was made byPuig et al. [15] who advocate a combination of subjective assessment(e.g. questionnaires, subjective ratings) and objective measurements(e.g. task completion time, error rates). They only presented the resultsfrom a pilot study, so it still needs to be experimentally confirmedwhether the framework gives scientifically reproducible results and ifit can be extended to AT.
Now we are in the early stages of large-scale deployment of fullyimmersive environments, supported by advances in HMD technology,e.g. Oculus Rift, PS4 VR, and HTC Vive. Furthermore, the deploymentof 5G mobile telecommunications infrastructure will support higherbandwidth, and, perhaps even more importantly, lower latency commu-nication. This means that we are now facing low latency and distributedimmersive environments on a large scale, meaning that it is of utmostimportance to understand the user experience issues connected to
K. Brunnström, E. Dima, T. Qureshi et al. Signal Processing: Image Communication 89 (2020) 116005
it. New types of interactions, especially those of a highly immersivenature, will put new demands on the correct way of designing theuser environment. Therefore, increased efforts should be allocated tounderstanding the QoE, so that the new technology is not inducing neg-ative perceived user experiences, discomfort or even simulator sickness.Furthermore, low latency can enable services and applications with anintensive interaction component, such as gaming or remote control ofprofessional equipment [16], which will increase the cognitive load onthe user. Although research in this field has been ongoing for sometime, the rapid technological development and increasing availabilityof immersive low latency user environments make additional researchefforts necessary and more relevant than ever before.
For the QoE of the remote control of machinery, there are certainaspects that set it apart from traditional multimedia QoE. Not onlyis it multimodal [17], interactive [18] and task based [19], but it isalso, in contrast to gaming for example, mostly for professional use andnot for recreation. The multimodal aspect most often involves visual,auditory and haptic experiences, but also other senses of the bodycould be important, e.g. feeling the movement of the machine whenlifting something heavy. The interactivity aspect relates to the fact thatthe user needs to react and adapt based on what is happening in theremote location, and the task-based nature of the interaction reflectsthat the operation of the machine has a certain purpose, and hencethe ease or difficulty to perform this task will have a great impacton the QoE. The professional aspect is also very important as it canbe highly repetitive and sustained for many hours per day, and evenevery day for the worker, which means that even relatively minornegative effects (e.g. visual discomfort) the system has on the user,could have a severe impact over time. However, based on the review oftemporal aspects of simulator sickness by Dużmańska et al. [20], thereare studies indicating that users may adapt after long-term exposureto immersive environments, so that initial discomfort or immersiveenvironment sickness (a.k.a. cyber sickness or simulator sickness) isreduced after some adaptation time . This would be similar in principle,to what happens to sailors working at sea.
2.3. QoE and delay aspects of VR simulators
This section presents some related work that deals with measuringquality of experience of VR-simulators in different perspectives andinvolving visual and/or haptic delay.
Debattista et al. [21] presents a subjective evaluation of high-fidelity virtual environments for driving simulations. The evaluationis based on providing 44 participants access to a purpose-built virtualenvironment with graphics quality settings of low, medium and high.The study concludes that graphics quality affects the perceived fidelityof visual and overall experience. However, the study was limited toonly judging graphics quality in three fixed states and the authorsacknowledge the complexity of the visual simulator.
Ni et al. [22] designed an excavator simulator of a virtual en-vironment for training of human operators and evaluating controlstrategies. The paper mostly covers the algorithms for producing terraindeformation and predicting excavation forces, but results from a usersatisfaction investigation is also presented.
Strazdins et al. [23] studied virtual reality in the context of gesturerecognition for deck operation training. Since available simulatorssupported only keyboards and joysticks as input devices, the authorsdeveloped a prototype gesture recognition system and performed theirstudy on 15 subjects. The study concluded that improving video qualityaffects the user experience positively; better quality improved scoresfrom 3.63 to 4.83 on a scale from 1 to 5. However, participants’ self-assessment scores, measuring how well they performed, were on aver-age only 3.7 on a 5-point scale. It is worth mentioning that the studywas performed on students with no actual crane operation experience.
Suznjevic et al. [24] compared the QoE of two different VR-goggletechnologies, i.e. Oculus Rift and HTC Vive, in a pick-and-place task.They found a slight advantage for the HTC Vive.
3
Jay et al. [25] studied delays in haptic and visual feedback incollaborative virtual environments, in the range of 25 to 400 ms ofadded delay. They found that the latency in visual feedback had astrong influence on the haptic task performance. They studied the effecton a task requiring continuous haptic and visual exchange betweenparticipants to acquire a target.
Jay and Hubbold [26] investigated whether visual and/or hapticdelay influenced task performance in reciprocal tapping tasks. Theyfound that the haptic delay had low influence, but the visual delay andcombined delay had a considerable impact. Here the range of studiedadded delay was up to 200 ms.
Knörlien et al. [27] studied the influence of visual and haptic delayon stiffness perception in AR. They found that haptic delay decreasedstiffness perception whereas visual delay increased it.
Qian et al. [28] investigated the network latency impact on thehaptic QoE for remote control of robot arms. A robot arm was remotelycontrolled using a haptic interface to push a rod onto a ball for sensingits softness. Latency in the range of 0 to 400 ms was added in theexperiment. The purpose was to find methods to stabilize the control,and not to study the impact of latency as such.
Desai et al. [29] investigated the QoE of interactive 3D tele-immersion and found that other factors were equally or even moreimportant for the QoE than the video quality, such as better immersionand realistic interactions.
Tatematsu et al. [30] studied the influences of network latency onthe QoE for haptic media, sound and video transmission. They showedthat not only is absolute latency important, but as the network jitterincreases, the QoE will also decrease. They also demonstrated that QoEcould be estimated based on the QoS parameters.
2.4. Conclusions on current knowledge gaps
The main and foremost lack in previous research, is closeness tothe target use case i.e. crane operation from a remote location. Thereare studies with a similar range of delays [24,25,27] but as theyare not applied to the target use case, it is not clear that the effectis similar. Furthermore, there are no formalized guidelines for thesetypes of experiments and it is therefore necessary to investigate whichexperimental practices are useful or not.
3. Method
Three formal subjective studies have been performed: one with theVR-system as it is; one where we have added controlled delay to thescreen update and to the joystick signals, and one with added controlleddelay strictly to the joystick signals only. The first has been namedthe Baseline Experiment (BEXP), the second the Display and JoystickDelay Experiment (DJEXP) and the third the Joystick Delay Experiment(JEXP). In addition, a few complementary smaller experiments wereperformed, that will also be reported here.
3.1. Common procedures for the formal tests
Test subjects were invited to perform a log-loading task in the VRsimulator. They were asked to read the instructions, which explainedthe required task and also gave a description on how to operate thecrane in the simulator. As the test subjects were not required to haveany previous experience in real truck crane operation, the instructionson how to move the crane with the two joysticks, see Fig. 2, weresomewhat lengthy, but all participants did understand this quicklywhen trying in the training session.
In the instructions the following was pointed out:‘‘For some people, an immersive simulator may give some discom-
fort or nausea. If you want to stop and not finish the test you can do it atany time without giving a reason. All the data that are gathered duringthe test will be treated and analyzed strictly anonymously. We do not
K. Brunnström, E. Dima, T. Qureshi et al. Signal Processing: Image Communication 89 (2020) 116005
Table 1The symptoms in the Simulator Sickness Symptoms by Kennedy et al. [31].
keep record on who is participating in the test that can be connectedto the data’’.
Consent from the test subjects was obtained prior to conducting theexperiments.
The test subjects were then asked to fill in a questionnaire with afew general questions about their experience in operating truck cranesand in using VR.
A Simulator Sickness Questionnaire (SSQ) [31,32] was adminis-tered. The questionnaire contained 16 symptoms, listed in Table 1,that were identified by Kennedy et al. [31] as relevant for indicatingsimulator sickness.
For each of the symptoms there are four possible levels of response:None, Slight, Moderate and Severe. At the beginning of the experiment,the test subjects were asked to put on the HMD and adjust the sharpnessof the image as necessary. Then the training session started. The task forthe training session was to load two logs onto the truck. If somethingwas still unclear, the test subjects were allowed to ask, and the testleader attempted to answer to make sure that the task and operationof the crane were clear. After the training, the main test phases tookplace.
After the main tests, a post-questionnaire was filled in by the testsubjects, covering questions on their impression of the system and thenthe SSQ was applied once more.
The aforementioned procedures were common for all the formalexperiments included in this study. The unique specifics of each ex-periment (BEXP, DJEXP, JEXP) are further discussed in the respectivefollowing Sections 3.3–3.5.
3.2. Apparatus
The simulator is designed for training new customers and perform-ing user experience studies related to the actual product. The simulatorincludes VR goggles (Oculus Rift) which provide stitched stereo cameraviews, joysticks for controlling the crane, and a simulation environmentof lifting logs onto the truck. The computer used is a VR-ready ASUSROG Strix GL702VM GTX 1060 Core i7 16 GB 256 GB SSD 17.3′′.The simulation software environment was built in Unity 2017.3. Theinput signals from the Joysticks are converted by a special purposeinterface card to give gamepad signals over USB. It was estimated fromthe simulator software developer that the delays in the baseline systemwere about 25 ms in the screen update from the movement of the headto rendering and about 80 ms from movement of Joysticks to visualfeedback on the screen.
3.3. Baseline experiment
3.3.1. ProcedureFor the baseline experiment (BEXP), although no specific demands
on any specific visual ability were specified before the study, the test
4
subjects’ vision was investigated and noted down, by performing aSnellen visual acuity test, a 14-chart Ishihara color blind test and aRandot stereo acuity test. The dominant eye was also investigated andnoted down.
The main task consisted of loading two piles of logs with 16 logseach onto the truck. When one pile was completed, the test subjectshad a short break, and the test leader noted down the task completiontime and restarted the program. This task took about 15 min for onepile of logs.
After the main task was completed, the experience was investigatedby letting the test subject indicate their responses on rating scales,shown in Fig. 3 as printed on the paper score sheet given to theparticipants. The scales have been constructed so that the apparentdistance between the different levels is equal, for fulfilling interval scaleproperties and enabling quantitative parametric analysis of the scores.
3.3.2. Lab conditions and test subjectsThe Baseline experiment was conducted at RISE Research Institutes
of Sweden AB, Kista, Sweden, within a lab room specifically for sub-jective experiments. The room was kept quiet from disturbing noisesand at a comfortable temperature. Note that lighting conditions wereirrelevant, due to the use of HMD.
3.3.3. Test subjectsEighteen test subjects internally recruited from RISE completed the
test, 12 males and 6 females, with a mean age of 40. The youngestparticipants were 23 and the oldest 58. All but two test persons hadnormal or corrected to normal visual acuity. These two had slightlylower visual acuity but could still perform the task without any prob-lems. Two other participants were either color-blind or had a reducedability to perceive colors. The 3D acuity varied between 4 and 10, witha mean acuity of 8.
3.3.4. AnalysisThe MOS was calculated as outlined in Section 3.6.1. There were no
statistical tests performed between the MOS of the used scales, as eachscale represents different questions and experience categories, whichare not directly comparable to each other.
The SSQ was analyzed as described in Section 3.6.2.
3.4. Display and joystick delay experiment
3.4.1. ProcedureFor the Display and Joystick delay experiment (DJEXP), we simpli-
fied the procedure for the visual abilities by letting the test subjectsself-report their visual status.
The training session in DJEXP was conducted in the same way asin BEXP. It had the added purpose of giving the test subjects a senseof the baseline-delay case and this was pointed out in the instructions.The main task was to load logs onto the truck for about 20 min. Thedelay of the screen update and the Joysticks were adjusted every 2 minand the test subject was asked to give his or her quality ratings verballyafter about 1.5 min (in practice it turned out that more time was neededto give the response, so almost the whole second minute was used forthat). The simulator program was restarted after each completed 2 mintrial. The scales used were the same as in BEXP, see Fig. 3, except thatwe added a scale about the experienced comfort. They were also shownas text sentences, as follows:
• How would you rate the picture quality?• How would you rate the responsiveness of the system?• How would you rate your ability to accomplish your task of
loading the logs on the truck?• How would you rate your comfort (as in opposite to discomfort)?• How would you rate the immersion of the experience?
• How would you rate your overall experience?
K. Brunnström, E. Dima, T. Qureshi et al. Signal Processing: Image Communication 89 (2020) 116005
Asp
tal
b
Tds
3
Sfl
3
favoootcep
3
ScFJ
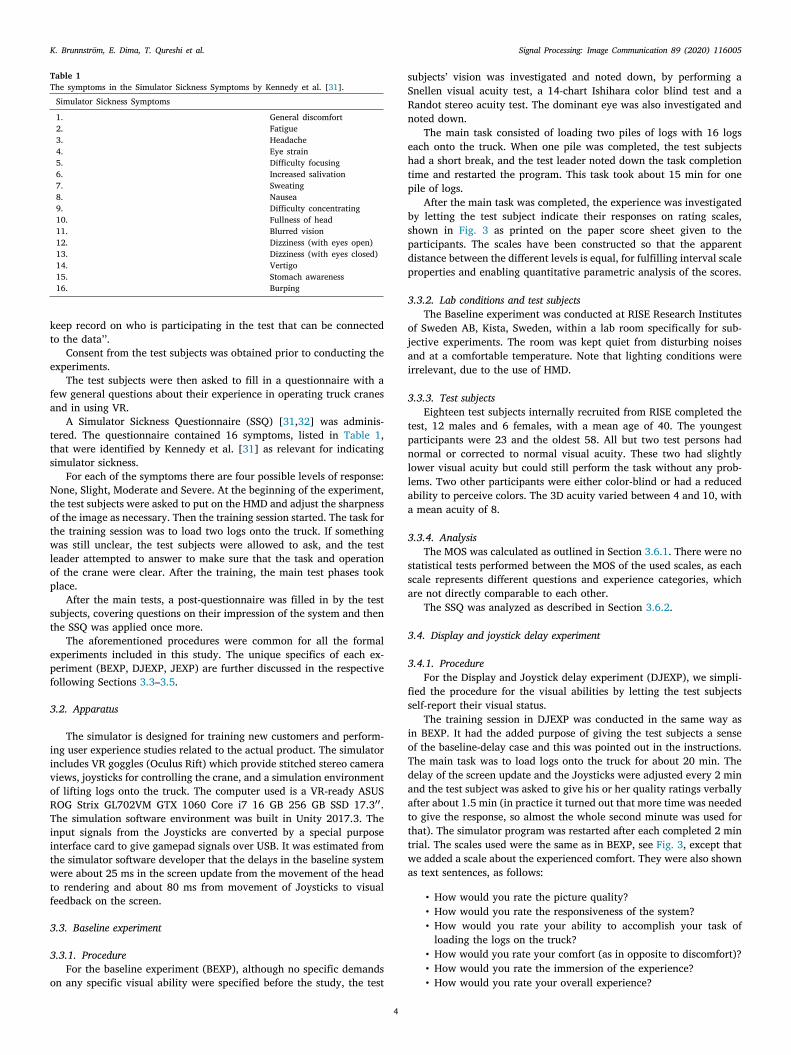
Fig. 2. The two joysticks for operating the crane in the VR simulator and the HMD (Oculus Rift).
graphical representation of the scale was shown after these sentences,ee Fig. 4, in the instructions, in order to give the test subjects a mentalicture of the scale.
When the test subject was giving their ratings verbally, they gavehe response vocally with the category labels: Bad, Poor, Fair, Goodnd Excellent. The questions above were repeated verbally by the testeader and the score noted down.
Ten delay conditions were used (nine with added delay and oneaseline-delay). These were:
• Reference condition: baseline-delay (25 ms for Display and 80 msfor Joystick)
• Display delay (ms): 5, 10, 20 and 30• Joystick delay (ms): 10, 20, 50, 100 and 200
he order was randomized per test subject. The choice of joystick andisplay delays was based on related works [24,25,27] and previoustudies [3,4].
.4.2. Lab conditionsThe display and joystick delay experiment was conducted at Mid
weden University, in a reserved office room. The room was kept quietrom disturbing noises and at a comfortable temperature. Note thatighting conditions were irrelevant, due to the use of HMD.
.4.3. Test subjectsThirty-five test subjects participated in the test, 26 males and 9
emales, with a mean age of 39, the youngest participant being 23nd the oldest 61. They were recruited from the Mid Sweden Uni-ersity and were a mixture of students and staff. The visual statusf the test subjects was self-reported. The experiment had a mixturef participants with corrected-to-normal and uncorrected vision. Nonef the participants reported problems with performing the experimentask due to vision issues. Only five subjects had prior experience withrane operation prior to the test. One of those subjects had 23 years ofxperience and was operating such a crane every day at work. Most testarticipants (28) had little to no prior experience with VR or HMDs.
.4.4. AnalysisScale analysis and SSQ analysis was performed as described in
ection 3.6. The comparisons and statistical tests between all involvedonditions were performed for each scale and delay type separately.or the Display delay we have 5 × 4/2 = 10 comparisons and for theoystick delay 6 × 5/2 = 15 comparisons.
5
3.5. Joystick delay experiment
3.5.1. ProcedureAs in DJEXP, in the Joystick delay experiment (JEXP) the training
session had the additional purpose of giving the test subjects a senseof the no-delay case and this was made clear in the instructions. Themain task was to load logs onto the truck 6 times in 2 min periods. Thejoystick delay was adjusted every 2 min, and the test subject was askedto give his or her quality ratings verbally, as was done also in DJEXP.In contrast to DJEXP, the answers given in JEXP were after each 2 minsession when the test subjects had been asked to stop. The simulatorprogram was restarted after that. The questions asked and rating scaleused were as shown below:
• How many logs did you load these two minutes?• How would you rate the responsiveness of the system?• How would you rate your ability to accomplish your task of
loading the logs on the truck?• How would you rate your comfort (as in opposite to discomfort)?• How would you rate the immersion of the experience?• How would you rate your overall experience?
Like in DJEXP, a graphical representation of the scale was shown afterthese sentences, see Fig. 4, in the instructions, to give the test subjectsa mental picture of the scale.
When the test subjects were giving their ratings verbally, theygave the response with the category labels: Bad, Poor, Fair, Good andExcellent. The questions above were repeated verbally by the test leaderand the score noted down.
Six delay conditions were used (five with added delay and oneno-delay, applied on top of the inherent operational delay within thesystem). These were:
• Reference condition: no delay• Joystick delay (ms): 50, 100, 200, 400 and 800
The order was randomized per test subject. The choice of the delay usedwas based on other studies [24,25,27] as well as own pre-studies [3,4] and the preliminary findings from DJEXP, which motivated theaddition of higher delay levels.
K. Brunnström, E. Dima, T. Qureshi et al. Signal Processing: Image Communication 89 (2020) 116005
Fig. 3. The rating scales used to investigate the Quality of Experience (QoE), as printed on the paper score sheet.
Fig. 4. Scale used in the Display and Joystick Delay experiment and in the Joystick Delay experiment, as visualized in the written instructions.
3.5.2. Lab conditionsThe Joystick delay experiment was conducted at RISE’s lab in Kista,
Sweden. The room was kept quiet from disturbing noises, and at acomfortable temperature. Note that lighting conditions were irrelevant,due to the use of HMD.
3.5.3. Test subjectsThirty-one test subjects participated in the test, 22 males and 9
females, with a mean age of 39 where the youngest participant was
6
22 and the oldest 64. They were recruited from RISE in Kista, Sweden,and made up of a variety of staff, visiting researchers and students.None of the test subjects were experienced in operating a real truckcrane. Most of the subjects had little or no experience in using VR-systems (26) and some had gained their experience by participatingin one of our previous studies. The visual status of the test subjectswas self-reported. None of the participants reported any problems withperforming the task based on vision issues. Some of the test subjectswore their glasses while using the HMD.
K. Brunnström, E. Dima, T. Qureshi et al. Signal Processing: Image Communication 89 (2020) 116005
𝑇
3.5.4. AnalysisScale analysis and SSQ analysis performed as described in Sec-
tion 3.6. The comparisons and statistical test between all involved con-ditions were performed for each scale separately, which gives 6 × 5/2= 15 comparisons. In addition, for the JEXP experiment we conductedadditional analysis on:
• Comparison with experienced log lifters (see Section 4.3.1)• Effect of delay inertia (see Section 4.3.2)• Learning effect (see Section 4.3.3)• Time-In-Test (see Section 4.3.4)
3.6. Analysis
3.6.1. Scale analysisThe scale responses were given numerical values when analyzed
using the following: Bad = 1, Poor = 2, Fair = 3, Good = 4 and Excellent= 5. The instructions displayed a graphical representation of the scaleswith equal distances between the categories. It was also explained inthe written text within the instructions. We have therefore assumed thatwe can analyze the scales as interval scales. The mean opinion scores(MOS) were calculated from the scale responses of the test subjects.
First a Normality test was performed based on the method ofShapiro and Wilks [33].
We adopted the Bonferroni method [34] for compensating for mul-tiple comparisons, as the planned number of comparisons were ratherfew. In this method, the considered significance level (𝛼) is dividedby the number of comparisons (n) so that the significance level foreach comparison will be 𝛼/n. For 95% confidence 𝛼 = 0.05. For theDisplay delays, there were 10 comparisons in DJEXP and then we usedp ≤ 0.05∕10 = 0.005 as the per comparison significance level. For theJoystick delays in both DJEXP and JEXP there were 15 comparisonsand the significance level per comparison then became p ≤ 0.05∕15 =0.0033.
The statistical test performed was the dependent T-test for pairedsamples [35]. As the result will demonstrate, the Normality will nothold in most cases (see Section 4), but the T-test has been shown tobe very robust under deviations from Normality [36]. Nevertheless,to prevent reaching the wrong conclusion, the Wilcoxon signed-ranktest was also performed [35], which is the non-parametric counterpartof the dependent T-test for paired samples and does not rely on theNormality assumptions.
3.6.2. SSQ analysisThe questionnaire answers were interpreted into a number, in our
case by None = 0, Slight = 1, Moderate = 2, Severe = 3 for allowingparametric statistical analysis.
Kennedy et al. [7] suggested a statistical analysis for the SSQ bygrouping the different symptoms into three groups: Nausea (N), Oculo-motor (O) and Disorientation (D). They also calculated a total score(TS). The Nausea symptom group contained the symptoms nausea,stomach awareness, increased salivation and burping. The Oculomotorgrouped eyestrain, difficulty focusing, blurred vision, and headache.The symptom group Disorientation included the symptoms dizzinessand vertigo. The groups are not completely separated since a few ofthe variables are used when calculating the scores in more than onegroup, e.g. nausea and difficulty concentrating. Table 2 indicates whichof the symptoms are grouped together within Nausea, Oculomotor orDisorientation groups. The group scores are calculated by summing upthe values with a ‘1’ coefficient in Table 2 and multiplying that sum bythe factors at the bottom of the table. Each symptom value is obtainedusing the conversion between severity and numerical value as describedabove.
After the scores for N, O, D & TS were calculated, the partici-pant simulator sickness was calculated, taking the mean of all theparticipants once before, and once after the experiment.
7
Table 2SSQ score calculations as described in Kennedy et al. [31].
Fig. 5. The Mean Opinion Scores (MOS) for the baseline experiment. From theleft along the x-axis the Picture Quality (PQ), Responsiveness Quality (RQ), TaskAccomplishment Quality (TQ), Immersive Quality (IQ) and Overall Quality (OQ) areshown. The error bars indicate 95% confidence intervals.
The number of interesting comparisons performed were betweeneach symptom group before and after, four comparisons in total. Thisgives 𝛼 = 0.05 p ≤ 0.0125 as the significance level. Here, the statis-tical test was performed with a one-tailed dependent T-test for pairedsamples.
4. Results
The results of the three primary experiments (BEXP, DJEXP, JEXP)are presented in this section, and are based on the analysis methodmainly outlined in Section 3.6.
4.1. Baseline experiment
The mean and the 95% confidence intervals of the ratings of thedifferent scales used can be seen in Fig. 5. In Fig. 3 the full ratingquestions as well as the rating scales are shown, as presented to thetest subjects.
K. Brunnström, E. Dima, T. Qureshi et al. Signal Processing: Image Communication 89 (2020) 116005
=9
tU3a
is
N
rT(c
tIW
ad
siDeap
4
N9a
clgdwit
The Picture Quality (PQ) was experienced as being between bothFair and Good. For the Responsiveness Quality (RQ) the scores werehigher, and the mean resulted in being just above Good. The TaskAccomplishment Quality (TQ), much like PQ, was also rated betweenFair and Good. The Immersive Quality (IQ) and Overall Quality (OQ)were experienced as higher than Good.
The mean task completion time was 26.5 min, with a standarddeviation of 8.7 min.
The SSQ showed only a minor increase in the symptom strength,see Fig. 6. However, the statistical test shows significant increase forDisorientation, as p = 0.004 < 0.01. The other symptom groups werenot as significant, with Nausea having p = 0.03, Oculomotor having p= 0.17 and the Total score p = 0.02. Most test subjects reported onlyslight symptoms if any, and only one participant reported experiencinga moderate symptom. One interesting case featuring an especiallysensitive person was encountered. The person in question did, justafter 2 min, report Severe discomfort, including Nausea, Vertigo andStomach awareness, as well as Moderate Sweating and Dizziness withhis or her eyes open. This person was not participating in the actualtest, but tested the simulator in a demo session. It seems that there is asmall fraction of very sensitive people, but the majority had no majorproblems with this simulator.
4.2. Display and joystick delay experiment
The analysis was performed as described in Section 3.6.1. TheNormality tests rejected the hypothesis of a Normal distribution at a95% confidence for all tested cases i.e. the performance metric as wellas for all the scales and all delays.
Ten test subjects ceased the test and therefore, did not complete allof the test conditions. The reason to stop was because of encounteringdiscomfort and nausea. In most cases, this was related to the experienceof higher added Display delay conditions just before stopping i.e. addedDisplay delay ≥ 20 ms with baseline delay ≥ 45 ms. The test leader waspresent during the whole test and could monitor and give feedback tothe test subject to continue or not if they felt discomfort or nausea. Therecommendation in most cases was to discontinue the test. The ratingsdetailed up to the point of stopping have been included in the analysis,and the ratings not given have been treated in the analysis as missingdata. In all cases, the SSQ were filled in for these test subjects, so thesescores have been included in the analysis.
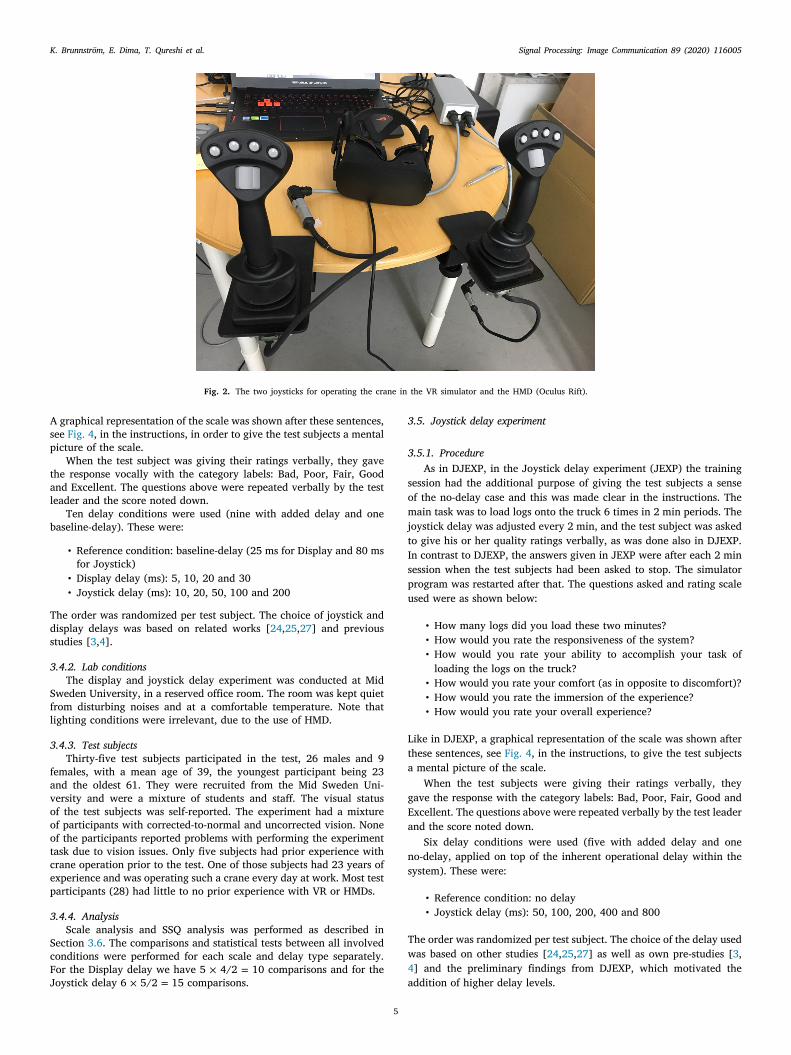
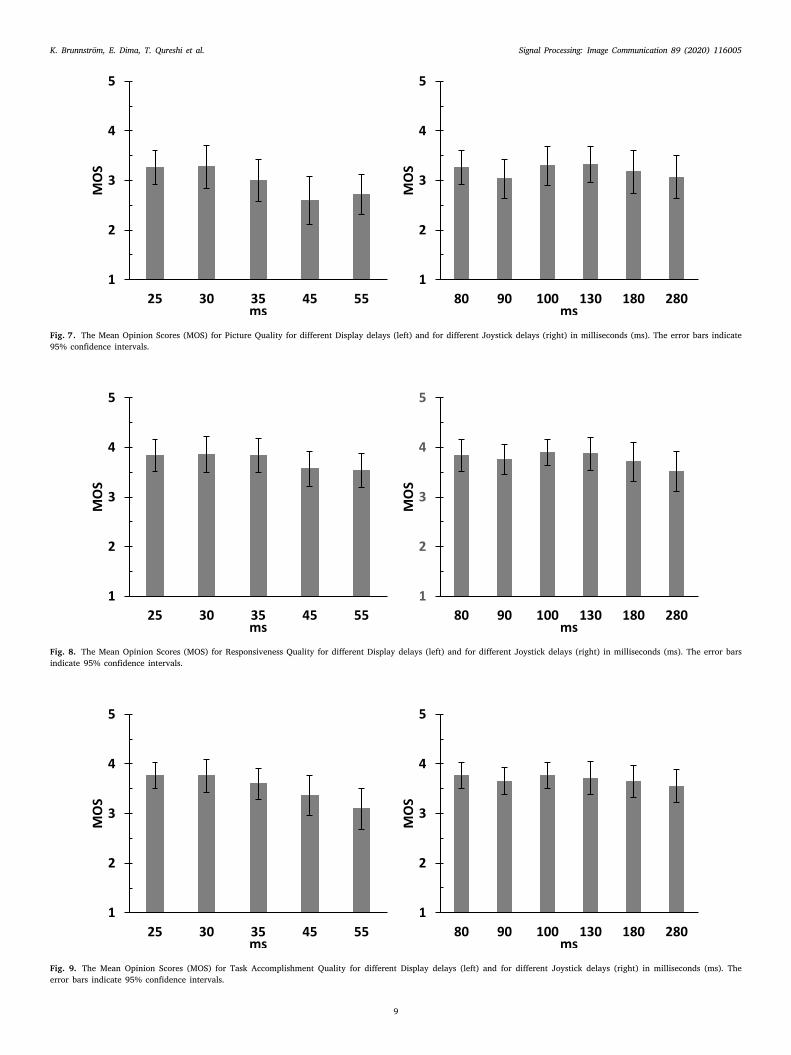
The results from the rating scales are shown in Figs. 7 to 12. Tothe left, the MOS for different Display delays (DD) are drawn and tothe right, the MOS for different Joystick delays (JD). The total delaysare specified in the graphs, which is baseline delay (discussed andconfirmed by the manufacturer of the simulator) plus added delay. ForDD it is 25 ms + (5 ms, 10 ms, 20 ms, 30 ms) = 30 ms, 35 ms, 45 ms
8
and 55 ms. For JD it is 80 ms + (10 ms, 20 ms, 50 ms, 100 ms, 200 ms)90 ms, 100 ms, 130 ms, 180 ms and 280 ms. The error bars indicate
5% confidence intervals.In Fig. 7, the MOS of the Picture Quality is shown. There is a
rend for lower PQ at higher DDs, there is no clear trend for the JDs.nexpectedly, 20 ms added Display delay (45 ms) was rated worse than0 ms (55 ms) added delay, but the difference could not be determineds statistically significant.
In Fig. 8, the MOS of the Responsiveness Quality is shown. Theres a trend for lower RQ at higher delays, but the differences are notignificant.
In Fig. 9, the MOS of the Task Accomplishment Quality is shown.o clear trend can be noticed.
In Fig. 10, the MOS of the Comfort Quality is shown. The comfort iseduced by longer delay and this trend is clearer for the Display delay.he 30 ms added Display delay (in total 55 ms) is significantly lowerT-test: p = 0.0019 < 0.005, Wilcoxon: p = 0.0033 < 0.005), than theomfort quality for baseline-delay.
In Fig. 11 the MOS of the Immersion Quality is shown. There is arend for lower Immersion Quality at higher delays. 30 ms added delayQ (55 ms) is very close to being significant (T-test: p = 0.0056 > 0.005
ilcoxon: p = 0.009 > 0.005) compared to the baseline-delay case.In Fig. 12, the MOS of the Overall Quality is shown. The OQ has
similar trend to the IQ but is not as clear. No significance wasiscovered.
The SSQ analysis for the delay revealed a large increase in theymptom levels (Fig. 13), all of which were statistically significant.e. <0.0125; where Nausea had p = 0.00005, Oculomotor p = 0.007,isorientation (p = 0.00008) and the Total Score (p = 0.0002). How-ver, only 2 test subjects reported symptoms on a Severe level. In thisnalysis, all test subjects were included, even those not completing therimary session.
.3. Joystick delay experiment
The analysis was performed as described in Section 3.6.1. Theormality tests rejected the hypothesis of a Normal distribution at a5% confidence for all tested cases i.e. the performance metric as wells for all the scales and all delays.
Two test subjects aborted the test and did not complete all testonditions. The reason to stop was discomfort and nausea. The testeader was present during the entire test and could monitor and alsoive feedback to test subjects whether to continue or not if they feltiscomfort or nausea. In two cases, the recommendation to participantsas to stop. The ratings given up to the point of stopping have been
ncluded in the analysis. In all cases the SSQ were filled in for theseest subjects, so these scores have been included in the analysis.
Fig. 6. Simulator Sickness Questionnaire (SSQ) scores for the baseline experiment, where the left (light gray) bars represent the symptom levels before the experiment and theright (dark gray and striped indicating statistically significant difference) bars the symptom levels after the experiment. The different symptom groups along the x-axis are: Nausea(N), Oculomotor (O), Disorientation (D) and the Total Score (TS). The error bars indicate 99% confidence intervals.
K. Brunnström, E. Dima, T. Qureshi et al. Signal Processing: Image Communication 89 (2020) 116005
Fig. 7. The Mean Opinion Scores (MOS) for Picture Quality for different Display delays (left) and for different Joystick delays (right) in milliseconds (ms). The error bars indicate95% confidence intervals.
Fig. 8. The Mean Opinion Scores (MOS) for Responsiveness Quality for different Display delays (left) and for different Joystick delays (right) in milliseconds (ms). The error barsindicate 95% confidence intervals.
Fig. 9. The Mean Opinion Scores (MOS) for Task Accomplishment Quality for different Display delays (left) and for different Joystick delays (right) in milliseconds (ms). Theerror bars indicate 95% confidence intervals.
9
K. Brunnström, E. Dima, T. Qureshi et al. Signal Processing: Image Communication 89 (2020) 116005
i
9
fsi
Fig. 10. The Mean Opinion Scores (MOS) for Comfort Quality for different Display delays (left) and for different Joystick delays (right) in milliseconds (ms). The error barsindicate 95% confidence intervals.
Fig. 11. The Mean Opinion Scores (MOS) for Immersion Quality for different Display delays (left) and for different Joystick delays (right) in milliseconds (ms). The error barsndicate 95% confidence intervals.
Fig. 12. The Mean Opinion Scores (MOS) for Overall Quality for different Display delays (left) and for different Joystick delays (right) in milliseconds (ms). The error bars indicate5% confidence intervals.
The task performance results, in terms of the number of logs success-ully loaded by test subjects, are shown in Fig. 14. The height of the barshows the mean number and the error bars indicates 95% confidencentervals. Striped bars indicate significantly different mean amount of
10
logs. The total delays are given in the graphs, that is baseline delay plus
added delay. For Joystick delay it is 80 ms + (50 ms, 100 ms, 200 ms,
400 ms, 800 ms) = 130 ms, 180 ms, 280 ms, 480 ms and 880 ms.
K. Brunnström, E. Dima, T. Qureshi et al. Signal Processing: Image Communication 89 (2020) 116005
Ts
Fig. 13. Simulator Sickness Questionnaire (SSQ) scores for the delay experiment, wherethe left (light gray) bars represent the symptom levels before the experiment andthe right (dark gray and striped indicating statistically significant difference) bars thesymptom levels after the experiment. The different symptom groups along the x-axisare: Nausea (N), Oculomotor (O), Disorientation (D) and the Total Score (TS). The errorbars indicate 95% confidence intervals.
Fig. 14. The mean number of logs loaded per 2 min session as a function of the addedJoystick delay in milliseconds (ms). The error bars indicate 95% confidence intervals.Striped bars marks statistically significantly different mean values.
The statistical tests showed that the 880 ms delay case was sig-nificantly different from all the other cases, with 𝛼 < 0.0033, seeTable 3.
In Fig. 15, we can see the MOS of the Responsiveness Quality inthe height of the bars as ordered along the x-axis with increasingadded Joystick delay. Striped bars indicate significantly different MOS.The statistical tests detailed that 880 ms was statistically significantlydifferent from the other cases, with 𝛼 < 0.0033, see Table 3. In addition,the 480 ms delay case was also significant towards 80 ms in the T-test,but not in the Wilcoxon test (T-test: p = 0.0023, Wilcoxon: p = 0.0067).
Fig. 16 illustrates the effect on the Task Accomplishment Quality.he statistical tests performed here also specified that 880 ms wastatistically significantly different from the other cases with 𝛼 < 0.0033,
see Table 3.The impact of the delay on the Comfort Quality is shown in Fig. 17.
In contrast to the previous cases, 880 ms was not statistically differentfrom all other cases with (alpha) > 0.0033, but was statistically sig-nificantly different from some, as shown in Table 3. 80 ms was onlysignificant in the T-test and 480 ms was not significant in either test.
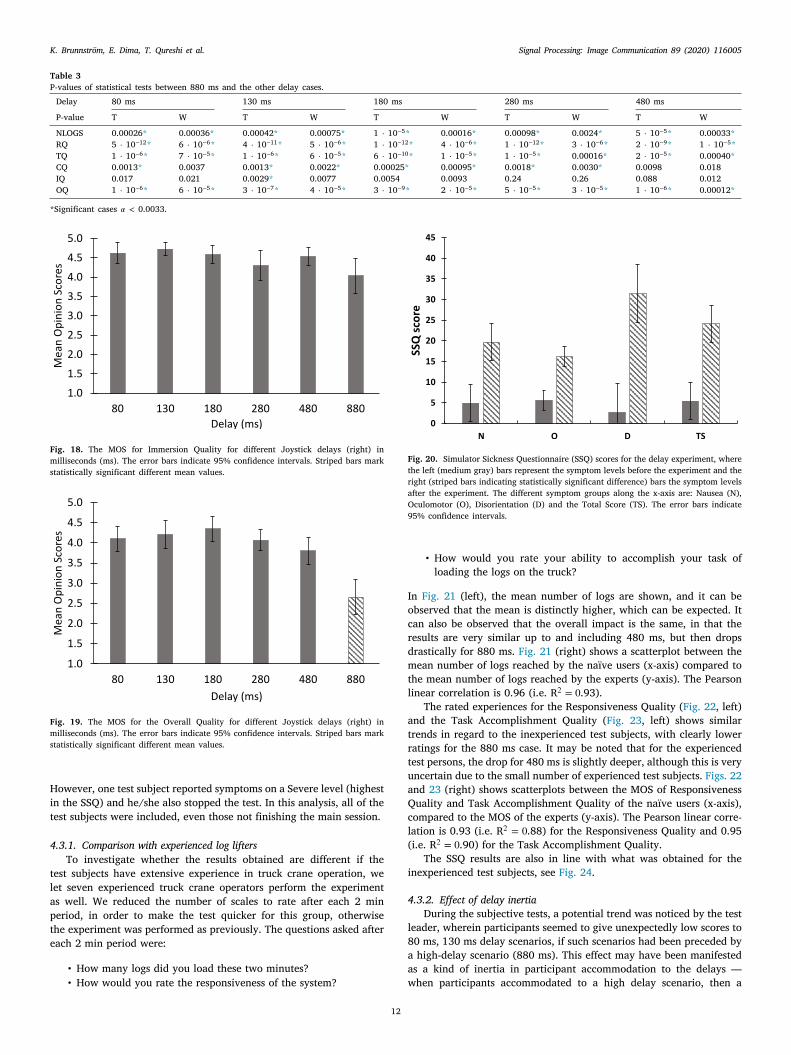
In Fig. 18, the MOS of the Immersion Quality is shown. The Immer-sion has no significant cases. The only exception is that the T-test for880 ms towards 130 ms was significant, but this was not conclusivelyconfirmed with the Wilcoxon test, see Table 3.
11
Fig. 15. The MOS for Responsiveness Quality for different Joystick delays (right) inmilliseconds (ms). The error bars indicate 95% confidence intervals. Striped bars markstatistically significant different mean values.
Fig. 16. The MOS for Task Accomplishment Quality for different Joystick delays (right)in milliseconds (ms). The error bars indicate 95% confidence intervals. Striped barsmark statistically significant different mean values.
Fig. 17. The MOS for Comfort Quality for different Joystick delays (right) in mil-liseconds (ms). The error bars indicate 95% confidence intervals. Striped bars markstatistically significant different mean values.
In Fig. 19, the MOS of the Overall Quality is shown. The statisticaltests gave that 880 ms was statistically significantly different from theother cases with 𝛼 < 0.0033, see Table 3.
The SSQ analysis for the delay revealed large increase in the symp-tom levels (Fig. 20), all of which were statistically significant i.e. p< 0.0125; where Nausea had p = 0.00024, Oculomotor p = 0.000014,Disorientation (p = 0.000022) and the Total Score (p = 0.0000063).
K. Brunnström, E. Dima, T. Qureshi et al. Signal Processing: Image Communication 89 (2020) 116005
ms
Hit
4
tlapte
Table 3P-values of statistical tests between 880 ms and the other delay cases.
Fig. 18. The MOS for Immersion Quality for different Joystick delays (right) inmilliseconds (ms). The error bars indicate 95% confidence intervals. Striped bars markstatistically significant different mean values.
Fig. 19. The MOS for the Overall Quality for different Joystick delays (right) inilliseconds (ms). The error bars indicate 95% confidence intervals. Striped bars mark
tatistically significant different mean values.
owever, one test subject reported symptoms on a Severe level (highestn the SSQ) and he/she also stopped the test. In this analysis, all of theest subjects were included, even those not finishing the main session.
.3.1. Comparison with experienced log liftersTo investigate whether the results obtained are different if the
est subjects have extensive experience in truck crane operation, weet seven experienced truck crane operators perform the experiments well. We reduced the number of scales to rate after each 2 mineriod, in order to make the test quicker for this group, otherwisehe experiment was performed as previously. The questions asked afterach 2 min period were:
• How many logs did you load these two minutes?• How would you rate the responsiveness of the system?
12
Fig. 20. Simulator Sickness Questionnaire (SSQ) scores for the delay experiment, wherethe left (medium gray) bars represent the symptom levels before the experiment and theright (striped bars indicating statistically significant difference) bars the symptom levelsafter the experiment. The different symptom groups along the x-axis are: Nausea (N),Oculomotor (O), Disorientation (D) and the Total Score (TS). The error bars indicate95% confidence intervals.
• How would you rate your ability to accomplish your task ofloading the logs on the truck?
In Fig. 21 (left), the mean number of logs are shown, and it can beobserved that the mean is distinctly higher, which can be expected. Itcan also be observed that the overall impact is the same, in that theresults are very similar up to and including 480 ms, but then dropsdrastically for 880 ms. Fig. 21 (right) shows a scatterplot between themean number of logs reached by the naïve users (x-axis) compared tothe mean number of logs reached by the experts (y-axis). The Pearsonlinear correlation is 0.96 (i.e. R2 = 0.93).
The rated experiences for the Responsiveness Quality (Fig. 22, left)nd the Task Accomplishment Quality (Fig. 23, left) shows similarrends in regard to the inexperienced test subjects, with clearly loweratings for the 880 ms case. It may be noted that for the experiencedest persons, the drop for 480 ms is slightly deeper, although this is veryncertain due to the small number of experienced test subjects. Figs. 22nd 23 (right) shows scatterplots between the MOS of Responsivenessuality and Task Accomplishment Quality of the naïve users (x-axis),ompared to the MOS of the experts (y-axis). The Pearson linear corre-ation is 0.93 (i.e. R2 = 0.88) for the Responsiveness Quality and 0.95
(i.e. R2 = 0.90) for the Task Accomplishment Quality.The SSQ results are also in line with what was obtained for the
inexperienced test subjects, see Fig. 24.
4.3.2. Effect of delay inertiaDuring the subjective tests, a potential trend was noticed by the test
leader, wherein participants seemed to give unexpectedly low scores to80 ms, 130 ms delay scenarios, if such scenarios had been preceded bya high-delay scenario (880 ms). This effect may have been manifestedas a kind of inertia in participant accommodation to the delays —when participants accommodated to a high delay scenario, then a
K. Brunnström, E. Dima, T. Qureshi et al. Signal Processing: Image Communication 89 (2020) 116005
Tr
iQ
st
tTcwnwwIo(
Fig. 21. (left) The mean number of logs loaded by the experienced log lifting test subjects per two min session as a function of the added Joystick delay in milliseconds (ms).he error bars indicate 95% confidence intervals. (right) Scatterplot between the mean number of logs reached by the naïve users (x-axis) compared to the mean number of logseached by the experts (y-axis).
Fig. 22. (left) The MOS for Responsiveness Quality for different Joystick delays (right) in milliseconds (ms) rated by the experienced log lifting test subjects. The error barsindicate 95% confidence intervals. (right) Scatterplot between the MOS for Responsiveness Quality of the naïve users (x-axis) compared to the MOS for Responsiveness Quality ofthe experts (y-axis).
Fig. 23. (left) The MOS for Task Accomplishment Quality for different Joystick delays (right) in milliseconds (ms) rated by the experienced log lifting test subjects. The error barsndicate 95% confidence intervals. (right) Scatterplot between the MOS for Task Accomplishment Quality of the naïve users (x-axis) compared to the MOS for Task Accomplishmentuality of the experts (y-axis).
R
udden transition into a low delay scenario might have been jarring andherefore reduced the participant QoE within the low delay scenario.
To check whether this suspected trend was actually manifested inhe collected data, we performed two repeated-measures ANOVA tests.est 1 considered the 80 ms and 130 ms scenario ratings as the inter-ept (main factor), and a binary predictor ‘‘preceded by 880 ms delay’’,hich categorized the main factor scenarios as either having been, orot been, preceded by an 880 ms delay scenario. The predictor’s valueas set according to the experiment sequencing logs. The RM-ANOVAas performed for each of the five response scales (Overall, Comfort,
mmersion, Responsiveness, Task Accomplishment). Test 2 considerednly the 80 ms scenario, using the five response scales as the interceptmain factor), and the binary predictor ‘‘preceded by an 880 ms delay’’.
13
In test 1 (80 ms and 130 ms responses), the ‘‘preceded by an 880 msdelay’’ factor did not have a statistically significant (p < 0.05) effect onany of the response scales (Overall: F1,27 = 0.607, p = 0.442. Comfort:F1,27 = 0.058, p = 0.811. Immersion: F1,27 = 0.306, p = 0.584.
esponsiveness: F1,27 = 1.518, p = 0.228. Task Accomplishment: F1,27= 0.572, p = 0.455.)
There were also no statistically significant (p < 0.05) joint interac-tions between the ‘‘preceded by 880 ms delay’’ factor and the maindelay factor. The interaction results for Overall scale were F1,27 =1.390, p = 0.248, for Comfort scale F1,27 = 3.389, p = 0.076, forImmersion scale F1,27 = 0.352, p = 0.557, for Responsiveness scaleF1,27 = 1.298, p = 0.264, and for Task Accomplishment scale F1,27 =0.715, p = 0.404.
K. Brunnström, E. Dima, T. Qureshi et al. Signal Processing: Image Communication 89 (2020) 116005
rbh
5
5
s
st
bsds
(
st
Fig. 24. Simulator Sickness Questionnaire (SSQ) scores for the delay experiment, wherethe left (medium gray) bars represent the symptom levels before the experiment andthe right (light gray) bars the symptom levels after the experiment for the experiencedlog lifting test subjects. The different symptom groups along the x-axis are: Nausea (N),Oculomotor (O), Disorientation (D) and the Total Score (TS). The error bars indicate95% confidence intervals.
In test 2 (only the 80 ms scenario responses, preceded or notpreceded by the 880 ms delay scenario), the scales themselves had astatistically significant effect (F1,27 = 584.085, p = 7.9 ∗ 10−20) on theesults, suggesting that the scales were not treated as interchangeabley our participants. However, the ‘‘preceded by 880 ms delay’’ factorad no significant effect on its own (F1,27 = 0.004, p = 0.945), nor did
it have any significant interaction with the main, scale factor (F4,108= 0.502, p = 0.734).
Due to the comparatively high p-values, we can conclude thatwithin the collected data there is no evidence of any delay-handlinginertia. The results of participant scores on the low-delay scenarioswere not significantly affected by whether the participants had justcompleted a high-delay (880 ms) scenario or not.
4.3.3. Learning effectThe test participants had not encountered the delay simulator prior
to the testing process. Because each participant spent time using thesimulator during the test, we wanted to check whether there was anytask-learning effect exhibited by the participants. We categorized theresponses in each scale according to the time already spent in the test,for all scenarios with delay < 280 ms. Due to results from precedingtests, showing a negative effect of high delay on participant QoE andtask performance, we omitted the large delay scenarios (>280 ms) fromthis attempt to find a learning effect over time, and only considereddelays from 80 ms to 180 ms, which – according to previous results– should not have a significant effect on participant responses. Thecumulative results for the participant responses based on time spent areshown in Fig. 25a–e, and their task performance is shown in Fig. 25f.As can be seen in Fig. 25, in several scales (Overall, Responsiveness)the cumulative responses are consistent up to 180 ms of joystick delay,and begin deviating when a delay of 280 ms is included. This furthersuggests to consider delays up to 180 ms when searching for anylearning effect.
We attempted to fit a non-linear model to the participant responses,with the general regression function ‘‘𝑦 ∼ 𝑏1 + 𝑏2 ∗ 𝑥2 − 𝑏3 ∗ 𝑥1’’, wherey is the participant response, 𝑥1 is the delay in milliseconds, 𝑥2 is thetime already spent in minutes, 𝑏1 is an unknown base bias term, and𝑏2 and 𝑏3 are unknown coefficients. The model was regressed usingautomated tools once for each response scale and once for all scalescombined, using random seeds for 𝑏1 to 𝑏3 variables.
For most scales, the regression arrived at small values for the coef-ficients 𝑏2 and 𝑏3, giving a negligible effect of the delay and time-spent
factors on the response. All regressed models had high prediction RMSE c
14
(from 0.825 for Immersion scale in the best case, to 1.56 for the Numberof Logs scale). The p-values for the 𝑏2 coefficient (corresponding to thetime already spent variable) were consistently above 0.05.
Furthermore, automated tools were used to fit a reduced model fromthe starting function of ‘‘𝑦 ∼ 1 + 𝑥1 + 𝑥2 + 𝑥1 ∗ 𝑥2 + 𝑥12 + 𝑥22 + 𝑥12 ∗𝑥22’’, allowing the fitting tools to estimate coefficients for each term andto drop any terms with no effect on the response y from the function.This regression again was attempted for each scale separately, andonce for all scales together. Of these 7 estimated models, 4 removedthe 𝑥2 term entirely, indicating no impact from the time-spent factor.The remaining three models assigned small coefficients to the 𝑥2 term(0.11 with p = 0.22, −0.04 with p = 0.02, and −0.08 with p = 0.06).Similar to before, the estimated models retained a large RMSE (1.54 inthe worst case, 0.819 in the best case), which is excessive for reliablypredicting responses on a scale of 1 to 5.
These results suggest that there is no significant effect from thetime spent in the test to the participant responses or task performancein low-delay scenarios; in other words, no significant learning effectwas observed in participants’ results. As regards the other results,any existing learning effect that is this difficult to detect, would becounteracted in the experimental design by the randomization of testsequences, and therefore not affect the overall result in a serious way.
4.3.4. Time-in-testTo control for the effects from participant tiredness, we checked
for possible effects from the Time-In-Test measurement on participantresponses, without any joystick-delay based response filtering. Theparticipant responses per Time-In-Test are shown in Fig. 26a–e, andtheir task performance is shown in Fig. 26f. The graph reveals that themean responses per any particular joystick delay are erratic, howeverthe mean response over all delays remains fairly flat regardless of theTime-In-Test.
A Repeated-Measures ANOVA test was performed on the data, withTime-In-Test and joystick delay as predictors, and per-scale responseas the intercept (main factor). The joystick delay factor was shownas statistically significant (𝐹1,172 = 23.997, p = 2.2 ∗ 10−6), which isconsistent with the previously reported results. The Time-In-Test factorwas not statistically significant (𝐹1,172 = 1.228, p = 0.269).
. Discussion
.1. Baseline experiment
The scale data indicates that the test subjects are not completelyatisfied with Picture Quality (MOS = 3.6 i.e. between Fair and Good).
The Responsiveness is not problematic, and should not be, since theimulation is running on a sufficiently powerful PC, as evidenced byhe RQ-score exceeding Good (MOS = 4.3).
For the Task Accomplishment Quality, the participant rating wasetween Fair and Good (MOS = 3.6) i.e. most people indicating a scoreomewhere in the middle. Our interpretation is that the test subjectsid not have a strong opinion due to minimal experience in how a realystem is works (as indicated in the pre-questionnaire).
Both the Immersive Quality (MOS = 4.3) and the Overall QualityMOS = 4.1) were rated high i.e. exceeding good.
The SSQ indicates a very minor effect, although the disorientationymptom group showed a significant increase after the test, comparedo the disorientation score before the test. A small fraction of people
an show heightened sensitivity though.
K. Brunnström, E. Dima, T. Qureshi et al. Signal Processing: Image Communication 89 (2020) 116005
Fig. 25. (a–f): Mean participant responses for test instances with low joystick delay. Each line corresponds to a different definition of ‘‘low joystick delay’’, and lists the cumulativemean responses from cases within the given delay range.
5.2. Display and joystick delay experiment
In the display and joystick delay experiment, we discovered someimpact on lower quality for higher delay, but the effect is relativelysmall and we only found significant effects on the highest level onadded Display delay (30 ms) for Comfort Quality and Immersion Qual-ity. One explanation for this seemingly small effect is that the scaleanalysis includes very few data samples from test subjects that did notfinish the test. A reasonable assumption is that these test subjects wouldhave rated the quality as being lower.
Another explanation is that the task was not sensitive enough todelays in the range in the current study. Earlier studies have shownthat impact of delay on task performance is very task dependent, seee.g. [25,26]. Furthermore, test subjects may not always clearly identifythe delay as being the source of the problem, as has been shown intelemeeting applications [37]. It can be noted that in the ratings fromthe test subjects, several inversions exist, i.e. that a test subject has
15
rated lower quality of case with shorter delay compared to the casewith longer delay.
The SSQ demonstrates a significant increase of symptoms. This ismost likely connected to the Display delay, since an analysis of whentest subjects stopped the experiment revealed that it was for the highestadded Display delay. Furthermore, the 30 ms added Display delay had astatistically significant lower comfort quality. The SSQ score includedall participants, even those that stopped, but the CQ was with a fewexceptions based on the test subjects completing the test.
There was very little impact by the added Joystick delay. We can seetendencies to lower MOS on longer delays. However, no significant ef-fects were found for the scales and as such, we attributed the significanteffects on symptoms of SSQ to the Display delay. The Joystick delay hadless impact, although we cannot identify the relative contributions ofthe two different delays.
It is known from the operation of the real crane system that thecrane operators are normally very good at compensating for a bit of
K. Brunnström, E. Dima, T. Qureshi et al. Signal Processing: Image Communication 89 (2020) 116005
Fig. 26. Mean participant responses, sorted by time spent in the test at the response-giving point. The vertical bars for mean-of-all-delays lines indicate the 95% confidenceinterval.
delay in the crane controls, which is the Joysticks in this study. It istherefore reasonable to assume that also novice operators can manageto compensate for some delay when operating the crane. Furthermore,the baseline delay is fairly long (80 ms), so the shorter added Joystickdelays are relatively small and could get unnoticed just because of that.
The actual undisturbed log loading time became shorter than weanticipated when planning and testing the experiment, as most testsubjects needed almost 1 min to record their ratings, which is longerthan for instance when giving scores on e.g. paper or a computerinterface. It may have contributed to giving less influence on the expe-rienced delay. However, one minute is still enough time to get quite agood understanding of the environment and the test subjects were fullyimmersed during the rating period and continuing performing their
16
task, so we believe it had a minor influence, but intend to investigatethis further.
5.3. Joystick delay experiment
The joystick delay experiment was motivated by the small statisti-cally non-significant effects observed in the display and joystick delayexperiment, for the impact on the added Joystick delay There, severalinversions could be noticed where test subjects sporadically rated alower quality of a case with shorter delay than of a case with longerdelay, e.g. the zero added delay case had sometimes been rated as lowas the 800 ms case.
The results presented here corroborate previous findings about in-sensitivities of hand controller latency. For a Telesurgery application,
K. Brunnström, E. Dima, T. Qureshi et al. Signal Processing: Image Communication 89 (2020) 116005
Q
o(Dwta
otswneaortaQmab
Rayman et al. [38] found that a set of robotic laparoscopic tasks couldbe performed at latencies up to 400 ms without significantly affectingtask performance, and that simple tasks were possible to perform with ahigh level of accuracy with delays as high as 800 ms. Kim and Ryu [39]studied a haptic teleoperation task at different visual and haptic delays.Their results show that task performances were largely unaffected fordelays below 200 ms, and that lower haptic delays were preferable tosynchronized visual and haptic delays. In our log loading task, for allscales and the number of logs loaded, it is only for the longest delaythat there is a clear effect i.e. 800 ms. This may be largely dependenton this particular task. However, if humans were very sensitive to thistype and easily disturbed by it, larger effects should have been observedat shorter added delays, which is in line with the observation that boththe experienced and the inexperienced test subjects react in a similarway.
The SSQ showed a significant increase of symptoms. The SSQ scoreincluded all participants, even those that stopped. Overall, this test didnot seem to be too strenuous for most people to complete. However,there are some that are very sensitive, in this case a total 2 out of 30participants.
5.4. Experimental procedure
The experiments are not precisely based on standardized proce-dures, as there are none yet currently available. However, the designis very much in line with current established QoE methodologicalapproaches. Very briefly we can summarize the approach as follows:A technical parameter, in this case the delay is varied in an experimentwhere a trial is performed with a specific value of this parameter, thenthe test subjects rate their experience after each trial. This works wellin the case where a specific understanding of the impact of such aparameter is of interest, but may not lead to any deeper understandingof the overall user experience or how that could be improved in thedesign of the system. Most of the standardized procedures e.g. ITU-RRec. BT.500 [8] are not task based, although ITU-T Rec. P.912 [40] isa step in that direction with the recognition task. The recommendationITU-T Rec. P.1301 is covering tele-meetings and therefore includesinteraction, but the task is targeting conversation and is thereforedifferent from the task in this study. We think that the current studyshows that the methodological approach taken here has given usefulresults in understanding the impact of delay on task performance ofthis kind. However, we believe that further research is needed to fullyunderstand how to bring UX and QoE closer together. Here it will beimportant to incorporate the qualitative methods from UX in a betterway, especially when the test subjects with specialized backgroundssuch as crane operator, truck drivers and wheel loader drivers cannotbe used in large numbers, and quantitative statistics become uncertain.
For these experiments, verbal responses from the test subjects wereused to get the rating on each of the individual scales, since the testsubjects wore a VR-headset throughout the experiments and there wasno implemented interface for responses in the simulator. This puts ahigh demand on the test leader to be consistent in the communicationwith the test subjects, not to influence them differently with the wayscales are asked for and answers are received. A potential improvementwould be to have the verbal questions pre-recorded and played to thetest subjects after each trial, with the test leader writing down theresponses. Even though the test leader communicated the questionsto test participants verbally, and recorded the participants’ verbalanswers, the test leader also had a reference form of the questionsprinted. Therefore, even if the verbal inflections may have variedbetween repetitions, the structure and grammar of the questions posedto participants were consistent between the experiment sessions.
The test participants did not take breaks from VR between each trial.The virtual environment was reset, however the HMD remained onfrom experiment start to end (or cancellation). This lack of breaks may
have contributed to an increased susceptibility to Simulator Sickness,
17
due to the participants being immersed in an unreliable, changingvirtual environment over the course of all trials.
The number of test subjects used could not be based on pre-planningin the same way as suggested by Brunnström and Barkowsky [41],since the variance in this type of experiments is less known than intraditional QoE experiments targeting video and audio. We could seein the Baseline study that the average standard deviation is 0.7, whichis similar to what could be expected in well controlled subjectivevideo quality experiments. However, when adding delay in the otherexperiments we saw an increased standard deviation, in the range of0.9 to 1.1 for the scales and very high (1.5) for the performance metricof number of logs. This indicates that more test subjects are needed inthese types of experiments. The obtained standard deviations can nowbe used for future planning of experiments and can be easily done byusing the web tool ‘‘VQEGNumSubjTool’’ [42], based on [41]. In ourexperiments within this study, we have used 18 participants for BEXP,25 for DJEXP (started with 35), and 29 for JEXP (started with 31),which seem to be appropriate numbers based on the observed standarddeviation.
The length of the experiment per each test subject, the length of alltrials, and the number of conditions are a test design balance question.Optimally, these variables should be balanced such that useful resultsare obtained without excessively tiring the test subjects. With our testdesign, we targeted a session time of 20 min or less per participant.For DJEXP we had 9 conditions, which were switched every 2 min andduring the last half minute the ratings were collected. It turned outthat half a minute was a bit short, so in JEXP, we altered the ratingto be between the 2 min trials to keep this constant. We then reducedthe number of conditions to 6, in order to keep the total time in theVR-headset about 20 min.
The 2 min period seems to have been appropriate for the testsubjects, as we could observe that the subjects were able to operate thecrane at least a couple of times. Each crane operation involved movingfrom a pile of logs to the truck, back and forth, giving the participantsenough time to sense the influence of the simulated delay.
6. Conclusion
The baseline study shows that most people are more or less happywith the VR-system and that it does not have a strong effect on anysymptoms as listed in the SSQ. There is some room for improvementsince all scales were not above Good (> 4). For instance, the Picture
uality only had a MOS of 3.6.In the display and joystick delay study, we found significant effects
n Comfort Quality and Immersion Quality for higher Display delay30 ms), but very small impact of Joystick delay. Furthermore, theisplay delay had strong influence on the symptoms in the SSQ, asell as causing test subjects to decide not to continue to the end with
he experiments, and this was also found to be connected to the longerdded Display delays (≥20 ms).
In the joystick delay study, we found no significant effects of delaysn the task performance (number of logs loaded) or on any scales upo 200 ms. Very weak effects were found for 400 ms, it was only foundignificantly lower in responsiveness quality. A strong significant effectas found for 800 ms added delay, being significantly lower for theumber of logs and for all scales against all the other delays (with thexception one case). It seems as if the delays need to become at leastbout half a second to be clearly noticeable and disturbing for this typef task. Although the group of experienced log lifting test subjects areelatively small, it supports the findings of the inexperienced groupo be just applicable to the inexperienced test subjects but seems topply more generally. The symptoms reported in the Simulator Sicknessuestionnaire were significantly higher for all the symptom groups, butost reported just slight symptoms, a few also moderate and just one,severe symptom. Also, for the SSQ the results were very similar for
oth the inexperienced and experienced group. Two out of thirty test
K. Brunnström, E. Dima, T. Qureshi et al. Signal Processing: Image Communication 89 (2020) 116005
WeeS
D
ci
A
(nter
R
persons stopped the test prematurely due to their symptoms. Thus, mosttest persons were fine using the VR-simulator, but a few seem to be verysensitive.
The overall conclusion is that latency in the display update has asevere impact and should be avoided or limited to very short latency,i.e. less than 30–35 ms. For latency in the Joysticks or hand controllers,much longer latencies can be tolerated and if it is kept below 0.5 s, ithas a very limited impact on the test task of this study.
CRediT authorship contribution statement
Kjell Brunnström: Conceptualization, Methodology, Validation,Formal analysis, Investigation, Data curation, Writing - original draft,Writing - review & editing, Project administration, Funding acquisition.Elijs Dima: Formal analysis, Data curation, Writing - original draft,Writing - review & editing. Tahir Qureshi: Writing - original draft,
The authors declare that they have no known competing finan-ial interests or personal relationships that could have appeared tonfluence the work reported in this paper.
cknowledgments
The economic support from the Knowledge Foundation, Swedengrant nr 20160194) and VINNOVA (Sweden’s innovation agency, grantr 2018-00735) is hereby gratefully acknowledged. We would also likeo thank Joakim Edlund and Sidra Muneer for helping out performingxperiments as well as Jade Lumley for the thorough native languageeview.
eferences
[1] ITU-T, Vocabulary for Performance, Quality of Service and Quality of Experience(ITU-T Rec. P.10/G.100), International Telecommunication Union (ITU), ITUTelecommunication Standardization Sector: Place des Nations, CH-1211 Geneva20, 2017.
[2] P. Le Callet, S. Möller, and A. Perkis (Eds.), 2012. Qualinet White Paper onDefinitions of Quality of Experience (2012). European Network on Qualityof Experience in Multimedia Systems and Services (COST Action IC 1003).Lausanne, Switzerland, 2012.
[3] K. Brunnström, M. Sjöström, M. Imran, M. Pettersson, M. Johanson, Quality ofexperience for a virtual reality simulator, in: Human Vision and Electronic Imag-ing 2018, Society for Imaging Science and Technology, Burlingame, CaliforniaUSA, 2018, 28 Jan. - 2 Feb, 2018.
[4] K. Brunnström, E. Dima, M. Andersson, M. Sjöström, T. Qureshi, M. Johanson,Quality of experience of hand controller latency in a virtual reality simulator,in: Human Vision and Electronic Imaging 2019, Society for Imaging Science andTechnology, Burlingame, California USA, 2019, pp. HVEI–218, 13-17 Jan 2019.
[5] F. Okura, M. Kanbara, N. Yokoya, Augmented telepresence using autopilot airshipand omni-directional camera, in: IEEE International Symposium on Mixed andAugmented Reality 2010, IEEE Xplore, Seoul, Korea, 2010, pp. 259–260.
[6] V.V. Saxena, T. Feldt, M. Goel, Augmented telepresence as a tool for immersivesimulated dancing in experience and learning, in: The India HCI 2014 Conferenceon Human Computer Interaction, ACM New York, NY, USA, 2014, pp. 86–89,http://dx.doi.org/10.1145/2676702.2676708.
[7] S. Möller, A. Raake, Quality of Experience - Advanced Concepts, Applications andMethods, in: T-Labs Series in Telecommunication Services, Springer InternationalPublishing, Switzerland, 2014.
[8] ITU-R, Methodology for the Subjective Assessment of the Quality of Televi-sion Pictures (ITU-R Rec. BT.500-14), International Telecommunication Union,Radiocommunication Sector, 2019.
[9] ITU-T, Subjective Video Quality Assessment Methods for Multimedia Applications(ITU-T Rec. P.910), International Telecommunication Union, Telecommunicationstandardization sector, 1999.
18
[10] K. De Moor, M. Fiedler, P. Reichl, M. Varela, Quality of Experience: FromAssessment to Application (Dagstuhl Seminar 15022), DROPS (Dagstuhl OnlinePublication Service), 2015, http://dx.doi.org/10.4230/DagRep.5.1.57, (http://drops.dagstuhl.de/opus/volltexte/2015/5036/).
[11] ITU-T, Methods for the Subjective Assessment of Video Quality, Audio Qualityand Audiovisual Quality of Internet Video and Distribution Quality Television inAny Environment (ITU-T Rec. P.913), International Telecommunication Union,Telecommunication standardization sector, 2014.
[12] ITU-T, Display Requirements for 3D Video Quality Assesment (ITU-T Rec. P.914),International Telecommunication Union, 2016.
[13] ITU-T, Information and Guidelines for Assessing and Minimizing Visual Dis-comfort and Visual Fatigue from 3D Video (ITU-T Rec. P.916), InternationalTelecommunication Union, 2016.
[14] ITU-T, Subjective Assessment Methods for 3D Video Quality (ITU-T Rec. P.915),International Telecommunication Union, 2016.
[15] J. Puig, A. Perkis, F. Lindseth, T. Ebrahimi, Towards an efficient methodology forevaluation of quality of experience in augmented reality, in: Fourth InternationalWorkshop on Quality of Multimedia Experience (QoMEX 2012), IEEE Xplore,Melbourne, Australia, 2012, pp. 188–193.
[16] P. Tripicchio, E. Ruffaldi, P. Gasparello, S. Eguchi, J. Kusuno, K. Kitano,M. Yamada, A. Argiolas, M. Niccolini, M. Ragaglia, C.A. Avizzano, A stereo-panoramic telepresence system for construction machines, Procedia Manuf. 11(2017) 1552–1559, http://dx.doi.org/10.1016/j.promfg.2017.07.292.
[17] L. Lachs, Multi-Modal Perception. R. Biswas-Diener & E. Diener (Eds.), NobaTextbook Series: Psychology. Champaign. 2020. Available from: http://noba.to/cezw4qyn, Access Date: 12 Aug 2020.
[18] A. Smuts, What is interactivity? J. Aesthet. Educ. 43 (4) (2009) 53–73.[19] L. Janowski, P. Kozłowski, R. Baran, P. Romaniak, A. Glowacz, T. Rusc, Quality
assessment for a visual and automatic license plate recognition, Multimedia ToolsAppl. 68 (1) (2014) 23–40, http://dx.doi.org/10.1007/s11042-012-1199-5.
[20] N. Dużmańska, P. Strojny, A. Strojny, Can simulator sickness be avoided? Areview on temporal aspects of simulator sickness, Front. Psychol. 9 (2018) 2132,http://dx.doi.org/10.3389/fpsyg.2018.02132.
[21] K. Debattista, T. Bashford-Rogers, C. Harvey, B. Waterfield, A. Chalmers, Sub-jective evaluation of high-fidelity virtual environments for driving simulations,IEEE Trans. Hum.-Mach. Syst. 48 (1) (2018) 30–40, http://dx.doi.org/10.1109/THMS.2017.2762632.
[22] T. Ni, H. Zhang, C. Yu, D. Zhao, S. Liu, Design of highly realistic virtual environ-ment for excavator simulator, Comput. Electr. Eng. 39 (7) (2013) 2112–2123,http://dx.doi.org/10.1016/j.compeleceng.2013.06.010.
[23] G. Strazdins, B.S. Pedersen, H. Zhang, P. Major, Virtual reality using gesturerecognition for deck operation training, in: OCEANS 2017 - Aberdeen, 2017.
[24] M. Suznjevic, M. Mandurov, M. Matijasevic, Performance and qoe assessmentof HTC vive and oculus rift for pick-and-place tasks in VR, in: 2017 NinthInternational Conference on Quality of Multimedia Experience (QoMEX), 2017.
[25] C. Jay, M. Glencross, R. Hubbold, Modeling the effects of delayed haptic and vi-sual feedback in a collaborative virtual environment, ACM Trans. Comput.-Hum.Interact. 14 (2) (2007) 8, http://dx.doi.org/10.1145/1275511.1275514.
[26] C. Jay, R. Hubbold, Delayed visual and haptic feedback in a reciprocal tappingtask, in: First Joint Eurohaptics Conference and Symposium on Haptic Interfacesfor Virtual Environment and Teleoperator Systems. World Haptics Conference,2005.
[27] B. Knörlein, M.D. Luca, M. Harders, Influence of visual and haptic delayson stiffness perception in augmented reality, in: 2009 8th IEEE InternationalSymposium on Mixed and Augmented Reality, 2009.
[28] Q. Qian, Y. Ishibashi, P. Huang, Y. Tateiwa, H. Watanabe, K. Psannis, QoEassessment of object softness in remote robot system with haptics: Comparisonof stabilization control, 2018.
[29] K. Desai, S. Raghuraman, R. Jin, B. Prabhakaran, QoE studies on interactive 3Dtele-immersion, in: 2017 IEEE International Symposium on Multimedia (ISM),2017, 2017.
[30] A. Tatematsu, Y. Ishibashi, N. Fukushima, S. Sugawara, QoE assessment in hapticmedia, sound and video transmission: Influences of network latency, in: 2010IEEE International Workshop Technical Committee on Communications Qualityand Reliability (CQR 2010), 2010, 2010.
[32] K. Brunnström, K. Wang, S. Tavakoli, B. Andrén, Symptoms analysis of 3D TVviewing based on simulator sickness questionnaires, Quality User Exp. 2 (1)(2017) 1–15, http://dx.doi.org/10.1007/s41233-016-0003-0.
[33] S.S. Shapiro, M.B. Wilk, An analysis of variance test for normality (completesamples), Biometrika 52 (3/4) (1965) 591–611, http://dx.doi.org/10.2307/2333709.
[34] S.E. Maxwell, H.D. Delaney, Designing Experiments and Analyzing Data : AModel Comparison Perspective, second ed., Lawrence Erlbaum Associates, Inc,Mahwah, New Jersey, USA, 2003.
[35] F. Wilcoxon, Individual comparisons by ranking methods, Biom. Bull. 1 (6)(1945) 80–83, http://dx.doi.org/10.2307/3001968.
K. Brunnström, E. Dima, T. Qureshi et al. Signal Processing: Image Communication 89 (2020) 116005
[36] L.L. Havlicek, N.L. Peterson, Robustness of the T test: A guide for researchers oneffect of violations of assumptions, Psychol. Rep. 34 (3_suppl) (1974) 1095–1114,http://dx.doi.org/10.2466/pr0.1974.34.3c.1095.
[37] ITU-T, Telemeeting Assessment - Effect of Delays on Telemeeting Quality (ITU-T Rec. P.1305), International Telecommunication Union, Telecommunicationstandardization sector, 2016.
[38] R. Rayman, S. Primak, R. Patel, M. Moallem, R. Morady, M. Tavakoli, V. Subotic,N. Galbraith, A. Van Wynsberghe, K. Croome, Effects of Latency on Telesurgery:An Experimental Study, Springer Berlin Heidelberg, 2005, pp. 57–64, http://dx.doi.org/10.1007/11566489_8.
[39] Y. Kim, J. Ryu, Performance analysis of teleoperation systems with differenthaptic and video time-delay, in: 2009 ICCAS-SICE, 2009, 2009.
[40] ITU-T, Subjective Video Quality Assessment Methods for Recognition Tasks (Rec.ITU-T P.912) (Rec. ITU-T P.912), 2016.
[41] K. Brunnström, M. Barkowsky, Statistical quality of experience analysis: onplanning the sample size and statistical significance testing, J. Electron. Imaging27 (5) (2018) 11, http://dx.doi.org/10.1117/1.JEI.27.5.053013.
[42] W. Robitza, K. Brunnström, VQEGNumSubjTool - Calculating Number of Subjects,2019, Access Date: Access Date|, Available rom: https://slhck.shinyapps.io/number-of-subjects/.
Kjell Brunnström Ph.D., is a Senior Scientist at RISE Research Institutes of Sweden ABand Adjunct Professor at Mid Sweden University. He is an expert in image processing,computer vision, image and video quality assessment having worked in the area formore than 25 years. Currently, he is leading standardization activities for video qualitymeasurements as Co-chair of the Video Quality Experts Group (VQEG). His currentresearch interests are in Quality of Experience for visual media in particular videoquality assessment both for 2D and 3D, including AR, VR and remote operation ofmachines, as well as display quality related to the TCO Certified.
Elijs Dima received his B.Sc. and M.Sc. degrees in Computer Engineering from MidSweden University, Sweden, in 2013 and 2015, and his Lic. degree in 2018. Since2015, he has been a researcher, lab supervisor, teaching assistant and Ph.D. studentin the Realistic 3D research group at Mid Sweden University. His research interests
19
include 360-degree video and light field capture, rendering and streaming, parallel dataprocessing, and the synchronization, calibration, modeling, and development of VirtualReality, Augmented Reality and multi-camera systems.
Tahir Qureshi got his Ph.D. from the Royal Institute of Technology 2012 researchingmodel-based development as the main research area. He worked on architecture centricapproaches for developing automotive embedded systems. From Jan 2013 Dr Qureshihas been working at HIAB AB as a research manager on embedded systems.
Mathias Johanson, Ph.D., is R&D manager at Alkit Communications AB and an experton video-mediated communication and distributed collaborative environments. Hisresearch interests also include automotive telematics and e-health systems and services.
Mattias Andersson received the M.Sc. in Applied Physics and Electrical Engineering in1998, the Licentiate of Technology in Media Technology in 2004 and the PhD in MediaTechnology, all from Linköping University in 2006. He then worked in commercial andindustrial life as with computer vision, multispectral imaging and color appearance. Hejoined Mid Sweden University in 2011 and is currently working as a research engineer.His current research interests include multidimensional imaging and augmented reality.
Mårten Sjöström received the M.Sc. degree in electrical engineering and appliedphysics from Linköping University, Sweden, in 1992, the Licentiate of Technologydegree in signal processing from KTH, Stockholm, Sweden, in 1998, and the Ph.D.degree in modeling of nonlinear systems from EPFL, Lausanne, Switzerland, in 2001.He was an Electrical Engineer with ABB, Sweden, from 1993 to 1994, was a fellowwith CERN from 1994 to 1996. He joined Mid Sweden University in 2001, and wasappointed an Associate Professor and a Full Professor in Signal Processing in 2008 and2013, respectively. He has been the Head of the Computer and System Sciences withMid Sweden University since 2013. He founded the Realistic 3-D Research Group in2007. His current research interests are within multidimensional signal processing andimaging, as well as system modeling and identification.