i • r LATERAL DEFLECTION AND STABILITY OF TALL BUILDINGS Le-Wu Lu, Ph.D. M.ASCE, M.IABSE Professor of Civil Engineering Fritz Engineering Laboratory Lehigh University Bethlehem, Pennsylvania, U.S.A. Erkan Ozer, Ph.D. Assistant Professor of Civil Engineering Technical University of Istanbul Istanbul, Turkey Rqor\- 3?5.3 1 I
Transcript
i
• r
LATERAL DEFLECTION AND STABILITY OF TALL BUILDINGS
Le-Wu Lu, Ph.D. M.ASCE, M.IABSE Professor of Civil Engineering Fritz Engineering Laboratory Lehigh University Bethlehem, Pennsylvania, U.S.A.
Erkan Ozer, Ph.D. Assistant Professor of Civil Engineering Technical University of Istanbul Istanbul, Turkey
Rqor\- 3?5.3
1 I
SYNOPSIS
The strength and stiffness of a tall s·teel building frame subjected ·to combined gravity and lateral loads are reduced significantly by overall instability effect. The principal cause of the instability failure is the accumulation of the P-6.moment which exists in each story due to the relative floor level deflection. The paper reviews the general nature of the problem and the methods that are in current use in the design of steel frames~ The emphasis is on the approaches developed for use in allowable-stress design. It is shown that the effective column length approach, although widely used, can not be logically applied to account foY the inst.ability effect. A more rational approach is to include directly the P-~moment in-the analysis phase of the design process. Results are presented which compare the lateral-load carrying capacity of·a 10-story, 3-bay frame designed by (1) the effective column length approach, (2) the P-6.. approach, and (3) a simple approach in which the instability effect is completely ignored .. The lateral load factors of the first two designs are around 1.50 and that of the third design is slightly above 1.30. It is concluded that if a load factor of 1.30 is considered acceptable (based on the designer's pas·t experience or on code requirements) , many frames of practical propor-tions may be designed without considering the effect of frame instability. However, if a higher load factor is desired, this effect must be·properly taken into consideration in the design with a resulting increase of the member sizes.
NOTATION
em moment coefficient
Fa allowable axial stress
Fb allowa.ble bending stress
F' Euler buckling stress e Fy yield stress
H latera1 load or overall height of a frame
K effective length factor
L b
length of column in the plane of bending
,·
M bending moment applied at end of. a member
P total gravity in a story or beam lead
rb radius of gyration
w critical buckling load cr b. rela·tive story deflection or roof
·deflection
INTRODUCTION
In the design of tall building frames, the controlling loading condition is likely to be that of combined gravity and lateral loads, and the designer is mostly concerned with the response of the structures-under these loads. Frame deflection (or drift) usually occurs as soon as the lateral load is applied. At a given load level, each floor in the frame moves laterally through a deflection A relative to the floor below. Due to this relative deflection, an additional secondary bending moment, known as the P-Amoment, develops in each story, \vhere P represents the total gravity load above the story. This moment tends to reduce the overall strength and stiffness of the frame and leads eventually to inelastic instability failure.· Figure 1 shows a
(Fig. 1)
qualitative lateral load versus deflection relationship of the structure. 'l'he response resembles closely that of a cantilever beam-column subjected to combined axial and latera,l loads. The ultimate strength of the frame can not be accurately determined without considering the effect of the P-A moment.
REDUCTION IN LOAD-CARRYING CAPACITY DUE TO FRAME INSTABILITY
Numerous studies, both theoretical and experimental, ha~e been made in order to assess the extent of strength reduction due to the effect of the P-~ moment. Two types of frame analysis are usually performed: the first~order analysis in which the effect of the secondary moment is ignored, and the se-
cond-order analysis in which this effect is included. The results of these studies permit a direct evaluation of the significance of the instability effect.
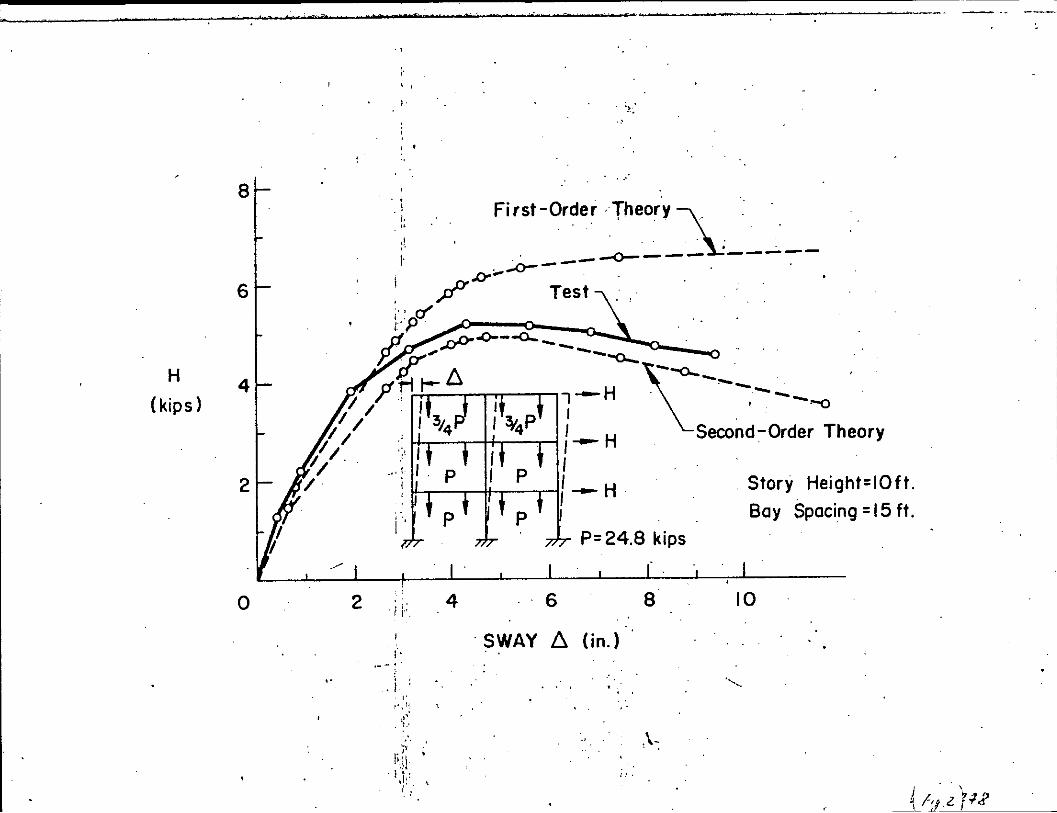
Figure 2 shows the results of a frame test carried out in the Fritz Engineering Laboratory of Lehigh University (1).
(Fig. 2)
Vertical loads of pre-determined amounts were- first applied to the roof and floor girders and were maintained throughout the test. Horizontal loads were then applied in several increments until the maximum value was reached. Beyond the maximum load, the test was controlled by using deflection increments. The results show that the P-6 moment causes a reduction of about 20 percent of the load-carrying capacity.
Other studies also show that for unbraced frames subjected to distributed loads on the girders and concentrated lateral loads at the floor levels, the reduction in the ultimate strength due to the secondary moment is about 10 to 20 percent, depending on the overall stiffness of the structure and yield stress of the material (2,3). In general, a stiffer structure tends to deflect less under the same load, and its load-carrying capacity is less affected by the P-A moment. Also, the reduction in strength is likely to be more significant in frames made of high strength steel.
FRZV1E DESIGN METHODS
There are three methods commonly used in steel building design, each of which is based on a unique design philosophy and a corresponding limit of usefulness of the structure. They are: the allowable-stress method, the plastic method, and the load and resistance factors design method. The allowable-stress method is the most widely used method in the United States, particularly in the design of tall buildings. In. this method, the response of the structure (stress, moment, deflection, etc.) at the working load is de-termined from an
.-
elastic analysis and all the members are proportioned to meet some allowable-stress requirements. The allowable-stress is usually specified as a percent of the yield stress in design standards. For example, the allowablestress in bending, as given in the American Institute of Steel Construction (AISC) Specification, is either 0.6F or 0.66F where F is the yield y y y stress. Since this method is concerned only with the structural response at the working load, the real effect of the P-~moment can not be directly included in the design process. As shown in Figs. 1 and 2, the P-A moment influences the behavior of a frame in a nonlinear manner. The additional bending moment in the beams and columns becomes very significant after the structure is partially yielded. The post yield (or inelastic) behavior, however, is not considered in this design method. Furthermore, the true ultimate strength of the structure can not be determined without performing a second-order, elastic-plastic analysis. Therefore, it does not appear possible that an exact procedure can be developed to account for the P-~ effect in the allowable-stress method. Approximate procedures, however, are available and will be discussed in the section "Approaches Used in Allowable-Stress Design".
In the plastic method, the basis of design is directly the ultimate strength, which, for tall buildings, must-be determined by including the effect of frame instability. The working load is multiplied by a load factor to arrive at the "design ultimate load". For satisfactory design, the ultimate load of the structure must be greater than the design ultimate load. The effect of the P-~moment is therefore included in a direct manner in plastic design. References 4 and 5 present plastic design procedures for multistory frames.
The load factor given in the AISC Specifica·tion for the case of combined gravity and lateral loads is 1.30. The same value is also specified in the specifications of such countries as Canada, Mexico, and Sweden (in this last case 1.34). Australia, India, South Africa, the United Kingdom, and the USSR use a load factor of 1.40. Refer-
ence 6 contains a summary of the plastic design load factors adopted by different coun·tries.
The load and resistance factors design, also known as the limit states design, is based on probability considerations. It involves the application of mul·tiple load factors to the "loading function" (the dead load, the several kinds of live load, and the various combinations of these loads) and resistance factors to the calculated "resistance function" of the structure. The details of the method ar~ currently being formulated for steel buildings in the u.s. (7). The approaches that will be adopted to account for the effect of the P-A moment are not yet fully established. The remainder of the paper will deal with the approaches used in allowable-stress design and the strength of building frames designed by using these approaches. ·
APPROACHES USED IN ALLOWABLE-STRESS DE-SIGN
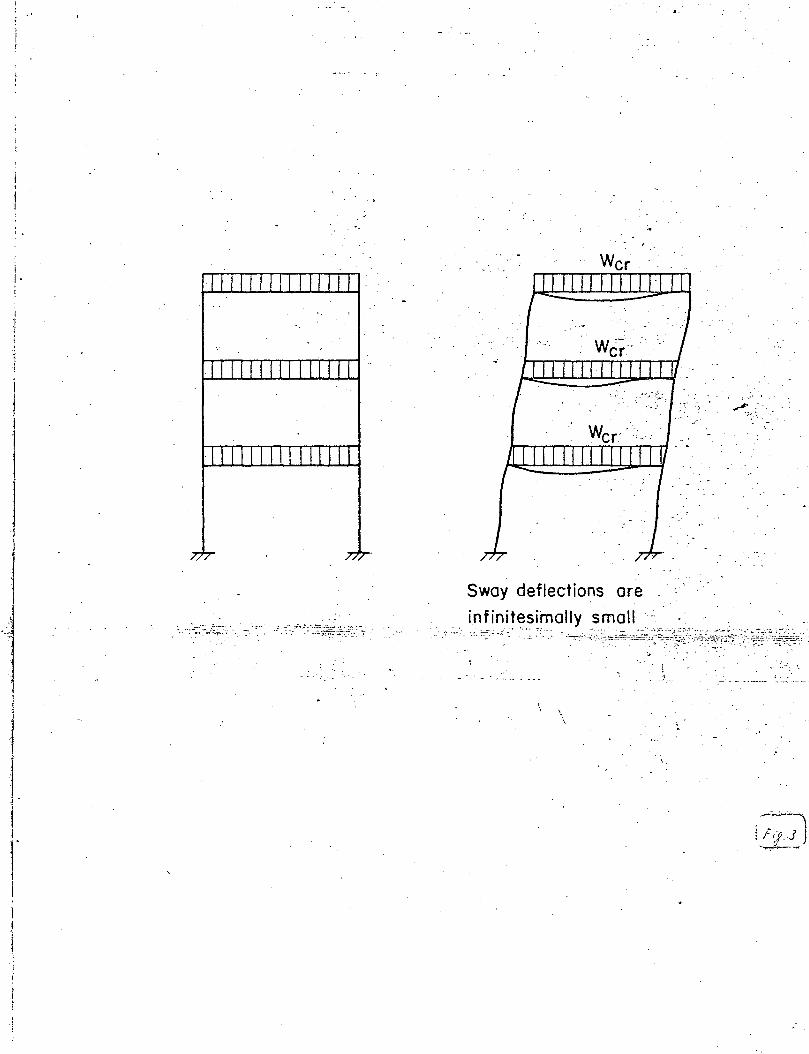
The first approach is the effective column length approach which is the most widely used, but, unfortunately, is also the most criticized. In this approach all the columns in the frame are designed not for their actual lengths, but for their effective lengths which are determined from a frame buckling analysis. Gravity loads only are involved in this analysis and failure is assumed to be due to sidesway buckling of the entire structure (Fig. 3). The effective length is
(Fig. 3)
obtained by comparing the axial load in the column at the calculated buckling load with the Euler elastic buckling load for the same column (assuming pinned-end condition). The ratio of the effective length to the actual length is the effective length factor K v1hich is always greater than unity for columns in an unbraced frame. For this reason, the effective length approach usually would require increases in column sizes.
From the discussion given in the pre-
3 7 .s-. 3
vious sections, it is clear that what should be considered in the design is the P-6moment which depends on the amount of gravity load and the lateral deflection. This moment, which actually exists in the frame, can not be logically included in the design by working with effective length factors for the columns, because not only the columns but also the beams provide the necessary resistance~ It should be emphasized that the buckling solution used to develop the effective length factor is completely hypothetical as far as the frame response is concerned. In the buckling problem, the lateral deflection is infinitesimally small, whereas deflections of finite magnitude do exist in the actual situation.
The second approach, which is developed only recently, is to estimate the P-4, moments in the various stories and include them as applied moments. The P-~moment may be estimated at the working load, or,more conservatively, at a factored load (say, 1.30 x working load). This approach would require increases in both beam and column sizes and lead to designs which are more balanced.
STRENGTH OF FRAMES DESIGNED BY ALLOWABLE-STRESS METHOD
Column design requirements
According to the AISC specification, all columns in a planar frame are to be proportioned to satisfy the following two formulas:
+ 1.0 (1)
f a 0.60F y
fb + -F-"5 1.0
b (2)
in which fa and fb
the computed axial and
Fa = allov1able stress if is ted
= allowable stress if
are, respectively,
and bending stresses
compressive bending axial force alone ex-
compressive bending bending moment alone
-------
c m
c m
existed = elastic Euler buckling stress
divided by a factor of safety. It is always computed for the in-plane case of buckling. In equation form it is given by
F' e = "'lT2E
F.S.
(Lb is the actual length in the
plane of bending and rb the cor
responding radius of gyration. K is the effective length factor in the plane of bending.)
.l'vll = 0.6 - 0.4 ~ ~ 0.4
2 in braced frames.
for columns Ml M is the
2 ratio of the smaller to larger moments applied at the ends of the member. It is positive when the member is bent in reverse (double) curvature.
= 0.85 for columns in unbraced frames.
The effect of frame instability is recognized in two ways -~ the first is the use of the in-plane K factor in computing F and F' and the second is a e to assign a C value of 0.85 (instead m of a much smaller value as given by the
equation em= 0.6- 0.4 Ml). , M2
Results of a comprehensive study
The two approaches that have been described previously usually would lead to different member sizes for the same frame. A comprehensive study has been made to examine the load-carrying capacity of multi-story frames proportioned by these methods, using the provisions of the 1969 AISC Specification (8). This study also includes frames that are designed without considering the effect of frame instability. The results of 'the study thus permit a close evaluation of the strength of frames designed in three different ways with regard to frame instability:
1. The effect of frame instability
is included in an indirect manner in the member selection phase of the design process, using the effective column length approach.
2. The P-~moment is included directly in the analysis phase of the design process. ·
3. The effect of frame instability is ignored in both the analysis and the member selection phases.
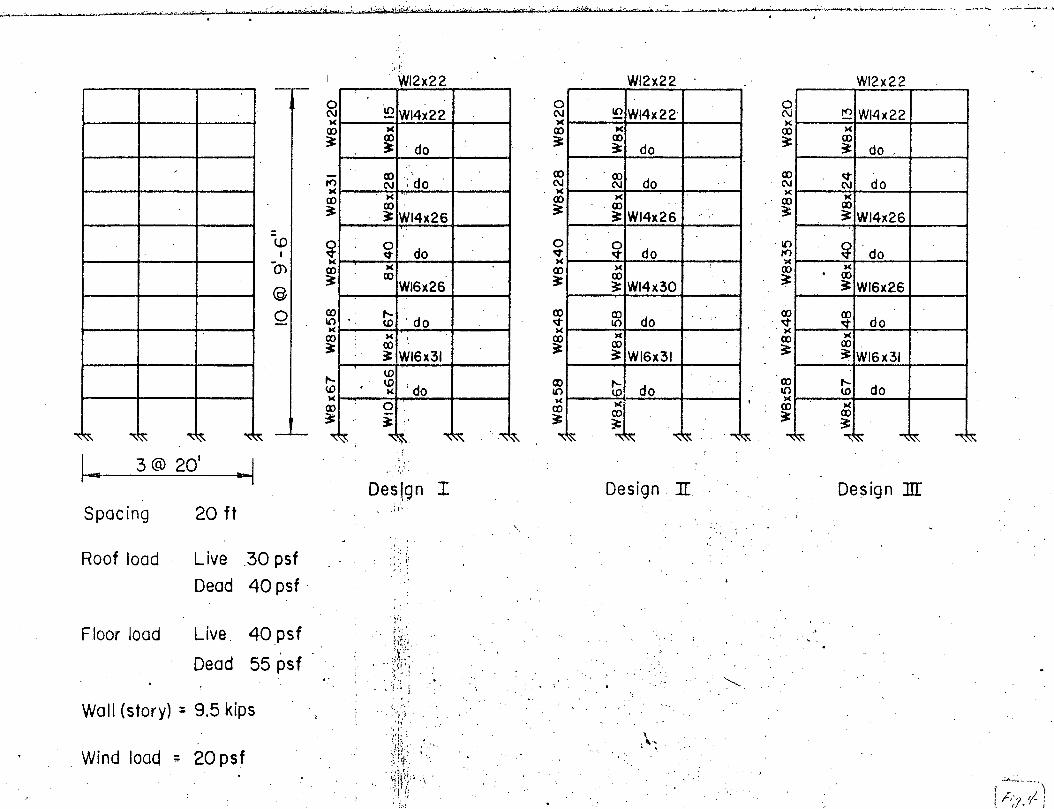
A total of seven frames, varying from 10-story, 5-bay to 40-story, 2-bay, has been designed and analyzed according to the first-order and second-order theories. These frames have bay widths varying from 20 to 56 ft. and story heights from 9 ft. 6 in. to 14 ft. The live load, including partitions, varies from 40 to 100 psf and the dead load from 50 to 75 psf. A uniform wind load of 20 psf has been used throughout. Only the results obtained for the 10-story, 3-bay frame are presented here. Reference 8 contains the results of all the frames together '"i th a detailed discussion of the P-4 moment present in these frames. Figure 4 shows the dimen-
(Fig. 4)
sions and the working _loads of the 10-story frame and the member sizes of this frame selected based on the three approaches mentioned above. Structural carbon steel (A36) is used throughout. All the girders and the columns are oriented for major-axis bending only.
Design I: The effective column length approach is used. · The bending moment and axial force distributions are determined from a first-order structural analysis. All the columns are selected to satisfy the interaction formulas '"'i th either KL/r or L/r (the
X y larger one governing) used in computing F and KL/r in determining F' • A
a x e C value of 0.85 is used as required by m
·the AISC Specifica·tion for columns in unbraced frames.
Design II: The P-A approach is used. The bending moments and axial forces at the working load level are determined directly from a second-order analysis.
37s. ·3
- -------------
All the columns are again selected to satisfy the interaction formulas, but
Ml K = 1.0 and C = 0.6 - 0.4 ~ (not less
m 2 than 0.4) are used throughout. The F a term in the interaction formula is computed using L/r and the F' term using y e L/r .
X
Design III: Frame instability effect is completely neglected. A first-order analysis is used to obtain the bending moment and axial force distributions on the basis of which the member sizes are chosen. The columns are designed with
Ml K = 1.0 and C = 0.6 - 0.4 (not less
m M2 _
than 0. 4) •
In all the designs, both Formulas (1) and (2) ~re checked.
Both gravity loading condition and combined gravity and lateral loading condition are considered in frame design. .Except in the upper stories, the selection of member size is usually controlled by ·the combined loading condition. All the strength analyses are performed for the combined case, involving proportionally increasing gravity and lateral loads.
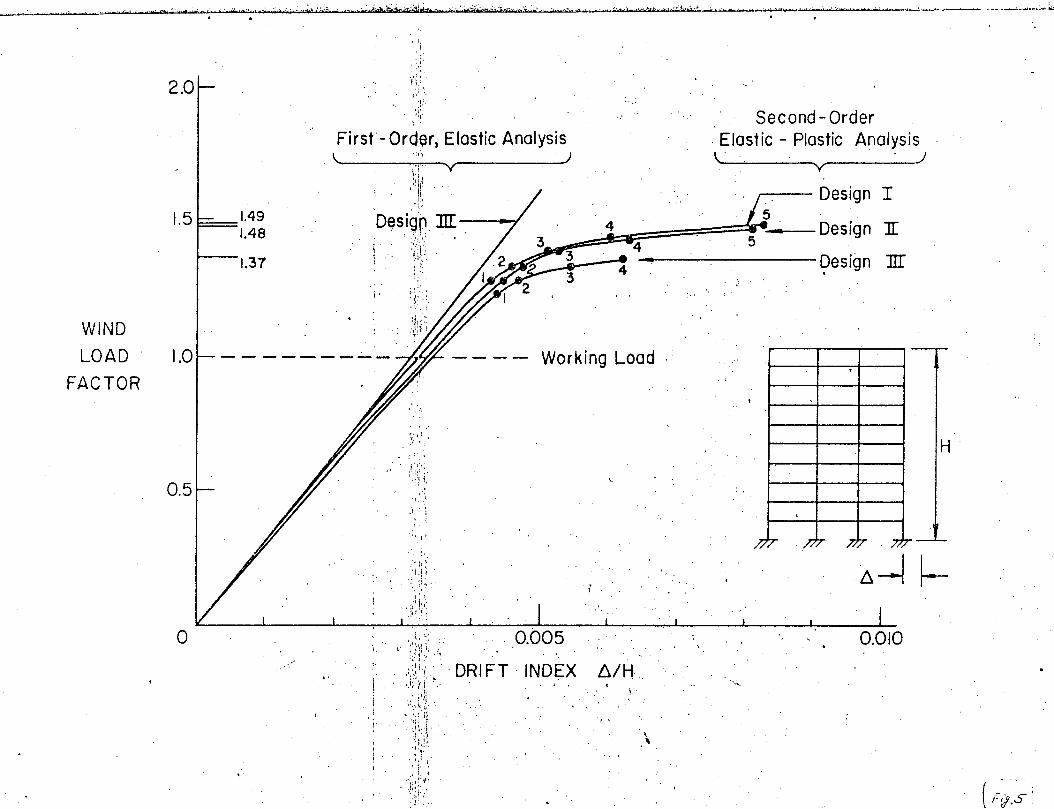
Figure 5 gives the lateral load versus drift relationships obtairied from the second-order analysis. The lateral load
(Fig. 5)
factor achieved is 1.49 for Design I and 1.48 for Design II. The two designs, with slightly different girder and column sizes, have essentially the same load-carrying capacity. The load factor of Design III, which does not take into account ·the effect of frame instability, is 1.37. This design, with columns smaller than those in Designs I and II, apparently has adequate strength (comparing with a load factor of 1.30 used in plastic design) and is usually easier to perform than Designs I and II.
Since proportional loading condition
is assumed in the analysis, an ultimate load factor of 1.49 means that the frame is capable of resisting a gravity load equal to 1.49 times the working value together with a lateral load also equal to 1.49 times its working value. If the gravity load is maintained at the working value (load factor= 1.0}, the lateral load factors that can be achieved by the three designs are found to exceed 2.0 (8). In fact, for a gravity load factor of 1.0, the ultimate lateral load factor of Design III is 2.17. The results of the other six frames selected in this study show a very similar trend. The load factors of Design III of all the frames always exceed 1.30 for the proportional loading condition.
Also shown in Figure 5 are the factored loads at which successive plastic hinges form in the frames. The locations of these hinges are indicated in Figure 6. The following observations may be made about the behavior of the frames under proportionally increasing gravity and lateral ldads: ·
1. The first plastic hinges form in the beams at a load factor of 1.30 for Designs I and II and 1.25 for Design III.
2. Because of the inherent plastic strength due to moment redistribution, additional loads can be carried by these frames after the formation of the first hinges.
3. The formation of successive hinges tends to decrease the overall stiffness of the frames. A small increase in the applied loads thus causes a large increase in frame drift, resulting in a rapid increase of the P-~ moments in the various stories.
4. The ever increasing P-~moment eventually leads to instability failure. The increase in the load-carrying capacity beyond initial hinge formation is small, 15% for Designs I and II and 10% for Design III.
5. Because of the "premature" failure due to instability (as opposed to failure due ·to formation of a plastic mechanism) , the demand on rotation capacity of the plastic hinges becomes less. This sug-
..
gests that the member selection ~eed not be fully governed by the present plastic design rules with regard to compactness and lateral bracing.
(Fig. 6)
The results show that the P-~moment not only affects the load-carrying capacity of a frame but also its drift. When the frame is proportioned by the allowable-stress method, the designer is usually concerned with the drift at the working load. The first-order de-
flection index, ~ of the sample frames
varies from 0.0020 for the 10-story, 5-bay frame to 0.0040 for the 40-story, 2-bay frame. For the other five frames,
~ f~lls in the range of 0.0025 to
0.0037. The second-order deflection index of the 10-story, 5-bay frame is found to be 0.0024 and that of the 40-story, 2-bay frame 0.0044. The presence of the P-amoment tends to increase the working load drift by about 10 to 20%.
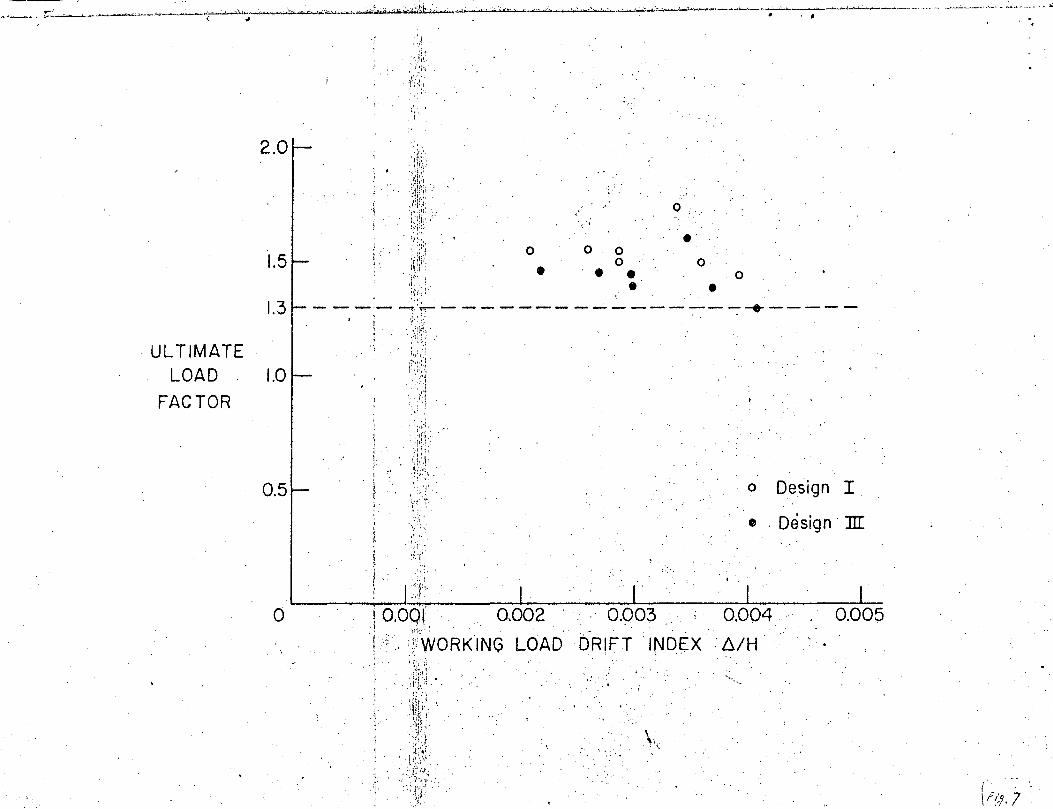
The ultimate load factors of Designs I and III of all the seven frames are plotted against the first-order working load deflections in Figure 7. The load factor tends to be smalle:J;. for frames vli th larger working load def-lections. This can be explained by the fact that the P-6. moment is larger and becomes more significant in less rigid frames.
(Fig. 7)
SU~L.'1ARY
The information presented in this paper -can be summarized as follows:
1. Tall building framessubjected to combined gravity and lateral loads are likely to fail by inelas·tic . instability. The accurnu-
·la-t;ion of the P-.6 moment in various stories resulting from the relative l9teral deflections of
:3 Jj-. 3
the floor levels is the main cause for this type of failure.
2. The available results in the literature indicate that the reduction in the load-carrying capacity due to the P-~ effect amounts to 10 to 20 percent of the calculated plastic limit load. The reduced ultimate load should be used as the basis in plastic design.
3. In allowable-stress design, the instability effect can be included only in an indirect manner, because the P-Amoment always varies non-linearly and its significance can not be fully assessed without performing an analysis in the inelastic range.
4. The effective column length approach, which is adopted in many current specifications, can not rationally take into account the additional P-a moment in the design process.
5. The results of an extensive.design study .show that multi-story frames designed according to the AISC allowable-stress provisions, but with no consideration being given to the P-A effect, can have a lateral load factor of at least 1.30. Therefore, if a load factor of 1.30 is considered accept-· able, the overall instability effect may be ignored in the allowable-stress d~sign.
6. When a higher load factor is desired, rational inclusion of this effect must be made. The P-~ approach, which involves estimating the secondary moment in the design process, appears to be a logical approach to use.
ACKNOWLEDGMENTS
The results contained in the paper are part of the research project on "Effective Column Length and Frame Stability" being carried out at the Fritz Engineering Laboratory, Lehigh University. The sponsor of the project is the American Iron and Steel Institute. The authors acknowledge the contribution made by their colleagues: Dr. J. H. Daniels, Dr. S. Morino, and Mr. 0.
S. Okten.
The material was first prepared for inclusion in the third edition of the Column Research Council's "Guide to Design Criteria for Me·tal Compression Me1"tlbers" to be published by John Wiley and Sons.
REFERENCES
1. YARIMCI, E. Incremental Inelastic Analysis of Framed Structures and Some Experimen·tal Verifications. Thesis (Ph.D.) Lehigh University, 1966.
2. ARNOLD, P., ADAMS, P.F., and LU, L. W. Strength and Behavior of an Inelastic Hybrid Frame, Journal of the Structural Division, ASCE, Vol. 94, No. STl, Jan. 1968, p~3.
3. BEEDLE, L.S., LU, L.W., and OZER~ E. Recent Developments in Steel Building Design; Engineering Journal, AISC, Vol. 10, No. 4, 1973, :p-:-98.
4. HANSELL, W.C., ARMACOST, J.O., III, and DRISCOLL, G.C., Jr. Pl~stic Design of Multistory Frames by Computer, Journal of the Structural Division, ASCE, Vol. 96, No. STl, Jan. 1970,~17.
5. DANIELS, J.H. and LU, L.W. Plastic Subassemblage Analysis for Unbraced Frames, Journal of the Structural Division, ASCE, Vol. 98, No. ST8, August 197~. 1769.
6. ASCE-WRC, Plastic Design in Steel, A Guide and Commen·tary, American Society of Civil Engineers, New York, 1971, P. 39.
7. GALAMBOS, T.V., Load Factor Design for Steel Buildings, Engineering Journal, AISC, Vol. 9, No. 3, July 1972, P. 108.
8. OZER, E., OKTEN, O.S., MORINO, S., DANIELS, J.H., and LU, L.W. Effective ColQ~n Length and Frame Instability, Lehigh University, Fritz Engineering Laboratory Report No. 375.2, 1974.
,.·
ILLUSTRATIONS
Fig. 1. Lateral Load Vs. Deflection Relationship of a Frame
Fig. 2. Test Results Compared vvi th First - and Second-Order Theory
Fig. 3. Frame Buckling Model Used to Determine Effective Length Factor
Fig. 4. Dimensions, Loads and Member Sizes of a 10-story, 3-bay Frame
Fig. 5. Load Vs. Deflection Relationship of a 10-story, 3-bay Frame
Fig. 6. Plastic Hinge Pattern
Fig. 7. Relationship Be·tween Ultimate Load Factor and Working Load Deflection