17
LATIN AMERICA INTEGRATING OR DIVERGING? MARIO LÓPEZ ROLDÁN HEAD OF THE INTELLIGENCE OUTREACH UNIT, CABINET OF THE SECRETARY GENERAL, OECD January 2015) Drawing by Pepe Ramírez (6 years)
| Date post: | 18-Dec-2015 |
| Category: |
Documents |
| Upload: | oswald-underwood |
| View: | 215 times |
| Download: | 1 times |
LATIN AMERICA INTEGRATING OR DIVERGING?
MARIO LÓPEZ ROLDÁNHEAD OF THE INTELLIGENCE OUTREACH UNIT, CABINET OF THE SECRETARY GENERAL, OECD
January 2015)
Drawing by Pepe Ramírez (6 years)

INTRODUCTORY WORD OF CAUTION
“Everything you say about Latin America, the opposite
is also true.”Partho Ghosh
Photo: Mirage (Google Images)
It’s so difficult to talk about Latin America as if it was a single entity or a coherent bloc. Keep this in mind.
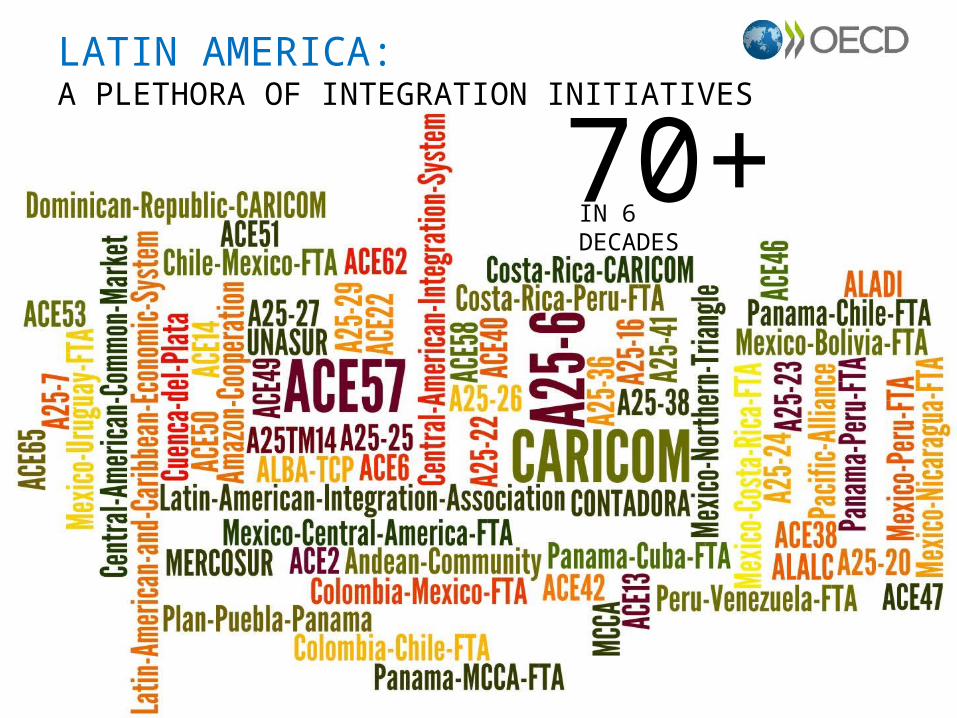
LATIN AMERICA:A PLETHORA OF INTEGRATION INITIATIVES
70+IN 6 DECADES
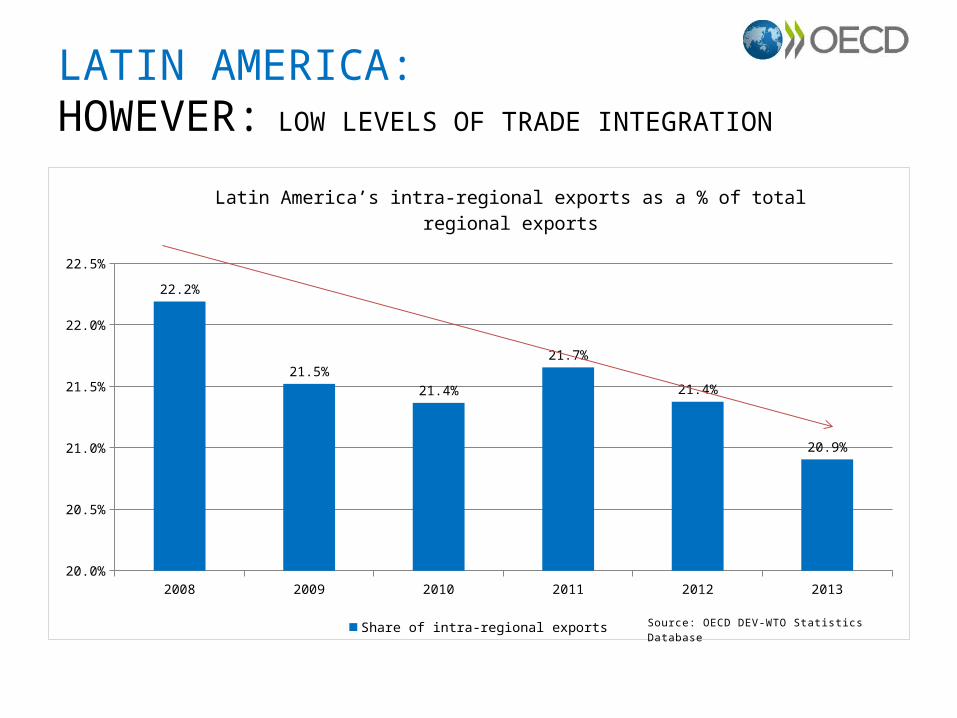
LATIN AMERICA: HOWEVER: LOW LEVELS OF TRADE INTEGRATION
2008 2009 2010 2011 2012 201320.0%
20.5%
21.0%
21.5%
22.0%
22.5%
22.2%
21.5%
21.4%
21.7%
21.4%
20.9%
Latin America’s intra-regional exports as a % of total regional exports
Share of intra-regional exportsSource: OECD DEV-WTO Statistics Database

LATIN AMERICA: COMPARATIVE TRADE INTEGRATION INDICATOR
Europe Asia Latin America Africa0
10
20
30
40
50
60
70
80
68.6
53.4
20.9
12.8
Intra-regional exports as a % of total exports
NAFTA 48%MERCOSUR 14%PACIFIC ALLIANCE 6% (2012)
Source: OECD DEV-WTO Statistics Database. 2012
Nearly 80% of Latin American exports don’t go to Latin American countries.

LATIN AMERICA: INTEGRATION TURBINES SLOWING DOWN
2010 2011 2012 20130
1
2
3
4
5
6
7
8
9
8.1
5.1
3.1
1.5
Growth of exports in volume of goods in Latin America (annual percentage change)
Source: UNCTAD secretariat calculations, based on UNCTADstat.

WHYis regional integration so low
?

Low quality and expensive logistics’ services are hindering Latin America’s trade and integration capacity
LATIN AMERICA 2014: INTEGRATION CHALLENGES
1.POOR LOGISTICS
Latin America & Caribbean Days to clear direct exports through customs
Costa
Rica
Chile
Peru
Colom
bia
Panam
a
Venez
uela
(Bol.
Rep
. of)
Domini
can
Rep.
LAC
Mex
ico
Urugu
ayBra
zil
Argen
tina
OECD
Total
- wor
ld
Europ
e
ASEAN
South
Asia
0
10
20
30
40
50
60
70
Latin America: Ratio of Freight Costs to Tariffs (units, 2012)
Calculations based on imports from the US market. The figures show the ratio of freight cost to tariffs on imports to the region. Source: OECD’S Development Center, Latin American Economic Outlook 2014
LOGISTICS represent18 to 35% of the product’s value in LAC. (8% average in OECD countries)
Brazil and Colombia have some of the world’s highest domestic costs per container for international transport and handling.
CULTURAL CHALLENGE; PUBLIC PROCURMENT; CORRUPTION.

The number of days to clear exports from customs through Latin American borders is particularly high
LATIN AMERICA 2014: INTEGRATION CHALLENGES
2. SLOW CUSTOMS
Latin America & Caribbean Days to clear direct exports through customs
Source: World Bank Group. Enterprise Surveys 2014
Mexico
(2010)
Paragu
ay (2
010)
Venezu
ela (2
010)
Ecuad
or (2010)
Brazil (
2010)
Peru (2
010)
Jamaic
a (2010)
Surin
ame (
2010)
Bolivia
(2010)
Guyana (
2010)
Honduras (2
010)
Niger (
2009)
Tanzan
ia (2013)
Cote d'Iv
oire (2
009)
Ethiopia
(2011)
Camero
on (2009)
Mali (2
010)
Chad (2
009)
Uganda (
2013)
Kenya
(2013)
Zambia
(2013)
Mauriti
us (2009)
0
5
10
15
20
25
7
21.7
18.4 18.2
16.4 16.1
13.112.6 12.4
11.6
10.1
2.6
16.7 16.615.8
15.1
12.9
11.811.2 11.1 10.7 10.3
Days to clear direct exports through customs
SUB-SAHARAN AFRICA
135
LATIN AMERICA
157

The large majority of Latin American SMEs don’t participate in export activities.
LATIN AMERICA 2014: INTEGRATION CHALLENGES
3. LOCALLY ORIENTED SMEs
Latin America & Caribbean Days to clear direct exports through customs
Source: OECD Development Center, with Data from the World Bank, 2013. LEO 2013, p.165
América Latina Europa del Este Asia Oriental0
10
20
30
40
50
60
Pequeñas Medianas Grandes
Firms that export (directly or indirectly) by size and by region (2009-2010)
(percentage)
5%In LAC countries, SMEs account for less than
of total exports
In Italy: close to 50%In Holland: close to 45%
Only about 10-11% of Latin American SMEs export
Most of exporting SMEs in EU member states export to other EU states (76% of SMEs in EU15, 83% of SMEs in EU12).
EU INTEGRATIONENGINES

LATIN AMERICA: INTEGRATION CHALLENGES4. LOW INTEGRATION SYNERGIES THROUGH FDI
• Most FDI inflows go to services and natural resources: 64% of total FDI in 2013 (ECLAC, 2014)
• An important part of FDI in manufacturing goes to Mexico and Central America to re-export to the US.
• Trans-Latinas increasingly important but: only about 14% of FDI inflows to Latin America.
2007-2011
2012
0 10 20 30 40 50 60 70 80 90 100
10
11
9
14
22
24
40
36
4
4
10
5
5
6
Latin America and the Caribbean: origin of foreign direct investment, 2007-2011 and 2012
The Netherlands Latin America United States Other Japan Spain CanadaSource: ECLAC, 2013

LACs export specialisation still greatly focused in natural resources
With a few exceptions, Latin America has not been very successful in inserting itself into Global Value Chains (GVCs).
LATIN AMERICA 2014: INTEGRATION CHALLENGES
5. LOW INTEGRATION TO GVCs
Uruguay 2009
Argentina
Colombia
Brazil
Ecuador
Bol. Rep. Venezuela
Peru
Chile
Mexico
Latin America
Lat. Am. w/out Mex.
0 0.1 0.2 0.3 0.4 0.5 0.6 0.7 0.8 0.9 1Foodstuffs Metals and minerals Fuels Other Manufactured goods
Latin America’s Pattern of Export Specialisation
Source: OECD Development Centre, Latin American Economic Outlook 2014, Data from 2011.
Only about one fifth

ISLSVN
NORDNK
CZE FINSVK
BELAUT
SWELU
XHUN
DEUNLD CHE
FRAPOL
KOROECD
NZLITA
ESTCAN IRL
AUSJP
NGRC
ESPGBR
GBRPRT ISR
USAUSA
TURTUR
MEXCHL
0.00
0.10
0.20
0.30
0.40
0.50
0.60
2010 or latest available year Mid-1990s Mid-1980s
Latin America has made important progress combating extreme poverty and reducing inequality, but POVERTY, VULNERABILITY and INEQUALITY are still very important challenges.
LATIN AMERICA 2014: INTEGRATION CHALLENGES
6. POVERTY & INEQUALITY
Source: 67% = World Bank Group, Shifting Gears to Accelerate Shared Prosperity in Latin America and the Caribbean, World Bank Document No. 78507, June 2013. Graph: OECD Factbook 2014, p. 65
67%Trends in income inequality Gini coefficient in the mid-80s, mid-90s and around 2010s
RATIO OF AVERAGE INCOME OF RICHEST 10% TO THE POOREST 10%• Chile: 27 times (OECD)• Mexico: 31 times (OECD)• Argentina: 31 times (UNDP)• Brazil: 50 times (OECD)• Bolivia: 93 times (UNDP)• OECD average 10 times (OECD)
LIVE IN POVERTY OR VULNERABILITYEARNING LESS THAN $10 A DAY (WB)

Shan
ghai
-C...
Sing
apor
eHo
ng K
ong-
...Ch
ines
e Ta
ipei
Kore
aM
acao
-Chi
naJa
pan
Liech
tens
tein
Switz
erla
ndNe
ther
land
sEs
toni
aFi
nlan
dCa
nada
Pola
ndBe
lgiu
mGe
rman
yVi
et N
amAu
stria
Aust
ralia
Irela
ndSl
oven
iaDe
nmar
kNe
w Z
eala
ndCz
ech
Repu
...Fr
ance
OEC
D av
erag
eUn
ited
Kin.
..Ice
land
Latv
iaLu
xem
bour
gNo
rway
Port
ugal
Italy
Spai
nRu
ssia
n Fe
d...
Slov
ak R
epu.
..Un
ited
Stat
esLit
huan
iaSw
eden
Hung
ary
Croa
tiaIsr
ael
Gree
ceSe
rbia
Turk
eyRo
man
iaBu
lgar
iaUn
ited
Arab
...Ka
zakh
stan
Thai
land
Chile
Mal
aysia
Mex
icoM
onte
negr
oUr
ugua
yCo
sta
Rica
Alba
nia
Braz
ilAr
genti
naTu
nisia
Jord
anCo
lom
bia
Qat
arIn
done
siaPe
ru
350.00
400.00
450.00
500.00
550.00
600.00
650.00
Mean score at the same level as the OECD average
Mean score
Education plays a key role in integration: THE HYDRA OF LAC
LATIN AMERICA 2014: INTEGRATION CHALLENGES
7. EDUCATION
Source:
LOW QUALITY EDUCATION SYSTEMS: 8 LAC countries among the last in PISA.
WEAK HIGHER EDUCATION: No Latin American university among the world’s top 100.
LAC INTEGRATION IN CURRICULA: Low presence of LAC Integration in higher, postgraduate and MBAs education programmes.
A LATIN AMERICAN “ERASMUS”: Latin America needs to develop stronger exchange programmes for students geared towards promoting LAC economic integration.
Student performance in PISA 2012 (mathematics)

Let’s not forget these three key factors:
GEOGRAPHY: A huge region: Distance from Mexico City to Buenos Aires = Paris to Kathmandu; 106 hours drive from Brasilia to Bogota.
IDEOLOGY
MIRAGE:
CULTURE:
LATIN AMERICA 2014: INTEGRATION CHALLENGES8. GEOGRAPHY, IDEOLOGY, CULTURE & LAW
RULE OF LAW: ONE OF THE CENTRAL CONCERNS FOR BUSINESS IN THE REGION.
THE MARKET ORIENTED VS. STATE ORIENTED BLOCS DISCUSSION CAN BE DECEIVING
SIZE OF STATE IN THE ECONOMY:Public spending: Brazil 40% of GDP;Argentina 44%.
Canada 40%; the UK 48%;Denmark about 60%;EU about 50% (average).
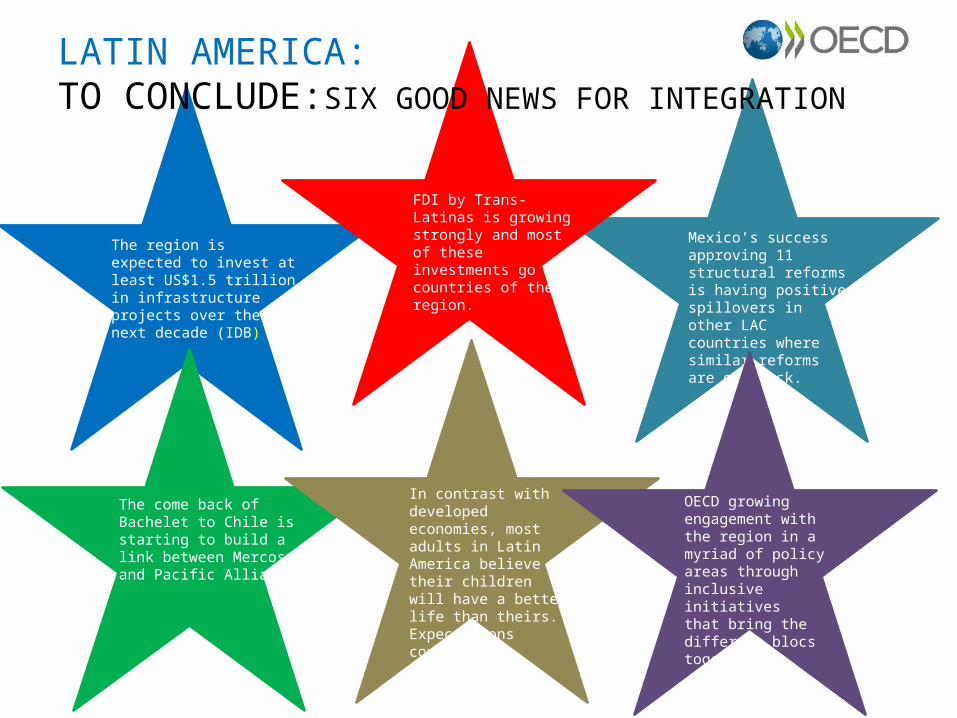
LATIN AMERICA: TO CONCLUDE:SIX GOOD NEWS FOR INTEGRATION
The region is expected to invest at least US$1.5 trillion in infrastructure projects over the next decade (IDB)
The come back of Bachelet to Chile is starting to build a link between Mercosur and Pacific Alliance.
FDI by Trans-Latinas is growing strongly and most of these investments go to countries of the region.
In contrast with developed economies, most adults in Latin America believe their children will have a better life than theirs.Expectations count!
Mexico’s success approving 11 structural reforms is having positive spillovers in other LAC countries where similar reforms are on track.
OECD growing engagement with the region in a myriad of policy areas through inclusive initiatives that bring the different blocs together..

LATIN AMERICA
INTEGRATING OR DIVERGING?
Probably none of the above!
THANK YOU.
MARIO LÓPEZ ROLDÁNHEAD OF THE INTELLIGENCE OUTREACH UNIT, CABINET OF THE SECRETARY GENERAL, OECD
Drawing by Pepe Ramírez (6 years)


