Page 1
Latvijas Lauksaimniecības universitāte
Latvia University of Life Sciences and Technologies
Pārtikas tehnoloģijas fakultāte
Faculty of Food Technology
Mg.sc.ing. Līva Aumeistere
MĀTES PIENA SASTĀVA IZPĒTE
THE STUDY OF HUMAN MILK COMPOSITION
Promocijas darba KOPSAVILKUMS
zinātniskā doktora grāda zinātnes doktors (Ph.D.)
pārtikas un dzērienu tehnoloģijās
iegūšanai
SUMMARY
of the Doctoral thesis for acquiring a Doctor of Science
(Ph.D.) in Food and beverage technologies
Jelgava
2021
Page 2
2 2
Promocijas darba vadītājas / Scientific supervisors:
LLU profesore Dr.sc.ing. Inga Ciproviča
RSU asociētā profesore Dr.med. Dace Zavadska
Darba recenzenti / Official reviewers:
Vadošā pētniece / Leading researcher Dr.sc.ing. Vita Šterna –
APP Zinātniskais institūts “Agroresursu un ekonomikas institūts” / Institute of
Agricultural Resources and Economics;
Asociētā profesore / Associated professor Dr.med. Laila Meija – Rīgas Stradiņa
universitāte / Riga Stradiņš University;
Profesors / Professor Dr.med.habil. Vytautas Usonis – Viļņas universitāte /
Vilnius University.
Promocijas darba aizstāvēšana notiks Latvijas Lauksaimniecības
universitātes Pārtikas un dzērienu tehnoloģijas nozares promocijas padomes
atklātajā sēdē 2021. gada 29. septembrī plkst. 14.00 Pārtikas tehnoloģijas
fakultātes 216. auditorijā, Rīgas ielā 22, Jelgavā.
The defence of the Ph.D. thesis in an open session of the Promotion Board of
the Food and Beverage Technology of Latvia University of Life Sciences and
Technologies will be held on 29th September 2021 at 14 PM in auditorium 216
at Faculty of Food Technology of Latvia University of Life Sciences and
Technologies, 22 Rigas Street, Jelgava.
Ar promocijas darbu un tā kopsavilkumu var iepazīties LLU
Fundamentālajā bibliotēkā, Lielā ielā, 2 Jelgavā un internetā (pieejams:
www.kopkatalogs.lv). Atsauksmes sūtīt Pārtikas un dzērienu tehnoloģijas
nozares promocijas padomes sekretārei, profesorei Dr.sc.ing. Ilzei Beitānei
(Rīgas iela 22a, Jelgava, LV-3004, e-pasts: [email protected] ).
The Ph.D. thesis is available at the Fundamental Library of the Latvia
University of Life Sciences and Technologies, 2 Liela Street, Jelgava, and on the
internet: www.kopkatalogs.lv. References should be sent to the professor
Dr.sc.ing. Ilze Beitane, the Secretary of the Promotion Board of Food and
Beverage Technology at the Faculty of Food Technology (22a Rigas Street,
Jelgava, LV-3004, Latvia or e-mail: [email protected] ).
Page 3
3
CONTENT
List of the acronyms, abbreviations used in the summary of the Ph.d. thesis .... 4 Topicality of the research ................................................................................... 5 Approbation of the research ................................................................................ 7 Materials and methods ...................................................................................... 10 Results and discussion ...................................................................................... 16 1. Composition of human milk ........................................................................ 16 2. Dietary habits and nutrient intake among the study participants ................. 22 3. Human milk composition in relation to maternal nutrition ......................... 31 4. Supply of energy and nutrients for exclusively breastfed infants via
human milk ....................................................................................................... 36 Conclusions ...................................................................................................... 42
SATURS
Promocijas darba kopsavilkumā lietotie saīsinājumi un simboli ........................ 4 Pētījuma aktualitāte ........................................................................................... 44 Zinātniskā darba aprobācija .............................................................................. 46 Materiāli un metodes......................................................................................... 49 Pētījuma rezultāti un diskusija .......................................................................... 53 1. Mātes piena sastāvs ..................................................................................... 53 2. Uztura paradumi un uzturvielu uzņemšana pētījuma dalībniecēm .............. 56 3. Uztura ietekme uz mātes piena sastāvu ....................................................... 62 4. Enerģijas un uzturvielu nodrošinājums ar mātes pienu ekskluzīvi
zīdītiem zīdaiņiem ............................................................................................ 66 Secinājumi ........................................................................................................ 67
Page 4
4
LIST OF THE ACRONYMS, ABBREVIATIONS USED IN
THE SUMMARY OF THE PH.D. THESIS / PROMOCIJAS
DARBA KOPSAVILKUMĀ LIETOTIE SAĪSINĀJUMI UN
SIMBOLI
ρ – Spearman rank correlation coefficient / Spīrmena rangu korelācijas
koeficients
ALA / ALS – α-linolenic acid / α-linolēnskābe
ARA / AS – arachidonic acid / arahidonskābe
BDL / ZNR – below the detection limit / zem noteikšanas robežas
BMI / ĶMI – body mass index / ķermeņa masas indekss
CLA / KLS – conjugated linoleic acid acid / konjugētā linolskābe
DHA / DHS – docosahexaenoic acid / dokozaheksaēnskābe
E % – the percentage of total daily energy intake / procentuālais dienā uzņemtās
kopējās enerģijas daudzums
EA / ES – elaidic acid / elaidīnskābe
EN – European standard / Eiropas standarts
EPA / EPS – eicosapentaenoic acid / eikozānpentaēnskābe
et al. / etc. / u.c. / u.tml. – and others / un citi
Fig. / att. – attēls / figure
ICP-MS – inductively coupled plasma mass spectrometry / induktīvi saistītās
plazmas masspektrometrija
IQR / SKI – interquartile range / starpkvartīļu izkliede
ISO – International Standard Organization / Starptautiskā Standartizācijas
organizācija
LA / LS – linoleic acid / linolskābe
LEA / LES – linolelaidic acid / linolelaidīnskābe
LVS – Latvian Standard / Latvijas standarts
MCFA / VGĶT – medium-chain fatty acids / vidēji garo ķēžu taukskābes
MUFA / MNT – monounsaturated fatty acids / mononepiesātinātās taukskābes
n – number of samples or participants / paraugu vai dalībnieču skaits
ND / ND – not defined / nav definēts
OA / OS – oleic acid / oleīnskābe
PA / PS – palmitic acid / palmitīnskābe
PUFA / PNT – polyunsaturated fatty acids / polinepiesātinātās taukskābes
R2 – the coefficient of determination / determinācijas koeficients
SFA / PT – saturated fatty acids / piesātinātās taukskābes
SPSS – Statistical Package for the Social Sciences / Sociālo zinātņu statistikas
pakete
TFA / TT – trans fatty acids / trans taukskābes
VA / VS – vaccenic acid / vakcēnskābe
Page 5
5
TOPICALITY OF THE RESEARCH
Human milk is universally preferred as the first food and nutrient source
for the infant (World Health Organization, 2018).
Components in human milk are directly synthesized in the mammary
glands or derived from maternal plasma, therefore originate from current
maternal diet or body stores (Andreas, Kampmann, & Le-Doare, 2015;
Hale & Hartmann, 2017). Accordingly, the quality of women’s diet is an
important factor that can affect human milk composition and provision of
essential nutrients for the infant (Hale & Hartmann, 2017;
Lawrence & Lawrence, 2015).
Human milk composition among lactating women in Latvia has not been
comprehensibly studied (Bake et al., 2007; Broka et al., 2016). There has been
previously done research assessing the exposure of human milk to persistent
organic pollutants in Latvia (Bake et al., 2007). The target group of the research
was mothers from town Olaine and the control group was from the area without
chemical industry objects. Obtained results responded to the lowest detected
levels of organic pollutants among European countries (Bake et al., 2007).
Research conducted by Broka et al. (2016) is the latest study conducted
in Latvia about macronutrient (fat, protein, lactose) content in human milk.
Nevertheless, only transitional human milk samples (less than one month
postpartum) were collected, and it was done while mothers and infants were
admitted to the Neonatal Care Unit in Children’s’ Clinical University Hospital.
Therefore, study results cannot be ascribed to the overall population.
All around the world fatty acid composition of human milk has been
extensively studied (Bravi et al., 2016; Keikha et al., 2017), and it seems that the
type of fatty acids in human milk varies due to regional aspects and dietary
traditions (Andreas, Kampmann, & Le-Doare, 2015; Hale & Hartmann, 2017;
Mohrbacher, 2010). However, currently there is no data regarding fatty acid
composition in human milk among lactating women in Latvia. Currently, there
are also no data about the essential and potentially toxic elements content in
human milk among lactating women in Latvia. There is also a lack of information
regarding women’s dietary habits during lactation in Latvia.
It raises a need to conduct research in this area as it would provide an
insight of national differences in human milk composition, allow us to evaluate
the quality of maternal nutrition and its effect on human milk composition and
therefore nutritional provision for infants.
The hypothesis of the study: maternal nutrition predicts human milk
composition and serves as the basis for providing the essential nutrients for the
infant.
Page 6
6
The hypothesis is supported by the following thesis:
• a lactating woman can meet her nutritional needs by consuming
a well-balanced diverse diet, which also serves as the basis for
providing the essential nutrients for infant via human milk.
• total fat, protein, lactose content in human milk is not directly
affected by maternal diet;
• qualitative and quantitative fatty acid composition of human milk
is influenced by maternal dietary habits;
• essential and potentially toxic element content in human milk is
related to maternal dietary habits;
• exclusively breastfed infants till six months of age can receive
a sufficient amount of energy and nutrients (fat, protein, lactose,
fatty acids and essential elements) via human milk.
The research object of the study: mature human milk (at least 28 days
postpartum).
The aim of the study: to evaluate human milk composition in relation to
maternal nutrition and to assess nutritional supply for exclusively breastfed
infants.
Consequential research objectives were set to achieve the aim of the study:
1) to analyse protein, lactose, fat, fatty acid, essential (Ca, Mg, Na,
K, Zn, Se, Mn, Fe, Cu, Co, Cr) and potentially toxic element
(Al, Ni, As, Sr, Cd, Sn, Sb, Pb) content in human milk;
2) to evaluate the compliance of the women’s nutrition during
lactation with the recommendations at the national and European
level;
3) evaluate the association between maternal nutrition and human
milk composition;
4) based on elaborated human milk composition results, theoretically
evaluate nutritional adequacy of exclusively breastfed infants till
six months of age.
The scientific significance of the study:
1) for the first time in Latvia, composition of human milk has been
comprehensively analysed;
2) elaborated data serve as a contribution from Latvia to the global
research area of human milk composition.
The national significance of the study:
1) elaborated findings can be used to develop nutritional guidance for
lactating women in Latvia;
2) compiled results can be used to develop nutrient intake guidelines
for infants in Latvia (≤6 months old).
Page 7
7
APPROBATION OF THE RESEARCH
Results of the research have been published in 8 peer-reviewed scientific
issues, of which 7 are indexed in SCOPUS and/or Web of Science databases:
1) Aumeistere L., Zavadska D. (2016) Raising awareness about breast
milk composition among women in Latvia. In: Journal of
Breastfeeding Biology, Vol. 1, No. 1, p. 21–28.
https://doi.org/10.14302/issn.2644-0105.jbfb-16-1257;
2) Aumeistere L., Ciprovica I., Zavadska D., Celmalniece K. (2017)
Lactose content of breast milk among lactating women in Latvia. In:
FOODBALT 2017 – 11th Baltic Conference on Food Science and
Technology: Food Science and Technology in a Changing World.
International Scientific Conference Proceedings, p. 169–173.
https://doi.org/10.22616/foodbalt.2017.023 (indexed in Web of
Science database);
3) Aumeistere L., Ciprovica I., Zavadska D., Bavrins K. (2017)
A preliminary study on essential minerals in human milk:
association with dietary habits. In: 23rd Annual International
Scientific Conference “Research for Rural Development 2017”.
International Scientific Conference Proceedings, Vol 1. 2017,
p. 230–236. https://doi.org/10.22616/rrd.23.2017.034 (indexed in
SCOPUS and Web of Science databases);
4) Aumeistere L., Ciproviča I., Zavadska D., Volkovs V. (2018)
Fish intake reflects on DHA level in breast milk among lactating
women in Latvia. In: International Breastfeeding Journal, Vol. 13,
Article No. 33. https://doi.org/10.1186/s13006-018-0175-8
(indexed in SCOPUS and Web of Science databases);
5) Aumeistere L., Ciproviča I., Zavadska D., Bavrins K., Borisova A.
(2018) Zinc content in breast milk and its association with maternal
diet. In: Nutrients, Vol. 10, Issue 10, Article No. 1438.
https://doi.org/10.3390/nu10101438 (indexed in SCOPUS and Web
of Science databases);
6) Aumeistere L., Ciprovica I., Zavadska D., Bavrins K., Borisova A.
(2019) Essential elements in mature human milk. In: FOODBALT
2019. 13th Baltic Conference on Food Science and Technology.
FOOD. NUTRITION. WELL-BEING. Conference Proceedings,
p. 25–29. https://doi.org/10.22616/Foodbalt.2019.005 (indexed in
Web of Science database);
Page 8
8
7) Aumeistere L., Ciprovica I., Zavadska D., Andersons J.,
Volkovs V., Ceļmalniece K. (2019) Impact of maternal diet on
human milk composition among lactating women in Latvia.
In: Medicina, Vol. 55, Issue 5, Article No. 173.
https://doi.org/10.3390/medicina55050173 (indexed in SCOPUS
and Web of Science database);
8) Aumeistere L., Ciprovica I., Zavadska D., Bavrins K., Borisova A.
(2020) The relation between human milk sodium and maternal
sodium intake. In: Proceedings of the Latvian Academy of Sciences.
Section B: Natural, Exact, and Applied Sciences, Vol. 74, Issue 4,
p. 232–236. https://doi.org/10.2478/prolas-2020-0037 (indexed in
SCOPUS and Web of Science database).
Results have been presented in 11 international scientific
conferences & congresses in Latvia, Spain, Italy, the Netherlands, and Finland:
1) Aumeistere L., Ciprovica I., Zavadska D., Bavrins K. (2017)
Trace elements in human milk among lactating women in Latvia.
In: International Student Conference “Health and Social Sciences,
5 April 2017, Riga, Latvia (Poster presentation);
2) Aumeistere L., Ciprovica I., Zavadska D., Celmalniece K. (2017)
Lactose content of breast milk among lactating women in Latvia.
In: 11th Baltic Conference on Food Science and Technology
Foodbalt 2017, 27 to 28 April 2017, Jelgava, Latvia (Oral
presentation);
3) Aumeistere L., Ciprovica I., Zavadska D., Bavrins K. (2017)
A preliminary study on essential minerals in human milk:
association with dietary habits. In: 23rd Annual International
Scientific Conference Research for Rural Development 2017, 17 to
19 May 2017, Jelgava, Latvia (Oral presentation);
4) Aumeistere L., Ciprovica I., Zavadska D., Andersons J.,
Jakubone E. (2017) Fat content of human milk: a pilot study from
Latvia. In: 11th European Nutrition and Dietetics Conference,
29 June to 1 July 2017, Madrid, Spain (e-poster presentation);
5) Aumeistere L., Ciprovica I., Zavadska D., Bavrins K., Borisova A.
(2018) Zinc content in breast milk: a report from Latvia. In:
2nd EuroSciCon Conference on Food Technology, 14 to 16 May
2018, Rome, Italy (Oral presentation);
6) Aumeistere L., Ciprovica I., Zavadska D., Volkovs V. (2018)
Trans fatty acid content in mature breast milk among lactating
women in Latvia. In: 1th European Food Chemistry & Nutrition
Congress, 26 to 27 July 2018, Amsterdam, the Netherlands
(Oral presentation);
Page 9
9
7) Aumeistere L., Ciprovica I., Zavadska D., Bavrins K., Borisova A.
(2019) Maternal sodium intake reflects on sodium content in mature
human milk. In: 6th International Conference on
Nutrition & Growth, 7 to 9 March 2019, Valencia, Spain
(Poster presentation);
8) Aumeistere L., Ciprovica I., Zavadska D., Bavrins K., Borisova A.
(2019) Essential elements analysis in mature human milk.
In: 13th Baltic Conference on Food Science FoodBalt 2019 &
5th North and East European Congress on Food NEEFood 2019,
2 to 3 May 2019, Jelgava, Latvia (Oral presentation);
9) Beluško A., Aumeistere L., Ciproviča I., Zavadska D. (2020)
Conjugated linoleic acid in human milk: a case study from Latvia.
In: 3rd International Conference Nutrition and Health, 9 to 11
December 2020, Riga, Latvia (e-poster presentation);
10) Aumeistere L., Ciproviča I., Zavadska D., Volkovs V. (2020)
Dietary vegetable oil impact on fatty acid composition in human
milk. In: 12th Nordic Nutrition Conference, 13 to 16, December
2020, Helsinki, Finland (e-poster presentation);
11) Beluško A., Aumeistere L., Ciproviča I., Zavadska D. (2021)
Omega-3 fatty acid composition in human milk. In: 16th
International Scientific Conference “Students on their Way to
Science”, 23 April 2021, Jelgava, Latvia (Oral presentation
virtually).
The study has been financially supported by the grants:
• Strengthening Research Capacity in the Latvia University of Life
Sciences and Technologies. Project “The study of human milk
composition”. Project No. Z2. Contract No. 3.2.-10/44.
Project status – finished (project time from 1 January 2017 to
31 December 2018);
• Conducting Fundamental Research in the Latvia University of Life
Sciences and Technologies. Project “Natural variations in fatty acid
composition of human milk”. Project No. G1.
Contract No. 3.2-10/2019/LLU. Project status – ongoing (project
time from 6 January 2020 to 5 January 2022);
• Latvia University of Life Sciences and Technologies Transition to
the New Doctoral Funding Model. European Social Fund Project
No. 8.2.2.0/20/I/001. Project status – ongoing (project time from
17 May 2021 to 16 May 2022).
Page 10
10
MATERIALS AND METHODS
Design, time, venue of the research and sample size
This comparative cross-sectional study was carried out from November
2016 till March 2021 and divided into two intervals:
• the first study period was from November 2016 till December
2019 (in total participated 71 participant);
• the second study period was from January 2020 till March 2021
(in total participated 70 participants).
In both study periods, women were invited to participate in the study via
a poster published on social media member groups for lactating mothers.
Participants were from all regions of Latvia, however, mainly from Riga
and Pierīga (see Table 1).
Table 1 / 1. tabula
Division of the study participants by the statistical regions of the Republic
of Latvia / Dalībnieču sadalījums pa Latvijas Republikas statistiskajiem
reģioniem (n=141) Statistical regions of
the Republic of Latvia
/ Latvijas Republikas
statistiskie reģioni
First study period /
Pirmais pētījuma posms
Second study period /
Otrais pētījuma posms
Riga / Rīga n=41 n=36
Pierīga / Pierīga n=18 n=15
Vidzeme / Vidzeme n=4 n=5
Zemgale / Zemgale n=4 n=9
Latgale / Latgale n=1 n=3
Kurzeme / Kurzeme n=3 n=2
Inclusion and exclusion criteria for the participants
The inclusion criteria for the participants were:
1) signed consent form;
2) reside in Latvia;
3) singleton pregnancy;
4) at least 28 days postpartum;
5) exclusively breastfeeding or partially breastfeeding (human milk
and infant formula or complementary food);
6) mother and child apparently healthy (without metabolic disorders,
no acute illnesses, etc.).
Exclusion criteria were:
1) unsigned consent form;
2) noncompliance with the inclusion criteria.
Page 11
11
Ethical considerations
Before the study, the approval from Riga Stradiņš University Ethics
Committee was received (No. 4/28.7.2016.). To continue the study, ethical
approval was renewed in year 2020 (No. 6-1/01/6). The study was conducted
according to the guidelines laid down in the:
• Declaration of Helsinki – Ethical Principles for Medical Research
Involving Human Subjects (World Medical Association, 2013);
• Convention for the protection of Human Rights and Dignity of the
Human Being with regard to the Application of Biology and
Medicine: Convention on Human Rights and Biomedicine
(Council of Europe, 1997).
The signed consent form was obtained from all women before the study.
The privacy rights of the participants were ensured throughout the study under
the General Data Protection Regulation (Regulation No. 2016/679 of the
European Parliament and the Council, 2016) and Personal Data Processing Law
(Latvijas Republikas Fizisko personu datu apstrādes likums, 2018). Human milk
samples as well all documentation were marked using a unique three-digit code
to replace all personal information (name, surname, etc.).
Description of the study process
The study process was similar in both study periods and is described in
the Figure 1.
A specific sampling procedure was used to reduce possible nutritional
undue and to ensure minimal interference with the infant’s feeding behaviour.
A few millilitres of milk were expressed after the end of nursing from the
feeding breast. If the nursing session was paired (the infant had been feeding on
both breasts), participants were asked to collect milk from the breast that has
been suckled for a longer period.
Sampling frequency was not defined, but taking into account possible
diurnal variations, the pooled sample had to include milk from the morning,
mid-day, evening and night feedings.
During the first study period, participants were asked to collect in total
100 ml of pooled human milk and pour it into four containers:
• ~ 40 ml of milk in one container (for the determination of fat and
protein);
• ~ 40 ml of milk in another container (for the determination of
essential and potentially toxic elements);
• ~ 10 ml of milk in another container (for the determination of
lactose);
• ~ 10 ml of milk in another container (for the qualitative and
quantitative determination of fatty acids).
Page 12
12
During the second study period, sample collection and storage was the
same except that due to time limit and financial reasons we were not able to
determine essential and potentially toxic element content in human milk and
chose a less expensive method for macronutrient (fat, protein, lactose)
determination in human milk. Therefore, participants were asked to collect in
total only 50 ml of pooled human milk and pour it into two containers:
• ~ 40 ml of milk in one container (for the determination of fat,
protein, lactose);
• ~ 10 ml of milk in another container (for the qualitative and
quantitative determination of fatty acids).
Methods used for the analysis of human milk composition
Methods used for the analysis of human milk composition are
summarized in the Figure 2.
1. First meeting with the participants
• On-site or online.
2. Transfer of the study materials
• Consent form;
• 72-hour food diary + food atlas;
• Food frequency questionnaire;
• Questionnaire about participantscharasteristics;
• Prelabelled containers and instruction formilk collection.
3. Sampling of human human
• Participants write food diary forthree consecutive days,complete other questonnairesand in the next 24-hours collecthuman milk (pooled sample inone container);
• Pooled human milk sample wasstored in the refrigerator duringcollection process (~ 4 °C).After, human milk was pouredinto containers and stored in thefreezer (~ -18 °C).
4. Second meeting with the participants
• Frozen human milk samples,72-hour diary and otherquestionnaires collected fromthe participants. Frozen humanmilk samples transported to thelaboratory (using bag with icepacks).
Fig. 1. Description of the study process
Page 13
13
Evaluation of nutritional data using 72-hour food diary and food
frequency questionnaire
To evaluate current energy and nutrient intake among the participants,
a self-administered 72-hour food diary was used. A 72-hour food diary included
example page on how to write a diary. Participants were also encouraged to use
an electronic food atlas (Food Control Authority, 2014) to determine the size of
a food product or a food portion size. Measurements like spoons, cups were also
used by participants to facilitate the determination of the food portion sizes.
Fir
st s
tud
y p
erio
d
Chemistry laboratory of
Institute BIOR
Fat, %
LVS ISO 2446:2008 (Gerber method)
Protein, %
LVS EN ISO 8968-1:2014 (Kjeldahl method)
Lactose, %
ISO 22662:2007
(High perforamnce liquid chromatography)
Fatty acids, % of all fatty acids (n=37)
BIOR-T-012-131-2011 (Gas chromatography)
Essential elements, mg 100 ml-1 vai µg 100 ml-1
(Ca, Mg, Na, K, Zn, Se, Mn, Fe, Cu, Co, Cr)
Potentially tocix elements, µg 100 ml-1
(Al, Ni, As, Sr, Cd, Sn, Sb, Pb)
BIOR-T-012-148-2013 (Inductively coupled
plasma maspectrometry)
Sec
on
d s
tud
y p
erio
d
Chemistry
laboratory of
Institute BIOR
Fatty acids, % of all fatty acids
(n=37 + conjugated linoleic acid)
BIOR-T-012-131-2011 (Gas chromatography)
Food Technology
Faculty of Latvia
University of Life
Sciences and
Technologies
Fat, protein, lactose, %
MilkoScanTM Mars, ISO 9622:2013
Fig. 2. Methods used for the analysis of human milk composition
Page 14
14
Unfortunately, due to a lack of information regarding the fatty acid
composition of different foodstuff, we were not able to use the national food
composition database of Latvia. Instead, we used the Finnish food composition
Fineli (National Institute for Health and Welfare of Finland, 2019) to calculate
the total energy and nutrient intake among the participants.
Nutritional information about dietary supplements was taken into account
and added to the nutrient calculations from the Fineli food database.
A self-administered food frequency questionnaire – a modified protocol
from the World Health Organization (2007) was used to assess participants’
habitual diet. The aim of the food frequency questionnaire was to rank different
foodstuff intake according to the consumption frequency during the past four
weeks before the study. The food frequency questionnaire consisted of
74 foods & drinks. The response options in the food frequency questionnaire
were ranged into six categories:
• “never” (0 points);
• “less than once a week” (1 point);
• “once a week” (2 points);
• “twice a week” (3 points);
• “more than twice a week but not every day” (4 points);
• “every day” (5 points).
Characteristics of the participants
Information regarding characteristics of the participants are summarized
in Table 2.
Table 2 / 2. tabula
Characteristics of the participants / Pētījuma dalībnieku raksturojums
Parameter
(unit) /
Parametrs
(mērvienība)
First study period /
Pirmais pētījuma posms
(n=69)*
Second study period /
Otrais pētījuma posms
(n=70)
Median
(IQR) /
Mediāna
(SKI)
Range /
Diapazons
Median
(IQR) /
Mediāna
(SKI)
Range /
Diapazons
Maternal characteristics / Dalībnieču raksturojums
Age (years) /
Vecums
(gadi)
31 (5) 23–39 31 (7) 23–45
BMI / ĶMI
(kg m-2)
21.72
(4.46)
17.63–
32.18
22.28
(3.79)
18.51–
36.57
Parity /
Bērnu skaits 2 (1) 1–4 2 (1) 1–5
Page 15
15
Table 2 continued / 2. tabulas turpinājums
Parameter
(unit) /
Parametrs
(mērvienība)
First study period /
Pirmais pētījuma posms
(n=69)*
Second study period /
Otrais pētījuma posms
(n=70)
Median
(IQR) /
Mediāna
(SKI)
Range /
Diapazons
Mediāna
(SKI) /
Median
(IQR)
Median
(IQR) /
Mediāna
(SKI)
Feeding
pattern /
Ēdināšanas
veids
40 – exclusively
breastfeeding / ekskluzīvā
zīdīšana
2 – human milk + infant
formula / mātes piens +
mātes piena aizstājējs
27 – human milk +
complementary feeding /
mātes piens + papilduzturs
48 – exclusively
breastfeeding / ekskluzīvā
zīdīšana
3 – human milk + infant
formula / mātes piens +
mātes piena aizstājējs
19 – human milk +
complementary feeding /
mātes piens + papilduzturs
Milk
expression
manner /
Piena
noslaukšanas
veids
21 – manual expression /
noslaukšana ar roku
39 – breast pump /
piena pumpis
9 – both methods / abas
metodes
31 – manual expression /
noslaukšana ar roku
26 – breast pump /
piena pumpis
13 – both methods / abas
metodes
Characteristics of the children / Bērnu raksturojums
Age (months)
/ Vecums
(mēneši)
4.0 (4.5) 1.5–21.0 3.0 (4.0) 1.0–27.0
64 – Infants / Zīdaiņi
(≤12 months / mēneši)
5 – Toddlers / Mazi bērni
(1 to 2 years old /
1 līdz 2 gadus veci)
68 – Infants / Zīdaiņi
(≤12 months / mēneši)
2 – Toddlers / Mazi bērni
(1 to 2 years old /
1 līdz 2 gadus veci)
Birth weight / Dzimšanas
svars (kg)
3.49
(0.64) 1.60–5.36
3.61
(0.64) 1.63–5.50
Birth length /
Dzimšanas
garums (cm)
53.0 (5.0) 42–61 54.0 (3.0) 42–61
Sex /
Dzimums
34 – girls / meitenes
35 – boys / zēni
34 – girls / meitenes
36 – boys / zēni
* two out of 71 participants did not complete a questionnaire about
maternal & child characteristics / divas no pētījuma dalībniecēm neiesniedza
anketas par mātes & bērna parametriem
Data statistical analysis
All elaborated data were summed up using Microsoft Excel, 2019
(Microsoft Corp.), and statistical analyses were performed using IBM SPSS
Statistics, version 22.0 (SPSS Incorporated).
Page 16
16
The results were expressed as average (standard deviation), median
(interquartile range) and range (minimal–maximal values). The Kruskal Wallis H
test was used to spot statistically significant differences between continuous or
ordinal dependent variables and independent nominal variables. Spearman's rank
correlation (ρ) was selected to measure the strength and direction of the
association between continuous or ordinal variables. Non-parametric partial
Spearman’s rank correlations were conducted while controlling the following
covariates:
• maternal age;
• maternal BMI;
• child’s age;
• child’s birth weight and length;
• child’s sex;
• parity;
• feeding pattern (exclusive / mixed);
• milk expression manner (manual expression by hand / breast pump
/ combination of both methods.
A principal component analysis was conducted to identify different
dietary patterns and human milk fatty acid composition patterns among the
participants. The count of patterns was identified based on the eigenvalue (≥1).
Values with the factor loading ≥|0.5| were considered to contribute significantly
to the identified components.
Stepwise multiple regression was used to predict a specific nutrient
content in human milk based on three sequential day intake of this nutrient.
If needed, data were transformed to follow a normal distribution
(log-transformation or square root transformation) before the specific statistical
test.
A p-value of ≤0.05 was considered statistically significant.
RESULTS AND DISCUSSION
1. Composition of human milk
Obtained results about macronutrient content in obtained human milk
samples are summarized in Table 3.
Median fat content in human milk did not significantly differ between
study groups (p=0.771), but a significantly higher median protein and lactose
content in human milk were noted among the second study group (p<0.005 for
both). Obtained differences are probably due to different analytical methods used
in each study period.
Page 17
17
The median values for fat (4.40 %) and lactose (6.53 %) content in human
milk from the first study period were similar to data previously reported in Latvia
from Broka et al. (2016) – 4.42 % and 6.50 %, respectively. Elaborated median
content for protein in both study groups (1.09 % and 1.23 %, respectively) was
lower than data reported from Broka et al. (2016) – 1.46 %. The difference could
be related to the sampling time. Our samples were collected at least 28 days
postpartum, therefore it was mature human milk. Broka et al. (2016) analysed
human milk samples collected 5 to 28 day postpartum, therefore it was
transitional milk which contains a higher protein content compared to mature
human milk (Garwolińska et al., 2018).
Table 3 / 3. tabula
Fat, protein, and lactose content (%) in human milk /
Tauku, olbaltumvielu un laktozes saturs (%) mātes pienā
Macro-
nutrients /
Makro-
uzturvielas
First study period /
Pirmais pētījuma posms
(n=65)*
Second study period /
Otrais pētījuma posms
(n=70)
Median
(IQR) /
Mediāna
(SKI)
Range /
Diapazons
Median
(IQR) /
Mediāna
(SKI)
Range /
Diapazons
Fat / Tauki 4.40 (2.00) 1.00–7.70 4.32 (1.75) 0.92–7.56
Protein /
Olbaltum-
vielas
1.09 (0.19) 0.75–1.82 1.23 (0.21) 1.00–1.99
Lactose /
Laktoze** 6.53 (0.49) 5.94–7.70 7.18 (0.29) 6.24–7.54
* six out of 71 participants were not able to donate enough human milk for the
analysis / sešas no pētījuma dalībniecēm nevarēja noslaukt pietiekami piena
analīžu veikšanai.
** two significant outliers among lactose values were detected in the first study
group and one significant outlier in the second study group / divas atšķirīgas
vērtības laktozes saturam tika konstatētas pirmajā grupā, bet viena – otrajā
grupā.
Data regarding fatty acid composition in human milk (only most
important fatty acids displayed) are compiled in Table 4.
Dominating fatty acids in human milk was oleic acid, followed by
palmitic acid and linoleic acid. These three fatty acids are marked also as
dominant fatty acids from studies around the world (Antonakou et al., 2013;
Daud et al., 2013; Glew et al., 2006; Jiang et al., 2016; Krešić et al., 2013; Luna,
Juárez & de la Fuente, 2007; Mojska et al., 2003; Mosley et al., 2005;
Nishimura et al., 2013; Olang et al., 2012; Precht & Molkentin, 1999; Samur,
Topcu & Turan, 2009; Wu et al., 2010).
Page 18
18
Table 4 / 4. tabula
Fatty acid composition of human milk (% from all fatty acids) /
Taukskābju sastāvs mātes pienā (% no kopējām taukskābēm)
Fatty acids /
Taukskābes
First study period /
Pirmais pētījuma
posms (n=71)
Second study period /
Otrais pētījuma posms
(n=70) p-value /
p-vērtība Median / Mediāna
(Range / Diapazons)
Median / Mediāna
(Range / Diapazons)
PS / PA
(C16:0)
23.80
(13.20–30.60)
18.70
(10.60–25.0) <0.0005
OA / OS
(C18:1 n-9c)
34.50
(26.10–41.40)
38.20
(25.20–49.40) <0.0005
LA / LS
(C18:2 n-6c)
11.20
(5.00–26.50)
14.40
(8.60–36.80) <0.0005
ALA / ALS
(C18:3 n-3)
1.00
(0.50–9.60)
1.70
(0.80–5.50) <0.0005
ARA / AS
(C20:4 n-6)
0.30
(0.10–0.50)
0.40
(0.10–2.10) 0.021
EPA / EPS
(C20:5 n-3)
0.10
(<0.10–2.70)
0.10
(<0.10–0.30) <0.0005
DHA / DHS
(C22:6 n-3)
0.30
(0.10–4.30)
0.30
(0.10–1.00) 0.883
EA / ES
(C18:1 n-9t)
<0.10
(all values /
visas vērtības)
0.50 (0.10–1.40) <0.0005
VA / VS
(C18:1 n-11t)
1.20
(<0.10–1.90)
1.70
(0.90–2.20) <0.0005
LEA / LES
(C18:2 n-9t,12t)
0.10
(<0.10–1.50)
0.10
(<0.10–0.30) <0.0005
CLA / KLS
(C18:2 n9c, n11t)
not analysed in this
study period/
netika noteikta
šī posma ietvaros
0.10
(<0.10–0.30)
not
calculated
/ nav
aprēķināts
SFA / PT 45.70
(27.20–60.80)
38.60
(21.80–49.10) <0.0005
MCFA / VGĶT
(C10–C14)
12.40 (4.00)
(6.20–24.50)
12.10 (3.20)
(6.50–21.70) 0.149
MUFA / MNT 38.80
(29.20–45.60)
40.30
(25.80–51.40) 0.132
PUFA / PNT 14.10
(7.50–31.70)
18.10
(12.40–39.60) <0.0005
TFA / TT 1.40
(<0.10–2.80)
2.40
(1.00–3.20) <0.0005
Page 19
19
Using principal component analysis, we identified six human milk fatty
acid profiles among the participants, explaining 85.12 % of total fatty acid profile
variance:
• first profile associated with a high polyunsaturated fatty acid level,
but a low saturated fatty acid level in human milk (explaining
28.22 % of total variance);
• second profile associated with high monounsaturated and trans fatty
acid levels, but low n-6 / n-3 polyunsaturated fatty acid ratio in
human milk (explaining 20.46 % of total variance);
• third profile associated with a high n-3 polyunsaturated fatty acid
level, but low monounsaturated fatty acid level in human milk
(explaining 13.95 % of total variance);
• fourth profile associated with a high trans fatty acid level, but low
monounsaturated fatty acid level (explaining 9.37 % of total
variance);
• fifth profile associated with high long chain fatty acid –
eicosapentaenoic and docosahexaenoic acid levels in human milk
(explaining 7.86 % of total variance);
• sixth profile associated with low docosahexaenoic acid and medium
chain fatty acid levels (explaining 5.27 % of total variance).
Overall, our obtained data regarding fatty acid level in human milk were
comparable to other data reported from Europe (Antonakou et al., 2013;
Krešić et al., 2013; Luna, Juárez & de la Fuente, 2007; Mojska et al., 2003;
Mosley et al., 2005; Precht & Molkentin, 1999), except we report a higher
vaccenic acid level in human – 1.40 %. In other European countries on average
vaccenic acid level in human milk less than 1 % (Luna,
Juárez & de la Fuente, 2007; Precht & Molkentin, 1999).
Total trans fatty acid level among lactating women in Latvia is one of the
lowest (1.70 %). Lower results reported only from Spain – 0.80 % (Luna,
Juárez & de la Fuente, 2007).
Although median docosahexaenoic acid level in human milk among
lactating women in Latvia responded to target value (0.30 %) (Jackson
Harris & Harris, 2016), it was quite variable among the samples.
The level of arachidonic acid in human milk (0.30 %) was significantly
lower than reported globally (0.55 %) (Fu et al., 2016).
Data regarding essential and potentially toxic element content in human
milk is summarized in the Table 5.
A study from Sweden (Björklund et al., 2012) is one of the latest studies
providing data about essential and potentially toxic elements in human milk from
Europe using a sensitive analytical method ICP-MS which was also used in this
study. A comparison of data can be found in Table 6.
Page 20
20
Overall, our elaborated data for calcium, potassium and magnesium
content in human milk were similar, but data for sodium and zinc were lower
compared to data from Sweden (Björklund et al., 2012).
Table 5 / 5. tabula
Esenciāli un potenciāli toksisko elementu saturs mātes pienā /
Esenciāli un potenciāli toksisko elementu saturs mātes pienā (n=69)* Element, Symbol
(unit) / Elementa
nosaukums, simbols
(mērvienība)
Detection
limit /
Noteikšanas
robeža
Median
(IQR) /
Mediāna
(SKI)
Range /
Diapazons
Essential elements / Esenciālie elementi
Calcium / Kalcijs
Ca (mg 100 ml-1) 0.20 27.40 (9.43) 17.30–59.23
Magnesium / Magnijs
Mg (mg 100 ml-1) 2 3.89 (1.02) 2.52–5.63
Sodium / Nātrijs
Na (mg 100 ml-1) 2 12.67 (6.35) 5.00–42.54
Potassium / Kālijs
K (mg 100 ml-1) 2 60.59 (12.71) 40.99–75.88
Zinc / Cinks
Zn (mg 100 ml-1) 0.01 0.10 (0.11)
BDL /
ZNR–0.34
Selenium / Selēns
Se (µg 100 ml-1) 2 BDL / ZNR BDL / ZNR
Manganese / Mangāns
Mn (µg 100 ml-1) 200 BDL / ZNR BDL / ZNR
Iron / Dzelzs
Fe (μg 100 ml-1) 100 BDL / ZNR BDL / ZNR
Copper / Varš
Cu (µg 100 ml-1) 50 BDL / ZNR
BDL /
ZNR –64.99
Cobalt / Kobalts
Co (µg 100 ml-1) 1 BDL / ZNR BDL / ZNR
Chromium / Hroms
Cr (µg 100 ml-1) 1 BDL / ZNR
BDL /
ZNR –1.44
Page 21
21
Table 5 continued / 5. tabulas turpinājums Element, Symbol
(unit) / Elementa
nosaukums, simbols
(mērvienība)
Detection
limit /
Noteikšanas
robeža
Median
(IQR) /
Mediāna
(SKI)
Range /
Diapazons
Potentially toxic elements / Potenciāli toksiskie elementi
Aluminum / Alumīnijs
Al (µg 100 ml-1) 500 BDL / ZNR BDL / ZNR
Nickel / Niķelis
Ni (µg 100 ml-1) 50 BDL / ZNR BDL / ZNR
Arsenic / Arsēns
As (µg 100 ml-1) 0.5 BDL / ZNR
BDL /
ZNR –0.93
Strontium / Stroncijs
Sr (µg 100 ml-1) 50 BDL / ZNR BDL / ZNR
Cadmium / Kadmijs
Cd (µg 100 ml-1) 0.5 BDL / ZNR BDL / ZNR
Tin / Alva
Sn (µg 100 ml-1) 50 BDL / ZNR BDL / ZNR
Antimony / Antimons
Sb (µg 100 ml-1) 50 BDL / ZNR BDL / ZNR
Lead / Svins
Pb (µg 100 ml-1) 1 BDL / ZNR
BDL /
ZNR –4.84
* the number of the participants from the first study period who were able to
donate human milk for the determination of essential and potentially toxic
element content / pirmā pētījuma posma dalībnieču skaits, kuras ziedoja mātes
pienu esenciālo un potenciāli toksisko elementu satura noteikšanai.
Table 6 / 6. tabula
Comparison of essential element content in human milk /
Esenciālo elementu satura salīdzinājums mātes pienā (mg 100 ml-1)
Elements /
Elementi
This study / Šis pētījums (n=69)
Björklund et al. (2012) Sweden / Zviedrija (n=60)
Median /
Mediāna
Range /
Diapazons
Median /
Mediāna
Range /
Diapazons
Calcium /
Kalcijs 27.40 17.30–59.23 30.70 19.60–41.60
Magnesium /
Magnijs 3.89 2.52–5.63 2.80 2.10–4.30
Sodium /
Nātrijs 12.67 5.00–42.54 19.20 13.60–48.00
Potassium /
Kālijs 60.59 40.99–75.88 63.6 54.90–72.90
Zinc /
Cinks 0.10 <0.01–0.34 0.35 0.12–0.57
Page 22
22
Latest technologies like ICP-MS allow us to ascertain elements even in
small quantities. Nevertheless, possible adjustments are needed for the element
analysis in human milk using ICP-MS, because we faced difficulties to determine
iron, selenium and other essential element values in human milk above the
detection limit. The possible reasons are listed below:
• selection of sample preparation method – Levi et al. (2018) have
explored that sample preparation before ICP-MS analysis could
influence specific element values in human milk samples. Selenium
content is about 15 % higher with the alkali dilution method, but iron
content is about 28 % higher with acid digestion. Acid digestion was
used in this study;
• the purity of analytical reagents, technical parameters etc. factors
can influence the values of detection limit for ICP-MS analysis;
• our elaborated detection limits for the analysed elements were
significantly higher compared to values reported by Björklund et al.
(2012). Although it should be noted that their limit of detection was
based only on five blank samples while ours – on 20 blank samples;
• detection of some isotopes like selenium (78Se), iron (56Fe) etc. can
be affected by spectrometric interferences with other polyatomic
ions, most often argon ions (de la Guardia & Garrigues, 2015).
Argon was used as a carrier gas for ICP-MS analysis in this study.
In the majority of analysed human milk samples, potentially toxic element
content was also below the detection limit. Only two individual human milk
samples contained potentially toxic element content above detection limit – one
sample with an arsenic content of 0.93 µg 100 ml-1 and one sample with a lead
content of 4.84 µg 100 ml-1, respectively. Both determined values did not exceed
the maximal values set in European Commission Regulation 1881/2006 for
infant formulae and foods destined for infants and toddlers (10 µg for arsenic
and 5 µg for lead in 100 mg-1 wet weight, respectively).
2. Dietary habits and nutrient intake among the study participants
Evaluation of food frequency questionnaire
Rye bread was the most consumed food product from the food group
“cereals, cereal products & potatoes” – consumed more than twice a week by
31 % of the participants and every day by 28 % of the participants. Often among
the participants was also consumed bread containing seeds & grains – consumed
at least twice times a week (26 % of the participants) or every day (16 % of the
participants) and wholegrain oats – consumed at least twice times a week (15 %
of the participants) or every day (11 % of the participants). Other types of cereals
– rice, buckwheat, etc. were consumed only rarely.
Page 23
23
Boiled potatoes were mostly consumed once a week by ~ 32 % of the
participants. More than half of the participants (~ 52 %) also on a rare basis
preferred consumption of baked, fried potatoes, or potatoes’ mash.
Overall, participants did not consume various types of starchy food, but
preferred the consumption of specific products like bread and potatoes. Other
starchy food products like buckwheat, quinoa, amaranth, couscous, bulgur was
not popular among the participants.
Red meat was mostly consumed once a week by ~ 22 % of the participants
but white meat – mostly twice a week (29 % of the participants). Processed meat
was mostly avoided (30 % of the participants) or only consumed on a rare basis
(32 % of the participants). Eggs were mostly consumed almost every day by the
study participants (33 %).
The majority of the participants in this study were non-fish eaters (17 %
of the participants) or noted fish consumption only rarely (46 % of the
participants). Once a week fish was included in the diet by ~ 22 % of the
participants, but only 15 % of the participants consumed fish at least two times
a week. Also, seafood was consumed only rarely by 47% of the participants or
avoided completely by ~ 46 % of the participants.
Almost half of the participants consumed milk on daily basis (43 %).
Cheese was the second most frequently consumed dairy product, eaten almost
every day by approximately 34 % of the participants. Fourteen participants from
the first study group and ten participants from the second study group in the food
frequency questionnaire noted that they avoid milk and dairy products. The
reasons for the exclusion of milk & dairy products were following – participant
is a vegetarian (two from the first group, one from the second group) or a vegan
(two participants in each study group), maternal health issues (two participants
from the first study group), the infant has cow’s milk protein allergy
(eight participants from the first study group and seven participants from the
second study group.
More than half of the study participants did not consume pulses or ate
them only rarely.
Only about half of the participants consumed fresh vegetables (52 %) and
fresh fruits (49 %) on daily basis, but fresh berries on daily basis were consumed
only by 13 % of the participants. Cooked vegetables on daily basis were
consumed only by one-third of the participants.
Dominant plant-based fat source among the participants was plant oils –
consumed almost every day or every day by approximately 83 % of the
participants. Olive oil was the most commonly consumed plant oil among the
lactating women in this study – frequently used by 71 % of the participants.
Sunflower oil was the second most commonly preferred plant oil – frequently
used by 25 % of the participants, but canola oil – the third most commonly
preferred plant oil (23 % of the participants) (participants were allowed to note
more than one preferential plant oil in food frequency questionnaire).
Page 24
24
Butter was the most commonly used condiment – consumed almost every
day or every day by half of the participants. Other condiments – ketchup,
mayonnaise, sauces, margarine, and blended fat spreads were mostly avoided by
the participants or consumed rarely.
Chocolate was the most commonly preferred sweet – consumed almost
every day or every day by ~ 32 % of the participants. Cookies were consumed
every day or almost every day by approximately 20 % of the participants. Almost
all participants (~ 90 %) consumed salty snacks and fast food only rarely or
never. Soft drinks were consumed only rarely or not at all.
More than half of the participants (~ 58 %) noted coffee consumption on
daily basis. Also, caffeine-containing teas were consumed on daily basis by
one-third of the participants (~ 30 %). Almost half of the participants from this
study (~ 42 %) noted herbal tea use on daily basis.
Alcohol was completely avoided by approximately 70 % of the study
participants but ~ 22 % of the participants noted the use of alcohol less than once
a week. The rest of the participants drunk alcohol once (6 %), twice a week (1 %)
or more frequently (1 %).
To classify current dietary patterns among the participants, we performed
a principal components analysis based on the data from the food frequency
questionnaire. Principal components analysis revealed five components that had
eigenvalues greater than one and which explained 18.83 %, 17.65 %, 9.65 %,
8.63 %, and 6.67 % of the total variance (61.43 % in total), respectively:
• the first dietary pattern can be characterised as healthy due to high
vegetable, fruit, berry, plant-based fat, pulses consumption, but low
animal-based protein intake;
• the second dietary pattern can be associated as unhealthy due to high
intake of products that contain high amount of carbohydrates
(including sugar), fat, and salt;
• the third dietary pattern can be associated with high milk & dairy
product and sweets & baked goods intake and could potentially be
associated with a higher trans fatty acid intake;
• the fourth dietary pattern is related to different drink intake, but
• the fifth dietary pattern – associated with high fish & seafood and
vegetable intake.
Evaluation of 72-hour food diary
Median energy intake among the participants was lower than
recommended. The median percentage of energy intake from carbohydrates
among the participants was lower, energy intake from fats was higher, but energy
intake from protein – within recommendations (Table 7).
Page 25
25
Table 7 / 7. tabula
Energy and macronutrient intake among the participants / Enerģijas un
makrouzturvielu uzņemšanas daudzums pētījuma dalībniecēm (n=139)*
Nutrients /
Uzturvielas
Median (IQR) /
Mediāna (SKI)
Range /
Diapazons
Guidelines for lactating
women / Vadlīnijas
sievietēm zīdīšanas
periodā
Energy /
Enerģija
2004 kcal /
8385 kJ
(581 kcal /
2431 kJ)
827–3807 kcal /
3460–15928 kJ
2460–3110 kcal /
10293–13012 kJ
(19–30 years / gadi),
2340–2960 kcal /
9791–12385 kJ
(≥31 years / gadi)
(Veselības ministrija,
2017)
Carbohydrates
/ Ogļhidrāti
39.33 E %
(10.19 E %)
11.90–
56.62 E %
45–60 E % (Nordic
Council of Ministers,
2014; Veselības
ministrija, 2017a)
Sugars /
Cukuri
18.74 E %
(7.83 E %) 0.93–41.44 E %
≤10 E % (free sugars /
“brīvie” cukuri)
(Nordic Council of
Ministers, 2014;
Veselības ministrija,
2017a)
Fibre /
Šķiedrvielas
22.18 g
(13.23 g) 7.05–95.93 g
25–35 g (Nordic Nutrition
Recomendations, 2014)
Salt / Sāls 5.57 g
(3.53 g) 1.03–14.00 g
5 g (Veselības ministrija,
2017)
Protein /
Olbaltumvielas
15.41 E %
(5.48 E %) 8.01–43.08 E %
10–20 E % (Nordic
Council of Ministers,
2014; Veselības
ministrija, 2017a)
Fat / Tauki 41.63E %
(10.05 E %)
23.47–
57.34 E %
25–30 E % (Veselības
ministrija, 2017a)
SFA / PT 14.12 E %
(6.18 E %)
4.69–
25.17 E %
≤10 E % (Nordic
Council of Ministers,
2014; Veselības
ministrija, 2017a)
MUFA / MNT 14.78 E %
(5.13 E %) 5.66–27.79 E %
10–20 E % (Nordic
Council of Ministers,
2014)
PUFA / PNT 6.90 E %
(3.81 E %) 2.59–19.01 E %
5–10 E % (Nordic
Council of Ministers,
2014)
Page 26
26
Table 7 continued / 7. tabulas turpinājums
Nutrients /
Uzturvielas
Median
(IQR) /
Mediāna
(SKI)
Range /
Diapazons
Guidelines for lactating
women / Vadlīnijas
sievietēm zīdīšanas
periodā
n-3 PUFA /
n-3 PNT
1.10 E %
(0.98 E %)
0.11–6.49
E %
At least / Vismaz 1 E %
(Nordic Council of
Ministers, 2014)
LA / LS 5.24 E %
(3.12 E %)
1.81–
17.46 E %
≤4 E % (European Food
Safety Authority, 2019a)
ALA / ALS 0.99 E %
(0.71 E %)
0.27–
6.62 E %
At least / Vismaz 0.5 E %
(European Food Safety
Authority, 2019a)
LA + ALA /
LS + ALS
6.44 E %
(3.81 E %)
2.01–
18.77 E %
At least / Vismaz 5 E %
(Nordic Council of
Ministers, 2014)
EPA / EPS 18.82 mg
(96.17 mg)
0.00–
1962.00 mg
No guidelines regarding
daily intake of EPA / Nav
vadlīniju par ieteicamo EPS
dienas devu
DHA / DHS 99.72 mg
(217.97 mg)
0.00–
4260.84 mg
200 mg per day / dienā
(Nordic Council of
Ministers, 2014)
EPA + DHA /
EPS + DHS
131.27 mg
(308.02 mg)
0.00–
6450.29 mg
250 mg EPA + DHA
plus additionally 100 to
200 mg of DHA per day
/ 250 mg EPS + DHS
plus papildus 100 līdz
200 mg DHS dienā
(European Food Safety
Authority, 2019a)
* two out of 141 participants did not submit the 72 hour food diary / divas no 141
pētījuma dalībniecēm neiesniedza uztura dienasgrāmatu.
Overall, a higher total energy intake among study participants was
associated with fruits & berries (ρ=0.182, p=0.039), plant-based fat (ρ=0.199,
p=0.024), sweets & bakery goods (ρ=0.229, p=0.009) intake. Participants who
consumed more frequently milk & dairy products, sweets & bakery goods and
salty snacks & fast food were consuming more fat (ρ=0.199, p=0.024, ρ=0.279,
p=0.001 and ρ=0.191, p=0.030). Median total protein intake among the
participants positively correlated with habitual intake of eggs, meat & processed
meat, fish & seafood, and milk & dairy products (ρ=0.281, p=0.001, ρ=0.279,
p=0.001 and ρ=0.333, p<0.0005). Total carbohydrate intake weakly correlated
with habitual fruit & berry consumption among the participants (ρ=0.258,
p=0.003).
Page 27
27
Sugar intake among the participants was high and provided
approximately one-fifth of the total energy intake (Table 7). Overall, a higher
sugar intake was noted among the study participants with a higher fruit & berries
intake (ρ=0.257, p=0.003).
Median fibre intake (~ 22 g per day) among the participants of this study
was slightly lower than recommended (25 to 35 g per day). Fibre intake among
the participants positively correlated with pulses (ρ=0.278, p=0.001), vegetable
(ρ=0.313, p<0.0005), fruit & berries (ρ=0.317, p<0.0005) and plant-based fat
(food group that includes nuts, seeds, avocado) (ρ=0.436, p<0.0005)
consumption.
Participants consumed more saturated fatty acids than recommended
(Table 7). A higher intake of saturated fatty acids was reported among women
with a higher intake of eggs, meat & meat products (ρ=0.285, p=0.001),
milk & dairy products (ρ=0.438, p<0.0005) and sweets & baked goods (ρ=0.328,
p<0.0005).
Monounsaturated fatty acid intake among the participants was within
guidelines (Table 7). A higher monounsaturated fatty acid intake was noted
among the participants with a higher intake of plant-based fats (ρ=0.214,
p=0.015).
Total polyunsaturated fatty acid and n-3 polyunsaturated fatty acid
intake among the study participants was within guidelines, but combined intake
of linoleic acid + α-linolenic acid was above recommended 5 % of total daily
energy intake (Table 7). Individually, linoleic acid intake among the study
participants was higher than recommended, and α-linolenic acid intake was
above 0.5 % of total daily energy intake (Table 7). A higher total polyunsaturated
fatty acid, n-3 polyunsaturated fatty acid, both linoleic acid and α-linolenic acid
intake among study participants was associated with habitual intake of
plant-based fats (ρ=0.287, p=0.001, ρ=0.242, p=0.006, ρ=0.262, p=0.003, and
ρ=0.303, p=0.001, respectively).
Median eicosapentaenoic acid and docosahexaenoic acid intake
(19 mg and 100 mg per day, respectively) among the participants was
significantly lower than recommended (Table 7). Habitual fish & seafood intake
was associated with a higher intake of eicosapentaenoic acid and
docosahexaenoic acid intake among study participants (ρ=0.236, p=0.007 and
ρ=0.224, p=0.011).
Median trans fatty acid intake among the study participants did not
exceed 1 g per day, and positively correlated with habitual intake of milk & dairy
products (ρ=0.421, p<0.0005) and sweets & baked goods (ρ=0.312, p<0.0005).
The median intake of cholesterol among study participants was around
273 mg per day. High intake of cholesterol can potentially increase the risk of
cardiovascular diseases; therefore, it is recommended to consume less than
300 mg of cholesterol per day (Reiner et al., 2011).
Page 28
28
Participants who were consuming more animal-based products were
accordingly consuming more cholesterol (ρ=0.345, p<0.0005 for eggs, meat &
meat products and ρ=0.395, p<0.0005 for milk & dairy products).
Few participants noted the use of alcohol during the study period – mainly
red wine (n=3), white wine (n=2), or beer (n=2). For four participants the small
amount of alcohol was consumed via dessert – tiramisu. Nevertheless, the total
median alcohol intake among above mentioned participants did not exceed the
upper limit of daily alcohol intake – 10 g per day.
Only for ~ 42 % of the participants median daily calcium intake reached
the recommended 900 mg per day (Figure 3), and a significantly higher calcium
intake was observed among the participants who consumed milk & dairy
products more frequently (ρ=0.520, p<0.0005).
0%
20%
40%
60%
80%
100%
Per
cen
tage
of
the
par
tici
pan
ts /
Pro
cen
tuā
lais
da
līb
nie
ču s
ad
alī
jum
s
Essential elements / Esenciālie elementi
≥100 % of recommended intake / ≥100 % no ieteicamā daudzuma
75 % to 99 % of recommended intake / 75 % līdz 99 % no ieteicamā daudzuma
50 % to 74 % of recommended intake / 50 % līdz 74 % no ieteicamā daudzuma
25 % to49 % of recommended intake / 25 % līdz 49 % no ieteicamā daudzuma
0 % to 24 % of recommended intake / 0 % līdz 24 % no ieteicamā daudzuma
Fig. 3. Median daily essential element intake among the participants in
comparison to dietary guidelines / 3. att. Dienā uzņemtais esenciālo
elementu daudzums pētījuma dalībniecēm, salīdzinot ar uztura
vadlīnijām (n=139)
Page 29
29
A higher intake of phosphorus was noted among the participants with
a higher intake of milk & dairy products (ρ=0.346, p<0.0005) and plant-based
fats (ρ=0.241, p=0.006). Overall, for most participants (~ 89 %) daily intake of
phosphorus reached the recommended daily intake of 900 mg (Figure 3).
Potassium intake among the participants positively correlated with
vegetable, fruit & berries, plant-based fat intake (ρ=0.325, p<0.0005, ρ=0.245,
p=0.005 and ρ=0.388, p<0.0005, respectively). Although, just over half of the
participants in this study (~ 55 %) had a potassium intake of recommended
3100 mg per day (Figure 3).
Unfortunately, sodium (and therefore salt) intake among the majority of
the participants (~ 63 %) was higher than recommended (Table 7), and it was
associated with the habitual intake of eggs, meat & meat products (ρ=0.306,
p<0.0005) and milk & dairy product intake (ρ=0.196, p=0.026).
Approximately 77 % of the participants the median daily intake of
magnesium reached at least 280 mg (Figure 3). Participants with a higher
habitual intake of plant-based products overall had a higher intake of magnesium
(ρ=0.336, p<0.0005 for vegetable, ρ=0.300, p=0.001 for fruit & berries, ρ=0.466,
p<0.0005 for plant-based fat intake).
Only for approximately 39 % of the participants the median daily iron
intake reached at least 15 mg (Figure 3). Interestingly, that a higher iron intake
was among the participants who consumed more of plant-based products, but less
of animal-based food products like meat (ρ=-0.285, p=0.001).
For 58 % participants median daily zinc intake reached the recommended
11 mg per day (Figure 3). A higher zinc intake was noticed among the
participants with a higher plant-based fat (like seeds, nuts, etc.) intake (ρ=0.208,
p=0.019).
Adequate (at least 60 µg per day) selenium intake was reached among
73 % of the participants (Figure 3), and higher selenium intake was noted among
the participants with a higher habitual intake of eggs, meat & processed meat
(ρ=0.174, p=0.050) and milk & dairy products (ρ=0.298, p=0.001).
For most of the participants (56 %), median daily intake of iodine reached
the minimum recommended intake – 150 µg (Figure 3), and overall, a higher
intake of iodine was noted among the participants with a higher intake of
fish & seafood (ρ=0.190, p=0.032) and milk & dairy products (ρ=0.400,
p<0.0005).
Median consumption of vitamin A among the participants was low – only
approximately 27 % of the participants reached the daily adequate intake of
1100 µg per day (Figure 4). A higher intake of vitamin A in this study was noted
among the participants who were consuming more milk & dairy products
(ρ=0.284, p=0.001) and plant-based fats (ρ=0.202, p=0.022).
Page 30
30
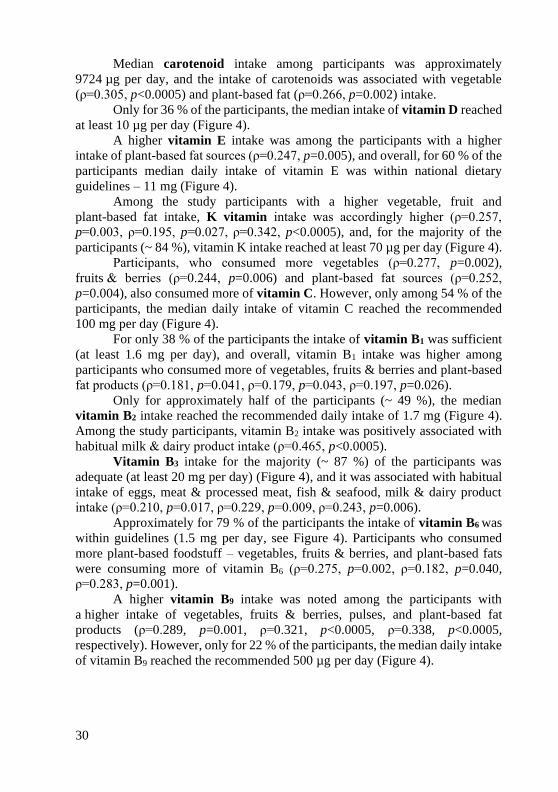
Median carotenoid intake among participants was approximately
9724 µg per day, and the intake of carotenoids was associated with vegetable
(ρ=0.305, p<0.0005) and plant-based fat (ρ=0.266, p=0.002) intake.
Only for 36 % of the participants, the median intake of vitamin D reached
at least 10 µg per day (Figure 4).
A higher vitamin E intake was among the participants with a higher
intake of plant-based fat sources (ρ=0.247, p=0.005), and overall, for 60 % of the
participants median daily intake of vitamin E was within national dietary
guidelines – 11 mg (Figure 4).
Among the study participants with a higher vegetable, fruit and
plant-based fat intake, K vitamin intake was accordingly higher (ρ=0.257,
p=0.003, ρ=0.195, p=0.027, ρ=0.342, p<0.0005), and, for the majority of the
participants (~ 84 %), vitamin K intake reached at least 70 µg per day (Figure 4).
Participants, who consumed more vegetables (ρ=0.277, p=0.002),
fruits & berries (ρ=0.244, p=0.006) and plant-based fat sources (ρ=0.252,
p=0.004), also consumed more of vitamin C. However, only among 54 % of the
participants, the median daily intake of vitamin C reached the recommended
100 mg per day (Figure 4).
For only 38 % of the participants the intake of vitamin B1 was sufficient
(at least 1.6 mg per day), and overall, vitamin B1 intake was higher among
participants who consumed more of vegetables, fruits & berries and plant-based
fat products (ρ=0.181, p=0.041, ρ=0.179, p=0.043, ρ=0.197, p=0.026).
Only for approximately half of the participants (~ 49 %), the median
vitamin B2 intake reached the recommended daily intake of 1.7 mg (Figure 4).
Among the study participants, vitamin B2 intake was positively associated with
habitual milk & dairy product intake (ρ=0.465, p<0.0005).
Vitamin B3 intake for the majority (~ 87 %) of the participants was
adequate (at least 20 mg per day) (Figure 4), and it was associated with habitual
intake of eggs, meat & processed meat, fish & seafood, milk & dairy product
intake (ρ=0.210, p=0.017, ρ=0.229, p=0.009, ρ=0.243, p=0.006).
Approximately for 79 % of the participants the intake of vitamin B6 was
within guidelines (1.5 mg per day, see Figure 4). Participants who consumed
more plant-based foodstuff – vegetables, fruits & berries, and plant-based fats
were consuming more of vitamin B6 (ρ=0.275, p=0.002, ρ=0.182, p=0.040,
ρ=0.283, p=0.001).
A higher vitamin B9 intake was noted among the participants with
a higher intake of vegetables, fruits & berries, pulses, and plant-based fat
products (ρ=0.289, p=0.001, ρ=0.321, p<0.0005, ρ=0.338, p<0.0005,
respectively). However, only for 22 % of the participants, the median daily intake
of vitamin B9 reached the recommended 500 µg per day (Figure 4).
Page 31
31
For 79 % of the participants, the intake of vitamin B12 was within
guidelines (2 µg per day, see Figure 4). Also, the intake of vitamin B12 was higher
among the participants who consumed more animal-based foodstuff (ρ=0.200,
p=0.024 for eggs, meat & meat products, ρ=0.328, p<0.0005 for fish & seafood,
ρ=0.408, p<0.0005 for milk & dairy products).
3. Human milk composition in relation to maternal nutrition
Data statistical analysis did reveal few significant, but weak correlations
between habitual dietary intake of specific food groups and macronutrient
content in human milk.
0%
20%
40%
60%
80%
100%
Per
cen
tage
of
the
par
tici
pan
ts /
Pro
cen
tuā
lais
da
līb
nie
ču s
ad
alī
jum
s
Vitamins / Vitamīni
≥100 % of recommended intake / ≥100 % no ieteicamā daudzuma
75 % to 99 % of recommended intake / 75 % līdz 99 % no ieteicamā daudzuma
50 % to 74 % of recommended intake / 50 % līdz 74 % no ieteicamā daudzuma
25 % to 49 % of recommended intake / 25 % līdz 49 % no ieteicamā daudzuma
0 % to 24 % of recommended intake / 0 % līdz 24 % no ieteicamā daudzuma
Fig. 4. Median daily vitamin intake among the participants in
comparison to dietary guidelines / 4. att. Dienā uzņemtais vitamīnu
daudzums pētījuma dalībniecēm, salīdzinot ar uztura vadlīnijām (n=139)
Page 32
32
For example, lower fat content in human milk was noted among the
participants with a higher intake of fish & seafood (ρ=-0.196, p=0.030), but a
higher protein content in human milk was observed among the participants with
a higher habitual intake of pulses (ρ=0.184, p=0.041), plant-based fats (ρ=0.201,
p=0.025) and salty snacks & fast food (ρ=0.180, p=0.047).
Protein content in human milk positively correlated with median maternal
intake of monounsaturated fatty acids (ρ=0.178, p=0.049), n-3 polyunsaturated
fatty acids (ρ=0.264, p=0.003), α-linolenic acid (ρ=0.335, p<0.0005), iron
(ρ=0.220, p=0.015) but negatively with vitamin B6 (ρ=-0.390, p<0.0005) intake.
Lactose content in human milk positively correlated with
monounsaturated fatty acid (ρ=0.199, p=0.027) and selenium (ρ=0.185, p=0.041)
intake, but negatively with sugar (ρ=-0.198, p=0.029) and vitamin B6 (ρ=-0.650,
p<0.0005) intake.
However, no direct correlation was found between maternal intake of fat,
protein, or lactose and the content of these macronutrients in the human milk
(p>0.05).
Saturated fatty acid level in human milk positively correlated with
habitual eggs, meat & meat products (ρ=0.211, p=0.017), fish & seafood
(ρ=0.217, p=0.014) and milk & dairy product (ρ=0.368, p<0.005), as well as
sweet & bakery good intake (ρ=0.187, p=0.034) and median maternal intake of
saturated fatty acids (ρ=0.278, p=0.002). Although stepwise multiple regression
revealed that only maternal intake three days before sampling had a significant
impact on the saturated fatty acid level in human milk, F(3, 135)=4.223, p=0.007,
and maternal intake of saturated fatty acids explained only 6 %
(adjusted R2=0.065) of the variability of the saturated fatty acid level in human
milk.
Medium-chain fatty acid level in human milk negatively correlated with
the fat intake (ρ=-0.242, p=0.006).
Positive associations were found between palmitic acid level in human
milk and habitual milk & dairy products consumption (ρ=0.509, p<0.0005) and
sweets & baked goods intake (ρ=0.267, p=0.002), as well as median maternal
intake of lactose (ρ=0.478, p<0.0005), saturated fatty acids (ρ=0.410, p<0.0005)
and trans fatty acids (ρ=0.449, p<0.0005). Stepwise multiple regression analysis
also confirmed the significance of maternal intake of saturated fatty acid on the
palmitic acid level in human milk, F(3, 135)=7.075, p<0.0005. However,
maternal intake of saturated fatty acids explained only 12 % of the variability of
the palmitic acid level in human milk (adjusted R2=0.117), and only dietary
intake of saturated fatty acids on the day before sampling had a significant impact
on the palmitic acid level in human milk (p=0.009).
Page 33
33
Both oleic acid and monounsaturated fatty acid level in human milk
positively correlated with maternal intake of monounsaturated fatty acids
(ρ=0.346, p<0.0005 and ρ=0.294, p=0.001, respectively), but negatively with
maternal intake of trans fatty acids (ρ=-0.190, p=0.032 and ρ=-0.193, p=0.029,
respectively). Stepwise multiple regression analysis also confirmed the
significance of maternal intake of monounsaturated fatty acids on total
monounsaturated fatty acid, as well as individually on the oleic acid level in
human milk, F(3, 135)=5.698, p=0.001 and F(3, 135)=7.647, p<0.0005,
respectively. However, maternal intake of monounsaturated fatty acids explained
only 9 % of the variability of the monounsaturated fatty acid level in human milk
(adjusted R2=0.093) and only 13 % of the variability of the oleic acid level in
human milk (adjusted R2=0.126). Both regression analyses revealed that only
dietary intake of monounsaturated fatty acids on the day before sampling had a
significant impact on the oleic acid level and total monounsaturated fatty acid
level in human milk (p=0.043 and p=0.012, respectively).
There was a correlation between median maternal intake of
polyunsaturated fatty acids and polyunsaturated fatty acid level in human milk
(ρ=0.277, p=0.002). Stepwise multiple regression analysis confirmed that
maternal intake of polyunsaturated fatty acids three days and on the day before
sampling significantly affected the polyunsaturated fatty acid level in human
milk, F(3, 135)=9.502, p<0.0005. However, overall, maternal intake of
polyunsaturated fatty acids explained only around 16 % of the variability of the
polyunsaturated fatty acid level in human milk (adjusted R2=0.156) (p<0.0005).
There was a significant positive correlation between maternal intake of
n-6 and n-3 polyunsaturated fatty acids and level of these fatty acids in the
human milk (ρ=0.298, p=0.001 and ρ=0.451, p<0.0005, respectively). Also, the
stepwise regression analysis revealed that n-6 polyunsaturated fatty acids intake
three days before sampling and on the day before sampling showed the greatest
impact on the level of these fatty acids in the milk (F(3, 135)=7.730, p<0.0005),
but the intake of n-3 polyunsaturated fatty acids in all three days before sampling
had a significant impact on n-3 polyunsaturated fatty acids level in human milk
F(3, 135)=14.852, p<0.0005. Intake of n-6 polyunsaturated fatty acids explained
around 15 % of n-6 polyunsaturated fatty acids level in human milk
(adjusted R2=0.147), but n-3 polyunsaturated fatty acids intake – approximately
28 % of the n-3 polyunsaturated fatty acid level in human milk
(adjusted R2=0.283).
There was a moderate positive correlation between median maternal
intake of linoleic acid and linoleic acid level in human milk (ρ=0.302, p=0.001).
Stepwise multiple regression analysis confirmed that maternal intake of linoleic
acid three days before sampling and on the day before the sampling influenced
the linoleic acid level in human milk, F(3, 135)=8.273, p<0.0005, and maternal
intake of linoleic acid explained around 14 % of the variability of the linoleic
acid level in human milk (adjusted R2=0.137).
Page 34
34
Sunflower oil as the main plant oil source in the diet was related to
a higher level of linoleic acid, n-6 polyunsaturated acids and total
polyunsaturated fatty acids in human milk. On the opposite, a lower level of
monounsaturated fatty acid, docosahexaenoic acid, n-3 polyunsaturated fatty
acids in human milk samples was found among the participants with the
preference for the consumption of sunflower oil (Table 8).
Table 8 / 8. tabula
The fatty acid level (% of total fatty acid level) in human milk depending
on the preferential plant oil source in the maternal diet / Taukskābju saturs
(% no kopējā taukskābju satura) mātes pienā atkarībā no lietotā augu eļļas
avota uzturā (n=138)*
Fatty acid level in human milk
/ Taukskābju saturs mātes
pienā
Sunflower oil as the
preferential plant oil? /
Saulespuķu eļļa kā preferenciālā
augu eļļa?
p-value / p-
vērtība
No / Nē Yes / Jā
MUFA / MNT 40.10 38.15 p=0.050
LA / LS 11.90 15.00 p=0.001
n-6 PUFA / n-6 PNT 13.20 16.45 p=0.001
n-3 PUFA / n-3 PNT 2.10 1.80 p=0.023
PUFA, total / PNT, kopā 14.05 15.90 p=0.006
Ratio between LA and ALA /
Attiecība starp LS un ALS 8.74 11.09 p=0.001
Ratio between n-6 and
n-3 PUFA / Attiecība starp
n-6 un n-3 PNT
6.49 9.03 p<0.0005
DHA / DHS 0.40 0.30 p=0.001
Median maternal intake of α-linolenic acid was related to α-linolenic
acid level in human milk (ρ=0.450, p<0.0005). Stepwise multiple regression
analysis also confirmed that both maternal intake of α-linolenic acid three days
before sampling and on the day before sampling significantly influenced
α-linolenic acid level in human milk, F(3, 135)=20.230, p<0.0005. Overall,
maternal intake of α-linolenic acid explained 30 % of the variability of the
α-linolenic acid level in human milk (adjusted R2=0.295).
Arachidonic acid level in human milk negatively correlated with habitual
intake of cereals, cereal products & potatoes (ρ=-0.254, p=0.004) and habitual
intake of legumes (ρ=-0.248, p=0.005).
Page 35
35
A habitual fish &seafood intake positively correlated with
docosahexaenoic acid level in human milk (ρ=0.287, p=0.001). Participants
who consumed fish at least twice a week had a significantly higher
docosahexaenoic acid level in human milk (0.50 %) compared to non-fish eaters
(0.30 %) (p=0.001).
There was also a significant strong positive association between dietary
eicosapentaenoic acid and docosahexaenoic acid intake, and docosahexaenoic
acid level in human milk (ρ=0.534, p<0.0005 and ρ=0.570, p<0.0005,
respectively). Stepwise multiple regression analysis also confirmed that maternal
intake of docosahexaenoic acid all three days before sampling significantly
influenced docosahexaenoic acid level in human milk, F(3, 134)=13.347,
p<0.0005. Overall, maternal intake of docosahexaenoic acid explained 26 % of
the variability of the docosahexaenoic acid level in human milk (adjusted
R2=0.259).
No direct association was found between maternal intake of trans fatty
acids and trans fatty acid level in human milk (ρ=0.167, p=0.056), but overall,
a higher trans fatty acid level in human milk was observed among the participants
with a higher intake of animal-based food products (ρ=0.283, p=0.001 for eggs,
meat & meat products, ρ=0.193, p=0.029 for fish & seafood and ρ=0.257,
p=0.003 for milk & dairy products). Elaidic acid as well as linolelaidic acid
level in human milk correlated with maternal intake of milk & dairy products
(ρ=0.607, p<0.0005 and ρ=0.436, p<0.0005). Overall, elaborated results indicate
that milk & dairy products are the dominant source of trans fatty acids found in
human milk among lactating women in Latvia.
Calcium content in human milk was higher for the participants who
reported a higher habitual intake of eggs, meat & meat products (ρ=0.404,
p=0.002), but no direct association was found between maternal intake of
calcium and calcium content in human milk (ρ=-0.063, p=0.642).
There was also no direct association between maternal intake of
magnesium and magnesium content in human milk (ρ=-0.160, p=0.235). Only
a weak significant association was found between magnesium content in human
milk and habitual intake of fish & seafood (ρ=0.298, p=0.024).
Sodium was the only element which content in human milk was directly
influenced by the maternal intake of sodium and salt. However, only a weak
association was found between maternal intake of sodium & salt, and sodium
content in human milk (ρ=0.263, p=0.048 and ρ=0.265, p=0.046, respectively).
However, a stepwise multiple regression disclosed that sodium content in human
milk is not directly influenced by maternal sodium intake, F(3,61)=1.332,
p=0.272. Other factors, like infant age, lactose, protein, calcium, magnesium, and
potassium content in human milk potentially affects sodium content in human
milk.
Page 36
36
Potassium is a dominant osmotic element found in the cells but sodium –
the dominant osmotic element found outside the cells. This could potentially
explain why a lower content of potassium in human milk was found among the
participants who reported a higher salty snack & fast food (ρ=-0.316, p=0.017)
consumption, because these products contain a high amount of sodium.
Nevertheless, no direct association was found between maternal intake of
potassium and potassium content in human milk (ρ=-0.067, p=0.622).
Zinc content in human milk was positively affected by the maternal intake
of polyunsaturated fatty acids (ρ=0.277, p=0.037), n-6 polyunsaturated fatty
acids (ρ=0.305, p=0.021) and linoleic acid (ρ=0.311, p=0.018), but a negative
association was found for fish & seafood intake (ρ=-0.265, p=0.046). No direct
association was found between maternal intake of zinc and zinc content in human
milk (ρ=0.001, p=0.996).
Although few significant associations were found between essential
element content in human milk and maternal diet, overall, we conclude that
essential element content in human milk is unlikely to be influenced by a direct
maternal intake of essential elements.
Other essential element (iron, selenium, manganese, copper, cobalt,
chromium), as well as potentially toxic element content (aluminium, nickel,
arsenic, strontium, cadmium, tin, antimony, lead) in human milk was below the
detection limit, therefore further evaluation regarding maternal diet impact on the
essential and potentially toxic element content in human milk was not possible.
4. Supply of energy and nutrients for exclusively breastfed infants via
human milk
To theoretically evaluate if exclusively breastfed infants (1 to 6 months
old) from this study received a sufficient amount of energy and nutrients via
human milk, obtained median energy or nutrient values in 100 ml of human milk
were multiplied by the mean daily intake of human milk consumed by the infant
depending on age in the developed countries (data from Butte, Lopez
Alarcon & Garza, 2002). Then elaborated values were compared with the levels
that are considered to be adequate for the majority of infants (Table 9).
Page 37
37
Table 9 / 9. tabula
Daily intake of energy and macronutrients via human milk for exclusively
breastfed infants (1 to <6 months) / Dienā ar mātes pienu uzņemtais
enerģijas un makrouzturvielu daudzums ekskluzīvi zīdītiem 1 līdz 6 mēnešus
veciem zīdaiņiem (n=83)* N
utr
ien
ts (
un
it)
/
Uzt
urv
iela
s (m
ērvi
enīb
a)
Nutrient supply via
human milk
according to
elaborated data /
Uzturvielu
nodrošinājum ar
mātes pienu,
balstoties uz pētījuma
datiem
Level of intake that is
considered adequate
for the majority of
infants / Daudzums, ko
uzskata par adekvātu
lielākajai daļai zīdaiņu
(European Food Safety
Authority, 2013)
Recommen-
ded intake /
Ieteicamais
daudzums
(Veselības
ministrija,
2017a) Median
(IQR) /
Mediāna
(SKI)
Range /
Diapa-
zons
Energy /
Enerģija
(kcal)
519.25
(102.14)
366.67–
708.30
335–358
(1 to <2 months /
1 līdz <2 mēneši)
520
(girls /
meitenes)
590
(boys / zēni)
510.74
(103.78)
384.39–
672.17
454–502
(2 to <3 months /
2 līdz <3 mēneši)
506.55
(120.31)
328.61–
717.81
478–523
(3 to <4 months /
3 līdz <4 mēneši)
538.62
(98.91)
312.44–
697.63
502–550
(4 to <5 months /
4 līdz <5 mēneši)
524.56
(98.20)
411.13–
644.95
550–573
(5 to <6 months /
5 līdz <6 mēneši)
Page 38
38
Table 9 continued / 9. tabulas turpinājums
Nu
trie
nts
(u
nit
) /
Uzt
urv
iela
s (m
ērvi
enīb
a)
Nutrient supply
via human milk
according to
elaborated data /
Uzturvielu
nodrošinājum ar
mātes pienu,
balstoties uz
pētījuma datiem
Level of intake that
is considered
adequate for the
majority of infants /
Daudzums, ko
uzskata par
adekvātu lielākajai
daļai zīdaiņu
(European Food
Safety Authority,
2013)
Recommen-
ded intake /
Ieteicamais
daudzums
(Veselības
ministrija,
2017a) Median
(IQR) /
Mediāna
(SKI)
Range /
Diapa-
zons
Carbohy-
drates /
Ogļhidrāti
(E %)
39.96
(9.66)
22.88–
69.04 40–45 ND / ND
Protein /
Olbaltum-
vielas (g)
8.79
(1.23)
6.53–
13.37 7–9 ND / ND
Fat / Tauki
(E%)
53.34
(11.04)
22.47–
68.84 50–55 ND / ND
LA / LS
(E%)
13.30
(6.20)
6.30–
35.30 4 ND / ND
ALA / ALS
(E%)
0.75
(0.47)
0.20–
4.19 0.50 ND / ND
ARA / ARS
(mg)
91.43
(79.03)
17.54–
941.41 140 ND / ND
DHA / DHS
(mg)
109.43
(87.88)
36.27–
960.96 100 ND / ND
* count of the participants who were exclusively breastfeeding their
1 to 6 months old infants and were able to donate milk both for fat, protein,
lactose analysis, and fatty acid composition analysis / pētījuma dalībnieču skaits,
kuras ekskluzīvi zīdīja 1 līdz 6 mēnešus vecu zīdaini un ziedoja mātes pienu
tauku, olbaltumvielu, laktozes un taukskābju sastāva analīzēm.
Based on theoretical calculation, the energy intake among 1–2 months old
exclusively breastfed infants was higher than the level considered to be adequate.
The energy intake among 3–4 months old exclusively breastfed infants was
adequate, but energy intake among 5 to <6 months old exclusively breastfed
infants was lower than the level considered to be adequate (Table 9).
Median daily intake of protein, fat, and carbohydrates (in this case,
lactose) via human milk for exclusively breastfed infants till six months of age
was adequate according to European Food Safety Authority guidelines (2013)
(Table 9).
Page 39
39
Median energy intake of linoleic acid via human milk for exclusively
breastfed infants (1 to <6 months) in this study was significantly higher,
the median daily intake of α-linolenic acid and docosahexaenoic acid slightly
higher than the adequate daily intake, but median daily intake of arachidonic
acid via human milk was lower than adequate daily intake, according to
the European Food Safety Authority guidelines (Table 9).
However, a large variance in daily fatty acids intake for infants via human
milk was observed since fatty acid levels in human milk were affected by
maternal dietary intake which was also quite variable among the participating
women.
According to theoretically calculated data, exclusively breastfed infants
till six months of age received a sufficient amount of calcium, potassium, and
magnesium (Fig. 5, 6. and 7).
Although median sodium and salt intake among the participants was
higher than recommended, but zinc intake within guidelines, the daily intake of
sodium and zinc for exclusively breastfed infants via human milk, according to
calculated data, was lower than adequate, based on European Food Safety
Authority scientific opinion (Fig. 8 and 9).
0
50
100
150
200
250
300
1–<2 2–<3 3–<4 4–<5 5–<6
mg p
er d
ay /
mg
die
nā
Infant's age, months / Zīdaiņa vecums, mēneši
Supply of calcium via
human milk according to
our obtained data, mg per
day
Level of calcium intake
that is considered adequate
for the majority of the
infant, mg per day (EFSA,
2013)
Supply of calcium via
human milk according to our
obtained data, mg per day /
Kalcija nodrošinājums ar
mātes pienu pēc pētījumā
iegūtajiem datiem, mg dienā
Level of calcium intake that
is considered adequate for
the majority of the infants,
mg per day / Kalcija
daudzums, kas uzskatāms
par adekvātu lielākajai daļai
zīdaiņu, mg dienā
(European Food Safety
Authority, 2013)
Fig. 5. Supply of calcium via human milk for exclusively breastfed infants /
5. att. Kalcija nodrošinājums ar mātes pienu ekskluzīvi zīdītiem zīdaiņiem
(n=38)
Page 40
40
0
100
200
300
400
500
600
1–<2 2–<3 3–<4 4–<5 5–<6
mg p
er d
ay /
mg
die
nā
Infant's age, months / Zīdaiņa vecums, mēneši
Supply of potassium via
human milk according to
our obtained data, mg per
day
Level of potassium intake
that is considered adequate
for the majority of the
infant, mg per day (EFSA,
2013)
Level of potassium intake
that is considered
adequate for the majority
of the infants, mg per day
/ Kālija daudzums, kas
uzskatāms par adekvātu
lielākajai daļai zīdaiņu,
mg dienā (European
Food Safety Authority,
2013)
Supply of potassium via
human milk according to
our obtained data, mg per
day / Kālija nodrošinājums
ar mātes pienu pēc
pētījumā iegūtajiem
datiem, mg dienā
6. att. Kālija nodrošinājums ar mātes pienu ekskluzīvi zīdītiem zīdaiņiem /
Fig. 6. Supply of potassium via human milk for exclusively breastfed infants
(n=38)
0
5
10
15
20
25
30
35
40
1–<2 2–<3 3–<4 4–<5 5–<6
mg p
er d
ay /
mg
die
nā
Infant's age, months / Zīdaiņa vecums, mēneši
Supply of magnesium via
human milk according to
our obtained data, mg per
day
Level of magnesium
intake that is considered
adequate for the majority
of the infant, mg per day
(EFSA, 2013)
Supply of magnesium via
human milk according to
our obtained data, mg per
day / Magnija
nodrošinājums ar mātes
pienu pēc pētījumā
iegūtajiem datiem, mg
dienā
Level of magnesium
intake that is considered
adequate for the majority
of the infants, mg per day
/ Magnija daudzums, kas
uzskatāms par adekvātu
lielākajai daļai zīdaiņu,
mg dienā (European
Food Safety Authority,
2013)
Fig. 7. Supply of magnesium via human milk for exclusively breastfed
infants / 7. att. Magnija nodrošinājums ar mātes pienu ekskluzīvi zīdītiem
zīdaiņiem (n=38)
Page 41
41
0.0
0.5
1.0
1.5
2.0
2.5
1–<2 2–<3 3–<4 4–<5 5–<6
mg p
er d
ay /
mg
die
nā
Infant's age, months/ Zīdaiņa vecums, mēneši
Supply of zinc via human
milk according to our
obtained data, mg per
day
Level of zinc intake that
is considered adequate
for the majority of the
infant, mg per day
(EFSA, 2013)
Supply of zinc via
human milk according
to our obtained data, mg
per day / Cinka
nodrošinājums ar mātes
pienu pēc pētījumā
iegūtajiem datiem, mg
dienā
Level of zinc intake that
is considered adequate
for the majority of the
infants, mg per day / Cinka daudzums, kas
uzskatāms par adekvātu
lielākajai daļai zīdaiņu,
mg dienā (European
Food Safety Authority,
2013)
Fig. 9. Supply of zinc via human milk for exclusively breastfed infants /
9. att. Cinka nodrošinājums ar mātes pienu ekskluzīvi zīdītiem zīdaiņiem
(n=38)
0
20
40
60
80
100
120
140
160
180
1–<2 2–<3 3–<4 4–<5 5–<6
mg p
er d
ay /
mg
die
nā
Infant's age, months/ Zīdaiņa vecums, mēneši
Supply of sodium via
human milk according to
our obtained data, mg per
day
Level of sodium intake
that is considered
adequate for the majority
of the infant, mg per day
(EFSA, 2013)
Supply of sodium via
human milk according to
our obtained data, mg per
day / Nātrija
nodrošinājums ar mātes
pienu pēc pētījumā
iegūtajiem datiem, mg
dienā
Level of sodium intake
that is considered
adequate for the majority
of the infants, mg per day
/ Nātrija daudzums, kas
uzskatāms par adekvātu
lielākajai daļai zīdaiņu,
mg dienā (European
Food Safety Authority,
2013)
Fig. 8. Supply of sodium via human milk for exclusively breastfed infants /
8. att. Nātrija nodrošinājums ar mātes pienu ekskluzīvi zīdītiem zīdaiņiem
(n=38)
Page 42
42
However, it should be taken into account that an adequate level of some
essential elements for the infant could be met both by human milk and
endogenous stores (for example, iron stored during gestation period in the liver)
(Butte, Lopez-Alarcon & Garza, 2002; European Food Safety Authority, 2013).
Therefore, future research should aim for the assessment of essential element
content not only in human milk, but also in plasma or serum for both mothers
and infants.
CONCLUSIONS
1) For the first time in Latvia fatty acid composition of human milk has
been comprehensively studied providing an insight of differences
related to the geographical location and dietary patterns of the
lactating women.
2) Three dominating fatty acids in human milk were palmitic acid, oleic
acid, and linoleic acid, in total compiling ~ 71 % of the total fatty
acid level in human milk.
3) Although median docosahexaenoic acid level in human milk
corresponded to the recommended target value – 0.30 %, a large
variance in values was observed (from 0.10 % to 4.30 % of a total
fatty acid level).
4) Compared to other countries, a low total trans fatty acid level
(<2.0 %) in human milk was observed.
5) Elaborated values for fat, protein, lactose, calcium, potassium and
magnesium content in human milk were similar to data found in
literature, but zinc and sodium content in human milk was lower
comparing to data from other countries.
6) Human milk contained only trace amounts of arsenic, cadmium, tin,
and lead which did not exceed the maximum levels of potentially
toxic elements defined in legislation for in the infant formulas and
foodstuff destined for infants and toddlers.
7) Participants consumed more fat, saturated fatty acids, and salt than
recommended, but dietary intake of carbohydrates, fibre,
eicosapentaenoic acid, and docosahexaenoic acid, calcium, iron, and
vitamins A, D, B1, B2, B9 was insufficient.
8) Low intake for the majority of essential nutrients (carbohydrates,
fibre, eicosapentaenoic acid, and docosahexaenoic acid, calcium,
iron, and vitamins A, D, B1, B2, B9) among the participants was due
to insufficient intake of nutritious foods like vegetables, fruits,
berries, pulses, cereals, milk & dairy products, and fish.
Page 43
43
9) Immediate maternal intake affects the fatty acid (C≥16) composition
of human milk. Also, the habitual intake of specific food products
(like fish, plant oils, etc.) affects the fatty acid composition of human
milk and therefore impacts the fatty acid intake for the infant.
10) On the opposite, macronutrient (fat, protein, lactose), as well as
essential element content in human milk is insensitive to immediate
maternal diet.
11) Based on calculations, 1 to 6 months old exclusively breastfed
infants received adequate energy, fat, protein, carbohydrate,
α-linolenic, docosahexaenoic acid, calcium, magnesium, and
potassium intake via human milk, but the intake of arachidonic acid,
sodium and zinc was lower than recommended.
12) The hypothesis of the research was approved – maternal nutrition
predicts human milk composition and serves as the basis for
providing the essential nutrients for the infant.
Page 44
44
PĒTĪJUMA AKTUALITĀTE
Mātes piens ir pirmais vispiemērotākais uzturvielu avots zīdainim
(Pasaules Veselības Organizācija, 2018). Mātes pienā esošās uzturvielas tiek
sintezētas piena dziedzeros vai transportētas uz laktocītiem no asinsrites.
Tādējādi uzturvielu avoti mātes pienā ir sievietes uzturs zīdīšanas periodā vai
uzturvielu rezerves organismā (Andreas, Kampmann, & Le-Doare, 2015;
Hale & Hartmann, 2017). Sievietes uztura kvalitātei zīdīšanas periodā ir būtiska
nozīme, jo tā var ietekmēt piena sastāvu un nepieciešamo uzturvielu
nodrošinājumu zīdainim (Hale & Hartmann, 2017;
Lawrence & Lawrence, 2015).
Mātes piena sastāvs Latvijā līdz šim nav plaši pētīts (Bake et al., 2007;
Broka et al., 2016). Ir dati par noturīgo organisko piesārņojuma saturu mātes
pienā (Bake et al., 2007). Šī pētījuma mērķa grupa bija mātes, dzīvojošas Olainē,
un kontroles grupa – dalībnieces dzīvojošas teritorijās, kurās nav intensīvas
ķīmiskās rūpniecības. Nevienā no grupām noturīgā organiskā piesārņojums
saturs mātes piena paraugos nepārsniedza pieļaujamās normas
(Bake et al., 2007).
Pētījums, ko veikusi Broka et al. (2016), ir jaunākais par makrouzturvielu
(tauku, olbaltumvielu, laktozes) saturu mātes pienā Latvijā. Šajā pētījumā
analizēti pārejas posma piena paraugi (pagājis mazāk nekā mēnesis pēc
dzemdībām, laktācija vēl nav nostabilizējusies), un dalībnieces bija mātes, kas
pētījuma norises laikā ar bērnu atradās Bērnu klīniskās universitātes slimnīcas
Neonataloģijas nodaļā, tādēļ iegūtos rezultātus nav iespējams vispārināt uz visu
populāciju.
Lai gan taukskābju sastāvs mātes pienā pasaulē ir plaši pētīts
(Bravi et al., 2016; Keikha et al., 2017), apliecinot taukskābju sastāva mainību
mātes pienā ģeogrāfisko un uztura tradīciju dēļ (Andreas,
Kampmann & Le-Doare, 2015; Hale & Hartmann, 2017; Mohrbacher, 2010),
Latvijā nav noteikts un analizēts taukskābju sastāvs mātes pienā. Trūkst arī datu
par esenciālo un potenciāli toksisko elementu saturu mātes pienā Latvijā, nav
izvērtēti arī uztura paradumi sievietēm zīdīšanas periodā Latvijā.
Tas norāda uz nepieciešamību veikt pētījumu šajā jomā, jo iegūtie dati
sniegtu informāciju par nacionālajām atšķirībām, ļautu izvērtēt uzturvielu
nodrošinājumu sievietēm Latvijā un uztura ietekmi uz mātes piena sastāvu un
attiecīgi uzturvielu nodrošinājumu zīdaiņiem.
Promocijas darba hipotēze: mātes uzturs zīdīšanas periodā var ietekmēt
piena sastāvu un nepieciešamo uzturvielu nodrošinājumu zīdainim.
Page 45
45
Promocijas darba hipotēzi pierāda ar aizstāvāmām tēzēm:
• sieviete zīdīšanas periodā ar sabalansētu, daudzveidīgu uzturu var
uzņemt nepieciešamo uzturvielu daudzumu, kas būs pamats
atsevišķu uzturvielu nodrošinājumam zīdainim ar mātes pienu;
• kopējais tauku, olbaltumvielu, laktozes saturs mātes pienā nav tieši
atkarīgs no uztura;
• taukskābju sastāvu un saturu mātes pienā ietekmē sievietes uztura
paradumi zīdīšanas periodā;
• esenciālo un potenciāli toksisko elementu saturs mātes pienā ir
atkarīgs no sievietes uztura zīdīšanas periodā;
• ekskluzīvi zīdīti zīdaiņi līdz sešu mēnešu vecumam ar mātes pienu
var uzņemt nepieciešamo enerģijas un uzturvielu (tauku,
olbaltumvielu, laktozes, taukskābju un esenciālo elementu)
daudzumu.
Pētījuma objekts ir nobriedis mātes piens (pagājušas vismaz 28 dienas
pēc dzemdībām).
Promocijas darba mērķis: analizēt mātes piena sastāvu saistībā ar uzturu
un izvērtēt uzturvielu nodrošinājumu ekskluzīvi zīdītiem zīdaiņiem.
Pētījuma uzdevumi, lai sasniegtu promocijas darba mērķi, ir:
1) analizēt nobrieduša mātes piena sastāvu, nosakot olbaltumvielu,
laktozes, tauku, taukskābju, esenciālo (Ca, Mg, Na, K, Zn, Se, Mn,
Fe, Cu, Co, Cr) un potenciāli toksisko elementu (Al, Ni, As, Sr, Cd,
Sn, Sb, Pb) saturu;
2) izvērtēt sievietes uzturu zīdīšanas periodā atbilstoši vadlīnijām
nacionālajā un Eiropas līmenī;
3) novērtēt uztura ietekmi uz mātes piena sastāvu;
4) teorētiski novērtēt pētījuma ietvaros analizēto uzturvielu
nodrošinājumu ar mātes pienu ekskluzīvi zīdītiem zīdaiņiem.
Pētījuma zinātniskais nozīmīgums:
1) pirmo reizi Latvijā visaptveroši pētīts nobrieduša mātes piena
sastāvs;
2) pētījumā iegūtie dati būs Latvijas ieguldījums mātes piena sastāva
izpētē pasaulē.
Pētījuma tautsaimnieciskā nozīme:
1) pētījuma rezultāti var kalpot par pamatu veselīga uztura vadlīniju
izstrādei sievietēm zīdīšanas periodā Latvijā;
2) iegūtie pētījuma rezultāti var tikt izmantoti, lai izstrādātu ieteicamās
uzturvielu normas zīdaiņiem Latvijā (≤6 mēnešu vecumam).
Page 46
46
ZINĀTNISKĀ DARBA APROBĀCIJA
Pētījuma rezultāti publicēti 8 recenzētos zinātniskajos izdevumos, no
kuriem 7 ir indeksēti SCOPUS un/vai Web of Science datubāzēs:
1) Aumeistere L., Zavadska D. (2016) Raising awareness about breast
milk composition among women in Latvia. Journal of Breastfeeding
Biology, Vol. 1, No. 1, p. 21–28. https://doi.org/10.14302/issn.2644-
0105.jbfb-16-1257;
2) Aumeistere L., Ciprovica I., Zavadska D., Celmalniece K. (2017)
Lactose content of breast milk among lactating women in Latvia.
FOODBALT 2017 – 11th Baltic Conference on Food Science and
Technology: Food Science and Technology in a Changing World.
International Scientific Conference Proceedings, p. 169–173.
https://doi.org/10.22616/foodbalt.2017.023 (indeksēts Web of
Science datubāzē);
3) Aumeistere L., Ciprovica I., Zavadska D., Bavrins K. (2017)
A preliminary study on essential minerals in human milk:
association with dietary habits. 23rd Annual International Scientific
Conference “Research for Rural Development 2017”. International
Scientific Conference Proceedings, Vol 1. 2017, p. 230–236.
https://doi.org/10.22616/rrd.23.2017.034 (indeksēts SCOPUS un
Web of Science datubāzēs);
4) Aumeistere L., Ciproviča I., Zavadska D., Volkovs V. (2018)
Fish intake reflects on DHA level in breast milk among lactating
women in Latvia. International Breastfeeding Journal, Vol. 13,
Article No. 33. https://doi.org/10.1186/s13006-018-0175-8
(indeksēts SCOPUS un Web of Science datubāzēs);
5) Aumeistere L., Ciproviča I., Zavadska D., Bavrins K., Borisova A.
(2018) Zinc content in breast milk and its association with maternal
diet. Nutrients, Vol. 10, Issue 10, Article No. 1438.
https://doi.org/10.3390/nu10101438 (indeksēts SCOPUS un Web of
Science datubāzēs);
6) Aumeistere L., Ciprovica I., Zavadska D., Bavrins K., Borisova A.
(2019) Essential elements in mature human milk. FOODBALT 2019.
13th Baltic Conference on Food Science and Technology. FOOD.
NUTRITION. WELL-BEING. Conference Proceedings, p. 25–29.
https://doi.org/10.22616/Foodbalt.2019.005 (indeksēts Web of
Science datubāzē);
Page 47
47
7) Aumeistere L., Ciprovica I., Zavadska D., Andersons J.,
Volkovs V., Ceļmalniece K. (2019) Impact of maternal diet on
human milk composition among lactating women in Latvia.
Medicina, Vol. 55, Issue 5, Article No. 173.
https://doi.org/10.3390/medicina55050173 (indeksēts SCOPUS un
Web of Science datubāzēs);
8) Aumeistere L., Ciprovica I., Zavadska D., Bavrins K., Borisova A.
(2020) The relation between human milk sodium and maternal
sodium intake. Proceedings of the Latvian Academy of Sciences.
Section B: Natural, Exact, and Applied Sciences, Vol. 74, Issue 4,
p. 232–236. https://doi.org/10.2478/prolas-2020-0037 (indeksēts
SCOPUS un Web of Science datubāzēs).
Par zinātniskā darba rezultātiem ziņots 11 starptautiskajās zinātniskajās
konferencēs & kongresos Latvijā, Spānijā, Itālijā, Nīderlandē un Somijā:
1) Aumeistere L., Ciproviča I., Zavadska D., Bavrins K. (2017) Trace
elements in human milk among lactating women in Latvia.
International Student Conference “Health and Social Sciences”,
5. aprīlis, 2017. gads, Rīga, Latvija (stenda referāts);
2) Aumeistere L., Ciproviča I., Zavadska D., Ceļmalniece K. (2017)
Lactose content of breast milk among lactating women in Latvia.
11th Baltic Conference on Food Science and Technology Foodbalt
2017, 27. līdz 28. aprīlis, 2017. gads, Jelgava, Latvija (mutiskais
ziņojums);
3) Aumeistere L., Ciproviča I., Zavadska D., Bavrins K. (2017)
A preliminary study on essential minerals in human milk:
association with dietary habits. 23rd Annual International Scientific
Conference Research for Rural Development 2017,
17. līdz 19. maijs, 2017. gads, Jelgava, Latvija (mutiskais
ziņojums);
4) Aumeistere L., Ciproviča I., Zavadska D., Andersons J.,
Jakubone E. (2017) Fat content of human milk: a pilot study from
Latvia. 11th European Nutrition and Dietetics Conference, 29. jūnijs
līdz 1. jūlijs, 2017. gads, Madride, Spānija (e-posteris);
5) Aumeistere L., Ciproviča I., Zavadska D., Bavrins K., Borisova A.
(2018) Zinc content in breast milk: a report from Latvia.
2nd EuroSciCon Conference on Food Technology, 14. līdz 16. maijs,
2018. gads, Roma, Itālija (mutiskais ziņojums);
Page 48
48
6) Aumeistere L., Ciproviča I., Zavadska D., Volkovs V. (2018) Trans
fatty acid content in mature breast milk among lactating women in
Latvia. 1th European Food Chemistry & Nutrition Congress, 26. līdz
27. jūlijs, 2018. gads, Amsterdama, Nīderlande (mutiskais
ziņojums);
7) Aumeistere L., Ciproviča I., Zavadska D., Bavrins K., Borisova A.
(2019) Maternal sodium intake reflects on sodium content in mature
human milk. 6th International Conference on Nutrition & Growth,
7. līdz 9. marts, 2019. gads, Valensija, Spānija (stenda referāts);
8) Aumeistere L., Ciproviča I., Zavadska D., Bavrins K., Borisova A.
(2019) Essential elements analysis in mature human milk. 13th Baltic
Conference on Food Science FoodBalt 2019 & 5th North and East
European Congress on Food NEEFood 2019, 2. līdz 3. maijs,
2019. gads, Jelgava, Latvija (mutiskais ziņojums);
9) Beluško A., Aumeistere L., Ciproviča I., Zavadska D. (2020)
Conjugated linoleic acid in human milk: a case study from Latvia.
3rd International Conference Nutrition and Health, 9. līdz
11. decembris, 2020. gads, Rīga, Latvija (e-postera prezentācija);
10) Aumeistere L., Ciproviča I., Zavadska D., Volkovs V. (2020)
Dietary vegetable oil impact on fatty acid composition in human
milk. 12th Nordic Nutrition Conference, 13. līdz 16. decembris,
2020. gads, Helsinki, Somija (e-postera prezentācija);
11) Beluško A., Aumeistere L., Ciproviča I., Zavadska D. (2021)
Omega-3 taukskābju sastāvs mātes pienā. 16th International
Scientific Conference “Students on their Way to Science”,
23. aprīlis, 2021. gads, Jelgava, Latvija (mutiskais ziņojums
tiešsaistē).
Promocijas darba izstrāde līdzfinansēta:
• Programma “Zinātniskās kapacitātes stiprināšana Latvijas
Lauksaimniecības universitātē”. Projekts “Mātes piena sastāva
izpēte”. Projekta Nr. Z2. Līguma Nr. 3.2.-10/44. Projekta statuss –
noslēgts (projekta laiks no 2017. gada 1. janvāra līdz 2018. gada
31. decembrim);
• Programma “Fundamentālo pētījumu veikšana Latvijas
Lauksaimniecības universitātē”. Projekts “Taukskābju sastāva
variācijas mātes pienā”. Projekta Nr. G1. Līguma
Nr. 3.2.-10/2019/LLU. Projekta statuss – turpinās (projekta laiks no
2020. gada 6. janvāra līdz 2022. gada 5. janvārim);
• Eiropas Sociālā fonda projekts Nr. 8.2.2.0/20/I/001 “LLU pāreja uz
jauno doktorantūras finansēšanas modeli”. Projekta statuss –
turpinās (projekta laiks no 2021. gada 17. maija līdz 2022. gada
16. maijam).
Page 49
49
MATERIĀLI UN METODES
Pētījuma dizains, laiks, vieta un paraugu atlase
Šķērsgriezuma dizaina pētījums tika veikts laika posmā no 2016. gada
novembra līdz 2021. gada martam un noritēja divos posmos:
• pirmais posms laika periodā no 2016. gada novembra līdz
2019. gada decembrim (kopā piedaloties 71 dalībniecei);
• otrais posms laika periodā no 2020. gada janvāra līdz 2021. gada
martam (kopā piedaloties 70 dalībniecēm).
Dalībnieces tika uzrunātas, izmantojot sociālo mediju domubiedru grupas
sievietēm zīdīšanas periodā.
Dalībnieces pārstāvēja Latvijas reģionus, lielākā daļa bija no Rīgas un
Pierīgas (skat. 1. tabulu).
Iekļaušanas un izslēgšanas kritēriji dalībai pētījumā
Iekļaušanas kritēriji:
1) parakstīta piekrišanas forma;
2) pētījuma norises laikā māte ar bērnu dzīvoja Latvijā;
3) viena bērna grūtniecība;
4) pagājušas vismaz 28 dienas pēc dzemdībām;
5) bērns pētījuma norises brīdī ekskluzīvi vai daļēji zīdīts (mātes piens
+ mātes piena aizstājējs vai mātes piens + papilduzturs);
6) māte un bērns pētījuma norises laikā veseli (nav hronisku vai akūtu
saslimšanu).
Izslēgšanas kritēriji:
1) neparakstīta piekrišanas forma;
2) neatbilstība iekļaušanas kritērijiem.
Ētiskie apsvērumi
Pirms pētījuma uzsākšanas saņemta Rīgas Stradiņa universitātes Ētikas
komitejas atļauja (Nr. 4/28.7.2016.). Pētījuma turpināšanai atļauja atjaunota
2020. gadā (Nr. 6-1/01/6). Pētījums veikts saskaņā ar vadlīnijām, kas noteiktas:
• Helsinku deklarācijā. Ētiskie principi medicīnas pētījumos, kas tiek
veikti ar cilvēkiem (Pasaules Ārstu asociācija, 2013. gads);
• Konvencijā par cilvēktiesību un cieņas aizsardzību bioloģijā un
medicīnā – Konvencija par cilvēktiesībām un biomedicīnu (Eiropas
Padome 1997. gads).
Parakstīta piekrišanas forma tika iegūta no visām dalībniecēm pirms
pētījuma uzsākšanas. Dalībnieku privātās tiesības visā pētījuma laikā tika
nodrošinātas saskaņā ar Vispārīgo datu aizsardzības regulu (Eiropas Parlamenta
un Padomes Regula Nr. 2016/679) un Latvijas Republikas Fizisko personu datu
apstrādes likumu (2018. gads).
Page 50
50
Mātes piena paraugi, kā arī visa dokumentācija, tika šifrēta, izmantojot
unikālu trīs ciparu kodu, lai aizstātu personas datus (vārds, uzvārds u.c.).
Pētījuma apraksts
Pētījuma gaita abos posmos bija līdzīga un uzskatāmi aprakstīta 10. attēlā.
Lai neradītu uzturvielu zaudējumus bērnam un nodrošinātu, ka netiek
ietekmēti bērna zīdīšanas paradumi, mātes piena parauga ievākšanai tika
izstrādāta speciāla procedūra. Daži mililitri piena tika atslaukti zīdīšanas reizes
noslēgumā no tās krūts, kuru zīdis bērns. Ja bērns bija zīdis no abām krūtīm,
piens bija jānoslauc no tās krūts, kuru bērns zīdis ilgāk.
Parauga ievākšanas biežums netika noteikts, bet, ievērtējot uzturvielu
satura izmaiņas diennakts ietvaros, mātes piena kopparaugam bija jāietver piens
no rīta, pusdienlaika, vakara un nakts barošanas.
1. Pirmā tikšanās ar pētījuma dalībniecēm
• Klātienē vai attālināti.
2. Pētījuma materiālu nodošana dalībniecēm
• Piekrišanas forma;
• 72 stundu uztura dienasgrāmata + pārtikasproduktu atlass;
• Pārtikas produktu lietošanas biežuma anketa;
• Vispārīgo jautājumu anketa;
• Marķēti graduēti trauciņi un instrukcija pienaparauga ievākšanai.
3. Mātes piena paraugu ievākšana
• Dalībnieces trīs secīgas dienasraksta uztura dienasgrāmatu,aizpilda pārējās anketas unnākamo 24 h laikā ievāc mātespiena paraugu (vienā traukā).
• Mātes piens ievākšanas periodātiek uzglabāts ledusskapī(~ 4 °C), pēc tam saliets analīžutrauciņos un uzglabāts saldētavā(~ -18 °C).
4. Otrā tikšanās ar pētījuma dalībniecēm
• Sasaldētie paraugi un anketas tiekpaņemtas no pētījuma dalībniecēm,un paraugi tiek nogādāti(termosoma araukstumelementiem) laboratorijā.
10. att. Pētījuma norises apraksts
Page 51
51
Pirmā posma ietvaros dalībniecēm bija jāiegūst kopā 100 ml piena un
jāsalej četros paraugu trauciņos:
• ~ 40 ml piena vienā trauciņā (tauku, olbaltumvielu satura
noteikšanai);
• ~ 40 ml piena otrā trauciņā (esenciālo un potenciāli toksisko
elementu satura noteikšanai);
• ~ 10 ml piena trešajā trauciņā (laktozes satura noteikšanai);
• ~ 10 ml piena ceturtajā trauciņā (kvalitatīvai un kvantitatīvai
taukskābju sastāva analīzei).
Otrā posma ietvaros pētījuma gaita bija analoga, bet ierobežotā laika un
finansējuma dēļ netika veiktas esenciālo un potenciāli toksisko elementu satura
analīzes un izmantota lētāka metode makrouzturvielu (tauku, olbaltumvielu,
laktozes) satura noteikšanai.
Otrā posma ietvaros dalībniecēm bija jānoslauc kopā 50 ml piena un
noslēgumā jāsalej divos paraugu trauciņos:
• ~ 40 ml piena vienā trauciņā (tauku, olbaltumvielu satura
noteikšanai);
• ~ 10 ml piena otrajā trauciņā (kvalitatīvai un kvantitatīvai
taukskābju analīzei).
Pētījumā izmantotās metodes mātes piena sastāva analīze
Metodes, kuras izmantotas mātes piena sastāva analizēšanai, apkopotas
11. attēlā.
Uztura datu izvērtēšana, izmantojot 72 stundu pārtikas
dienasgrāmatu un pārtikas biežuma anketu
Lai izvērtētu uzņemto enerģijas un uzturvielu daudzumu pētījuma
dalībniecēm, izmantota 72 stundu uztura dienasgrāmata. Uztura dienasgrāmata
ietvēra paraugu, kā nepieciešams pierakstīt informāciju. Dalībnieces tika
aicinātas izmantot elektroniski nosūtītu pārtikas produktu atlasu (Food Control
Authority, 2014), lai noteiktu un atbilstoši pierakstītu dažādu
produktu / ēdienu porcijas izmēru. Uztura dienasgrāmatā varēja norādīti arī tādus
porciju daudzumus kā “karotes”, “krūzes” u.tml.
Latvijas pārtikas sastāva datu bāzē nav pieejama informācija par
taukskābju saturu produktos, tādēļ, lai aprēķinātu dalībniecēm uzņemto enerģijas
un uzturvielu daudzumu, tika izmantota Somijas pārtikas datu bāze Fineli
(National Institute for Health and Welfare of Finland, 2019).
Tika ņemts vērā arī ar uztura bagātinātājiem uzņemtais uzturvielu
daudzums, pieskaitot to klāt aprēķiniem no Fineli pārtikas datu bāzes.
Lai izvērtētu dalībnieču uztura paradumus, sievietēm bija jāaizpilda arī
pārtikas produktu lietošanas biežuma anketa – modificēts protokols, ko
izstrādājusi Pasaules Veselības organizācija (2007).
Page 52
52
Anketā dalībniecēm bija jāatzīmē, cik bieži pēdējo 4 nedēļu laikā ir lietoti
konkrētie pārtikas produkti un dzērieni (kopā 74 dažādi). Atbilžu varianti bija
šādi:
• “nekad” (0 punkti);
• “retāk nekā reizi nedēļā” (1 punkts);
• “vienu reizi nedēļā” (2 punkti);
• “divas reizes nedēļā” (3 punkti);
• “biežāk nekā divas reizes nedēļā, bet ne katru dienu” (4 punkti);
• “katru dienu” (5 punkti).
1. p
osm
s
Institūta «BIOR» Ķīmijas
laboratorija
Tauki, %
LVS ISO 2446:2008 (Gerbera metode)
Olbaltumvielas, %
LVS EN ISO 8968-1:2014 (Kjeldāla metode)
Laktoze, %
ISO 22662:2007 (Augstas izšķirtspējas šķidruma
hromatogrāfija)
Taukskābes, % no visām taukskābēm (n=37)
BIOR-T-012-131-2011 (Gāzu hromatogrāfija)
Esenciālie elementi, mg 100 ml-1 vai µg 100 ml-1
(Ca, Mg, Na, K, Zn, Se, Mn, Fe, Cu, Co, Cr)
Potenciāli toksiskie elementi, µg 100 ml-1
(Al, Ni, As, Sr, Cd, Sn, Sb, Pb)
BIOR-T-012-148-2013 (Induktīvi saistītās
plazmas-masspektrometrija)
2. p
osm
s
Institūta «BIOR»
Ķīmijas
laboratorija
Taukskābes, % no visām taukskābēm
(n=37 + konjugētā linolskābe)
BIOR-T-012-131-2011 (Gāzu hromatogrāfija)
LLU Pārtikas
tehnoloģijas
fakultāte
Tauki, olbaltumvielas, laktoze, %
MilkoScanTM Mars, ISO 9622:2013
11. att. Mātes piena sastāva analizēšanai izmantotās metodes
Page 53
53
Pētījuma dalībnieku raksturojums
Pētījuma dalībnieku raksturojums ir apkopots 2. tabulā.
Datu statistiskā analīze
Visi dati apkopoti izmantojot Microsoft Excel, 2019 (Microsoft Corp.).
Datu statistiskā apstrāde veikta izmantojot IBM SPSS Statistics, versiju 22.0
(SPSS Incorporated).
Iegūtajiem datiem aprēķināts vidējais aritmētiskais (standartnovirze),
mediāna (starpkvartiļu izkliede) vai diapazons (minimālās–maksimālās
vērtības). Kruskala-Vallisa H tests tika izmantots, lai noteiktu statistiski ticamas
saistības starp kvalitatīviem un kvantitatīviem datiem. Spīrmena rangu
korelācijas koeficients (ρ) noteikts, lai vērtētu korelācijas virzienu un ciešumu
starp kvantitatīviem datiem. Spīrmena rangu korelācijas analīze tika veikta,
kontrolējot pēc šādiem ietekmējošajiem faktoriem:
• mātes vecums;
• mātes ķermeņa masas indekss;
• bērna vecums;
• bērna dzimšanas svars un garums;
• bērna dzimums;
• bērnu skaits ģimenē;
• barošanas veids (ekskluzīva / jaukta);
• piena noslaukšanas veids (noslaukšana ar roku / izmantojot piena
pumpi / abas metodes).
Galveno komponentu analīze tika veikta, lai identificētu dažādus uztura
paradumu modeļus un taukskābju profilus mātes pienā. Klāsteru skaits tika
identificēts balstoties uz iegūto eigenvērtību (≥1). Vērtības ar faktora ietekmi
≥|0.5| tika uzskatītas par nozīmīgām, identificējot klāstera komponentes.
Vairāksoļu daudzfaktoru regresijas analīze tika izmantota, lai prognozētu
konkrētu uzturvielu saturu mātes pienā, balstoties uz datiem par attiecīgās
uzturvielas uzņemšanu ar uzturu, trīs secīgas dienas pirms mātes piena parauga
iegūšanas.
Ja nepieciešams, dati tika pārveidoti, lai atbilstu normālsadalījumam
(log-transformācija vai kvadrātsaknes izvilkšana).
Sakarība tika uzskatīta par nozīmīgu, ja p-vērtība ≤0.05.
PĒTĪJUMA REZULTĀTI UN DISKUSIJA
1. Mātes piena sastāvs
Rezultāti par makrouzturvielu (tauku, olbaltumvielu, laktozes) saturu
mātes pienā ir apkopoti 3. tabulā.
Page 54
54
Tauku saturs mātes pienā, salīdzinot abas pētījuma grupas, nozīmīgi
neatšķīrās (p=0.771), bet otrā posma dalībniecēm pienā tika konstatēts augstāks
olbaltumvielu un laktozes saturs (p<0.005 abiem). Novērotās atšķirības drīzāk
saistītas ar dažādu analītisko metožu izmantošanu pētījuma posmos.
Dati par tauku (4.40 %) un laktozes (6.53 %) saturu mātes pienā
pirmā posma dalībniecēm bija salīdzināmi ar Latvijā veiktā pētījuma datiem
(Broka et al., 2016) – attiecīgi 4.42 % un 6.50 %. Olbaltumvielu saturs
mātes pienā abos posmos (1.09 % un 1.23 %) bija zemāks nekā
Broka et al. (2016) pētījumā – 1.46 %. Tas varētu būt izskaidrojums ar atšķirīgo
paraugu ieguves laiku. Šī pētījuma ietvaros tika analizēti mātes piena paraugi,
kad ir pagājušas vismaz 28 dienas pēc dzemdībām (nobriedis mātes piens).
Brokas et al. (2016) pētījumā analizēti mātes piena paraugi, kas iegūti
5 līdz 28 dienas pēc dzemdībām – pārejas piens, kas satur augstāku
olbaltumvielu saturu nekā nobriedis mātes piens (Garwolińska et al., 2018).
Dati par būtiskāko taukskābju sastāvu un saturu mātes pienā ir apkopoti
4. tabulā.
Dominējošās taukskābes mātes pienā bija oleīnskābe, palmitīnskābe un
linolskābe. Arī citu zinātnieku pētījumi apstiprina, ka šīs taukskābes mātes pienā
procentuāli ir visvairāk (Antonakou et al., 2013; Daud et al., 2013;
Glew et al., 2006; Jiang et al., 2016; Krešić et al., 2013; Luna,
Juárez & de la Fuente, 2007; Mojska et al., 2003; Mosley et al., 2005;
Nishimura et al., 2013; Olang et al., 2012; Precht & Molkentin, 1999; Samur,
Topcu & Turan, 2009; Wu et al., 2010).
Pirmā posma pētījuma dalībniecēm mātes pienā bija augstāks
palmitīnskābes un kopējais piesātināto taukskābju saturs, bet otrā posma
dalībniecēm – augstāks mononepiesātināto, polinepiesātināto un
trans taukskābju saturs. Atšķirības, īpaši trans C18:1 taukskābju izomēru saturā,
varētu būt skaidrojamas ar 2020. gadā pilnveidoto taukskābju noteikšanas
metodi, kas ļauj labāk identificēt dažādus trans C18:1 taukskābju izomērus.
Izmantojot galveno komponentu analīzi, identificēti seši mātes piena
taukskābju profili, kopā izskaidrojot 85.12 % no kopējām taukskābju variācijām
mātes pienā:
• pirmais profils saistīts ar augstu polinepiesātināto taukskābju, bet
mazu piesātināto taukskābju saturu mātes pienā (skaidrojot 28.22 %
no kopējām taukskābju variācijām mātes pienā);
• otrais profils saistīts ar augstu mononepiesātināto un
trans taukskābju saturu mātes pienā, bet mazu
n-6 / n-3 polinepiesātināto taukskābju attiecību mātes pienā
(skaidrojot 20.46 % no kopējām taukskābju variācijām mātes pienā);
• trešais profils saistīts ar augstu n-3 polinepiesātināto taukskābju
saturu, bet mazu mononepiesātināto taukskābju saturu mātes pienā
(skaidrojot 13.95 % no kopējām taukskābju variācijām mātes pienā);
Page 55
55
• ceturtais profils saistīts ar augstu trans taukskābju, bet mazu
mononepiesātināto taukskābju saturu mātes pienā (skaidrojot 9.37
% no kopējām taukskābju variācijām mātes pienā);
• piektais profils saistīts ar augstu polinepiesātināto taukskābju –
eikozapentaēnskābes un dokozaheksaēnskābes saturu mātes pienā
(skaidrojot 7.86 % no kopējām taukskābju variācijām mātes pienā);
• sestais profils saistīts ar zemu dokozaheksaēnskābes un vidēji garo
ķēžu taukskābju saturu mātes pienā (skaidrojot 5.27 % no kopējām
taukskābju variācijām mātes pienā).
Kopumā, dati bija salīdzināmi ar rezultātiem, ko publicējuši Eiropas
valstu zinātnieki (Antonakou et al., 2013; Krešić et al., 2013; Luna,
Juárez & de la Fuente, 2007; Mojska et al., 2003; Mosley et al., 2005;
Precht & Molkentin, 1999), izņemot vakcēnskābes saturu mātes pienā, kas bija
ievērojami augstāks (1.40 %) starp šī pētījuma dalībniecēm. Citās Eiropas valstīs
vakcēnskābes saturs mātes piena paraugos ir mazāks par 1.00 % (Luna,
Juárez & de la Fuente, 2007; Precht & Molkentin, 1999).
Kopējais trans taukskābju saturs mātes pienā Latvijā ir viens no
zemākajiem (1.70 %). Mazāks trans taukskābju saturs Eiropas valstu mātes piena
pētījumos ir Spānijā – 0.80 % (Luna, Juárez & de la Fuente, 2007).
Lai gan mediānais dokozaheksaēnskābes saturs mātes pienā (0.30 %)
atbilst rekomendētajai robežvērtībai (Jackson Harris & Harris, 2016), tas krasi
atšķīrās analizētajos paraugos (0.10 līdz 4.30 %).
Arahidonskābes saturs mātes pienā (0.30 %) pētījuma dalībniecēm bija
ievērojami mazāks nekā globāli noteiktā vērtība (0.55 %) (Fu et al., 2016).
Dati par esenciālo un potenciāli toksisko elementu saturu mātes pienā
ir apkopoti 5. tabulā.
Zviedrijas pētījums, ko veica Björklund et al. (2012), ir viens no
jaunākajiem pētījumiem Eiropā, kas sniedz datus par esenciālo un potenciāli
toksisko elementu saturu mātes pienā, izmantojot ICP-MS analītisko metodi
(izmantota šajā pētījumā). Datu salīdzinājums skatāms 6. tabulā.
Kalcija, kālija un magnija satura dati mātes pienā bija salīdzināmi, bet
nātrija un cinka saturs bija mazāks nekā Zviedrijas pētījumā
(Björklund et al., 2012).
Lai gan tādas modernas analītiskās metodes kā ICP-MS atļauj noteikt
elementu saturu pat niecīgā daudzumā, daži uzlabojumi ir nepieciešami.
Analizējot elementu saturu mātes pienā, saskārāmies ar grūtībām noteikt dzelzs,
selēna un citu esenciālo elementu vērtības mātes pienā virs metodes noteikšanas
robežas.
Page 56
56
Iespējami iemesli varētu būt:
• paraugu sagatavošanas metodes izvēle – Levi et al. (2018) ir atklājis,
ka paraugu sagatavošanas veids var ietekmēt konkrētu elementu
noteikšanu mātes pienā. Piemēram, tiek konstatēts par 15 %
augstāks selēna saturs mātes pienā, izmantojot paraugu apstrādi ar
sārmu, bet tiek noteikts par 28 % augstāks dzelzs saturs, izmantojot
paraugu apstrādi ar skābi. Šī pētījuma ietvaros paraugu
sagatavošanai tika izmantota skābe;
• analītisko reaģentu tīrība, tehniskie parametri u.c. faktori var
ietekmēt ICP-MS metodes noteikšanas robežvērtības;
• aprēķinātās metodes robežvērtības šī pētījuma ietvaros bija
augstākas nekā, piemēram, ziņots Björklund et al. (2012) pētījumā.
Jāatzīmē, ka to aprēķini veikti uz piecu “tukšo” paraugu analīzēm,
bet šī pētījuma ietvaros – uz 20 “tukšo” paraugu analīzēm;
• dažu izotopu kā selēns (78Se), dzelzs (56Fe) u.c. noteikšanu var
ietekmēt spektrometriski traucējumi ar citiem poliatomiskiem
joniem, galvenokārt – argona (de la Guardia & Garrigues, 2015). Šī
pētījuma ietvaros argons tika izmantots kā nesējgāze ICP-MS
analīzei.
Arī potenciāli toksisko elementu saturs analizētajos mātes piena paraugos
bija zem noteikšanas robežas. Tikai divos paraugus potenciāli toksisko elementu
saturs pārsniedza metodes noteikšanas robežu – vienā paraugā arsēna saturs bija
0.93 µg 100 ml-1 un citā paraugā svina saturs – 4.84 µg 100 ml-1. Abas vērtības
nepārsniedza maksimāli pieļaujamo saturu, kas noteikts Eiropas Komisijas
Regulā 1881/2006 mātes piena aizstājējiem un pārtikai, kas paredzēta zīdaiņu un
mazu bērnu ēdināšanai (attiecīgi, 10 µg arsēna un 5 µg svina uz 100 mg-1 mitra
svara).
2. Uztura paradumi un uzturvielu uzņemšana pētījuma dalībniecēm
Pārtikas produktu lietošanas biežuma anketas izvērtējums
Rudzu maize bija visbiežāk lietotais pārtikas produkts produktu grupā
“Graudaugi, graudaugu produkti & kartupeļi” – to lietojušas uzturā biežāk nekā
divas reizes nedēļā 31 % dalībnieču un katru dienu – 28 % dalībnieču. Bieži
uzturā lietota arī graudu & sēklu maize – vismaz divas reizes nedēļā
26 % dalībnieču vai katru dienu –16 % dalībnieču. Arī pilngraudu auzu pārslas
bieži lietotas uzturā – vismaz divas reizes nedēļā (15 % dalībnieču) vai katru
dienu (11 % dalībnieču). Citi cieti saturošie produkti – rīsi, griķi u.c. lietoti reti.
Vārīti kartupeļi ir patērēti vienu reizi nedēļā (~ 32 % dalībnieču). Vairāk
nekā puse dalībnieču (~ 52 %) atzīmējušas, ka retāk nekā reizi nedēļā uzturā
lieto arī krāsnī vai uz pannas ceptus kartupeļus, vai kartupeļu biezeni.
Page 57
57
Kopumā dalībnieču uzturs nav daudzveidīgs, no cieti saturošo produktu
klāsta lielākoties tiek patērēta tikai maize un kartupeļi, bet griķi, kvinoja,
amarants, kus-kus, bulgurs nebija plaši lietoti uzturā.
Sarkanā gaļā visbiežāk lietota vienu reizi nedēļā (~ 22 % dalībnieču), bet
baltā gaļa – vismaz divas reizes nedēļā (29 % dalībnieču). Gaļas izstrādājumi
uzturā netika lietoti (30 % dalībnieču) vai lietoti retāk nekā reizi nedēļā
(32 % dalībnieču). Olas dalībnieču uzturā lielākoties iekļautas gandrīz katru
dienu (33 % dalībnieču).
Lielākā daļa dalībnieču uzturā zivis nelieto vispār (17 %) vai lieto reti
(46 % dalībnieču). Vienu reizi nedēļā zivis uzturā iekļauj ~ 22 % dalībnieču, bet
tikai 15 % dalībnieču zivis ēd vismaz divas reizes nedēļā. Arī jūras veltes uzturā
tiek lietotas reti (47 % dalībnieču) vai nemaz (~ 46 % dalībnieču).
Gandrīz puse dalībnieču uzturā katru dienu lieto pienu (43 %). Siers bija
otrs visbiežāk lietotais piena produkts, patērēts gandrīz katru dienu
(34 % dalībnieču). Četrpadsmit dalībnieces no pirmā pētījuma posma un desmit
dalībnieces no otrā posma pārtikas produktu lietošanas biežuma anketā bija
atzīmējušas, ka no uztura pilnībā izslēdz pienu un piena produktus. Iemesli tam
bija šādi – dalībniece veģetāriete (divas dalībnieces no pirmā posma, viena no
otrā posma) vai vegāne (divas dalībnieces katrā posmā), veselības problēmas
pašai dalībniecei (divas dalībnieces pirmajā posmā) vai govs piena alerģija
bērnam (astoņas dalībnieces pirmajā posmā un septiņas dalībnieces otrajā
posmā).
Vairāk nekā puse dalībnieču anketā bija atzīmējušas, ka nelieto pākšaugus
vai lieto tos reti.
Aptuveni puse dalībnieču uzturā katru dienu lieto svaigus dārzeņus
(52 %) un augļus (49 %), bet svaigas ogas katru dienu uzturā iekļauj tikai
13 % dalībnieču. Pagatavoti dārzeņi uzturā katru dienu bija tikai vienai trešdaļai
dalībnieču.
No augu izcelsmes taukvielām galvenokārt tiek lietotas augu eļļas –
gandrīz katru dienu uzturā lieto 83 % dalībnieču. Olīveļļa bija visbiežāk
izmantotā augu eļļa (71 % dalībnieču), saulespuķu eļļa – otra visbiežāk lietotā
(25 % dalībnieču), bet rapšu eļļa – trešā (23 % dalībnieču) (dalībnieces anketā
drīkstēja atzīmēt vairākas augu eļļas).
Sviests gandrīz katru vai katru dienu uzturā bija iekļauts 50 % dalībnieču.
Citas piedevas ēdiena garšas uzlabošanai – kečups, majonēze, mērces, margarīns,
augu tauku pastas praktiski nebija iekļautas dalībnieču uzturā.
Šokolāde bija visbiežāk lietotais saldums – gandrīz katru dienu vai katru
dienu uzturā lietojušas ~ 32 % dalībnieču. Cepumus gandrīz katru vai katru dienu
uzturā lietojušas 20 % dalībnieču. Gandrīz visas dalībnieces (~ 90 %) sāļās
uzkodas un “ātrās uzkodas” lietojušas reti vai nemaz. Limonādes arī lietotas reti
vai nemaz.
Page 58
58
Vairāk nekā puse dalībnieču (~ 58 %) katru dienu ir dzērušas kafiju.
Arī kofeīnu saturošās tējas uzturā lietojušas trešā daļa dalībnieču (~ 30 %).
Gandrīz puse no dalībniecēm (~ 42 %) katru dienu uzturā lietojušas arī zāļu tējas.
Alkoholu lielākā daļa dalībnieču nelieto (~ 70 %), bet ~ 22 % dalībnieču
anketā bija atzīmējušas, ka alkoholu lieto retāk nekā reizi nedēļā. Pārējās
dalībnieces alkoholu lietojušas vienu reizi (6 %), divas reizes (1 %) nedēļā vai
biežāk (1 %).
Lai klasificētu, kādi uztura paradumi ir raksturīgi pētījuma dalībniecēm,
balstoties uz pārtikas produktu lietošanas biežuma anketas datiem, tika veikta
galveno komponentu analīze un identificēti pieci uztura modeļi ar eigenvērtību
lielāku nekā viens, kas izskaidroja, attiecīgi, 18.83 %, 17.65 %, 9.65 %, 8.63 %,
un 6.67 % no kopējās uztura variācijas (61.43 % kopā):
• pirmo uztura modeli var raksturot kā “veselīgu”, jo saistīts ar augstu
dārzeņu, augļu, ogu, augu izcelsmes taukvielu un pākšaugu patēriņu,
bet zemu dzīvnieku izcelsmes olbaltumvielu patēriņu;
• otrais uztura modelis vērtējams kā “neveselīgs”, jo dominē produkti
ar augstu ogļhidrātu (tai skaitā cukuru), tauku un sāls daudzumu;
• trešais uztura modelis saistīts ar lielu pienu & piena produktu un
saldumu & konditorejas izstrādājumu patēriņu, kas attiecīgi varētu
būt saistīts arī ar augstāku trans taukskābju uzņemšanu;
• ceturtais uztura modelis saistīts ar dažādu dzērienu patēriņu;
• piektais modelis – ar lielāku zivju & jūras velšu un augļu patēriņu.
72 stundu uztura dienasgrāmatas izvērtējums
Enerģijas uzņemšana pētījuma dalībniecēm bija zemāka nekā
rekomendēts uzņemt sievietēm zīdīšanas periodā. Enerģijas uzņemšana ar
ogļhidrātiem bija zemāka, ar taukiem augstāka, bet ar olbaltumvielām –
atbilstoši rekomendācijām (7. tabula).
Cukura patēriņš pētījuma dalībniecēm bija augsts un nodrošināja
aptuveni vienu piekto daļu no kopējā uzņemtās enerģijas daudzuma (7. tabula).
Kopumā augstāks cukura patēriņš tika novērots dalībniecēm, kuras biežāk uzturā
lietoja augļus & ogas (ρ=0.257, p=0.003).
Šķiedrvielu uzņemšana (~ 22 g dienā) pētījuma dalībniecēm bija zemāka
nekā rekomendēts (25 to 35 g dienā). Vairāk šķiedrvielu uzņēma tās pētījuma
dalībnieces, kuras uzturā biežāk lietoja pākšaugus (ρ=0.278, p=0.001), dārzeņus
(ρ=0.313, p<0.0005), augļus & ogas (ρ=0.317, p<0.0005) un augu izcelsmes
taukvielas (grupa, kas ietver tādus produktus kā rieksti, sēklas, avokado)
(ρ=0.436, p<0.0005).
Dalībnieces uzņēma vairāk piesātināto taukskābju nekā rekomendēts
(7. tabula). Augstāks piesātināto taukskābju patēriņš bija saistīts ar biežāku olu,
gaļas & gaļas izstrādājumu (ρ=0.285, p=0.001), piena & piena produktu
(ρ=0.438, p<0.0005) un saldumu & konditorejas izstrādājumu (ρ=0.328,
p<0.0005) patēriņu.
Page 59
59
Mononepiesātināto taukskābju uzņemšana pētījuma dalībniecēm bija
atbilstoši vadlīnijās noteiktajam (7. tabula). Vairāk mononepiesātināto
taukskābju uzņēma tās pētījuma dalībnieces, kas biežāk uzturā lietoja augu
izcelsmes taukvielas (ρ=0.214, p=0.015).
Kopējais polinepiesātināto taukskābju, n-3 polinepiesātināto
taukskābju patēriņš pētījuma dalībniecēm bija atbilstoši vadlīnijām, bet
kopējais uzņemtais linolskābes + α-linolēnskābes daudzums pārsniedza
rekomendācijās noteikto (7. tabula). Individuāli linolskābes uzņemšana pētījuma
dalībniecēm arī bija augstāka nekā rekomendēts, bet α-linolskābes uzņemšana
sasniedza rekomendēto vērtību 0.5 E % (7. tabula). Augstāka kopējā
polinepiesātināto taukskābju, n-3 polinepiesātināto taukskābju, linolskābes un
α-linolēnskābes uzņemšana bija tām dalībniecēm, kas biežāk uzturā iekļāva augu
izcelsmes taukvielas (ρ=0.287, p=0.001, ρ=0.242, p=0.006, ρ=0.262, p=0.003 un
ρ=0.303, p=0.001).
Uzņemtais eikozapentaēnskābes un dokozaheksaēnskābes daudzums
(19 mg un 100 mg dienā) pētījuma dalībniecēm bija ievērojami zemāks nekā
noteikts vadlīnijās (7. tabula). Zivju & jūras velšu lietošana uzturā bija saistīta ar
augstāku uzņemto eikozapentaēnskābes un dokozaheksaēnskābes daudzumu
(ρ=0.236, p=0.007 un ρ=0.224, p=0.011).
Mediānais uzņemtais trans taukskābju daudzums pētījuma dalībniecēm
nepārsniedza 1 g dienā. Augstāks uzņemtais trans taukskābju daudzums bija
saistīts ar biežāku piena & piena produktu (ρ=0.421, p<0.0005) un
saldumu & konditorejas izstrādājumu patēriņu (ρ=0.312, p<0.0005).
Mediānais uzņemtais holesterīna daudzums pētījuma dalībniecēm bija
aptuveni 273 mg dienā. Augsts holesterīna patēriņš var palielināt
kardiovaskulāro slimību risku, tādēļ ir rekomendēts dienā neuzņemt vairāk par
300 mg holesterīna (Reiner et al., 2011). Augstāks uzņemtā holesterīna
daudzums bija tām dalībniecēm, kuras uzturā biežāk lietoja dzīvnieku izcelsmes
produktus (ρ=0.345, p<0.0005 – olas, gaļa & gaļas izstrādājumi, ρ=0.395,
p<0.0005 – piens & piena produkti).
Dažas pētījuma dalībnieces 72 stundu uztura dienasgrāmatā bija
norādījušas, ka lietojušas alkoholu – galvenokārt sarkanvīnu (n=3), baltvīnu
(n=2) vai alu (n=2). Četrām pētījuma dalībniecēm nedaudz alkohols uzņemts
ēdot desertu – tiramisu. Kopumā gan alkohola patēriņš šim pētījuma dalībniecēm
nepārsniedza dienā noteikto maksimālo limitu – 10 g.
Tikai aptuveni 42 % pētījuma dalībnieču uzņemtais kalcija daudzums
sasniedza dienā rekomendēto – 900 mg (3. attēls). Vairāk kalcija uzņēma tās
pētījuma dalībnieces, kuras uzturā biežāk lietoja pienu & piena produktus
(ρ=0.520, p<0.0005).
Page 60
60
Vairāk fosfora uzņēma tās pētījuma dalībnieces, kuras uzturā biežāk
lietoja pienu & piena produktus (ρ=0.346, p<0.0005) un augu izcelsmes
taukvielas (ρ=0.241, p=0.006). Kopumā lielākajai daļai pētījuma dalībnieču
(~ 89 %) dienā uzņemtais fosfora daudzums sasniedza rekomendētos 900 mg
(3. attēls).
Kālija uzņemšana pozitīvi korelēja ar dārzeņu, augļu & ogu un augu
izcelsmes taukvielu patēriņu (ρ=0.325, p<0.0005, ρ=0.245, p=0.005 un ρ=0.388,
p<0.0005). Diemžēl kopumā tikai nedaudz vairāk nekā puse pētījuma dalībnieču
(~ 55 %) uzņēma dienā nepieciešamo kālija daudzumu – 3100 mg (3. attēls).
Nātrija (un attiecīgi sāls) uzņemšana lielākajai daļai pētījuma dalībnieču
(~ 63 %) pārsniedza dienā rekomendēto daudzumu (7. tabula). Nātriju vairāk
uzņēma tās pētījuma dalībnieces, kas uzturā biežāk lietoja olas, gaļu & gaļas
izstrādājumus (ρ=0.306, p<0.0005) un pienu & piena produktus (ρ=0.196,
p=0.026).
Aptuveni 77 % dalībnieču mediānais magnija daudzums sasniedza
rekomendētos 280 mg dienā (3. attēls). Kopumā dalībnieces, kuras biežāk uzturā
iekļāva augu valsts produktus, vairāk uzņēma magniju (ρ=0.336, p<0.0005 –
dārzeņiem, ρ=0.300, p=0.001 – augļiem & ogām, ρ=0.466, p<0.0005 – augu
izcelsmes taukvielām).
Tikai aptuveni 39 % dalībnieču uzņemtais dzelzs daudzums sasniedza
rekomendētos 15 mg dienā (3. attēls). Interesanti, ka vairāk dzelzs uzņēma tās
pētījuma dalībnieces, kas vairāk uzturā iekļāva augu valsts produktus, bet mazāk
gaļu (ρ=-0.285, p=0.001).
Aptuveni 58 % dalībnieču dienā uzņemtais cinka daudzums sasniedza
rekomendētos 11 mg (3. attēls). Vairāk cinka uzņēma tās pētījuma dalībnieces,
kuras biežāk uzturā lietoja augu izcelsmes taukvielas (sēklas, riekstus u.c.)
(ρ=0.208, p=0.019).
Atbilstošs (vismaz 60 µg dienā) uzņemtā selēna daudzums bija 73 %
dalībnieču (3. attēls). Tas korelēja ar olu, gaļas & gaļas izstrādājumu (ρ=0.174,
p=0.050) un piena & piena produktu patēriņu (ρ=0.298, p=0.001).
Lielākajai daļai pētījuma dalībnieču (56 %), uzņemtais joda daudzums
sasniedza dienā ieteicamo minimālo devu – 150 µg (3. attēls). Kopumā vairāk
joda uzņēma tās pētījuma dalībnieces, kas uzturā biežāk lietoja zivis & jūras
veltes (ρ=0.190, p=0.032) un pienu & piena produktus (ρ=0.400, p<0.0005).
Uzņemtais A vitamīna daudzums pētījuma dalībniecēm bija zems – tikai
aptuveni 27 % dalībnieču sasniedza dienā rekomendēto daudzumu – 1100 µg
(4. attēls). A vitamīna uzņemšana pozitīvi korelēja ar piena & piena produktu
(ρ=0.284, p=0.001) un augu izcelsmes taukvielu lietošanu uzturā (ρ=0.202,
p=0.022).
Mediānais uzņemtais karotinoīdu daudzums pētījuma dalībniecēm bija
aptuveni 9724 µg. Vairāk karotinoīdu uzņēma tās pētījuma dalībnieces, kuras
biežāk uzturā lietoja dārzeņus (ρ=0.305, p<0.0005) un augu izcelsmes taukvielas
(ρ=0.266, p=0.002).
Page 61
61
Tikai 36 % dalībnieču uzņemtais vitamīna D daudzums sasniedza
rekomendētos 10 µg dienā (4. attēls).
Vairāk E vitamīna uzņēma tās pētījuma dalībnieces, kuras uzturā biežāk
lietoja dažādas augu izcelsmes taukvielas (ρ=0.247, p=0.005).
Kopumā 60 % dalībnieču E vitamīna uzņemšana atbilda vadlīnijās noteiktajam
– 11 mg dienā (4. attēls).
Dalībnieces ar augstāku dārzeņu, augļu & ogu un augu izcelsmes
taukvielu patēriņu uzņēma vairāk K vitamīna (ρ=0.257, p=0.003, ρ=0.195,
p=0.027 un ρ=0.342, p<0.0005). Lielākajai daļai dalībnieču (~ 84 %)
K vitamīna uzņemšana sasniedza dienā rekomendēto daudzumu – 70 µg
(4. attēls).
Dalībnieces, kuras uzņēma vairāk dārzeņu (ρ=0.277, p=0.002),
augļu & ogu (ρ=0.244, p=0.006) un augu izcelsmes taukvielu (ρ=0.252,
p=0.004), uzņēma attiecīgi vairāk arī C vitamīna. Aptuveni 54 % dalībnieču
dienā uzņemtais C vitamīna daudzums sasniedza rekomendētos 100 mg
(4. attēls).
Tikai 38 % dalībnieču B1 vitamīna uzņemšana bija pietiekama
(vismaz 1.6 mg dienā). Kopumā vairāk B1 vitamīna uzņēma tās pētījuma
dalībnieces, kuras uzturā biežāk lietoja dārzeņus, augļus & ogas un augu
izcelsmes taukvielas (ρ=0.181, p=0.041, ρ=0.179, p=0.043 un ρ=0.197,
p=0.026).
Tikai aptuveni pusei pētījuma dalībnieču (~ 49 %), mediānais uzņemtais
B2 vitamīna daudzums sasniedza vadlīnijās noteikto – 1.7 mg dienā (4. attēls).
B2 vitamīna uzņemšana pozitīvi korelēja ar piena & piena produktu patēriņu
uzturā (ρ=0.465, p<0.0005).
B3 vitamīna uzņemšana lielākajai daļai dalībnieču (~ 87 %) bija atbilstoša
(vismaz 20 mg dienā) un pozitīvi korelēja ar olu, gaļa & gaļas izstrādājumu,
zivju & jūras velšu, piens & piena produktu (ρ=0.210, p=0.017, ρ=0.229,
p=0.009 un ρ=0.243, p=0.006) patēriņu.
Aptuveni 79 % dalībnieču B6 vitamīna uzņemšana sasniedza
rekomendēto daudzumu (1.5 mg dienā, skat. 4. attēls). Dalībnieces, kuras uzturā
biežāk lietoja augu izcelsmes produktus – dārzeņus, augļus & ogas, augu
izcelsmes taukvielas, attiecīgi uzņēma vairāk arī vitamīnu B6 (ρ=0.275, p=0.002,
ρ=0.182, p=0.040 un ρ=0.283, p=0.001).
Vairāk B9 vitamīna uzņēma dalībnieces, kuras biežāk uzturā lietoja
dārzeņus, augļus & ogas, pākšaugus un augu izcelsmes taukvielas (ρ=0.289,
p=0.001, ρ=0.321, p<0.0005, ρ=0.338, p<0.0005). Tikai 22 % dalībnieču
uzņemtais B9 vitamīna daudzums sasniedza rekomendētos 500 µg dienā
(4. attēls).
Page 62
62
Lielākajai daļai dalībnieču (~ 79 %) uzņemtais B12 vitamīna daudzums
sasniedza ieteicamos 2 µg dienā (4. attēls). B12 vitamīna uzņemšana bija saistīta
ar dzīvnieku valsts produktu iekļaušanu uzturā (ρ=0.200, p=0.024 produktu
grupai – olas, gaļa & gaļas izstrādājumi, ρ=0.328, p<0.0005 zivis & jūras veltes,
ρ=0.408, p<0.0005 piens & piena produkti).
3. Uztura ietekme uz mātes piena sastāvu
Datu statistiskā apstrāde atklāja dažas nozīmīgas, bet vājas korelācijas
starp konkrētu produktu lietošanu uzturā un makrouzturvielu saturu mātes
pienā. Piemēram, zemāks tauku saturs mātes pienā bija dalībniecēm ar augstāku
zivju & jūras velšu patēriņu (ρ=-0.196, p=0.030), bet augstāks olbaltumvielu
saturs bija dalībniecēm, kuras uzturā biežāk lietoja pākšaugus (ρ=0.184,
p=0.041), augu izcelsmes taukvielas (ρ=0.201, p=0.025) un sāļās uzkodas &
“ātrās uzkodas” (ρ=0.180, p=0.047).
Olbaltumvielu saturs mātes pienā pozitīvi korelēja ar mononepiesātināto
taukskābju (ρ=0.178, p=0.049), n-3 polinepiesātināto taukskābju (ρ=0.264,
p=0.003), α-linolēnskābes (ρ=0.335, p<0.0005), dzelzs (ρ=0.220, p=0.015), bet
negatīvi ar B6 vitamīna (ρ=-0.650, p<0.0005) uzņemšanu.
Laktozes saturs mātes pienā pozitīvi korelēja ar mononepiesātināto
taukskābju (ρ=0.199, p=0.027) un selēna uzņemšanu (ρ=0.185, p=0.041), bet
negatīvi ar cukura (ρ=-0.198, p=0.029) un B6 vitamīna uzņemšanu (ρ=-0.650,
p<0.0005).
Tieša saistība starp tauku, olbaltumvielu vai laktozes uzņemšanu ar
uzturu un šo uzturvielu saturu mātes pienā netika konstatēta (p>0.05).
Piesātināto taukskābju saturs mātes pienā pozitīvi korelēja ar šādu
pārtikas produktu grupu iekļaušanu uzturā – olas, gaļa & gaļas izstrādājumi
(ρ=0.211, p=0.017), zivis & jūras veltes (ρ=0.217, p=0.014), piens & piena
produkti (ρ=0.368, p<0.0005), kā arī saldumi & konditorejas izstrādājumi
(ρ=0.187, p=0.034) un arī ar mediāno uzņemto piesātināto taukskābju saturu ar
uzturu (ρ=0.278, p=0.002). Vairāksoļu daudzfaktoru regresijas analīze atklāja,
ka tikai trīs dienas pirms parauga ievākšanas ar uzturu uzņemtajam piesātināto
taukskābju daudzumam bija statistiski ticama ietekme uz piesātināto taukskābju
saturu mātes pienā, F(3, 135)=4.223, p=0.007 un ar uzturu skaidrojami 6 %
(pielāgotais R2=0.065) no piesātināto taukskābju variācijas mātes pienā.
Vidēji garo ķēžu taukskābju saturs mātes pienā negatīvi korelēja ar
uzņemto tauku daudzumu (ρ=-0.242, p=0.006).
Pozitīva saistība tika konstatēta starp palmitīnskābes saturu mātes pienā
un piena & piena produktu (ρ=0.509, p<0.0005) un saldumu & konditorejas
izstrādājumu lietošanu uzturā (ρ=0.267, p=0.002), kā arī ar uzņemto laktozes
(ρ=0.478, p<0.0005), piesātināto taukskābju (ρ=0.410, p<0.0005) un
trans taukskābju daudzumu (ρ=0.449, p<0.0005).
Page 63
63
Vairāksoļu daudzfaktoru regresijas analīze apstiprināja, ka ar uzturu
uzņemtajam piesātināto taukskābju daudzumam ir ietekme uz palmitīnskābes
saturu mātes pienā, F(3, 135)=7.075, p<0.0005. Jāatzīmē, ka ar uzturu
izskaidrojami tikai 12 % palmitīnskābes satura mainīguma mātes pienā
(pielāgotais R2=0.117), un tikai dienu pirms parauga ievākšanas uzņemtais
piesātināto taukskābju daudzums bija vērtējams kā būtisks faktors (p=0.009).
Gan oleīnskābes, gan mononepiesātināto taukskābju saturs mātes
pienā pozitīvi korelēja ar uzņemto mononepiesātināto taukskābju daudzumu
(ρ=0.346, p<0.0005 un ρ=0.294, p=0.001), bet negatīvi korelēja ar uzņemto
trans taukskābju daudzumu (ρ=-0.190, p=0.032 un ρ=-0.193, p=0.029).
Vairāksoļu daudzfaktoru regresijas analīze apstiprināja, ka uzņemtajam
mononepiesātināto taukskābju daudzumam ir būtiska ietekme uz
mononepiesātināto taukskābju un oleīnskābes saturu mātes pienā,
F(3, 135)=5.698, p=0.001 un F(3, 135)=7.647, p<0.0005. Tomēr ar uzturu
izskaidrojami tikai 9 % no mononepiesātināto taukskābju un tikai 13 % no
oleīnskābes satura mainīguma mātes pienā (pielāgotais R2=0.093 un R2=0.126).
Tikai dienu pirms piena parauga ievākšanas, uzņemtajam mononepiesātināto
taukskābju daudzumam bija būtiska ietekme uz mononepiesātināto taukskābju
un oleīnskābes saturu mātes pienā (p=0.012 un p=0.043).
Tika konstatēta statistiski ticama pozitīva korelācija starp uzņemto
polinepiesātināto taukskābju daudzumu ar uzturu un šo taukskābju saturu
mātes pienā (ρ=0.277, p=0.002). Vairāksoļu daudzfaktoru regresijas analīze
apstiprināja, ka uzņemtajam polinepiesātināto taukskābju daudzumam ar uzturu
trīs un vienu dienu pirms parauga ievākšanas bija būtiska ietekme uz
polinepiesātināto taukskābju saturu mātes pienā, F(3, 135)=9.502, p<0.0005.
Kopumā ar uzturu iespējams skaidrot tikai aptuveni 16 % no polinepiesātināto
taukskābju satura variācijas mātes pienā (pielāgotais R2=0.156) (p<0.0005).
Tika konstatēta statistiski ticama pozitīva korelācija starp ar uzturu
uzņemto n-6 un n-3 polinepiesātināto taukskābju daudzumu un attiecīgi šo
taukskābju saturu mātes pienā (ρ=0.298, p=0.001 un ρ=0.451, p<0.0005). Arī
vairāksoļu daudzfaktoru regresijas analīze norādīja uz to, ka trīs un vienu dienu
pirms parauga ievākšanas ar uzturu uzņemtajam n-6 polinepiesātināto
taukskābju daudzumu bija būtiska ietekme uz attiecīgo taukskābju saturu mātes
pienā (F(3, 135)=7.730, p<0.0005), bet n-3 polienepiesātināto taukskābju
gadījumā, uzturam visas trīs dienas pirms parauga ievākšanas bija būtiska
ietekme uz kopējo n-3 polinepiesātināto taukskābju saturu mātes pienā. Ar uzturu
iespējams izskaidrot aptuveni 15% no n-6 polinepiesātināto taukskābju variācijas
mātes pienā (pielāgotais R2=0.147), bet n-3 polinepiesātināto taukskābju
gadījumā – 28 % (pielāgotais R2=0.283).
Page 64
64
Tika konstatēta vidēji cieša pozitīva saistība starp ar uzturu uzņemto
linolskābes daudzumu un attiecīgi linolskābes saturu mātes pienā (ρ=0.302,
p=0.001). Vairāksoļu daudzfaktoru regresijas analīze atklāja, ka ar uzturu
uzņemtais linolskābes daudzums trīs un vienu dienu pirms parauga ievākšanas
būtiski ietekmēja linolskābes saturu mātes pienā, F(3, 135)=8.273, p<0.0005, un
kopumā ar uzturu skaidrojami 14 % no linolskābes satura mainīguma mātes
pienā (pielāgotais R2=0.137).
Saulespuķu eļļas, kā preferenciālās augu eļļas, izvēle uzturā bija saistīta
ar augstāku linolskābes, n-6 polinepiesātināto un kopējo polinepiesātināto
taukskābju saturu, bet zemāku mononepiesātināto, dokozaheksaēnskābes un
n-3 polinepiesātināto taukskābju saturu mātes pienā (8. tabula).
Ar uzturu uzņemtajai α-linolēnskābei bija ietekme uz α-linolēnskābes
saturu mātes pienā (ρ=0.450, p<0.0005). Vairāksoļu daudzfaktoru regresijas
analīze norādīja, ka trīs un vienu dienu pirms parauga ievākšanas ar uzturu
uzņemtajam α-linolēnskābes daudzumam bija būtiska ietekme uz minētās
taukskābes saturu mātes pienā, F(3, 135)=20.230, p<0.0005. Kopumā ar uzturu
iespējams skaidrot 30 % no α-linolēnskābes satura variācijas mātes pienā
(pielāgotais R2=0.295).
Arahidonskābes saturs mātes pienā negatīvi korelēja ar graudaugu,
graudaugu produktu & kartupeļu (ρ=-0.254, p=0.004) un pākšaugu lietošanu
uzturā (ρ=-0.248, p=0.005).
Zivju & jūras velšu lietošana uzturā bijā saistīta ar augstāku
dokozaheksaēnskābes saturu mātes pienā (ρ=0.287, p=0.001). Dalībniecēm,
kuras uzturā lietoja zivis vismaz divas reizes nedēļā bija ievērojami augstāks
dokozaheksaēnskābes saturs mātes pienā (0.50 %), salīdzinot ar dalībniecēm,
kuras zivis uzturā nelietoja (0.30 %) (p=0.001).
Tika konstatēta arī cieša pozitīva saistība starp uzņemto
eikozapentaēnskābes un dokozaheksaaēnskābes daudzumu un
dokozaheksaēnskābes saturu mātes pienā (ρ=0.534, p<0.0005 un ρ=0.570,
p<0.0005). Vairāksoļu daudzfaktoru regresijas analīze apstiprināja, ka ar uzturu
uzņemtajam dokozaheksaēnskābes daudzumam visas trīs dienas pirms parauga
ievākšanas bija būtiska ietekme uz konkrētās taukskābes saturu mātes pienā,
F(3, 134)=13.347, p<0.0005. Kopumā ar uzturu iespējams skaidrot aptuveni
26 % no dokozaheksaēnskābes satura mainīguma mātes pienā
(pielāgotais R2=0.259).
Starp ar uzturu uzņemto trans taukskābju daudzumu un trans taukskābju
saturu mātes pienā netika konstatēta būtiska saistība (ρ=0.167, p=0.056).
Kopumā augstāks trans taukskābju saturs mātes pienā tika novērots dalībniecēm
ar augstāku dzīvnieku izcelsmes produktu patēriņu (ρ=0.283, p=0.001 – olas,
gaļa & gaļas izstrādājumi, ρ=0.193, p=0.029 – zivis & jūras veltes, ρ=0.257,
p=0.003 – piens & piena produkti).
Page 65
65
Elaidīnskābes, kā arī linolelaidīnskābes saturs mātes pienā korelēja ar
piena & piena produktu patēriņu (ρ=0.607, p<0.0005 un ρ=0.436, p<0.0005),
norādot, ka piens & piena produkti ir galvenais trans taukskābju avots mātes
pienā sievietēm Latvijā.
Kalcija saturs mātes pienā bija augstāks tām dalībniecēm, kuras biežāk
atzīmēja tādu produktu lietošanu uzturā kā olas, gaļa & gaļas izstrādājumi
(ρ=0.404, p=0.002), bet netika konstatēta statistiski nozīmīga saistība starp ar
uzturu uzņemto kalcija daudzumu un kalcija saturu mātes pienā (ρ=-0.063,
p=0.642).
Netika konstatēta tieša saistība starp ar uzturu uzņemto magnija
daudzumu un magnija saturu mātes pienā (ρ=-0.160, p=0.235). Vāja, bet
nozīmīga, korelācija tika konstatēta starp magnija saturu mātes pienā un biežāku
zivju & jūras velšu patēriņu (ρ=0.298, p=0.024).
Nātrijs bija vienīgais elements, kura saturs mātes pienā bija tieši atkarīgs
no ar uzturu uzņemtā nātrija un attiecīgi sāls daudzuma, tomēr konstatētā
sakarība nebija cieša (ρ=0.263, p=0.048 un ρ=0.265, p=0.046). Vairāksoļu
daudzfaktoru regresijas analīze atklāja, ka ar uzturu uzņemtajam nātrijam nav
būtiskas, tiešas ietekmes uz nātrija saturu mātes pienā, F(3,61)=1.332, p=0.272.
Citi faktori, piemēram, bērna vecums, laktozes, olbaltumvielu, kalcija, magnija
un kālija saturs mātes pienā potenciāli ietekmē nātrija saturu mātes pienā.
Kālijs ir dominējošais osmotiskā spiediena uzturētājs šūnā, bet nātrijs –
ārpus šūnas. Tas iespējami izskaidro, kādēļ zemāks kālija saturs mātes pienā tika
konstatēts dalībniecēm ar augstāku sāļo uzkodu & “ātro uzkodu” patēriņu
(ρ=-0.316, p=0.017). Tieša saistība starp uzņemto kālija daudzumu ar uzturu un
kālija saturu mātes pienā netika konstatēta (ρ=-0.067, p=0.622).
Cinka saturs mātes pienā pozitīvi korelēja ar uzņemto polinepiesātināto
taukskābju (ρ=0.277, p=0.037), n-6 polinepiesātināto taukskābju (ρ=0.305,
p=0.021) un linolskābes daudzumu (ρ=0.311, p=0.018), bet negatīvi ar
zivju & jūras velšu patēriņu (ρ=-0.265, p=0.046). Netika konstatēta tieša saistība
starp ar uzturu uzņemto cinka daudzumu un cinka saturu mātes pienā (ρ=0.001,
p=0.996).
Lai gan dažas nozīmīgas korelācijas tika konstatētas starp esenciālo
elementu saturu mātes pienu un sievietes uzturu, kopumā secināms, ka ar uzturu
uzņemtajam esenciālo elementu daudzumam nav tiešas ietekmes uz esenciālo
elementu saturu mātes pienā.
Pārējo esenciālo elementu (dzelzs, selēns, mangāns, varš, kobalts, hroms),
kā arī potenciāli toksisko elementu (alumīnijs, niķelis, arsēns, stroncijs,
kadmijs, alva, antimonijs, svins) saturs mātes pienā bija zem metodes
noteikšanas robežas. Attiecīgi nebija iespējams izvērtēt uztura ietekmi uz šo
elementu saturu mātes pienā.
Page 66
66
4. Enerģijas un uzturvielu nodrošinājums ar mātes pienu ekskluzīvi
zīdītiem zīdaiņiem
Lai teorētiski novērtētu vai pētījumā iekļautie ekskluzīvi zīdītie zīdaiņi
(1 līdz 6 mēnešus veci) uzņēma atbilstošu enerģijas un uzturvielu daudzumu,
pētījuma ietvaros iegūti rezultāti par enerģijas vai uzturvielu daudzumu 100 ml
piena tika sareizināti ar vidējo mātes piena patēriņu zīdaiņiem attīstītajās valstīs,
atbilstoši konkrētajam vecuma posmam (dati no Butte, Lopez
Alarcon & Garza, 2002). Pēc tam aprēķinātās vērtības tika salīdzinātas ar
vadlīnijās noteiktajiem enerģijas un uzturvielu daudzumiem (9. tabula).
Pamatojoties uz kalkulācijām, enerģijas nodrošinājums ar mātes pienu
1 līdz 2 mēnešus veciem ekskluzīvi zīdītiem zīdaiņiem bija augstāks nekā
noteikts vadlīnijās. Enerģijas nodrošinājums ar mātes pienu 3 līdz 4 mēnešus
veciem zīdaiņiem bija pietiekams, bet 5 līdz <6 mēnešus veciem zīdaiņiem –
zemāks nekā definēts vadlīnijās (9. tabula).
Olbaltumvielu, tauku un ogļhidrātu (šajā gadījumā laktozes)
uzņemšana ar mātes pienu ekskluzīvi zīdītiem zīdaiņiem bija atbilstoša vadlīnijās
noteiktajam (European Food Safety Authority, 2013) (9. tabula).
Uzņemtais enerģijas daudzums ar linolskābi zīdaiņiem bija ievērojami
augstāks, enerģijas daudzums ar α-linolēnskābi un dokozaheksaēnskābi
nedaudz augstāks, bet arahidonskābes uzņemšana zemāka par vadlīnijās
noteikto, atsaucoties uz Eiropas Pārtikas nekaitīguma iestādes vadlīnijām
(European Food Safety Authority, 2013) (9. tabula).
Ir jāatzīmē, ka individuāli uzņemtais taukskābju daudzums zīdaiņiem ar
mātes pienu ievērojami atšķīrās, jo taukskābju saturu mātes pienā ietekmē ar
uzturu uzņemtais taukskābju daudzums, kas arī ievērojami atšķīrās pētījuma
dalībniecēm.
Pamatojoties uz kalkulācijām, ekskluzīvi zīdīti zīdaiņiem līdz sešu
mēnešu vecumam ar mātes pienu uzņēma atbilstošu kalcija, kālija un magnija
daudzumu (5., 6. un 7. attēls).
Lai gan uzņemtais nātrija un sāls daudzums ar uzturu pētījumā
iesaistītajām sievietēm bija augstāks nekā rekomendēts, bet cinka daudzums –
atbilstoši rekomendācijām, ar mātes pienu uzņemtais nātrija un cinka saturs
ekskluzīvi zīdītiem zīdaiņiem bija zemāks nekā noteikts vadlīnijās (European
Food Safety Authority, 2013) (8. un 9. attēls).
Page 67
67
Jāņem vērā, ka zīdainim dienā nepieciešamo uzturvielu daudzumu var
nodrošināt gan mātes piens, gan mātes organisma iekšējās rezerves (piemēram,
dzelzs gadījumā gestācijas periodā uzkrātās rezerves aknās)
(Butte, Lopez-Alarcon & Garza, 2002; European Food Safety Authority, 2013).
Turpinot analizēt esenciālo elementu nodrošinājumu ekskluzīvi zīdītiem
zīdaiņiem ar mātes pienu, paralēli būtu jānosaka šo elementu saturs ne tikai mātes
pienā, bet arī mātes un zīdaiņa asins plazmā vai serumā.
SECINĀJUMI
1) Pirmo reizi Latvijā ir vispusīgi analizēts taukskābju sastāvs mātes
pienā, sniedzot ieskatu atšķirībās, kas saistītas ar ģeogrāfisko
ietekmi un mātes uztura paradumiem.
2) Dominējošās taukskābes mātes pienā ir palmitīnskābe, oleīnskābe
un linolskābe, nodrošinot ~ 71 % no kopējā taukskābju satura mātes
pienā.
3) Lai gan dokozaheksaēnskābes saturs mātes pienā sasniedza
rekomendēto robežvērtību – 0.30 %, tas krasi atšķīrās analizētajos
mātes piena paraugos (no 0.10 % līdz 4.30 % no kopējā taukskābju
satura).
4) Salīdzinot ar citu valstu pētījumiem, tika konstatēts mazs kopējais
trans taukskābju saturs mātes pienā (<2 %).
5) Noteiktais tauku, olbaltumvielu, laktozes, kalcija, kālija un magnija
saturs mātes pienā bija salīdzināms ar literatūras datiem, bet cinka
un nātrija saturs bija zemāks nekā citu valstu pētījumos.
6) Mātes piens saturēja nenozīmīgu arsēna, kadmija, alvas un svina
daudzumu, nepārsniedzot maksimāli pieļaujamo saturu, kas noteikts
normatīvajos aktos mātes piena aizstājējiem un pārtikai, kas
paredzēta zīdaiņu un mazu bērnu ēdināšanai.
7) Pētījuma dalībnieces ar uzturu uzņēma vairāk tauku, piesātināto
taukskābju un sāls nekā ieteicams, bet nepietiekamā daudzumā tika
uzņemti ogļhidrāti, šķiedrvielas, eikozapentaēnskābe un
dokozaheksaēnskābe, kalcijs, dzelzs, A, D, B1, B2, B9 vitamīni.
8) Uzņemtais uzturvielu (ogļhidrāti, šķiedrvielas, eikozapentaēnskābe
un dokozaheksaēnskābe, kalcijs, dzelzs, A, D, B1, B2, B9 vitamīni)
daudzums pētījuma dalībniecēm skaidrojums ar nepietiekamu
dārzeņu, augļu, ogu, pākšaugu, graudaugu, piena, piena produktu un
zivju patēriņu.
9) Taukskābju uzņemšana ar uzturu ietekmē taukskābju (C≥16)
sastāvu mātes pienā. Arī noteiktu produktu lietošana (piemēram,
zivju, augu eļļas izvēle u.c.) ietekmē taukskābju sastāvu un saturu
mātes pienā.
Page 68
68
10) Makrouzturvielu (tauku, olbaltumvielu, laktozes) un esenciālo
elementu saturs mātes pienā nav atkarīgs no sievietes uztura
zīdīšanas periodā.
11) Pamatojoties aprēķiniem, 1 līdz 6 mēnešus veci ekskluzīvi zīdīti
zīdaiņi ar mātes pienu uzņēma atbilstošu enerģijas, tauku,
olbaltumvielu, ogļhidrātu, α-linolēnskābes, dokozaheksaēnskābes,
kalcija, magnija un kālija daudzumu, bet arahidonskābes, nātrija un
cinka uzņemšana bija mazāka par vadlīnijās noteikto.
12) Izvirzītā pētījuma hipotēze ir apstiprinājusies – mātes uzturs
zīdīšanas periodā var ietekmēt piena sastāvu un nepieciešamo
uzturvielu nodrošinājumu zīdainim.