94
Chatham House Report Laura Wellesley, Jason Eis, Cor Marijs, Caroline Vexler, Florence Waites and Tim G. Benton The Business Case for Investment in Nutrition
Chatham House ReportLaura Wellesley, Jason Eis, Cor Marijs, Caroline Vexler, Florence Waites and Tim G. Benton
The Business Case for Investment in Nutrition

Chatham House ReportLaura Wellesley, Jason Eis, Cor Marijs, Caroline Vexler, Florence Waites and Tim G. Benton Energy, Environment and Resources Programme | July 2020
The Business Case for Investment in Nutrition

Chatham House, the Royal Institute of International Affairs, is a world-leading policy institute based in London. Our mission is to help governments and societies build a sustainably secure, prosperous and just world.
The Royal Institute of International Affairs
Chatham House 10 St James’s Square London SW1Y 4LE T: +44 (0) 20 7957 5700 F: +44 (0) 20 7957 5710 www.chathamhouse.org
Charity Registration No. 208223
Copyright © The Royal Institute of International Affairs, 2020
Chatham House, the Royal Institute of International Affairs, does not express opinions of its own. The opinions expressed in this publication are the responsibility of the author(s).
All rights reserved. No part of this publication may be reproduced or transmitted in any form or by any means, electronic or mechanical including photocopying, recording or any information storage or retrieval system, without the prior written permission of the copyright holder. Please direct all enquiries to the publishers.
ISBN 978 1 78413 404 4
A catalogue record for this title is available from the British Library.
Printed and bound in Great Britain.
Typeset by Soapbox, www.soapbox.co.uk
This report was funded by The Power of Nutrition foundation, which was in turn supported by Anglo American, Bayer, Equinor, Kellogg’s, Kirk Humanitarian, Medela, Olam, Otsuka, Royal DSM and Unilever.
Cover image: Workers at the textile production factory of JayJay Textiles in Addis Ababa, Ethiopia, April 2017. Underweight is a particular problem for business in Ethiopia. In low- and middle-income countries more generally, efforts to tackle malnutrition in all its forms – including both undernutrition and overnutrition – can improve worker productivity and reduce risks to business. Copyright © Michael Gottschalk/Photothek/Getty Images
ii | Chatham House
Contents
Executive Summary iv
1 Introduction 1
2 A Material Cost to Business 9
3 The Missing Link for Sustainable Growth 22
4 The Added Value of Business 29
5 Towards an Action Agenda for Business 43
Annex I: Methodology – Vivid Economics Model 49
Annex II: Additional Results from the Vivid Economics Model 69
Annex III: Methodology – Company Interviews 73
Annex IV: Methodology – Review of Company Reports 78
Abbreviations and Acronyms 81
About the Authors 82
Acknowledgments 84
iii | Chatham House
iv | Chatham House
Executive Summary
Businesses have a vital role to play in improving nutrition, both in the workforce and in the community. Effective action could reduce global deaths from malnutrition and greatly enhance economic productivity.
Malnutrition acts as a brake on the development of individuals, communities and economies around the world. Encompassing both undernutrition (which results in conditions such as stunting and anaemia) and overnutrition (e.g. overweight and obesity),1 malnutrition is the leading cause of death globally, and the leading driver of disability. Malnutrition experienced in childhood has lifelong impacts on cognitive and physical development, as well as on earning potential. It is an intergenerational problem that traps households and communities in a cycle of poverty. Yet progress on tackling malnutrition is stalling. There is chronic underinvestment in potential solutions, while the challenge is becoming more complex.
Previous research has looked at the impacts of poor nutrition on health systems or society at large, but the effects on businesses have gone largely unexplored. This report is the first of its kind to reveal the hidden costs of malnutrition for business, and the extent to which these costs are recognized and addressed by multinational companies (MNCs). It finds that businesses in ‘low- and middle-income’ countries2 collectively lose between $130 billion and $850 billion3 a year through malnutrition-related productivity reductions, equivalent to between 0.4 per cent and 2.9 per cent of those economies’ combined GDP.
In reality, the costs are likely to be much higher. The model developed by Vivid Economics4 for this report looks only at the direct costs of certain forms of malnutrition in the adult workforce in terms of reduced productivity. It does not explore the costs of impaired cognitive development and low educational attainment resulting from undernutrition in childhood, or indirect costs such as paid sick leave for malnutrition-related illness. The study therefore estimates only a share of the total costs, yet still finds that these are in the hundreds of billions of dollars each year.
Despite these substantial impacts, companies routinely overlook or underestimate the cost of malnutrition to their operations and are failing to spot the opportunities to drive action to improve diets and related health outcomes.
1 This report defines ‘malnutrition’ as both undernutrition (wasting, stunting, underweight, micronutrient deficiencies) and overweight/obesity.2 The Vivid Economics model classifies countries according to the World Bank’s four income bands: low-income, lower-middle-income, upper-middle-income and high-income. The 19 countries modelled in this study are from the low-income, lower-middle-income and upper-middle-income bands. For convenience and brevity, we also use the term ‘low- and middle-income’ to refer to these economies (i.e. we define ‘middle-income’ as encompassing both ‘lower-middle’ and ‘upper-middle’ groups). Income levels referred to in other research sources are cited in accordance with the terminology used in each source.3 All dollar figures in this report are US dollars.4 Vivid Economics is a strategic economics consultancy, specializing in analysis and modelling relevant to public policy and commercial decision-making.

The Business Case for Investment in NutritionExecutive Summary
v | Chatham House
The economic costs of malnutrition
The Vivid Economics model estimates the number of workers who are underweight or obese in 13 business sectors across 19 low-, lower-middle- and upper-middle-income countries, and the impact this has on workers’ productivity. It also estimates the prevalence of two other conditions – (a) anaemia and (b) adult short stature as the result of stunting in childhood – in smaller subsets of the same countries,5 again modelling the impact on productivity in the 13 business sectors.
Across the 19 countries studied, the model shows that businesses lose an estimated $8–38 billion per year (equivalent to 0.2–0.9 per cent of GDP) from reduced worker productivity due to employees being underweight, and $4–27 billion per year (0.1–0.6 per cent of GDP) due to obesity. Anaemia (a condition predominantly caused by micronutrient deficiency) is estimated to reduce economic output by an amount equivalent to an additional 0.8 per cent of GDP on average across the five countries where this condition was studied. Short adult stature resulting from childhood stunting (another form of undernutrition) is estimated to cost businesses $3.9 billion per year, or 0.4 per cent of GDP, across the 17 countries where this was studied. Were the indirect impacts of childhood stunting on educational attainment to be included, this would increase by up to 4.5 times to a total cost of 1.8 per cent of GDP.
Of the 19 countries modelled, Ethiopia and India face the highest burdens on business from workers being underweight, while Egypt, Albania and Honduras face the highest burdens due to obesity. A number of countries face a significant ‘double burden’ of malnutrition in the form of high costs associated with both underweight and obese workers, including Ghana, Namibia, Tanzania and Zimbabwe. In Namibia, for example, 10 per cent of the workforce is underweight and 12 per cent obese.
Companies do not understand the problem well
In addition to the economic modelling, Chatham House conducted a desk-based review of the sustainability and annual reports of 180 of the largest MNCs operating in developing countries. We interviewed 19 representatives from 16 of these companies to find out what they thought about the impact of malnutrition on their business, and what they were doing to address it.
Notably, the majority of company representatives did not consider undernutrition to be a material issue. Most thought that undernutrition and its cognitive and physical impacts affected only low-skilled, low-earning staff, and therefore were not likely to be a problem for their skilled and well-educated workers. This assumption is misplaced: our modelling shows that a significant share of the workforce is underweight across all sectors. That said, having underweight workers is a particular problem where manual labour is central to output: on average, the cost of lost productivity due to employees being underweight is equivalent to 1.9 per cent of gross value added (GVA)6 in the agricultural sector, 1.2 per cent in mining and 1.1 per cent in construction.
5 Five countries are modelled for anaemia, 17 for adult short stature. Chapter 2, Box 4 lists the full set of 19 countries, as well as indicating which are used in the estimates for anaemia and adult short stature.6 Gross value added (GVA) is the value of a sector’s net contribution to GDP.

The Business Case for Investment in NutritionExecutive Summary
vi | Chatham House
In contrast to undernutrition, more than half the interviewees said obesity was prevalent in their workforce and represented a significant issue for their company. Most interviewees assumed obesity was more prevalent and more of a material concern than undernutrition, but in fact obese employees are less common than underweight employees across all of the sectors analysed.
Interviewees broadly associated obesity with high-earning and/or skilled workers in sedentary or non-physically demanding occupations. However, our model shows that sectors characterized by physically demanding roles suffer the greatest costs associated with obesity among the workforce: across the 19 countries modelled, the cost of obesity is most concentrated in mining (1.8 per cent of GVA), education and health (0.8 per cent), and household services (0.7 per cent).
The missing link in the SDG agenda
The risks to global business from pervasive malnutrition extend beyond productivity losses. Adequate nutrition is the missing link for sustainable growth and is integral to achieving the Sustainable Development Goals (SDGs). Success in tackling malnutrition in all its forms would have a multiplier effect at both household and economy level, improving health, boosting incomes and stimulating economic development. Failure, on the other hand, would slow long-term economic growth, hinder human capital development, and threaten the long-term viability of corporate investment and market growth in low- and middle-income countries.
The impact of businesses on the health and well-being of stakeholders is also increasingly recognized as a core element of the sustainability agenda, and an area of material risk for institutional investors and asset managers. As investor interest in the nutrition agenda rises, and scrutiny of the role of corporate practices heightens, companies will be under growing pressure to demonstrate a positive impact on the nutritional well-being of their workforces and wider stakeholders.
An opportunity and an imperative for more action
Notwithstanding this report’s judgment that corporate action on nutrition remains insufficient overall, a number of pioneering MNCs are already leading the way on the issue. Over 80 per cent of the 180 companies analysed for this report are taking some measures to tackle malnutrition, whether through partnerships with non-governmental organizations (NGOs) to deliver nutrition programmes, nutrition-focused support to local communities or workplace initiatives aimed at improving nutrition among employees. Food and beverage companies are doing the most; those in other sectors have further to go.
Our interviews revealed that some company executives see action to improve nutrition as beyond the power or remit of individual businesses. However, a number of the driving factors behind malnutrition lie within companies’ direct sphere of influence. Companies can upgrade the food environment in which workers spend a large share of their day, for example, or pay a fair living wage. Progress in other areas may require society-wide collaboration, and companies bringing their resources and expertise to bear on the issue – examples include the development and distribution of micronutrients to support mothers and infants in their first 1,000 days, or nutrition-supporting interventions in health, education, water and sanitation.
Adequate nutrition is the missing link for sustainable growth and is integral to achieving the Sustainable Development Goals

The Business Case for Investment in NutritionExecutive Summary
vii | Chatham House
Recommendations
There is a clear opportunity and business incentive for companies to take more and further-reaching action to tackle malnutrition, which is currently costing them so much, and to be part of the solution to a problem that claims millions of lives a year. Companies have the reach, the expertise and the resources to advance global efforts to overcome malnutrition. There is no reason for them not to act.
And now is the time. Over the next 18 months a series of key international events and moments will give companies the opportunity to signal their commitment to improved nutrition as a core component of their sustainability agendas. In particular, the Tokyo Nutrition for Growth Summit, currently scheduled for December 2020, could be a milestone for new and ambitious corporate action to help meet the SDG 2 nutrition targets by 2025, including financial commitments and pledges to improve workforce nutrition.
As it stands, the evidence base on which to design effective corporate strategies to improve nutrition, both among the workforce and among the wider population, is lacking. In the absence of common reporting frameworks for corporate nutrition-related activities, there is a dearth of examples on which to draw. Those that do exist are rarely subject to robust and independent monitoring and evaluation. More research is required to identify promising avenues for corporate engagement, to test novel programmes and initiatives, and to share experience and expertise through transparent reporting and knowledge exchange.
Despite these challenges, this report identifies three broad areas for corporate engagement to harness existing opportunities for positive action on nutrition and to build the evidence base to inform sustainable and effective strategies in the future.
1. Commit to improving nutritional outcomes among all employees and suppliers, through:
• Implementing group-wide minimum workplace policies on nutrition, such as mandatory nutrition training for employees, healthy workplace canteens, workplace support for breastfeeding mothers, and the inclusion of healthy-eating guidance in well-being programmes;
• Supporting supply chain partners in introducing similar minimum policies, for example through providing resources and guidance to facilitate the delivery of the above policies;
• Working towards alignment with best-practice guidance where available, and in particular working in collaboration with nutrition-focused business initiatives such as the Global Alliance for Improved Nutrition (GAIN) and the SUN Business Network (SBN).
2. Seek out partnerships – with business, government and civil society – to deliver improved nutrition to communities and populations, through:
• Integrating nutrition within existing corporate sustainability programmes, for example through the inclusion of nutrition training and outreach in programmes focused on community health or on water, sanitation and hygiene (WASH);

The Business Case for Investment in NutritionExecutive Summary
viii | Chatham House
• Pooling resources and expertise to deliver large-scale programmes targeting at-risk communities, such as the fortification of staple foods and the distribution of ready-to-use therapeutic foods in emergency situations;
• Committing significant financial resources, including through commitments at the upcoming Tokyo Nutrition for Growth Summit, to support the development, distribution and scale-up of novel and existing nutrition solutions, and to generate momentum for change at scale.
3. Commit to full transparency and good governance around corporate action on nutrition, through:
• Monitoring, evaluating and reporting on all nutrition-related activity, both internally and externally;
• Ensuring full disclosure of conflicts of interest, including around the funding of research and lobbying activities and around partnership arrangements with third-party stakeholders;
• Supporting the integration of nutrition into environmental, social and governance (ESG) frameworks, through full disclosure of data and information to ESG data providers;
• Ensuring food and beverage products are supportive of improved nutrition, not only through compliance with best-practice codes on marketing, but through reformulation and innovation to deliver healthy and affordable food that supports a diverse and nutritious diet.
1 | Chatham House
1. Introduction
Malnutrition has multiple health, economic and societal impacts. It reduces sufferers’ earnings, entrenches poverty and can even make armed conflict more likely – yet businesses often underestimate its risks and costs.
Malnutrition is a global challenge. Around the world, malnutrition has wide-ranging health impacts which are costly to individuals, their families and societies as a whole. The term (see Box 1) encompasses both undernutrition and overnutrition, and includes conditions from stunting and anaemia to overweight and obesity.7 Malnutrition at any stage of life can make people less productive and reduce their ability to cope with disease, negatively affecting their earnings and the well-being of families. Malnutrition in early life can have whole-of-life impacts, as it impairs physical and cognitive development. At a societal level, malnutrition is a drag on inclusive economic growth, increasing the public health burden while hindering the participation of at-risk populations in productive employment and limiting economic output.
Malnutrition arises when an individual’s dietary intake is either deficient or excessive relative to basic energy requirements, or when there is an imbalance of essential nutrients in the diet. Its underlying causes are often complex (Figure 1).
As of this year, 2020:
• One in nine people around the world are hungry or undernourished.• One in three people are overweight or obese.• Almost a quarter of all children under the age of five are stunted.• Overweight and obesity are increasing in nearly all countries of the world.8
The impacts of malnutrition are long-lasting and can pass from generation to generation. The effects of malnutrition experienced by children today will be felt throughout their lifetimes, in a number of ways (Figure 1). Stunting, wasting and overweight/obesity in childhood contribute to lifelong disability and undermine the development of the brain and the body, reducing children’s ability to access and progress within education.9 Childhood malnutrition has long-term negative impacts on physical and mental productive capacity in adulthood,10 resulting in reduced labour productivity (Chapter 2). It also influences a person’s susceptibility to non-communicable diseases throughout life.
Good health is not possible without good nutrition. Nutritional deficiencies are the underlying cause of almost half of all deaths in children under the age of five.11 Poor-quality diets are now both the leading cause of death worldwide12 and the single
7 See, for example, World Health Organization (WHO) (2020), ‘Malnutrition: Key facts’, 1 April 2020, https://www.who.int/news-room/fact-sheets/detail/malnutrition.8 Development Initiatives (2020), 2020 Global Nutrition Report, https://globalnutritionreport.org/ (accessed 18 May 2020).9 Tull, K. (2019), Stunting, Wasting, and Education in Nigeria, K4D Helpdesk Report 540, Brighton, UK: Institute of Development Studies, https://opendocs.ids.ac.uk/opendocs/handle/20.500.12413/14378 (accessed 2 Apr. 2020).10 Halim, N., Spielman, K. and Larson, B. (2015), ‘The economic consequences of selected maternal and early childhood nutrition interventions in low- and lower-middle-income countries: a review of the literature, 2000–2013’, BioMed Central Women’s Health, 15(33), doi: 10.1186/s12905-015-0189-y (accessed 4 Mar. 2020).11 UNICEF (2019), Children, food and nutrition: Growing well in a changing world, The State of the World’s Children, https://www.unicef.org/sowc/ (accessed 4 Mar. 2020).12 Afshin, A., Sur, P. J., Fay, K. A., Cornaby, L., Ferrara, G., Salama, J. S., Mullany, E. C., Abate, K. H., Abbafati, C., Abebe, Z., Afarideh, M., Aggarwal, A., Agrawal, S., Akinyemiju, T., Alahdab, F. et al. (2017), ‘Health effects of dietary risks in 195 countries, 1990-2017: A systematic analysis for the Global Burden of Disease Study 2017’, The Lancet, 393(10184): pp. 1958–72, doi: 10.1016/S0140-6736(19)30041-8 (accessed 4 Mar. 2020).
Childhood malnutrition has long-term negative impacts on physical and mental productive capacity in adulthood

The Business Case for Investment in NutritionIntroduction
2 | Chatham House
most important risk factor in the global burden of disease.13 They are also a significant underlying health issue contributing to heightened mortality from infectious diseases such as COVID-19.14
Malnutrition drives poverty. Stunting in childhood can be expected to reduce an individual’s lifelong earnings by 9 per cent,15 while those who suffered from anaemia in childhood experience an estimated 2.5 per cent loss in hourly earnings owing to lower cognitive skills.16 In turn, poverty drives malnutrition as individuals are unable to earn enough income to purchase nutritious food,17 thus creating a harmful poverty-malnutrition trap.
Box 1: How we define ‘malnutrition’
We use the following terminology and definitions provided by the World Health Organization (WHO):18
Malnutrition: deficiencies or excesses in nutrient intake, imbalance of essential nutrients, or impaired nutrient absorption or utilization (as the result of disease, for example).
Undernutrition: wasting, stunting, underweight, micronutrient deficiencies.
Childhood wasting: low weight-for-height. Often the result of recent and severe weight loss.
Childhood stunting: low height-for-age. The result of chronic or recurrent undernutrition, usually associated with poverty, poor maternal health and poor maternal nutrition.
Underweight: in adults, low weight-for-height; in children, low weight-for-age.
Micronutrient deficiencies: a lack of vitamins and minerals that are essential for body functions.
Overweight/obesity: excessive weight-for-height, resulting from an imbalance between energy consumed (too much) and energy expended (too little).
We also talk in this report about the double burden of malnutrition, which we define as undernutrition and overweight/obesity co-occurring in the same population, household or individual.
13 Development Initiatives (2018), 2018 Global Nutrition Report: Shining a light to spur action on nutrition, https://globalnutritionreport.org/reports/global-nutrition-report-2018/ (accessed 2 Apr. 2020).14 Li, X., Wang, L., Fan, S., Yang, F., Xiang, L., Zhu, J., Shen, B. and Gong, Z. (2020), ‘Clinical characteristics of 25 death cases infected with COVID-19 pneumonia: a retrospective review of medical records in a single medical center, Wuhan, China’, medRxiv, doi: 10.1101/2020.02.19.20025239 (accessed 2 Apr. 2020); Huang, R., Zhu, L., Xue, L., Liu, L., Yan, X., Wang, J., Zhang, B., Xu, T., Ji, F., Zhao, Y., Cheng, J., Wang, Y., Shao, H., Hong, S., Cao, Q. et al. (2020), ‘Clinical findings of patients with coronavirus disease 2019 in Jiangsu Province, China: A retrospective multi-center study’, The Lancet Respiratory Medicine, manuscript draft, https://papers.ssrn.com/sol3/papers.cfm?abstract_id=3548785 (accessed 2 Apr. 2020); and Wang, D., Hu, B., Hu, C., Zhu, F., Liu, X., Zhang, J., Wang, B., Xiang, H., Cheng, Z., Xiong, Y., Zhao, Y., Li, Y., Wang, X. and Peng, Z. (2020), ‘Clinical characteristics of 138 hospitalized patients with 2019 novel coronavirus-infected pneumonia in Wuhan, China’, JAMA, 323: pp. 1061–69, doi: 10.1001/jama.2020.1585 (accessed 2 Apr. 2020).15 Halim et al. (2015), ‘The economic consequences of selected maternal and early childhood nutrition interventions in low- and lower-middle-income countries: a review of the literature, 2000–2013’.16 Horton, S. and Ross, J. (2003), ‘The economics of iron deficiency’, Food Policy, 32(1): pp. 141–43, doi: 10.1016/S0306-9192(02)00070-2 (accessed 4 Mar. 2020).17 Barrett, C., Garg, T. and McBride, L. (2016), ‘Well-being dynamics and poverty traps’, Annual Review of Resource Economics, 8: pp. 303–27, doi: 10.1146/annurev-resource-100815-095235 (accessed 2 Apr. 2020).18 WHO (undated), ‘Malnutrition’, https://www.who.int/health-topics/malnutrition#tab=tab_1 (accessed 18 May 2020); and WHO (2020), ‘Malnutrition: Key facts’ (accessed 18 May 2020).

The Business Case for Investment in NutritionIntroduction
3 | Chatham House
Figure 1: Determinants and outcomes of malnutrition
Sources: Adapted from UNICEF’s Conceptual Framework of the Determinants of Maternal and Child Nutrition, UNICEF (2019), Children, food and nutrition; and UNICEF’s Conceptual Framework of the Determinants of Child Undernutrition, UNICEF (2013), Improving Child Nutrition: The achievable imperative for global progress, https://www.unicef.org/publications/index_68661.html (accessed 13 May 2020).
Businesses are not immune to the impacts of malnutrition. For companies of all sizes operating in low- and middle-income countries where the prevalence of malnutrition is high, the direct costs of malnutrition-related productivity losses are estimated to total between $130 billion and $850 billion a year, equivalent to between 0.4 per cent and 2.9 per cent of the combined GDP of those countries.19 In the longer term, pervasive malnutrition limits the pool of human capital from which employers may draw, while its effects in slowing economic growth and lowering incomes inhibit company earnings by reducing discretionary consumer spending (Figure 2).
19 Based on the results of the Vivid Economics model presented in this report (Chapter 2 and Annex I) and scaled up from the modelled low-, lower-middle- and upper-middle-income countries (19 countries for underweight and obesity, five countries for anaemia, 17 countries for adult short stature) to estimate the total cost for all low- and middle-income countries.
Short-term outcomesIncreased morbidity and mortality
Inadequate feedingNon-age-appropriate feeding,
poor food preparation, consumption and hygiene
practices
Inadequate foodInsu�cient access to breastmilk and nutrition, age-appropriate food and safe drinking water
Unhealthy environmentUnhealthy food
environment, lack of WASH facilities, limited opportunity
for physical activity
Long-term outcomesImpaired physical and cognitive
development, lower educational attainment, lower productivity and wages,
increased morbidity and mortality
Inadequate nutrition Including childhood stunting and wasting, childhood
and adult overweight/obesity, micronutrient deficiencies
Weak governanceSocial, political or economic instability,
weak protection of rights
Social inequalitiesUnequal access to food,
health services, education
Insu�cient resourcesInsu�cient environmental, financial, social or human resources
OUTCOMES
UNDERLYING DETERMINANTS
BASIC DETERMINANTS

The Business Case for Investment in NutritionIntroduction
4 | Chatham House
Figure 2: The costs and risks of malnutrition to business
Source: Authors’ own schematic.
Left unchecked, malnutrition contributes to a risky operating and investment environment for the private sector. Good nutrition is key to the success of many of the Sustainable Development Goals (SDGs) (see Chapter 3), and is essential to driving inclusive and sustainable economic growth. Widespread malnutrition, on the other hand, significantly reduces the resilience of populations to external risks, including infectious disease outbreaks and extreme climate events, and is closely linked to the incidence of social unrest and armed conflict in low-income countries. As governments and businesses alike look to ‘build back better’ in the wake of the COVID-19 pandemic, improving the nutrition of vulnerable communities will be a critical step in mitigating the risk of future economic destabilization on the scale of today’s crisis.
The ability of companies to demonstrate a positive impact on the health and well-being of employees and other stakeholders is a growing concern for institutional investors and asset managers. The sustainable investment agenda is broadening, and the role of business in delivering social goods as well as capital returns is receiving increasing attention. For businesses operating in low- and middle-income countries, particularly those with a high malnutrition burden, failure to address the impact of their policies and practices on the workforce, and on the
Weakened pool of human capital
Suppressed market growth
Lower resilience to health and climate crises
Low productivityHealth-related
absence
Cognitive impacts Physical impacts
Lower skills attainment
Economicinsecurity
Time o� to care for unwell children
Higher morbidityand mortality
Risks to business
Costs to business
Foetal and infant malnutrition
Childhood malnutrition
Adult malnutrition

The Business Case for Investment in NutritionIntroduction
5 | Chatham House
communities in which they are embedded, risks undermining the credibility of their commitments to the sustainability agenda and threatening their social licence to operate.
Despite the costs and long-term risks it creates for business, malnutrition remains an issue under the radar for companies around the world. The costs of malnutrition, in all its forms, appear to be routinely overlooked or underestimated (Chapter 2), and action to improve nutrition is often considered to be beyond the power or remit of individual companies. Private-sector engagement with the global nutrition agenda has been predominantly limited to food and beverage companies.
Companies are nevertheless in a strong position to take action to tackle malnutrition. Certain of the driving factors behind malnutrition lie within companies’ direct spheres of influence: inadequacies in the food environment in which workers spend a large share of their day, for example, or lack of access to a fair living wage. Other problems require society-wide, collaborative action: to improve dietary quality in the first 1,000 days of a child’s life, for example, or to tackle intergenerational cycles of malnutrition and poverty among informal workers. Businesses of all sizes, both small or medium-sized enterprises (SMEs) and multinational companies (MNCs), will need to bring their resources and expertise to bear to effect positive change.
While few are cognizant of the full impact of malnutrition on their business, MNCs are nevertheless implementing a range of strategies that can contribute to improved nutrition. Over 80 per cent of the 180 MNCs sampled for this report are active on nutrition to some degree, whether through alliances with international development partners to deliver nutrition programmes, nutrition-focused corporate social responsibility (CSR) programmes to support local communities, or workplace initiatives aimed at improving nutrition among employees. Some pioneering MNCs are also taking steps towards monitoring and reporting on the impact of their supply chains on nutrition security in low- and middle-income countries.
For companies that have yet to take action on nutrition, engagement and investment in a number of key areas should be a priority. Nutrition-focused CSR and workplace programmes are an important avenue for engagement, as is investment in existing programmes run by third-party organizations and financial commitments through frameworks such as the Global Nutrition for Growth Compact. Commitments to good corporate citizenry – including fair living wages and the full payment of taxes – to create the conditions under which individuals, households and societies can escape the poverty-malnutrition trap are equally important.
Now is the time for an inclusive and ambitious action agenda for business on nutrition. Five years remain to deliver on agreed international nutrition goals in support of SDG 2 (‘zero hunger’) and the wider SDG agenda (Box 2). Yet public investment in nutrition is stalling. Progress made in reducing the prevalence of childhood stunting risks being undone by a global recession resulting from the COVID-19 pandemic, while overweight and obesity are on the rise around the world. The costs of malnutrition for business and society look set to increase, exerting a drag on economic growth.
The next 18 months offer a window of opportunity for renewed corporate engagement. The upcoming Tokyo Nutrition for Growth Summit, currently scheduled for December 2020, will mark a milestone in international efforts to accelerate progress in tackling malnutrition. The UN Food Systems Summit, the UN Framework Convention on Climate Change summit, and the Convention on Biological Diversity

The Business Case for Investment in NutritionIntroduction
6 | Chatham House
summit – all due to take place in 2021 – will also provide moments to champion nutrition in support of the broader sustainability agenda. An upswell of engagement and investment from the private sector – through philanthropic funding, business investments, and nutrition interventions targeting the workforce and wider communities – could help deliver substantive progress on financing and action in support of SDG 2. At the same time, failure to leverage these opportunities risks harming business prospects in low- and middle-income countries for decades to come.
Box 2: SDG 2 and the World Health Assembly targets on nutrition
In 2012, the World Health Assembly agreed to a set of six global nutrition goals, to be achieved by 2025. These goals were as follows:20
1. Achieve a 40 per cent reduction in the number of children under the age of five who are stunted;
2. Achieve a 50 per cent reduction in anaemia in women of reproductive age;
3. Achieve a 30 per cent reduction in low birth weight;
4. Ensure that there is no increase in childhood overweight;
5. Increase the rate of exclusive breastfeeding in the first six months of life, up to at least 50 per cent; and
6. Reduce and maintain the incidence of childhood wasting to less than 5 per cent of national child populations.
In 2015, these targets – and their 2025 delivery deadline – were subsumed into Goal 2 of the SDGs (Target 2.2), as part of the overarching targets to end hunger and all forms of malnutrition by 2030.21
1.1 The scope and focus of this report
This report offers a first-of-its-kind assessment of the scale of malnutrition-related productivity losses in low- and middle-income countries, and of the extent to which these losses are recognized and mitigated by MNCs active in these countries. Our analysis is based on three primary research components:
• A bottom-up calculation of the costs of malnutrition to business in selected countries, using a purpose-built model developed by Vivid Economics. Using data from the Demographic and Health Surveys (DHS) funded by the U.S. Agency for International Development (USAID), this analysis estimates the prevalence of underweight and obesity in 13 economic sectors in 19 low-, lower-middle- and upper-middle-income countries. In addition, the study estimates the prevalence of anaemia and adult short stature in smaller subsets of the same countries. To quantify the impact of malnutrition on labour productivity, the analysis uses established coefficients from the economic and health literature. A simple economic model combines the prevalence data
20 WHO (2014), Global Nutrition Targets 2025, Policy Brief Series, https://www.who.int/nutrition/publications/globaltargets2025_policybrief_overview/en/ (accessed 23 May 2020).21 UN Sustainable Development Goals Knowledge Platform (undated), ‘Sustainable Development Goal 2’, https://sustainabledevelopment.un.org/sdg2 (accessed 23 May 2020).

The Business Case for Investment in NutritionIntroduction
7 | Chatham House
and labour productivity coefficients to estimate the impact of malnutrition on sectoral economic output. For a description of the methodology behind the model, see Annex I.
• Semi-structured interviews with representatives of 16 MNCs across 10 sectors. These interviews, undertaken with 19 individuals in senior human resources and/or sustainability roles across the 16 companies, offer an insight into the manner in which malnutrition is framed by MNCs, the degree to which it is viewed as a material risk to operations, and the ways in which it is addressed both in the workplace and through wider community-based CSR activities. For further information about the interviews and the interview participants, see Annex III.
• A desk-based review of the sustainability and annual reports of 180 of the world’s largest MNCs operating in low- and middle-income countries. This review allows for an analysis of the extent to which nutrition-related activities – in the workplace or in the context of sustainability programmes – are reported at a company level, and of the nature of those reported activities. For further information about the sampling and review of MNC activities on nutrition, see Annex IV.
The structure of the report is as follows:
• Chapter 2 addresses malnutrition as a material cost to business, outlining the channels through which undernutrition and overweight/obesity may affect business. The chapter presents the findings of the Vivid Economics model to give an estimate of the prevalence and cost of malnutrition by sector and by country. Interview responses provide examples of the common disconnect between the perceived and modelled costs of malnutrition in its different forms.
• Chapter 3 explores nutrition as the missing link for sustainable growth, detailing the ways in which improved nutrition is contingent upon, and critical to, success in delivering across the SDG agenda. The chapter also discusses the integration of action on nutrition into social impact and investment risk assessments. Interview responses offer an insight into the importance of the social impact agenda in motivating company-level action on nutrition.
• Chapter 4 discusses the added value that business can bring to global efforts to tackle malnutrition, and the wide scope for corporate action. It also presents the findings of the desk-based review of corporate reports and provides examples of company-level nutrition-focused initiatives.
• Chapter 5 lays out the need for a more ambitious and inclusive action agenda for business on nutrition. It explores why now is an important moment for businesses to engage with the issues, and offers recommendations on how private-sector actors may best deliver improved nutrition and contribute to healthier, more productive and more resilient societies.
1.1.1 Limitations in the scope of this report
This study aims to provide an initial estimation of the scale of the costs to business of malnutrition in low- and middle-income countries, and of the extent to which these costs are recognized and mitigated by the private sector. The scope of our analysis is limited in three important ways.

The Business Case for Investment in NutritionIntroduction
8 | Chatham House
Firstly, the Vivid Economics model estimates the direct costs of the physical impacts of malnutrition among today’s adult workforce. The indirect costs to companies – for example, of additional training and staff turnover, or of employee healthcare – are beyond the scope of the modelling exercise, as are the direct costs of the long-term cognitive impairments associated with malnutrition experienced in childhood. With additional time and resources, these aspects could be integrated into a similar model – with important caveats (discussed in Chapter 2 and Annex I) – and could be expected to increase significantly the total estimate of the costs to business. Our calculation is therefore an underestimate, demonstrating that even partial consideration of the impacts of malnutrition reveals enormous financial implications for business.
Secondly, the semi-structured interviews and desk-based review of corporate reports do not capture the perspectives and activities of SMEs. SMEs play a central role in improving nutrition – they supply the majority of the food consumed worldwide22 – but efforts to engage SMEs in this research proved unsuccessful owing to limited time and capacity among the organizations contacted, and to the absence of comparable online reports and resources. The extension of this research in the future to include SMEs would allow for an interrogation of how different-sized businesses understand and experience the impacts of malnutrition among the workforce and wider society, and would enable a comparison of approaches between foreign-owned and domestically owned businesses. Both exercises would add important value to the existing literature.
Thirdly, our analysis focuses primarily on inadequate dietary intake as a driver of malnutrition. While offering examples of and recommendations for corporate action in other nutrition-relevant areas such as water, sanitation and hygiene (WASH) and education, the study does not explore fully the range of interventions and investments to be made in these areas in support of improved nutrition. Opportunities for investment in these broader areas as a means of tackling malnutrition in general, and undernutrition in particular, are well explored in the existing literature. Further in-depth analysis of the current scale of corporate activity would nevertheless add to our understanding of the role that businesses are and could be playing to address the underlying determinants of malnutrition.
22 Global Alliance for Improved Nutrition (GAIN) (2019), Blended Finance: A New and Promising Approach to Unleash Private Investments in Nutritious Food Value Chains in Frontier Markets, GAIN Discussion Paper Series No. 1, October 2019, https://www.gainhealth.org/sites/default/files/publications/documents/gain-discussion-paper-series-1-blended-finance-october-2019.pdf (accessed 24 May 2020).

9 | Chatham House
2. A Material Cost to Business
Productivity losses resulting from adult underweight and obesity alone are estimated to cost businesses up to $65 billion a year in the 19 countries modelled for this study.
For many companies active in low- and middle-income countries where malnutrition is prevalent among the population, malnutrition can impose a material cost to business operations by compromising the quality of human capital. The potential costs are also high for MNCs with vertically integrated supply chains extending into those countries. A worker’s experience of malnutrition can result in reduced physical and cognitive capacity and ill-health. As such, malnutrition can lead to both presenteeism (reduced productivity at work) and absenteeism (physical absence from the workplace), as indicated by certain among our semi-structured interview participants:
“ We do have some employees who show symptoms of anaemia – they tend to take leave from work.
“ Overweight and obesity often show up as key morbidity and mortality and health risk factors.
“ We believe the quality of nutrition is directly related to the health, performance and productivity of our workforce.
Presenteeism and absenteeism in turn reduce the capacity of the workforce and so contribute both to reduced economic output and to increased firm costs in the form of increased sickness absence, healthcare expenditure, staff turnover, early retirement and staff training (Figure 3). Aggregated up to sector level, the costs of malnutrition can be significant.
Figure 3: The impact channel framework summarizes the mechanisms by which malnutrition imposes costs on business
Source: Vivid Economics.
Worker malnutrition
Childhood malnutrition
Presenteeism
Reduced workforce capacity
Firm costs
Absenteeism
Sector performance
Upstream sector performance
Downstream sector performance
Morbidity/mortality
Physical and cognitive capacity
Physical development
Channel of impactFeedbacks/traps

The Business Case for Investment in NutritionA Material Cost to Business
10 | Chatham House
Table 1: The scale and cost of malnutrition-related productivity losses
Form of malnutrition
Impact channel Estimated cost to business in modelled countries, US$
Adult underweight
Underweight reduces the physical and cognitive capacity of workers, which impairs labour productivity. Impacts may be more severe among manual workers and among individuals in physically demanding roles. Extensive literature shows that in low-income or middle-income countries, worker output and wages increase as body mass index (BMI) increases towards a healthy weight, meaning that underweight adults are less productive and earn less than those of a healthy weight.23
$8–38 billion per annum
Obesity Obesity can lead to difficulties in performing physical tasks or completing tasks on time,24 and is associated with both reductions in productivity and increases in ill-health-related absence from work.25 While the vast majority of studies into the impact of obesity on the workforce have centred on developed-country settings, two studies were undertaken in China during the period of that country’s nutrition transition towards more ‘Western’ diets, when there was a rapid increase in the prevalence of overweight and obesity while the population was still experiencing food insecurity. These studies found obesity to have negative labour market impacts, consistent with the developed-country literature.26
$4–27 billion per annum
Anaemia Micronutrient deficiencies at any stage of life can have implications for productive capacity and cognition, and are particularly impactful during the early formative stages of growth. Our model focuses on anaemia (iron or vitamin B12 deficiency). Anaemia reduces worker productivity, even when workers are consuming sufficient calories.27 It causes fatigue and lethargy, impairs physical capacity and work performance,28 and has been associated with a 17 per cent reduction in productivity among those performing heavy manual labour.29 Female workers are significantly more likely than their male counterparts to suffer from micronutrient deficiencies, even within the same occupation. This is due both to biological differences30 (the risk of iron deficiency is heightened by menstrual blood loss and pregnancy) and to the status of women within households (and the implications for the division of available food).31
$21.8 billion per annum32
23 Carrillo, B. and Charris, C. A. (2017), ‘New evidence of the effect of body weight on labor market outcomes in a developing country’, Economic Research and Planning, 47 (2), pp. 177–96. (accessed 2 Apr. 2020); Lafave, D. and Thomas, D. (2017), ‘Height and cognition at work: labour market productivity in a low-income setting’, Economic Human Biology, pp. 52–64, doi: 10.1016/j.ehb.2016.10.008 (accessed 2 Apr. 2020); and Kedir, A. M. (2013), ‘Schooling, BMI, Height and Wages: Panel Evidence on Men and Women’, Economic Issues, 18 (2): pp. 1–18, http://www.economicissues.org.uk/Files/2013/ 213Kedir.pdf?LMCL=W2m_DH (accessed 2 Apr. 2020).24 OECD (2016), Health at a Glance: Europe 2016: State of Health in the EU Cycle, Paris: OECD Publishing, doi: 10.1787/9789264265592-en (accessed 2 Apr. 2020).25 Goettler, A., Grosse, A. and Sonntag, D. (2017), ‘Productivity loss due to overweight and obesity: a systematic review of indirect costs’, BMJ Open, 7(10): e014632, doi: 10.1136/bmjopen-20156-014632 (accessed 4 Mar. 2020).26 Luo, M. and Zhang, C. (2012), ‘Non-Linear relationship between Body Mass Index and labour market outcomes: new evidence from China’, CFPS Working Paper, pp. 13–103, https://mpra.ub.uni-muenchen.de/42683/ (accessed 2 Apr. 2020); and Shimokawa, S. (2011), ‘The labour market impact of body weight in China: a semiparametric analysis’, Applied Economics, 40(8): pp. 37–41, doi:10.1080/00036840600771239 (accessed 2 Apr. 2020).27 Horton and Ross (2003), ‘The economics of iron deficiency’; and Weinberger, K. (2003), ‘The impact of micronutrients on labor productivity: evidence from rural India’, paper presented at the 25th International Conference of Agricultural Economists, 16 August 2003, Durban, South Africa, doi: 10.22004/ag.econ.25897 (accessed 2 Apr. 2020).28 WHO (2012), Global Nutrition Targets 2025: Anaemia Policy Brief, Geneva: WHO, https://apps.who.int/iris/bitstream/handle/10665/148556/WHO_NMH_NHD_14.4_eng.pdf?ua=1 (accessed 6 Apr. 2020).29 Horton and Ross (2003), ‘The economics of iron deficiency’.30 Coad, J. and Conlon, C. (2011), ‘Iron deficiency in women: assessment, causes and consequences’, Current Opinion in Clinical Nutrition and Metabolic Care, 14(6): pp. 625–34, doi: 10.1097/MCO.0b013e32834be6fd (accessed 2 Apr. 2020).31 Harris-Fry, H., Shrestha, N., Costello, A. and Saville, N. M. (2017), ‘Determinants of intra-household food allocation between adults in South Asia – a systematic review’, International Journal for Equity in Health, 16(1): p. 107, doi: 10.1186/s12939-017-0603-1 (accessed 2 Apr. 2020).32 This is the aggregate cost across the five countries modelled for anaemia (Albania, Ethiopia, India, Namibia and Zimbabwe). India alone accounts for $20.5 billion of this total aggregated cost.

The Business Case for Investment in NutritionA Material Cost to Business
11 | Chatham House
Form of malnutrition
Impact channel Estimated cost to business in modelled countries, US$
Adult short stature, resulting from stunting in childhood
Stunting in childhood contributes to lifelong disability, impairs physical and cognitive development, and reduces a child’s ability to access and progress within education.33 Our model looks at short adult stature, of which childhood stunting is a direct cause.34 Individuals who were stunted in childhood are likely to suffer from lower cognitive and physical capacity in adulthood, and to earn less.35
$3.9 billion per annum36
The Vivid Economics model, developed for the purposes of this study, estimates the direct costs of malnutrition – adult underweight, obesity and anaemia, together with the lasting physical impacts of stunting experienced in childhood – for 13 sectors across a maximum of 19 low-, lower-middle- and upper-middle-income countries. Collectively across the 19 countries, adult underweight alone is estimated to cost businesses between $8 billion and $38 billion a year, while obesity costs an additional $4 billion to $27 billion (Table 1). Not accounted for in this estimate are the indirect costs of such losses, for example of additional staff or replacement workers, paid sick leave for malnutrition-related illness, and associated healthcare costs for companies that offer private insurance for employees.
The extent of losses and costs at a company level depends on multiple factors, including the prevalence of malnutrition among the local population (Box 3), the nature of employment (manual labour or desk-based labour, for example), and the extent to which the company’s output depends on human labour as opposed to capital assets (e.g. equipment and machinery). The demography of the workforce will also have a bearing, as certain demographic groups are more vulnerable than others to malnutrition and its health impacts – so, too, will workers’ socioeconomic and ethnic backgrounds.37 But all companies, regardless of sector, are likely to suffer the economic effects of at least one form of malnutrition.
33 Galasso, E. and Wagstaff, A. (2016), The Economic Costs of Stunting and How to Reduce Them, World Bank Policy Research Note, pubdocs.worldbank.org/en/536661487971403516/PRN05-March2017-Economic-Costs-of-Stunting.pdf (accessed 23 May 2020); and McGovern, M. E., Krishna, A., Aguayo, V. M. and Subramanian, S. V. (2017), ‘A Review of the Evidence Linking Child Stunting to Economic Outcomes’, International Journal of Epidemiology, 46(4): pp. 1171–91, doi: 10.1093/ije.dyx017 (accessed 23 May 2020).34 Dewey, K. G. and Begum, K. (2011), ‘Long-term consequences of stunting in early life’, Maternal and Child Nutrition, 7(s3), doi: 10.1111/j.1740-8709.2011.00349.x (accessed 24 May 2020).35 Galasso and Wagstaff (2016), The Economic Costs of Stunting and How to Reduce Them; and McGovern, Krishna, Aguayo and Subramanian (2017), ‘A Review of the Evidence Linking Child Stunting to Economic Outcomes’.36 Costs associated with adult short stature, the proxy used for the experience of childhood stunting in the model. Estimated for 17 of the 19 countries (Côte d’Ivoire and India are excluded owing to data limitations).37 Traissac, P., El Ati, J., Gartner, A., Ben Gharbia, H. and Delpeuch, F. (2016), ‘Gender inequalities in excess adiposity and anaemia combine in a large double burden of malnutrition gap detrimental to women in an urban area in North Africa’, Public Health Nutrition, 19(8): pp. 1428–37, doi: 10.1017/S1368980016000689 (accessed 24 May 2020); and Mazariegos, M., Kroker-Lobos, M. F. and Ramírez-Zea, M. (2019), ‘Socio-economic and ethnic disparities of malnutrition in all its forms in Guatemala’, Public Health Nutrition, pp. 1–9, doi: 10.1016/S1368980019002738 (accessed 24 May 2020).
The Business Case for Investment in NutritionA Material Cost to Business
12 | Chatham House
Box 3: The new nutrition reality
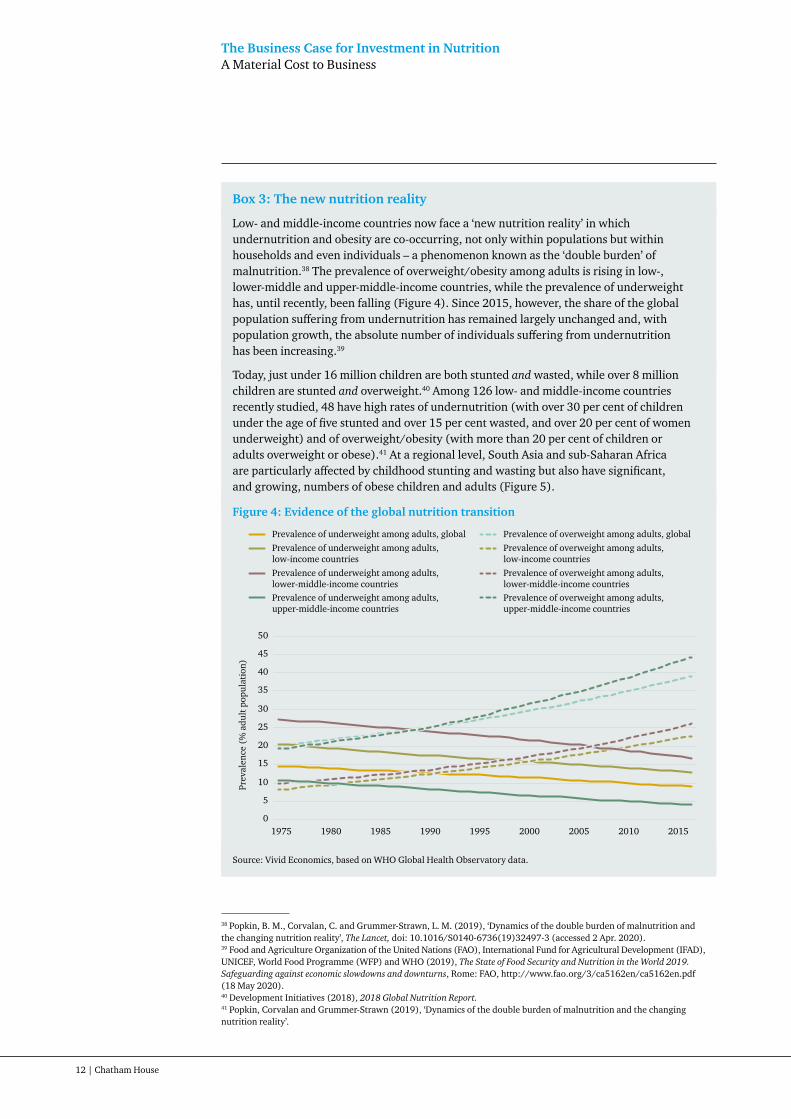
Low- and middle-income countries now face a ‘new nutrition reality’ in which undernutrition and obesity are co-occurring, not only within populations but within households and even individuals – a phenomenon known as the ‘double burden’ of malnutrition.38 The prevalence of overweight/obesity among adults is rising in low-, lower-middle and upper-middle-income countries, while the prevalence of underweight has, until recently, been falling (Figure 4). Since 2015, however, the share of the global population suffering from undernutrition has remained largely unchanged and, with population growth, the absolute number of individuals suffering from undernutrition has been increasing.39
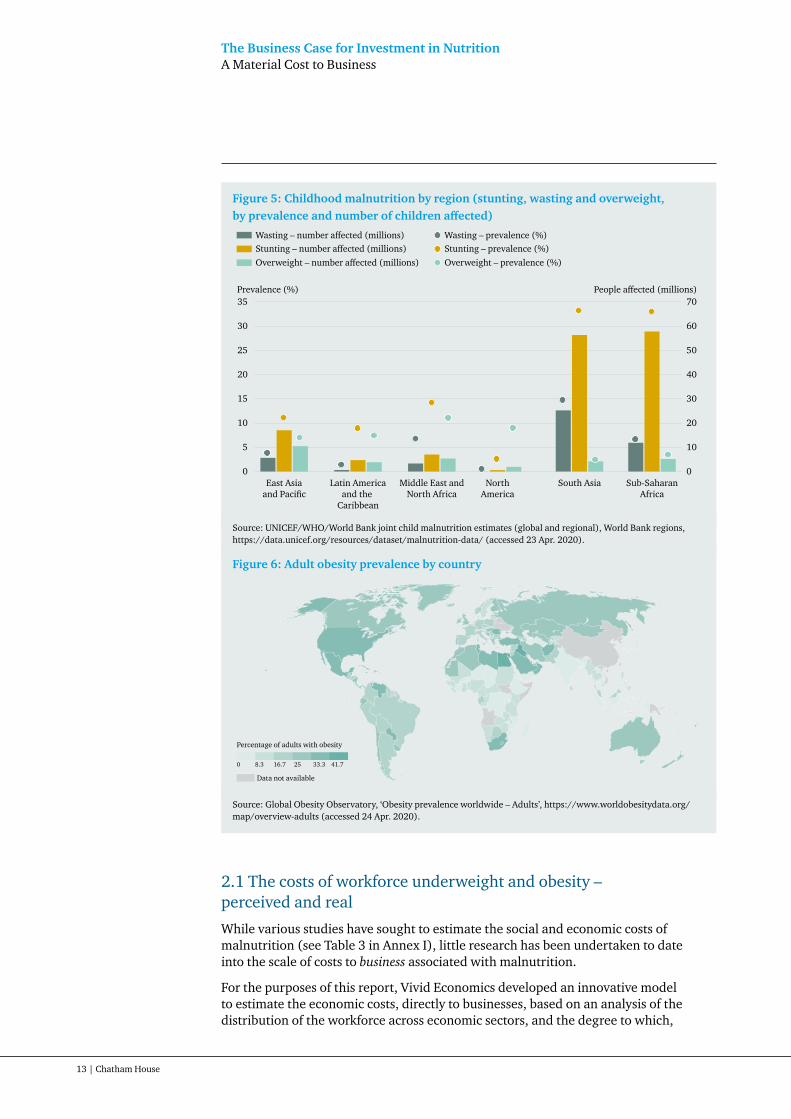
Today, just under 16 million children are both stunted and wasted, while over 8 million children are stunted and overweight.40 Among 126 low- and middle-income countries recently studied, 48 have high rates of undernutrition (with over 30 per cent of children under the age of five stunted and over 15 per cent wasted, and over 20 per cent of women underweight) and of overweight/obesity (with more than 20 per cent of children or adults overweight or obese).41 At a regional level, South Asia and sub-Saharan Africa are particularly affected by childhood stunting and wasting but also have significant, and growing, numbers of obese children and adults (Figure 5).
Figure 4: Evidence of the global nutrition transition
Source: Vivid Economics, based on WHO Global Health Observatory data.
38 Popkin, B. M., Corvalan, C. and Grummer-Strawn, L. M. (2019), ‘Dynamics of the double burden of malnutrition and the changing nutrition reality’, The Lancet, doi: 10.1016/S0140-6736(19)32497-3 (accessed 2 Apr. 2020).39 Food and Agriculture Organization of the United Nations (FAO), International Fund for Agricultural Development (IFAD), UNICEF, World Food Programme (WFP) and WHO (2019), The State of Food Security and Nutrition in the World 2019. Safeguarding against economic slowdowns and downturns, Rome: FAO, http://www.fao.org/3/ca5162en/ca5162en.pdf (18 May 2020).40 Development Initiatives (2018), 2018 Global Nutrition Report.41 Popkin, Corvalan and Grummer-Strawn (2019), ‘Dynamics of the double burden of malnutrition and the changing nutrition reality’.
Prev
alen
ce (
% a
dult
pop
ulat
ion)
1975 1980 1985 1990 1995 2000 2005 2010 2015
Prevalence of underweight among adults, global Prevalence of overweight among adults, globalPrevalence of underweight among adults,low-income countries
Prevalence of overweight among adults,low-income countries
Prevalence of underweight among adults,lower-middle-income countries
Prevalence of overweight among adults,lower-middle-income countries
0
5
10
15
20
25
30
35
40
45
50
Prevalence of underweight among adults, upper-middle-income countries
Prevalence of overweight among adults, upper-middle-income countries
The Business Case for Investment in NutritionA Material Cost to Business
13 | Chatham House
Figure 5: Childhood malnutrition by region (stunting, wasting and overweight, by prevalence and number of children affected)
Source: UNICEF/WHO/World Bank joint child malnutrition estimates (global and regional), World Bank regions, https://data.unicef.org/resources/dataset/malnutrition-data/ (accessed 23 Apr. 2020).
Figure 6: Adult obesity prevalence by country
Source: Global Obesity Observatory, ‘Obesity prevalence worldwide – Adults’, https://www.worldobesitydata.org/map/overview-adults (accessed 24 Apr. 2020).
2.1 The costs of workforce underweight and obesity – perceived and real
While various studies have sought to estimate the social and economic costs of malnutrition (see Table 3 in Annex I), little research has been undertaken to date into the scale of costs to business associated with malnutrition.
For the purposes of this report, Vivid Economics developed an innovative model to estimate the economic costs, directly to businesses, based on an analysis of the distribution of the workforce across economic sectors, and the degree to which,
East Asiaand Pacific
Latin Americaand the
Caribbean
Middle East andNorth Africa
NorthAmerica
South Asia Sub-SaharanAfrica
Prevalence (%) People a�ected (millions)
Overweight – number a�ected (millions)Stunting – number a�ected (millions)Wasting – number a�ected (millions)
0
5
10
15
20
25
30
35
0
20
10
30
40
50
60
70
Overweight – prevalence (%)Stunting – prevalence (%)Wasting – prevalence (%)
41.78.3 0 16.7 25 33.3
Percentage of adults with obesity
Data not available
The Business Case for Investment in NutritionA Material Cost to Business
14 | Chatham House
within sectors, the workforce suffers from a measurable indicator of malnourishment (Box 4). In parallel, our interviews with representatives from MNCs sought to gauge perceptions of malnutrition as a material risk – or otherwise – to their operations.
What emerges from both analyses is a marked disconnect between the perceived and real scale of the malnutrition burden at company level. Below we discuss some of the key findings; further findings from the Vivid Economics model can be found in Annex II.
Box 4: The Vivid Economics model
The Vivid Economics model, developed for this report, combines household survey data on malnourishment and occupation with economic data from the International Labour Organization to calculate the potential economic output lost as a result of malnutrition. The model estimates the losses due to underweight and obesity for 13 sectors across 19 low-, lower-middle- and upper-middle-income countries.42 The lost output associated with two other conditions – anaemia and adult short stature – is also calculated in 13 sectors, but for five countries and 17 countries respectively owing to data limitations (see below). The model is a static model of a country’s economy and estimates the additional benefit that would arise if the workforce changed from its current state of malnourishment to being well-nourished, without any subsequent change in the way the economy is structured. It is not a dynamic model, and cannot estimate how changes in childhood nutrition would manifest in labour availability across skilled and unskilled occupations and economic output in subsequent decades.
The model uses physical indicators to identify the outcomes of malnourishment, rather than using indicators of an individual’s intake of energy or nutrients. Physical indicators can reflect many factors beyond food intake alone – poor water, sanitation and hygiene conditions, for example, or lack of access to health services – that can exacerbate the health issues caused by inadequate nutrition.
It is important to note that the modelling exercise offers only an initial exploration into the impacts of childhood stunting on adult workers. Our modelling is limited to the physical impacts of childhood stunting on adult height, using adult short stature as a crude proxy for the experience of stunting in childhood. Further research is required to fully understand – and quantify – the static and dynamic impacts of childhood stunting, and childhood malnutrition more broadly, on labour productivity, human capital development and economic growth.
The indicators of malnutrition included in the model are:
• Underweight arising from chronic hunger: as proxied by low body mass index (BMI);43
• Obesity: as measured by high BMI;
• Anaemia: as measured by altitude-adjusted blood haemoglobin levels;44
42 The 19 countries included are: Albania, Bangladesh, Cambodia, Côte d’Ivoire, the Dominican Republic, Egypt, Ethiopia, Ghana, Guatemala, Honduras, India, Mozambique, Namibia, Nepal, Pakistan, Rwanda, Tanzania, Zambia and Zimbabwe.43 Body mass index (BMI) is a measure of nutritional status in adults. It is defined as a person’s weight in kilogrammes divided by the square of the person’s height in metres (kg/m2). WHO (2019), ‘Body mass index – BMI’, http://www.euro.who.int/en/health-topics/disease-prevention/nutrition/a-healthy-lifestyle/body-mass-index-bmi (accessed 6 Apr. 2020).44 Women with levels below 120 g/dL and men with levels below 130 g/dL are considered anaemic. WHO (2011), Haemoglobin concentrations for the diagnosis of anaemia and assessment of severity, Vitamin and Mineral Nutrition Information System, http://www.who.int/vmnis/indicators/haemoglobin.pdf (accessed 6 Apr. 2020).

The Business Case for Investment in NutritionA Material Cost to Business
15 | Chatham House
• Physical impacts of childhood stunting: as proxied by short adult stature.45, 46
The estimated proportion of current adult workers suffering from malnutrition is combined with the proportion of current adult workers estimated to have experienced the physical effects of childhood malnutrition, along with productivity coefficients sourced from academic studies, to estimate the loss in workforce productivity by sector as a result of malnutrition. Productivity coefficients reflect reduced workforce productivity (i.e. reflecting lack of stamina, strength, concentration) while people are at work, a phenomenon also known as ‘presenteeism’. Presenteeism increases direct costs to employers as a result of this lower productivity, and affects the private sector more generally by reducing sector-wide output potential. The reduction in output has consequences for other sectors which supply into the focal sector or take outputs from the focal sector.
Given the inputs (estimates of the prevalence of malnutrition, the labour productivity coefficients, and the distribution of labour across the workforce), the model estimates the increase in output that would occur, without changing the structure of the economy, were each sector’s workers to have full productive capacity without malnutrition.
The Vivid Economics model covers 19 low-, lower-middle- and upper-middle-income countries and 13 sectors, as follows:
45 Based on the expected healthy height of 19-year-olds, with women shorter than 150.1 cm and men shorter than 161.9 cm considered stunted. WHO (2007), ‘Height-for-age (5-19 years)’, https://www.who.int/growthref/who2007_height_for_age/en/ (accessed 6 Apr. 2020).46 Estimates of childhood malnutrition rates in previous cohorts indicate higher rates of malnutrition than the estimates in this study that use the adult short stature proxy. However, it is impossible to determine if children who were malnourished enter the labour force at all, or in which sectors, using cohort prevalence alone. While no physical markers can perfectly indicate whether an adult experienced malnutrition as a child, there is research indicating that childhood nutrition is an important factor in adult height. While this indicator may not capture many adults who experienced childhood malnutrition and later entered the labour force, it is a useful partial proxy for the minimum cost of childhood malnutrition on today’s workers, indicating the magnitude of costs which childhood malnutrition imposes on individuals and society as a whole.
Countries
• Europe: Albania*• Asia: Bangladesh, Cambodia,
India*, Nepal, Pakistan• North Africa: Egypt• Sub-Saharan Africa: Côte d’Ivoire,
Ethiopia*, Ghana, Mozambique, Namibia*, Rwanda, Tanzania, Zambia, Zimbabwe*
• Central America: Dominican Republic, Guatemala, Honduras
Sectors
• Agriculture• Construction• Education/health• Electricity• Financial/insurance• Household services• Information and communications• Manufacturing• Mining• Professional services (including
real estate activities, and scientific and technical activities)
• Retail/trade• Transportation• Water/sewerage
Note: Countries marked with an asterisk are those for which we modelled the cost of workforce anaemia. The two countries in italics – India and Côte d’Ivoire – are countries for which the cost of childhood stunting experienced by today’s workforce is not modelled. The non-inclusion of these countries is due to insufficient data.

The Business Case for Investment in NutritionA Material Cost to Business
16 | Chatham House
2.1.1 Underweight
As noted in Table 1, underweight (proxied by low BMI) reduces the physical and cognitive capacity of workers, particularly those involved in physically demanding roles. Undernutrition (defined for the purposes of the interviews as comprising underweight and micronutrient deficiencies) was not considered by interview participants to be a material issue for their business. For the most part, participants were confident that their company would not come into contact with segments of the population among whom undernutrition is common and who suffer from its cognitive and physical impacts, since the educational and skills barrier for employment in the company would be prohibitively high:
“ The company’s own employees are white-collar workers, they have more education, and are better-off.
“ Our employees are highly skilled workers, so it’s not an issue.
“ Because we recruit the most highly educated, we don’t see nutritional issues as much.
Participants consistently indicated their belief that undernutrition affected only low-skilled, low-earning workers who, for the majority of companies interviewed, either form a small share of the salaried workforce, are employed as contractors, or are employed by upstream suppliers:
“ Income-related malnutrition should not be an issue in our workforce, except there may be other compounding variables.
“ It is unlikely to be a big issue within the four walls of the company, since we pay well above our peers and well above the minimum wage.
Only one interviewee noted any prevalence among employees of underweight, and this was attributed to an aesthetic desire to be ‘skinny’.
Contrary to these perceptions, a significant share of the workforce in the 19 modelled countries is estimated to be suffering from underweight, across all sectors, including those represented by the interview participants. While MNCs may employ individuals less exposed to malnutrition, their operations rely on supply chains along which exposure is likely. On average, 15 per cent of workers in the mining sector in the 19 countries are likely to be underweight, together with 12 per cent in the manufacturing sector, 10 per cent in the retail and trade sector, and 8 per cent in the professional services sector (Annex II – Figure 17).
Underweight is particularly prevalent among sectors where a significant share of the workforce is engaged in low-skilled, low-earning and heavy manual labour, such as agriculture, construction and mining. At country level, the rates of underweight among the workforce reflect population-level rates: countries in South and Southeast Asia are particularly affected, as is Ethiopia, where 28 per cent of the overall workforce is estimated to be underweight (as compared with just 2 per cent in Guatemala) (Annex II – Figure 17). Workforce underweight results in particularly high costs to business (in terms of losses to the gross value added (GVA) of the sector) where overall output is dependent to a large degree on the productive capacity of manual labourers: agricultural businesses in Ethiopia, for example, where the sector is minimally mechanized, or the mining sector in India (Figure 7).

The Business Case for Investment in NutritionA Material Cost to Business
17 | Chatham House
Figure 7: The cost of underweight in the workforce (as a proportion of GVA, %)
Note: The absolute cost to business is estimated by modelling potential sector GVA in the hypothetical instance of no malnutrition and comparing it to current sector GVA. The relative cost is calculated by dividing the absolute cost to the sector by the potential sector GVA in the no-malnutrition instance. Grey cells indicate sectors with too few data points to estimate sectoral prevalence, and hence calculate loss.Source: Vivid Economics.
2.1.2 Obesity
In contrast to undernutrition, obesity was recognized by over half of participants (11 of the 19) as a significant issue for their company, and was noted as prevalent in their workforces in countries across low- and middle-income regions. In fact, obesity was assumed to be more prevalent – and more of a material concern – than undernutrition:
“ The issues are mainly in overnutrition.
“ Within our company, there is a tendency more towards overweight, rather than underweight.
“ Obesity and overweight are certainly an issue across the board.
“ We have more problems with overnutrition rather than malnutrition.
Agr
icul
ture
Min
ing
Man
ufac
turi
ng
Elec
tric
ity
Wat
er/s
ewer
age
Con
stru
ctio
n
Ret
ail/
trad
e
Tran
spor
tati
on
Info
and
com
ms
Fina
ncia
l/in
sura
nce
Prof
essi
onal
ser
vice
s
Hou
seho
ld s
ervi
ces
Educ
atio
n/he
alth
All
sect
ors
Albania 0.23 0.31 0.07 0.05 0.08 0.07 0.01 0.01 0.08 0.13 0.02 0.12 0.34 0.11
Bangladesh 0.22 0.09 0.09 0.48 0.00 0.80 0.07 0.41 0.64 0.07 0.54 1.21 0.29
Cambodia 1.17 0.36 0.23 0.20 0.40 0.32 0.02 0.07 0.09 0.05 0.20 0.82 0.60
India 2.20 2.01 0.51 0.18 0.65 1.44 0.12 0.43 0.15 0.15 0.20 1.01 1.07 0.88
Nepal 0.61 1.73 0.05 0.06 0.15 0.10 0.04 0.11 0.19 0.22 0.13 0.49 1.03 0.40
Pakistan 3.00 0.28 0.10 0.05 0.05 0.65 0.03 0.02 0.06 0.04 0.07 0.39 0.39 0.48
Egypt 0.06 0.02 0.00 0.00 0.00 0.00 0.03 0.00 0.00 0.02 0.00 0.02 0.03 0.02
Côte d’Ivoire 0.26 0.08 0.20 0.05 0.18 0.02 0.15 0.27 0.64 0.12 0.07 0.24
Ethiopia 2.80 2.77 0.90 0.06 0.14 0.64 0.24 0.17 0.14 0.38 0.12 0.60 1.77 1.59
Ghana 0.98 0.63 0.45 0.15 0.43 0.30 0.56 0.11 0.16 0.22 0.14 0.35 0.50 0.53
Mozambique 0.76 0.10 0.12 0.04 0.10 0.29 0.50 0.08 0.10 0.04 0.10 0.73 0.72 0.38
Namibia 1.58 1.78 0.26 0.20 0.20 0.15 0.19 0.11 0.19 0.15 0.03 1.51 0.99 0.60
Rwanda 0.84 0.84 0.22 0.18 0.47 0.33 0.30 0.23 0.18 0.28 0.10 0.81 0.74 0.56
Tanzania 1.11 1.61 0.26 0.10 0.09 0.56 0.29 0.16 0.11 0.39 1.23 0.64 1.32 0.81
Zambia 1.17 0.92 0.16 0.19 0.19 0.31 0.04 0.17 0.12 0.24 0.65 0.62 0.41
Zimbabwe 1.02 0.74 0.19 0.11 0.28 0.68 0.40 0.22 0.20 0.67 0.15 0.75 0.69 0.44
Dominican Republic 0.39 0.99 0.14 0.06 0.26 0.21 0.05 0.07 0.05 0.21 0.01 0.09 0.55 0.16
Guatemala 0.51 0.49 0.12 0.03 0.22 0.21 0.12 0.26 0.03 0.13 0.04 0.42 0.41 0.21
Honduras 0.66 0.72 0.18 0.09 0.20 0.11 0.11 0.12 0.34 0.16 0.03 0.46 0.52 0.29
All modelled countries 1.91 1.17 0.37 0.15 0.46 1.12 0.15 0.29 0.11 0.14 0.18 0.50 0.94

The Business Case for Investment in NutritionA Material Cost to Business
18 | Chatham House
According to the model estimates, obesity is less prevalent overall than underweight across all 13 sectors (see Annex II – Figures 17 and 18). At country level, obesity is significantly more prevalent than underweight among the workforce in each of the 13 modelled sectors in Albania, Egypt, the Dominican Republic, Guatemala and Honduras, as well as slightly more prevalent overall in Ghana (8 per cent for obesity compared with 6 per cent for underweight), Namibia (12 per cent versus 10 per cent) and Zimbabwe (8 per cent versus 7 per cent) (Annex II – Figures 17 and 18).
A number of participants referred implicitly to the ‘nutrition transition’ (as diets become richer in meat and dairy, processed foods, and high-salt and -sugar foods, for example), with observations of increasing prevalence of obesity, and its co-occurrence with undernutrition, in countries in sub-Saharan Africa, South and Central America, and South and Southeast Asia.
“ We see the double burden of overnutrition and undernutrition – and the lack of micronutrients for those who are overweight. Central America, India and the US are places where overnutrition and the associated non-communicable diseases are becoming big issues.
“ Africa has a huge problem of obesity and overweight, and we try to reflect this.
Figure 8: The relative cost of workforce underweight and obesity
Note: The darker the shade of ochre, the more costly underweight is to the sector relative to obesity. The darker the shade of aqua, the more costly obesity is to the sector relative to underweight. White indicates that underweight and obesity are equally costly to the sector. Grey cells indicate sectors with too few data points to estimate sectoral prevalence, and hence calculate loss.Source: Vivid Economics.
Agr
icul
ture
Min
ing
Man
ufac
turi
ng
Elec
tric
ity
Wat
er/s
ewer
age
Con
stru
ctio
n
Ret
ail/
trad
e
Tran
spor
tati
on
Info
and
com
ms
Fina
ncia
l/in
sura
nce
Prof
essi
onal
ser
vice
s
Hou
seho
ld s
ervi
ces
Educ
atio
n/he
alth
All
sect
ors
Albania
Bangladesh
Cambodia
India
Nepal
Pakistan
Egypt
Côte d’Ivoire
Ethiopia
Ghana
Mozambique
Namibia
Rwanda
Tanzania
Zambia
Zimbabwe
Dominican Republic
Guatemala
Honduras
All modelled countries

The Business Case for Investment in NutritionA Material Cost to Business
19 | Chatham House
This was borne out to an extent by the model estimates: Ghana, Namibia, Tanzania and Zimbabwe are all countries in which businesses are suffering relatively high costs from both workforce underweight and workforce obesity (Figure 8).
Obesity was not framed by participants as a form of malnutrition, however, but rather as a lifestyle condition. Participants broadly associated obesity with high-earning and/or skilled workers in sedentary or non-physically demanding occupations:
“ Overweight is an issue among our manufacturers and salesforce – they use cars for transportation and so have less physical activity.
“ The driving division generally has poorer health because they are in sedentary work. We do have a number who would be in the obese category.
Figure 9: The cost of workforce obesity (as a proportion of GVA, %)
Note: The absolute cost to business is estimated by modelling potential sector GVA in the hypothetical instance of no malnutrition and comparing it to current sector GVA. The relative cost is calculated by dividing the absolute cost to the sector by the potential sector GVA in the no-malnutrition instance. Grey cells indicate sectors with too few data points to estimate sectoral prevalence, and hence calculate loss.Source: Vivid Economics.
In fact, our model shows that sectors characterized by physically demanding roles suffer the greatest costs associated with obesity among the workforce: across the 19 countries modelled, the cost of obesity is most concentrated in mining, education and health, and household services. In Egypt and Albania, where the prevalence
Agr
icul
ture
Min
ing
Man
ufac
turi
ng
Elec
tric
ity
Wat
er/s
ewer
age
Con
stru
ctio
n
Ret
ail/
trad
e
Tran
spor
tati
on
Info
and
com
ms
Fina
ncia
l/in
sura
nce
Prof
essi
onal
ser
vice
s
Hou
seho
ld s
ervi
ces
Educ
atio
n/he
alth
All
sect
ors
Albania 5.13 3.75 0.79 0.47 0.89 0.71 0.12 0.18 0.71 1.09 0.16 1.19 3.17 1.48
Bangladesh 0.02 0.01 0.01 0.03 0.00 0.07 0.01 0.03 0.07 0.01 0.05 0.09 0.02
Cambodia 0.14 0.02 0.02 0.08 0.04 0.17 0.00 0.01 0.01 0.01 0.04 0.13 0.09
India 0.14 0.23 0.07 0.03 0.09 0.15 0.03 0.05 0.05 0.05 0.08 0.15 0.35 0.12
Nepal 0.06 0.17 0.01 0.01 0.02 0.01 0.01 0.01 0.03 0.03 0.04 0.07 0.17 0.05
Pakistan 0.71 0.09 0.04 0.02 0.02 0.21 0.02 0.01 0.12 0.04 0.14 0.23 0.89 0.18
Egypt 6.30 4.95 0.70 0.20 0.36 0.76 1.76 0.63 0.46 2.86 1.04 2.36 4.57 2.56
Côte d’Ivoire 0.04 0.02 0.07 0.02 0.06 0.01 0.05 0.09 0.23 0.04 0.02 0.07
Ethiopia 0.06 0.24 0.14 0.01 0.01 0.07 0.04 0.02 0.03 0.07 0.02 0.05 0.33 0.08
Ghana 0.23 0.51 0.90 0.40 0.51 0.56 2.10 0.09 0.38 0.72 0.21 0.88 1.11 0.62
Mozambique 0.09 0.10 0.08 0.02 0.11 0.23 0.71 0.12 0.14 0.09 0.18 0.94 1.02 0.28
Namibia 0.99 1.81 0.22 0.25 0.22 0.10 0.25 0.13 0.44 0.46 0.09 1.65 2.63 0.82
Rwanda 0.11 0.14 0.11 0.11 0.14 0.08 0.35 0.08 0.21 0.41 0.12 0.18 0.74 0.20
Tanzania 0.37 0.72 0.13 0.09 0.11 0.26 0.49 0.09 0.16 0.67 1.91 1.10 2.50 0.74
Zambia 0.21 0.56 0.07 0.08 0.07 0.23 0.02 0.16 0.13 0.27 0.34 1.14 0.30
Zimbabwe 1.14 0.61 0.20 0.19 0.23 0.63 0.58 0.25 0.41 1.75 0.32 0.98 2.15 0.75
Dominican Republic 1.56 2.70 0.27 0.20 0.83 0.36 0.16 0.15 0.17 0.73 0.06 0.30 3.21 0.64
Guatemala 1.61 1.94 0.74 0.16 0.83 0.91 0.97 1.26 0.22 0.79 0.28 2.34 3.36 1.16
Honduras 1.57 1.78 0.97 0.63 0.68 0.51 0.54 0.29 2.36 1.00 0.32 1.92 3.83 1.40
All modelled countries 0.54 1.77 0.16 0.05 0.14 0.20 0.16 0.07 0.16 0.25 0.17 0.69 0.80
The Business Case for Investment in NutritionA Material Cost to Business
20 | Chatham House
of workforce obesity is particularly high, it is the agricultural sector that experiences the greatest costs. The economic burden of obesity on businesses is highest in Egypt, Albania and Honduras (Figure 9), countries where obesity is highly prevalent across the workforce (Annex II – Figure 18) and across the population as a whole (Figure 6). In these countries, and also in the Dominican Republic, Guatemala, Ghana, Namibia and Zimbabwe, the costs of workforce obesity exceed those of workforce underweight (Figures 7 and 9).
2.2 The additional costs of anaemia and childhood stunting
2.2.1 Anaemia among the workforce
Anaemia, as one example among many types of micronutrient deficiency, reduces the physical capacity of workers, particularly those engaged in manual labour (Annex I – Table 7). As with workforce underweight, workforce anaemia is particularly costly to the agriculture and mining sectors, costing them 3 per cent of GVA and 1.1 per cent of GVA respectively across the five countries modelled (Albania, Ethiopia, India, Namibia and Zimbabwe). Generally speaking, a lower prevalence of manual workers with anaemia corresponds with a lower relative cost per sector, but two sectors buck this trend: mining, and education and health. Despite a relatively low prevalence of manual workers with anaemia, both sectors have a high proportional GVA loss. This is likely a reflection of the fact that output in both sectors is much more reliant on human capital – worker productivity – than on technology or equipment, meaning that losses to productive capacity among the workforce have a more direct impact on economic performance.
Women in the workforce are much more likely than men to be anaemic (though prevalence among women in the workforce is slightly lower than among the female population as a whole). Women workers are 1.4 to 2.6 times more likely to be anaemic than their male counterparts, and this holds true even within occupation categories: 30 per cent of women in skilled agriculture and elementary occupations are anaemic, compared with 17 and 23 per cent of their male counterparts respectively (Annex II – Figure 22). Anaemia reduces economic output by an additional 0.8 per cent of GDP on average. Anaemia costs India alone $20 billion (0.7 per cent of GDP) in lost worker productivity. Given that anaemia arises from a single mineral deficiency, the actual impacts and costs of micronutrient deficiencies on the economics of business are likely to be significantly under-represented by our analysis.
2.2.2 Experience of childhood stunting among the workforce
We undertook a partial exploration of the effects of stunting experienced in childhood on adult workers and their labour productivity, using adult short stature as a crude proxy for the physical impacts of childhood stunting. Data on adult short stature were available for only 17 of the 19 countries (Côte d’Ivoire and India are not included). Across the 17 countries, just under a sixth of the workforce (16 per cent) is estimated to be suffering the physical effects of childhood stunting. The prevalence of adult short stature among the current workforce is particularly high in Central America (with rates of 60 per cent in Guatemala and 30 per cent in Honduras) and Southeast and South Asia (with rates of 27 per cent in Cambodia and 26 per cent in Pakistan).47
47 These results should be treated with caution, as they may to some extent reflect regional variation in adult height.
Women workers are 1.4 to 2.6 times more likely to be anaemic than their male counterparts

The Business Case for Investment in NutritionA Material Cost to Business
21 | Chatham House
Across the 17 countries for which data on prevalence were available, the physical impacts of childhood stunting are estimated to impose a cost to business of $3.9 billion annually, equivalent to 0.4 per cent of GDP. This is likely to be a significant underestimate of the true total, as stunting also reduces cognitive development and educational attainment. Were the indirect impacts of childhood stunting on educational attainment to be included, a first-pass calculation suggests the costs could increase by 4.5 times, up to a total of 1.8 per cent of GDP (Annex I – Box 11). Moreover, it is likely that the impacts of childhood stunting are even more significant for economic development. The cognitive and educational impacts of childhood malnutrition are likely to have a dynamic effect on the economy, such as the value of the labour force, the education status of the labour force and the size of economic sectors. Further research is needed to examine this effect and quantify the likely impact on business.
Despite the significant and long-term impacts of childhood stunting on labour productivity, only one of the 19 interview participants noted that the company’s workers in low- and middle-income countries would likely have been affected by stunting in childhood.
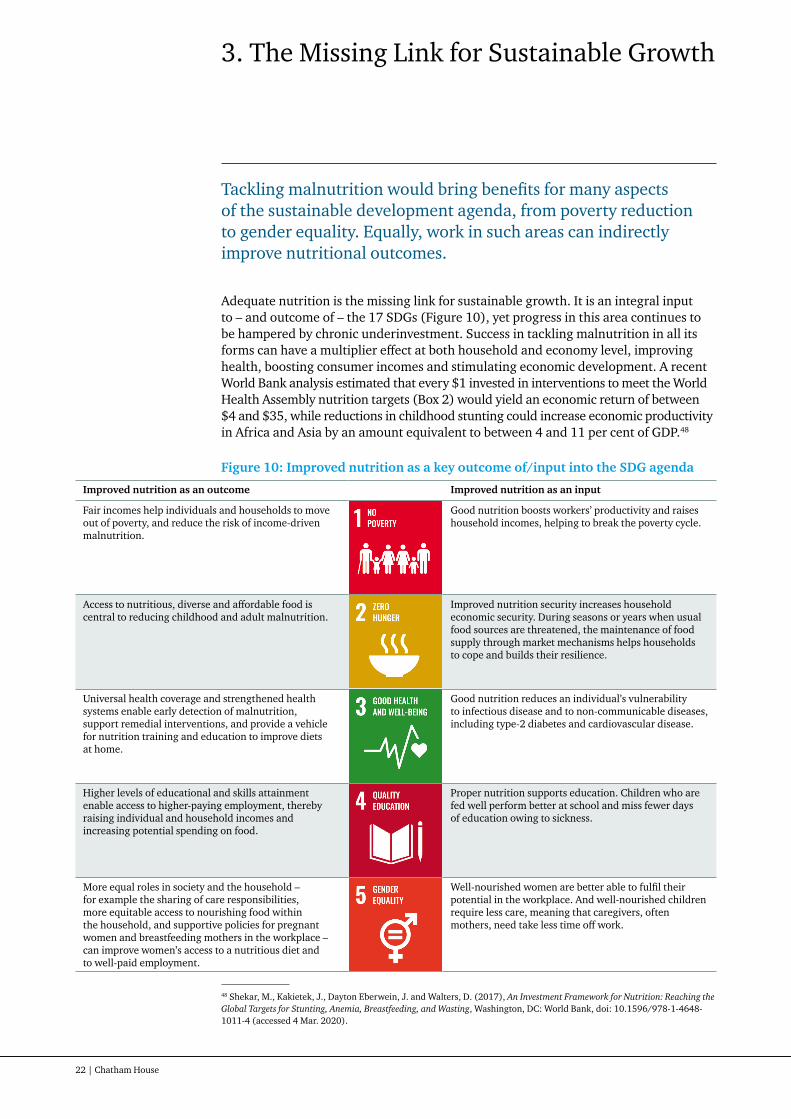
22 | Chatham House
3. The Missing Link for Sustainable Growth
Tackling malnutrition would bring benefits for many aspects of the sustainable development agenda, from poverty reduction to gender equality. Equally, work in such areas can indirectly improve nutritional outcomes.
Adequate nutrition is the missing link for sustainable growth. It is an integral input to – and outcome of – the 17 SDGs (Figure 10), yet progress in this area continues to be hampered by chronic underinvestment. Success in tackling malnutrition in all its forms can have a multiplier effect at both household and economy level, improving health, boosting consumer incomes and stimulating economic development. A recent World Bank analysis estimated that every $1 invested in interventions to meet the World Health Assembly nutrition targets (Box 2) would yield an economic return of between $4 and $35, while reductions in childhood stunting could increase economic productivity in Africa and Asia by an amount equivalent to between 4 and 11 per cent of GDP.48
Figure 10: Improved nutrition as a key outcome of/input into the SDG agenda
48 Shekar, M., Kakietek, J., Dayton Eberwein, J. and Walters, D. (2017), An Investment Framework for Nutrition: Reaching the Global Targets for Stunting, Anemia, Breastfeeding, and Wasting, Washington, DC: World Bank, doi: 10.1596/978-1-4648-1011-4 (accessed 4 Mar. 2020).
Improved nutrition as an outcome Improved nutrition as an input
Fair incomes help individuals and households to move out of poverty, and reduce the risk of income-driven malnutrition.
Good nutrition boosts workers’ productivity and raises household incomes, helping to break the poverty cycle.
Access to nutritious, diverse and affordable food is central to reducing childhood and adult malnutrition.
Improved nutrition security increases household economic security. During seasons or years when usual food sources are threatened, the maintenance of food supply through market mechanisms helps households to cope and builds their resilience.
Universal health coverage and strengthened health systems enable early detection of malnutrition, support remedial interventions, and provide a vehicle for nutrition training and education to improve diets at home.
Good nutrition reduces an individual’s vulnerability to infectious disease and to non-communicable diseases, including type-2 diabetes and cardiovascular disease.
Higher levels of educational and skills attainment enable access to higher-paying employment, thereby raising individual and household incomes and increasing potential spending on food.
Proper nutrition supports education. Children who are fed well perform better at school and miss fewer days of education owing to sickness.
More equal roles in society and the household – for example the sharing of care responsibilities, more equitable access to nourishing food within the household, and supportive policies for pregnant women and breastfeeding mothers in the workplace – can improve women’s access to a nutritious diet and to well-paid employment.
Well-nourished women are better able to fulfil their potential in the workplace. And well-nourished children require less care, meaning that caregivers, often mothers, need take less time off work.

The Business Case for Investment in NutritionThe Missing Link for Sustainable Growth
23 | Chatham House
Improved nutrition as an outcome Improved nutrition as an input
Water, sanitation and hygiene (WASH) interventions reduce exposure to faecal pathogens. This reduces the risk of gastrointestinal infection that inhibits an individual’s ability to absorb nutrients.
Investment in distributed and affordable energy can create the conditions for cold-chain infrastructure and storage, thus contributing to greater availability and affordability of fresh and safe food.
Well-nourished families are more likely to have household incomes that allow them to move away from firewood cookstoves and towards cleaner, healthier sources of energy in the home.
New employment opportunities and provision of fair living wages can raise household incomes and improve food and nutrition security.
Well-nourished adults are more likely to enter skilled and well-paid employment, to develop advanced skills required for work in an age of increasing digitization, and to have disposable income for discretionary spending.
Investment in infrastructure can support the distribution and safe storage of food. Innovation and investment in new industries can strengthen global, regional and local food systems.
Reducing the prevalence of malnutrition – and particularly childhood stunting – in a population can boost human capital development and educational attainment, better equipping that population for the demands of the rapidly changing nature of work.
Reducing social inequalities is a prerequisite for tackling inequalities in food access, at both societal and household level. Overcoming social inequalities can also improve access to education and health services, reducing individuals’ vulnerability to malnutrition and improving access to decent work.
Improved nutrition outcomes at the individual level can help to break the intergenerational cycle of malnutrition which traps families and communities in poverty.
Cities designed to support human well-being, for example through affordable mass transport and healthy food environments, can enhance households’ access to markets and to diverse and affordable diets.
At the community level, good nutrition reduces the collective susceptibility of the population to the spread of disease, contributing to more resilient communities.
Reducing food loss and waste is a critical means of boosting food supply, particularly in low-income countries. Circular-economy principles can also generate markets for food waste and improve the efficiency of food production, while lessening required inputs of resources such as land and water.
Many innovations and technologies that have the potential to improve dietary quality – closed-loop farming in resource-scarce regions, for example – can also contribute to reduced food waste and more responsible, circular modes of production.
Success in mitigating and adapting to climate change will lessen the expected roll-back on health improvements seen over the past half-century and the projected increase in undernutrition resulting from substantial economic losses in low-income countries.
Improved nutrition brings improved health, boosting the resilience of individuals, households and communities to climate-driven health risks such as extreme heat, pests and disease.
Responsible management of fisheries and marine biodiversity is key to protecting fish and seafood as sources of vital nutrition, and to avoiding the pollution of water sources.
Food- and nutrition-secure communities may be less likely to overexploit natural resources such as fish stocks when immediate need is no longer more pressing than long-term sustainable management.

The Business Case for Investment in NutritionThe Missing Link for Sustainable Growth
24 | Chatham House
3.1 An overlooked risk to long-term growth and sustainable development
For enlightened investors and companies, the potential for improved nutrition – both in the workforce and in the communities in which firms are embedded – to drive inclusive and sustainable growth should be a compelling impetus for investment. Success in delivering on the nutrition-focused targets under SDG 2 could unlock growth in developing markets and create an enabling environment for achieving the broader SDG agenda. This in turn would help companies to deliver enduring shareholder value in a way that does not undermine their corporate sustainability commitments.
Stronger, healthier and more economically productive societies give rise to new investment opportunities, and support greater discretionary spending on goods and services. The human capital gains to be reaped through improved nutrition outcomes can support the development of a workforce that is skilled and prepared for the future of work: digitization and automation are heightening the demand for advanced cognitive skills,49 skills which are hampered by the low literacy associated with high rates of malnutrition.50 Improved nutrition can also help to de-risk investments: pervasive malnutrition has a destabilizing effect not only on economies but on whole societies, with food insecurity and malnutrition frequently being important contributors to armed conflict in low-income countries, particularly when prevalent among rural populations.51
49 World Bank (2019), World Development Report: The Changing Nature of Work, https://www.worldbank.org/en/publication/wdr2019 (accessed 24 May 2020).50 Global Panel on Agriculture and Food Systems for Nutrition (2016), The Cost of Malnutrition: Why Policy Action is Urgent, Technical Brief No. 3, July 2016, https://glopan.org/sites/default/files/pictures/CostOfMalnutrition.pdf (accessed 24 May 2020).51 Holleman, C., Jackson, J., Sánchez, M. V. and Vos, R. (2017), Sowing the seeds of peace for food security – Disentangling the nexus between conflict, food security and peace, FAO Agricultural Development Economics Technical Study 2, Rome: FAO, http://www.fao.org/3/a-i7821e.pdf (accessed 7 May 2020); and Pinstrup-Andersen, P. and Shimokawa, S. (2008), ‘Do poverty and poor health and nutrition increase the risk of armed conflict onset?’, Food Policy, 33(5): pp. 513–20, doi: 10.1016/j.foodpol.2008.05.003 (accessed 5 May 2020).
Improved nutrition as an outcome Improved nutrition as an input
Improved agricultural productivity and diversification contribute to greater food and nutrition security.
Diets that are nutritionally balanced and rich in wholegrains, fruit and vegetables are very often more environmentally sustainable. Improved nutrition is also positive for the productivity of the agricultural workforce.
Preventing conflict removes an important driver of food and nutrition insecurity. Good governance of the food system can support access to affordable, nutritious and diverse food supplies.
Good nutritional outcomes reduce the risk of food insecurity-driven conflict and instability.
Society-wide cooperation – supported by partnerships between public, private and civil society actors – has an important role to play in overcoming malnutrition.

The Business Case for Investment in NutritionThe Missing Link for Sustainable Growth
25 | Chatham House
In our interviews with MNC representatives, a number of participants noted the importance of good nutrition to boosting productivity gains among the workforce in the near term, and to supporting human capital development and market growth in the longer term:
“ There is higher morbidity with those with malnutrition. Those costs and impacts are shown through decreased productivity.
“ If you improve the health of your workers, the workers will pay you back in productivity.
“ Even if it doesn’t affect core business, it may relate to […] unlocking growth.
“ These people are potentially part of our future workforce. And these communities are those who will be using our products.
Yet despite the prospect of long-term benefits to business, corporate engagement with nutrition as an integral part of the SDG agenda remains low compared with other areas. A 2019 review by the World Business Council for Sustainable Development (WBCSD) of its members’ sustainability strategies found that SDG 2 is under-represented compared with other SDGs: some 41 per cent of WBCSD members referenced SDG 2 and targets on nutrition, compared with 87 per cent for SDG 13 (climate action), 81 per cent for SDG 12 (responsible consumption and production) and 76 per cent for SDG 8 (decent work and economic growth).52 Our interviews with company representatives reflected a similar deprioritization of nutrition in the context of broader sustainability efforts:
“ To be frank, it has been low on the list. The key thing is that we do not do enough justice to other sustainability issues other than climate change.
“ Diversity, social mobility, learning – these are the points of focus.
“ It’s doubtful that we will be able to source the resources, trust and goodwill internally to push forwards this agenda any time soon.
Rather than being distinct and peripheral to these other priority areas, however, improved nutrition can be a catalyst – and even a prerequisite – for delivering against them. Good nutrition and the achievement of the targets under SDG 2 have been identified as critical to tackling a range of health and social challenges, from ending the AIDS epidemic53 and improving outcomes from pandemics such as COVID-19 54 to achieving gender equality55 and driving inclusive economic growth.56
52 WBCSD (2019), Reporting matters. Navigating the landscape: a path forward for sustainability reporting, https://docs.wbcsd.org/2019/10/WBCSD_Reporting_Matters_2019.pdf (accessed 13 May 2020).53 Mehra, D., de Pee, S. and Bloem, M. W. (2017), ‘Ending AIDS by 2030: Partnerships and Linkages with SDG 2’, in de Pee, S., Tarden, D. and Bloem, M. (eds) (2017), Nutrition and Health in a Developing World, Cham: Humana Press, pp. 665–81, doi: 10.1007/978-3-319-43739-2_30 (accessed 13 May 2020).54 Li et al. (2020), ‘Clinical characteristics of 25 death cases infected with COVID-19 pneumonia’; Huang et al. (2020), ‘Clinical findings of patients with coronavirus disease 2019 in Jiangsu Province, China’; and Wang et al. (2020), ‘Clinical characteristics of 138 hospitalized patients with 2019 novel coronavirus-infected pneumonia in Wuhan, China’.55 1,000 Days (2020), Nourishing Gender Quality: How Nutrition Interventions are an Underleveraged Tool in the Fight for Women’s Rights, https://thousanddays.org/wp-content/uploads/Womens-Empowerment-WEB.pdf (accessed 13 May 2020).56 Hansen, C. (2013), ‘Food Security, Inclusive Growth, Sustainability, and the Post-2015 Development Agenda’, background research paper submitted to the High Level Panel on the Post-2015 Development Agenda, https://www.post2015hlp.org/wp-content/uploads/docs/Hanson_Food-Security-Inclusive-Growth-Sustainability-and-the-Post-2015-Development-Agenda.pdf (accessed 13 May 2020); and Alderman, H., Behrman, J. R. and Hoddinott, J. (2005), ‘Nutrition, Malnutrition, and Economic Growth’, in López-Casanovas, G., Rivera, B. and Currais, L. (eds) (2005), Health and Economic Growth: Findings and Policy Implications, pp. 169–94, Cambridge: MIT Press, ISBN: 0-262-12276-6.
The Business Case for Investment in NutritionThe Missing Link for Sustainable Growth
26 | Chatham House
3.2 Corporate accountability around nutrition
As the investment community awakens to the fundamental role of improved nutrition in delivering sustainable and inclusive growth, companies in all sectors will likely come under pressure to integrate nutrition-sensitive approaches across their workplace and CSR programmes. Among interview participants, scrutiny of company performance on social sustainability in general, and on health and nutrition as part of that, was thought to be increasing, bringing a heightened reputational risk for companies unable to demonstrate positive action:
“ There is definitely increasing attention to ESG reporting. So we are paying attention to this and it will be part of the integrated health strategy.
“ There is a practical reason to look at these things, not least because pressure from all directions – investors, shareholders, staff – is growing to do the right thing for the company and morally.
“ We need to adopt a pre-emptive, preventative response because scrutiny and pressure around this will only grow.
Beyond reporting, good performance in tackling malnutrition – where it is a prominent social challenge in and around a company’s area of operation – will be important to maintaining a social licence to operate, in the eyes both of ‘host’ governments and among employees and consumers. Protecting the company’s reputation was highlighted as a key driver of action on sustainability by interview participants:
“ We need to build a social licence to operate – demonstrate authentic and impactful investments in the community.
“ Research shows that companies with a strong social sustainability agenda fare better than their peers, for lots of reasons – better government relations, and less risk of litigation, higher staff retention rates, stronger supply chain resilience.
“ If we were to ignore local social issues in the country, then it could bring us down to our knees – reputationally – both locally and internationally.
Environmental, social and governance (ESG) risk and reporting frameworks are increasingly integrating all dimensions of the SDG agenda, and including metrics relating to a company’s impact on the health and nutrition of employees and wider society. The SASB Materiality Map already includes metrics on the impact of company activities on the nutrition and well-being of customers and employees,57 while the forthcoming World Benchmarking Alliance, which aims to ‘incentivize and accelerate’ private-sector efforts towards achieving the SDGs, will evaluate companies on their nutrition performance under its Food and Agriculture Benchmark.58 Other efforts to foster more comprehensive corporate reporting against the SDGs include: the ‘Business Reporting on the SDGs’ initiative,59 run collectively by the Global
57 Sustainability Accounting Standards Board (2018), ‘SASB Materiality Map’, https://materiality.sasb.org/ (accessed 27 Mar. 2020).58 World Benchmarking Alliance (2020), ‘Benchmarking for a better world’, https://www.worldbenchmarkingalliance.org/ (accessed 27 Mar. 2020).59 GRI (undated), ‘Business Reporting on the SDGs’, https://www.globalreporting.org/information/SDGs/Pages/Reporting-on-the-SDGs.aspx (accessed 13 May 2020).

The Business Case for Investment in NutritionThe Missing Link for Sustainable Growth
27 | Chatham House
Reporting Initiative and the UN Global Compact, which offers guidance to companies and investors on how to align existing reporting practices with the SDG framework; and WBCSD’s Reporting Exchange,60 which offers a bank of resources to guide companies in their reporting practices and to raise awareness among investors of ESG risks and indicators.
ESG reporting on company efforts to support employee and supplier nutrition is currently limited,61 but a number of companies have implemented initiatives to monitor and improve the impact of their supply chain operations on the nutrition security of stakeholders. Examples include Unilever’s ‘Seeds of Prosperity’ partnership with the Global Alliance for Improved Nutrition (GAIN) and the Sustainable Trade Initiative (IDH) to improve workers’ diets along Unilever’s tea supply chain in India; and Olam’s ‘AtSource’ platform, which offers social footprint data (including on farmers’ food security) in respect of its commodity supply chains (Box 5). Alongside these company-level initiatives, the Global Access to Nutrition Index – produced by the Access to Nutrition Foundation – monitors and reports on the performance of the largest food and beverage companies in tackling undernutrition and obesity through their practices on, for example, the marketing of healthy and unhealthy foods, product reformulation, and consumer and employee health and wellness.62
Looking ahead, outside scrutiny will continue to be greatest for companies in the food and beverage sectors. The influence and impact of businesses in promoting unhealthy food choices, through irresponsible practices including child-targeted advertising of high-fat and high-sugar foods and through non-compliance with the International Code of Marketing of Breastmilk Substitutes, have been extensively explored in the literature.63 At the same time, the risks posed by corporate malpractice to the fulfilment of the rights of the child, and human rights more broadly, with regard to food and nutrition security are increasingly under the spotlight,64 particularly for those companies that are well positioned to take direct action to support the fulfilment of these rights.
Other sectors are by no means immune to nutrition-related reputational risk, however. Companies that have a large footprint in countries with a high prevalence of malnutrition will likely face criticism if found not to be addressing the issue. Particular focus will fall on those industries with highly localized operations to which good community relations are key – mining, for example – and among
60 WBCSD (undated), ‘The Reporting Exchange’, https://www.reportingexchange.com/ (accessed 13 May 2020).61 Strauss, D. and Chlapaty, A. (2018), ‘The State of Corporate Disclosure on Well-being: A review of Corporate Reporting Practices in the Food and Agriculture Sector in 2018’, presented at the 6th OCED World Forum on Statistics, Knowledge and Policy, Incheon, Korea, 27–29 November 2018, doi: 10.2139/ssrn.3313568 (accessed 27 Mar. 2020).62 Access to Nutrition Initiative (2018), ‘Global Index 2018’, https://accesstonutrition.org/index/global-index-2018/ (accessed 30 Mar. 2020).63 Clark, H., Coll-Seck, A. M., Banerjee, A., Peterson, S., Dalglish, S. L., Ameratunga, S., Balabanova, D., Bhan, M. K., Bhutta, Z. A., Borrazzo, J., Claeson, M., Doherty, T., El-Jardali, F., George, A. S., Gichaga, A. et al. (2020), ‘A future for the world’s children? A WHO-UNICEF-Lancet Commission’, The Lancet Commissions, 395(10224): pp. 605–58, doi: 10.1016/S0140-6736(19)32540-1 (accessed 5 Mar. 2020); Hawkes, C., Ruel, M. T., Salm, L., Sinclair, B. and Branca, F. (2019), ‘Double-duty actions: seizing programme and policy opportunities to address malnutrition in all its forms’, The Lancet, doi: 10.1016/S0140-6736(19)33099-5 (accessed 21 Feb. 2020); Mozaffarian, D., Angell, S. Y., Lang, T. and Rivera, J. A. (2018), ‘Role of government policy in nutrition – barriers to and opportunities for healthier eating’, BMJ, 361: k2462, doi: 10.1136/bmj.k2426 (accessed 5 Mar. 2020); and Piwoz, E. G. and Huffman, S. L. (2015), ‘The Impact of Marketing of Breast-Milk Substitutes on WHO-Recommended Breastfeeding Practices’, Food and Nutrition Bulletin, 36(4): pp. 373–86, doi: 10.1177/0379572115602174 (accessed 5 Mar. 2020).64 Swinburn, B. A., Kraak, V. I., Allender, S., Atkins, V. J., Baker, P. I., Bogard, J. R., Brinsden, H., Calvillo, A., de Schutter, O., Devarajan, R., Ezzati, M., Friel, S., Goenka, S., Hammond, R. A., Hastings, G. et al. (2019), ‘The Global Syndemic of Obesity, Undernutrition, and Climate Change: The Lancet Commission report’, The Lancet, 393(10173): pp. 791–846, doi: 10.1016/S0140-6736(18)32822-8 (accessed 2 Apr. 2020).
ESG risk and reporting frameworks are increasingly integrating all dimensions of the SDG agenda

The Business Case for Investment in NutritionThe Missing Link for Sustainable Growth
28 | Chatham House
which ESG reporting on areas such as health and safety and social development is already commonplace. Here, poor performance on so-called ‘hygiene factors’ – whether community engagement through sustainable development initiatives or workplace conditions and policies for employees – risks employee dissatisfaction, high staff turnover and a reduction in the underperforming company’s social licence to operate among local communities and its consumer base.65
Box 5: Example intervention | Supply chain reporting on food security | Olam International
In 2018, Singapore-based food and agribusiness company Olam International launched AtSource, a ‘sustainable sourcing platform’. AtSource is structured in three tiers, with AtSource+ (the middle tier) providing environmental and social footprint data on Olam’s products.66 Users access the data via a digital dashboard. They can review information on suppliers across nine sustainability areas, grouped under the three outcome targets identified in Olam’s corporate purpose ‘to reimagine global agriculture and food systems’. These three targets are (1) ‘prosperous farmers and food systems’, (2) ‘thriving communities’ and (3) ‘regeneration of the living world’. Information and risk assessments provided across the nine sustainability areas are subject to independent verification.67
One sustainability area is ‘health and nutrition’, which sits under ‘thriving communities’. The AtSource platform is in its early stages, and information is currently provided for a selection of Olam’s supply chains. For those supply chain participants already reporting via the platform, information is provided on the food security of households among the communities in which the suppliers operate, and on the number of farmers and community members receiving nutrition support where relevant. Food insecurity is measured using the Months of Adequate Household Food Provisioning (MAHFP) indicator. 68 The metrics for measuring other areas of nutrition and health, such as diet diversity, are under review.69
The AtSource platform is aimed at demonstrating, through traceability and transparent supply chain information, Olam’s commitment to social and environmental sustainability. In addition, the platform offers a means for Olam’s customers – predominantly food and beverage companies – to demonstrate supply chain due diligence in reporting on the social and environmental footprint of their inputs. The platform also offers ‘consumer-ready stories’, including individual stories from farmers along Olam’s supply chain, which Olam’s customers may then incorporate into their reporting and marketing materials.70
According to Olam International, AtSource is designed in the longer term to deliver positive transformation along its supply chains. Where data indicate an area of risk – for example, where food security among farmers and their households is found to be low – Olam plans to work with customers to agree appropriate interventions and to report on these transparently through the platform.71
65 van Rekom. J., Berens, G. and van Halderen, M. (2013), ‘Corporate social responsibility: Playing to win, or playing not to lose? Doing good by increasing the social benefits of a company’s core activities’, Journal of Brand Management, 20: pp. 800–14, doi: 10.1057/bm.2013.13 (accessed 29 Apr. 2020).66 Olam International (undated), ‘AtSource’, https://www.atsource.io/ (accessed 6 Mar. 2020).67 Olam International (undated), AtSource: Driving Transformation in Agricultural Supply Chains, https://www.atsource.io/content/dam/olam/atsource/pdf/AtSource_brochure_english.pdf (accessed 6 Apr. 2020).68 Direct exchange with Olam International.69 Direct exchange with Olam International.70 Direct exchange with Olam International.71 Direct exchange with Olam International.

29 | Chatham House
4. The Added Value of Business
Business action on nutrition can take many forms. It can involve improving workplace conditions, supporting community programmes, mobilizing investment, or expanding the scope of compliance reporting.
Many businesses have the reach, expertise and resources to be a significant asset in global efforts to overcome malnutrition. Action may take many different forms, from workplace interventions to community initiatives to collaboration with third-party implementing partners. Below, we outline the key opportunities for business intervention across the four major drivers of malnutrition, as identified in a recent Lancet series: poor early-life nutrition, poor diet quality, the food environment, and socioeconomic drivers such as income and education.72
Figure 11: Indicative examples of company-level actions to address the four drivers of malnutrition
N.B. The coloured dots indicate the principal drivers of malnutrition that may be addressed directly through a given intervention. The figure is intended to be indicative and does not capture the full range of channels through which interventions can indirectly tackle drivers of malnutrition (for example, the payment of fair wages directly tackles household economic insecurity as a driver of malnutrition but can, by boosting household income, also contribute indirectly to improved dietary quality among members of that household).Source: Authors’ own research, drawing on analysis of common drivers of the double burden of malnutrition in Hawkes et al. (2019), ‘Double-duty actions: seizing programme and policy opportunities to address malnutrition in all its forms’.
72 Hawkes et al. (2019), ‘Double-duty actions: seizing programme and policy opportunities to address malnutrition in all its forms’.
Setting Example intervention Driver of malnutrition
Poor early-life nutrition
Poor diet Food environment
Socioeconomic factors
Workplace
Healthy food at work • • •Healthy-eating incentives • •Health checks • • •Fair wages •
Workplace and community
Breastfeeding support • •Nutrition education/training • • •Nutrition-sensitive interventions (e.g. WASH, education)
•
Market
Manufacture and sale of nutritional products and services
• •Investment in agricultural productivity • •Responsible advertising •Supply chain due diligence •

The Business Case for Investment in NutritionThe Added Value of Business
30 | Chatham House
4.1 Addressing the principal drivers of malnutrition
4.1.1 Improving early-life nutrition
There is compelling evidence that a core set of interventions targeting mothers, infants and young children can significantly reduce the risk of childhood stunting and wasting and yield enormous benefits in terms of lifelong nutrition and health.73 These include interventions that companies can implement themselves.
Breastfeeding support in the workplace (e.g. through on-site facilities such as private rooms and refrigerated storage for breastmilk pumping, and through maternity leave benefits to reduce the opportunity cost for mothers wishing to extend their leave to continue breastfeeding) has been proven to be effective.74 This can be complemented by initiatives targeting the wider community, including the provision of breastfeeding support clinics or innovative products such as mobile phone-based support services (Box 6). Food companies can also support greater access to nutritious food for infants, young children, mothers and women of reproductive age through the financing or delivery of community feeding programmes, such as school meal provision.75
Key nutrition interventions also include micronutrient supplementation for pregnancy and childhood. Companies can help to develop and implement these measures, and also have an important role to play through responsible marketing. Evidence also shows that in order to protect against increased risk of obesity in later life, the provision and promotion of energy-dense fortified foods and supplements in early childhood should be time-limited and should be accompanied by nutrition counselling on healthy eating.76 Nutrition education and healthy food provision in the workplace can play an important role in improving maternal nutrition and nutrition awareness.
Box 6: Example intervention | Technology to support expectant and breastfeeding mothers | Milk Stork, IBM and Vodafone
A number of companies sampled are supporting breastfeeding working mothers through the use of novel technology and services. Some offer their employees the use of third-party services, such as Milk Stork, to enable the shipment of expressed breastmilk while on work travel. Milk Stork has reportedly been used by more than 10,000 mothers since its inception in 2015.77 Other companies have developed app- and mobile phone-based information and support services. IBM, in collaboration with Nutrino, has developed the ‘Nutrino App’ to provide expectant mothers with evidence-based nutrition guidance,
73 Bhutta Z. A., Das J. K., Rizvi A., Gaffey M. F., Walker N., Horton S., Webb, P., Lartey, A. and Black, R. E. (2013), ‘Evidence-based interventions for improvement of maternal and child nutrition: what can be done and at what cost?’, The Lancet, 382(9890): pp. 452–77, doi: 10.1016/S0140-6736(13)60996-4 (accessed 2 Apr. 2020); and Shekar et al. (2017), An Investment Framework for Nutrition.74 GAIN (2019), ‘Workplace breastfeeding support’, Workforce Nutrition Programme Evidence Brief 4, https://www.gainhealth.org/sites/default/files/publications/documents/evidence-brief-4-workplace-breastfeeding-support-2019.pdf (accessed 2 Apr. 2020); and Walters, D., Dayton Eberwein, J., Sullivan, L. and Shekar, M. (2017), ‘Reaching the Global Target for Breastfeeding’, in Shekar et al. (2017), An Investment Framework for Nutrition.75 Ruel, M. T. and Alderman, H. (2013), ‘Nutrition-sensitive interventions and programmes: how can they help to accelerate progress in improving maternal and child nutrition?’, The Lancet, 382(9891): pp. 536–51, doi: 10.1016/S0140-6736(13)6 0843-0 (accessed 6 Apr. 2020).76 Hawkes et al. (2019), ‘Double-duty actions: seizing programme and policy opportunities to address malnutrition in all its forms’.77 Milk Stork (undated) ‘Employers’, https://www.milkstork.com/employers.
A core set of interventions targeting mothers, infants and young children can significantly reduce the risk of childhood stunting and wasting and yield enormous benefits in terms of lifelong nutrition and health

The Business Case for Investment in NutritionThe Added Value of Business
31 | Chatham House
such as meal recommendations.78 Vodafone in South Africa (operating as Vodacom) has introduced a ‘Mum and Baby’ service, offering free content on maternal, neonatal and child health, together with well-being information and advice on breastfeeding, through weekly SMS messages.79 A 2019 KPMG review of the project found strong evidence of the usefulness of the Mum and Baby service in providing participants with reliable information relevant to their, and their children’s, health and well-being. The report also indicated that the content provided has influenced the behaviour of subscribers, leading them to take actions improving their family’s health: almost all users surveyed following the introduction of the information service agreed or strongly agreed that it had led them to take actions to improve their children’s health, with examples including the incorporation of more fruit and vegetables into the mother’s diet.80
4.1.2 Improving diet quality
For food and beverage companies, investments in more nutritious product ranges, biofortification, and agricultural productivity and diversification can all contribute to improved dietary quality among their own stakeholders and the wider population.
Food fortification is an important means through which the private sector can contribute to improved dietary quality.81 New technologies and innovation are another key tool in the arsenal of the private sector that can be deployed to improve access to diverse and nutritious diets. In food and agriculture, technologies to decouple food production from land use – for example, vertical farming and closed-loop agriculture such as hydroponics and aeroponics – offer new ways of minimizing and repurposing waste in the food system, and of producing nutritious food in areas where land or water resources are scarce.82
But many such technological advances come from outside the food sector. For example, genome-editing technologies such as CRISPR have the potential to boost production of so-called ‘orphan crops’ – nutritious crops whose production has fallen as global demand for maize, soybean and other commodities has risen – in low- and middle-income countries. This would help to diversify food production in support of more varied diets and improved productivity in regions where yield growth in main crops is stalling.83 Cold-chain logistics and storage, if deployed at scale, could significantly reduce food losses and enhance access to fresh and nutritious foods,
78 IBM (2015), ‘Nutrino and IBM Introduce Watson-Powered Nutrition Recommendations for Expectant Moms-to-Be’, press release, 10 December 2015, https://www-03.ibm.com/press/us/en/pressrelease/48314.wss (accessed 1 Apr. 2020).79 Vodafone (2019), Sustainability Business Report, https://www.vodafone.com/content/dam/vodcom/sustainability/pdfs/sustainablebusiness2019.pdf (accessed 1 Apr. 2020).80 KPMG Public (2019), Vodacom’s Mum and Baby service in South Africa, a socio-economic impact assessment, https://www.vodafone.com/content/dam/vodcom/sustainability/pdfs/Vodacom_Mum_Baby_Service_Impact_Report.pdf (accessed 31 Mar. 2020).81 Das, J. K., Salam, R. A., Mahmood, S. B., Moin, A., Kumar, R., Mukhtar, K., Lassi, Z. S. and Bhutta, Z. A. (2019), ‘Food fortification with multiple micronutrients: impact on health outcomes in general population’, Cochrane Database of Systematic Reviews, doi: 10.1002/14651858.CD011400.pub2 (accessed 23 May 2020).82 Preston, F., Lehne, J. and Wellesley, L. (2019), An Inclusive Circular Economy: Priorities for Developing Countries, Research Paper, London: Royal Institute of International Affairs, https://www.chathamhouse.org/sites/default/files/publications/research/2019-05-22-Circular%20Economy.pdf (accessed 23 May 2020); and Bailey, R. (2017), ‘Disrupting dinner? Food for the future’, Hoffmann Centre for Sustainable Resource Economy, 18 May 2017, https://hoffmanncentre.chathamhouse.org/article/disrupting-dinner-food-for-the-future/ (accessed 23 May 2020).83 Bailey, R. and Wellesley, L. (2017), Chokepoints and Vulnerabilities in Global Food Trade, Chatham House Report, London: Royal Institute of International Affairs, https://www.chathamhouse.org/sites/default/files/publications/research/2017-06-27-chokepoints-vulnerabilities-global-food-trade-bailey-wellesley-final.pdf (accessed 23 May 2020).

The Business Case for Investment in NutritionThe Added Value of Business
32 | Chatham House
particularly in remote communities where distances to market are great.84 Advanced sensor technologies, artificial intelligence, robotics, molecular printing, novel packaging materials and personalized nutrition monitoring – all have the potential, in their applications to the food system, to transform access to diverse, nutritious diets.85
At a more modest scale, all companies, regardless of sector, offering workplace canteens are in a position to influence, directly or indirectly, the quality of one or more daily meals among employees. And, through the integration of nutrition education and training into health and well-being programmes, companies can contribute to the embedding of healthier eating habits among these same groups. In 2005, the International Labour Organization identified food provision at work as central to delivering on the ‘decent work’ agenda, and advised that ‘enterprises are hurting themselves in not offering better meal options’.86
4.1.3 The food environment
Industry players – particularly in the food and beverage sectors – are pivotal in shaping the food environment. As food systems in low- and middle-income countries transform, with greater market penetration of global brands and rising demand for ‘Western’ diets, the private sector can help to drive this transformation in a direction that supports access to healthy and nutritious diets. Innovation and investment in food processing such as refrigeration, canning and pasteurization – and support for smallholders and SMEs to build their capacity in such processing – can prevent the loss of nutrients in foods and allow for safer and more ubiquitous access to fruit, vegetables and animal products, particularly in rural settings. Product reformulation – to reduce the salt and sugar content of foods, for example – can improve the healthiness of food options while meeting local preferences and without limiting choice.87
Companies from all sectors can help to support a diverse local food environment and sustain smallholder livelihoods by procuring local food where possible for use at their offices or other facilities. Other measures to shape the food environment include the use of ‘nudge’ tactics to build a healthy food environment in the workplace (Box 7), engagement with local food vendors to improve the healthiness of food on offer around the workplace, and responsible practices around the advertising of unhealthy foods and the use of nutritional claims on food products. Supply chain due diligence to ensure good practice among upstream suppliers can reduce the risk that a company is indirectly supporting a poor or harmful food environment.
84 Bailey and Wellesley (2017), Chokepoints and Vulnerabilities in Global Food Trade.85 Herrero, M., Thornton, P. K., Mason-D’Croz, D., Palmer, J., Benton, T. G., Bodirsky, B. L., Bogard, J. R., Hall, A., Lee, B., Nyborg, K., Pradhan, P., Bonnett, G. D., Bryan, B. A., Campbell, B. M., Christensen, S. et al. (2020), ‘Innovation can accelerate the transition to a sustainable food system’, Nature Food, 1: pp. 266–72, doi: 10.1038/s43016-020-0074-1 (accessed 23 May 2020).86 Wanjek, C. (2005), Food at Work: Workplace solutions for malnutrition, obesity and chronic diseases, Geneva: International Labour Office, ISBN 92-2-117015-2.87 Global Panel on Agriculture and Food Systems for Nutrition (2019), Improving diets in an era of food market transformation: Challenges and opportunities for engagement between the public and private sectors, https://www.glopan.org/wp-content/uploads/2019/08/Global-Panel_Abridged-Private-Sector-Brief_FINAL-WEB-VERSION.pdf (accessed 23 May 2020).
Companies from all sectors can help to support a diverse local food environment and sustain smallholder livelihoods by procuring local food where possible for use at their offices or other facilities

The Business Case for Investment in NutritionThe Added Value of Business
33 | Chatham House
Box 7: Example intervention | Nutritional scoring | Nestlé and BMW
A number of companies sampled are using nutritional scoring to enable consumers and employees to monitor their nutritional intake in a simplified way. One example is Nestlé’s Meal Nutritional Score (MNS), which scores recipes with a number between 0 and 100 based on the extent to which the meal aligns with national and WHO dietary recommendations.88 The MNS was piloted in the workplace at Nestlé Research in Lausanne, Switzerland, where, after two weeks of testing, the number of people selecting nutritionally balanced, higher-scoring meals increased by 10 per cent.89 Nestlé then extended the MNS system for public use, piloting it first in Mexico,90 via a recipe website which allows consumers to browse recipes and add them to their ‘menu’.91 The interactive platform also suggests starters, side dishes or desserts that will help the user ‘score higher’ and design a nutritionally balanced meal.92
Nestlé has developed a second nutrition score for use with children between the ages of six and 12 in the Philippines, creating a website called the ‘Tibay Calculator’.93 The website allows caregivers to monitor the diets of children by reporting on what the children have eaten in a given period. On the basis of this information, it calculates a score for diet diversity, assesses the probability of nutrient inadequacies, and provides food and product recommendations to address any suspected nutrient gaps.94
A simplified nutritional scoring system has also been used in the BMW Group’s staff canteens. A ‘traffic light’ labelling scheme indicates the meal’s calorific and nutritional value, factoring in the relative proportions of key ingredients and the method of preparation .95 Since the scheme was established in 2013, over 50 per cent of the group’s estimated 22,000 workers in Germany have been shown to change their eating habits, choosing healthier ‘green’ meals over other options.96
4.1.4 Socioeconomic factors
Nutrition education and health checks for employees and the wider community, the payment of fair wages to employees and responsible tax practices can help to tackle the underlying socioeconomic factors that drive malnutrition (Figure 1).
There is a wealth of evidence, both quantitative and anecdotal, around the impact of health and well-being education for workers on their health status and productivity. A study in the US found that, on average, healthcare costs to companies fall by $3.27 for every $1 investment in employee wellness programmes, while absenteeism costs
88 Prozorovscaia, D., Jacquier, E., Dudan, F., Mungkala, S. and Green, H. (2019), ‘A digital meal nutritional score may influence food choices in a workplace restaurant: A pilot study presented at FENS’, https://app.oxfordabstracts.com/events/696/program-app/titles/1?s=prozorovscaia (accessed 7 Apr. 2020).89 Ibid.90 Direct exchange with Nestlé.91 Nestlé (2020), ‘Recetas’, https://www.recetasnestle.com.mx/ (accessed 27 Mar. 2020).92 Ibid.93 Nestlé (2020), ‘TiBay Calculator’, https://www.bearbrand.com.ph/tibay-calculator/plan (accessed 1 Apr. 2020).94 Direct exchange with Nestlé. See also Mak, T.-N., Angeles-Agdeppa, I., Lenighan, Y. M., Capanzana, M. V. and Montoliu, I. (2019), ‘Diet Diversity and Micronutrient Adequacy among Filipino School-Age Children’, Nutrients, 11(9): 2197, doi: 10.3390/nu11092197 (accessed 1 Apr. 2020).95 BMW Group (2020), ‘Health Initiatives’, https://www.bmwgroup.com/en/company/bmw-group-news/artikel/health-at-bmw-group.html (accessed 1 Apr. 2020).96 Ibid.

The Business Case for Investment in NutritionThe Added Value of Business
34 | Chatham House
fall by $2.73.97 Nutrition education, while insufficient in and of itself to overcome the multiple barriers to accessing and following healthy diets, is recognized as an important component of efforts to promote positive changes to eating behaviours.98 Evidence of the impact of per capita income increases in reducing child stunting, and in improving the food security and dietary quality of households, underlines the role that the payment of fair wages can play in supporting workers’ nutrition and that of their families (though higher wages need to be accompanied by interventions to improve nutrition education and create a healthy food environment, in order to avoid increased consumption of unhealthy foods as incomes rise).99 In addition, responsible tax practices can reduce fiscal leakages and, in theory, boost available public funds for government-led nutrition interventions.
Companies can also work in partnership – operationally and/or financially – with governments, other private-sector actors, civil society organizations (CSOs) and academia to support the implementation of nutrition interventions, generate best practice, raise awareness of the role that business can play in tackling malnutrition, and advance understanding of and research into novel and improved nutrition interventions.100
4.2 Nutrition-sensitive CSR programmes
While this report focuses on interventions directly aimed at improving nutrition, companies can also take ‘nutrition-sensitive’ action in other areas.101 Nutrition-sensitive approaches can be defined as those deployed in complementary sectors – such as public health, early child development, education, and water, sanitation and hygiene (WASH) – which have the potential to improve nutrition security through tackling the wider social determinants of malnutrition, including poverty and limited access to clean water and adequate sanitation (Box 8).102 Companies already implementing strategies in the community targeting these broader sustainability areas may, through integrating nutrition-sensitive elements, demonstrate positive action in support of tackling malnutrition and contributing to the achievement of SDG 2 and nutrition-centred targets.
The integration of nutrition into existing CSR activities, for example those targeting improved health, also applies to workplace policies and programmes. The HERproject, developed by the Business for Social Responsibility (BSR) initiative, focuses on improving women’s health among employees through multi-component workplace programmes, which often include nutrition (Box 9). A 2009 literature review –
97 Baicker, J., Cutler, D. and Song, Z. (2010), ‘Workplace Wellness Programs Can Generate Savings’, Health Affairs, 29(2), doi. 10.1377/hlthaff.2009.0626 (accessed 20 Mar. 2020).98 GAIN (2019), Nutrition education, Workforce Nutrition Programme Evidence Brief 2, https://www.gainhealth.org/sites/default/files/publications/documents/evidence-brief-2-nutrition-education-2019.pdf (accessed 2 Apr. 2020); and Hawkes et al. (2019), ‘Double-duty actions: seizing programme and policy opportunities to address malnutrition in all its forms’.99 Hawkes et al. (2019), ‘Double-duty actions: seizing programme and policy opportunities to address malnutrition in all its forms’; and Loopstra, R. and Tarasuk, V. (2013), ‘Severity of household food insecurity is sensitive to change in household income and employment status among low-income families’, The Journal of Nutrition, 143(8): pp. 1316–23, doi: 10.3945/jn.113.175414 (accessed 26 Mar. 2020).100 Kraak, V. I., Harrigan, P. B., Lawrence, M. and Harrison, P. J. (2011), ‘Balancing the benefits and risks of public-private partnerships to address the global double burden of malnutrition’, Public Health Nutrition, 15(3): pp. 503–17, doi: 10.1017/S1368980011002060 (accessed 30 Mar. 2020).101 Development Initiatives (2017), Global Nutrition Report 2017: Nourishing the SDGs, https://globalnutritionreport.org/reports/2017-global-nutrition-report/ (accessed 30 Mar. 2020).102 Ruel and Alderman (2013), ‘Nutrition-sensitive interventions and programmes: how can they help to accelerate progress in improving maternal and child nutrition?’.

The Business Case for Investment in NutritionThe Added Value of Business
35 | Chatham House
predominantly focused on North America and Europe – found ‘strong evidence’ that multi-component workplace programmes combining healthy food provision with other incentives for healthy living (e.g. prompts to use the stairs rather than the lift, space for physical activity, and cues such as labelling and price promotions for certain healthy canteen options) are effective in improving diets and preventing non-communicable diseases.103
Box 8: Nutrition-sensitive WASH interventions
Water, sanitation and hygiene (WASH) and nutrition are closely interconnected.104 Insufficient access to clean drinking water, poor hygiene practices and inadequate access to sanitation facilities are all significant risk factors for undernutrition. Poor WASH conditions are conducive to the spread of illness, most notably diarrhoea and pneumonia,105 which in turn can limit an individual’s ability to absorb essential nutrients. WASH programmes are recognized as critical in improving nutritional outcomes.106 As such programmes are often implemented on a large scale by development agencies, they offer important opportunities to engage beneficiaries on the issue of nutrition and to incorporate nutritional training and education into existing awareness campaigns around good food hygiene.107
WASH programmes can be made nutrition-sensitive in a number of ways, including through targeted efforts to support and promote good WASH practices among pregnant women and new mothers during the first 1,000 days of a child’s life, when good nutrition has a particularly critical impact on lifelong health and development.108 Training WASH programme implementers – including community outreach organizations and healthcare professionals – in basic nutrition can allow for the integration of nutrition monitoring and advice into existing WASH programmes without the need for additional staff or resources.109
103 Chau, J. (2009), ‘Evidence module: Workplace physical activity and nutrition interventions’, Physical Activity and Obesity Research Group, University of Sydney, http://hdl.handle.net/2123/9073 (accessed 1 Apr. 2020).104 WHO/UNICEF/USAID (2015), Improving Nutrition Outcomes with Better Water, Sanitation and Hygiene: Practical Solutions for Policies and Programmes, https://www.unicef.org/media/files/IntegratingWASHandNut_WHO_UNICEF_USAID_Nov2015.pdf (accessed 24 Apr. 2020).105 Russell, F. and Azzopardi, P. (2019), ‘WASH: a basic human right and essential intervention for child health and development’, The Lancet Global Health, 7(4): e417, doi: 10.1016/S2214-109X(19)30078-6 (accessed 6 Apr. 2020).106 Bhutta et al. (2013), ‘Evidence-based interventions for improvement of maternal and child nutrition: what can be done and at what cost?’; and Ngure F. (2014), ‘Water, sanitation, and hygiene (WASH), environmental enteropathy, nutrition, and early child development: making the link’, Annals of the New York Academy of Sciences, 1308: pp. 118–28, doi: 10.1111/nyas.12330 (accessed 6 Apr. 2020).107 German WASH Network (2017), Linking WASH and Nutrition A Blueprint for Living SDG 17, http://www.washnet.de/wp-content/uploads/washnet17_linking-wash-nutrition_web_170721_jr.pdf (accessed 6 Apr. 2020); and Chase C. and Ngure F. (2016), Multisectoral Approaches to Improving Nutrition: Water, Sanitation, and Hygiene, The Water and Sanitation Program (WSP) Technical Paper: 102935, https://www.susana.org/en/knowledge-hub/resources-and-publications/library/details/2441 (accessed 6 Apr. 2020).108 Mbuya, M. (2016), ‘Making water, sanitation, and hygiene programs nutrition sensitive’, Global Nutrition Report blog, 26 August 2016, https://globalnutritionreport.org/blog/making-water-sanitation-and-hygiene-programs-nutrition-sensitive/ (accessed 24 Apr. 2020).109 World Bank (2019), Nutrition-Sensitive Water Supply, Sanitation, and Hygiene, Washington, DC: World Bank, http://documents.worldbank.org/curated/en/598771553098171805/pdf/135459-WP-P166089-PUBLIC.pdf (accessed 24 Apr. 2020).
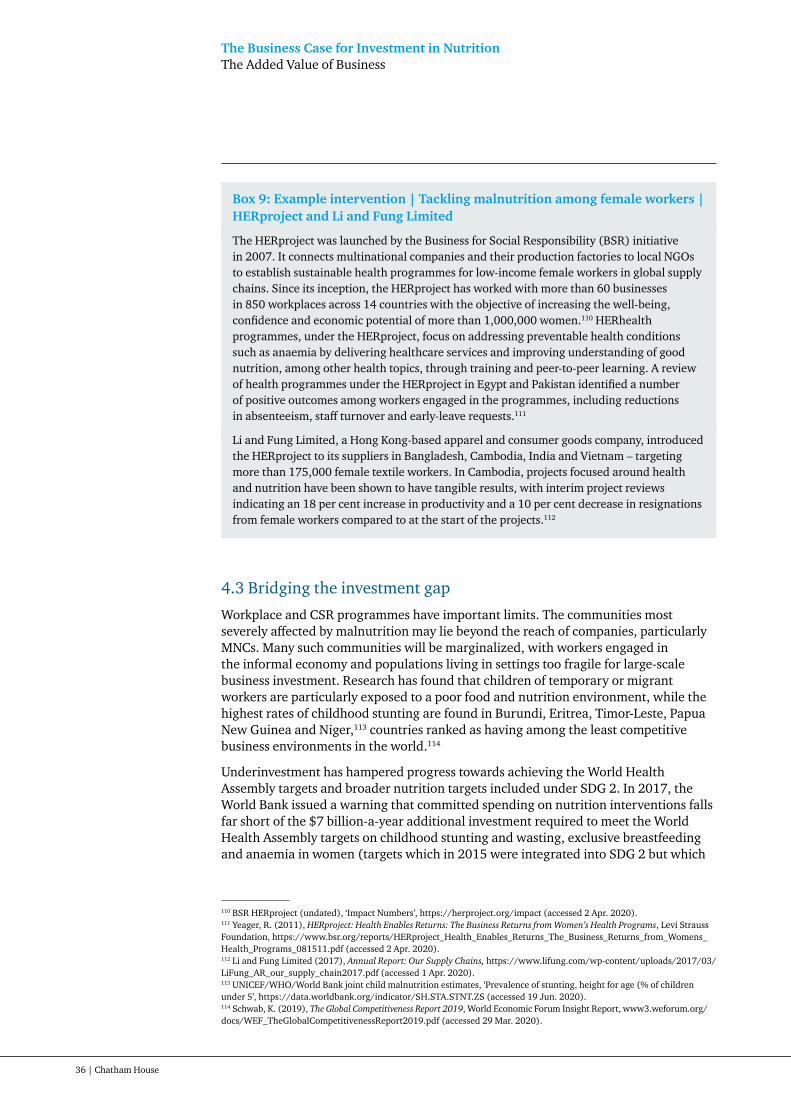
The Business Case for Investment in NutritionThe Added Value of Business
36 | Chatham House
Box 9: Example intervention | Tackling malnutrition among female workers | HERproject and Li and Fung Limited
The HERproject was launched by the Business for Social Responsibility (BSR) initiative in 2007. It connects multinational companies and their production factories to local NGOs to establish sustainable health programmes for low-income female workers in global supply chains. Since its inception, the HERproject has worked with more than 60 businesses in 850 workplaces across 14 countries with the objective of increasing the well-being, confidence and economic potential of more than 1,000,000 women.110 HERhealth programmes, under the HERproject, focus on addressing preventable health conditions such as anaemia by delivering healthcare services and improving understanding of good nutrition, among other health topics, through training and peer-to-peer learning. A review of health programmes under the HERproject in Egypt and Pakistan identified a number of positive outcomes among workers engaged in the programmes, including reductions in absenteeism, staff turnover and early-leave requests.111
Li and Fung Limited, a Hong Kong-based apparel and consumer goods company, introduced the HERproject to its suppliers in Bangladesh, Cambodia, India and Vietnam – targeting more than 175,000 female textile workers. In Cambodia, projects focused around health and nutrition have been shown to have tangible results, with interim project reviews indicating an 18 per cent increase in productivity and a 10 per cent decrease in resignations from female workers compared to at the start of the projects.112
4.3 Bridging the investment gap
Workplace and CSR programmes have important limits. The communities most severely affected by malnutrition may lie beyond the reach of companies, particularly MNCs. Many such communities will be marginalized, with workers engaged in the informal economy and populations living in settings too fragile for large-scale business investment. Research has found that children of temporary or migrant workers are particularly exposed to a poor food and nutrition environment, while the highest rates of childhood stunting are found in Burundi, Eritrea, Timor-Leste, Papua New Guinea and Niger,113 countries ranked as having among the least competitive business environments in the world.114
Underinvestment has hampered progress towards achieving the World Health Assembly targets and broader nutrition targets included under SDG 2. In 2017, the World Bank issued a warning that committed spending on nutrition interventions falls far short of the $7 billion-a-year additional investment required to meet the World Health Assembly targets on childhood stunting and wasting, exclusive breastfeeding and anaemia in women (targets which in 2015 were integrated into SDG 2 but which
110 BSR HERproject (undated), ‘Impact Numbers’, https://herproject.org/impact (accessed 2 Apr. 2020).111 Yeager, R. (2011), HERproject: Health Enables Returns: The Business Returns from Women’s Health Programs, Levi Strauss Foundation, https://www.bsr.org/reports/HERproject_Health_Enables_Returns_The_Business_Returns_from_Womens_Health_Programs_081511.pdf (accessed 2 Apr. 2020).112 Li and Fung Limited (2017), Annual Report: Our Supply Chains, https://www.lifung.com/wp-content/uploads/2017/03/LiFung_AR_our_supply_chain2017.pdf (accessed 1 Apr. 2020).113 UNICEF/WHO/World Bank joint child malnutrition estimates, ‘Prevalence of stunting, height for age (% of children under 5’, https://data.worldbank.org/indicator/SH.STA.STNT.ZS (accessed 19 Jun. 2020).114 Schwab, K. (2019), The Global Competitiveness Report 2019, World Economic Forum Insight Report, www3.weforum.org/docs/WEF_TheGlobalCompetitivenessReport2019.pdf (accessed 29 Mar. 2020).
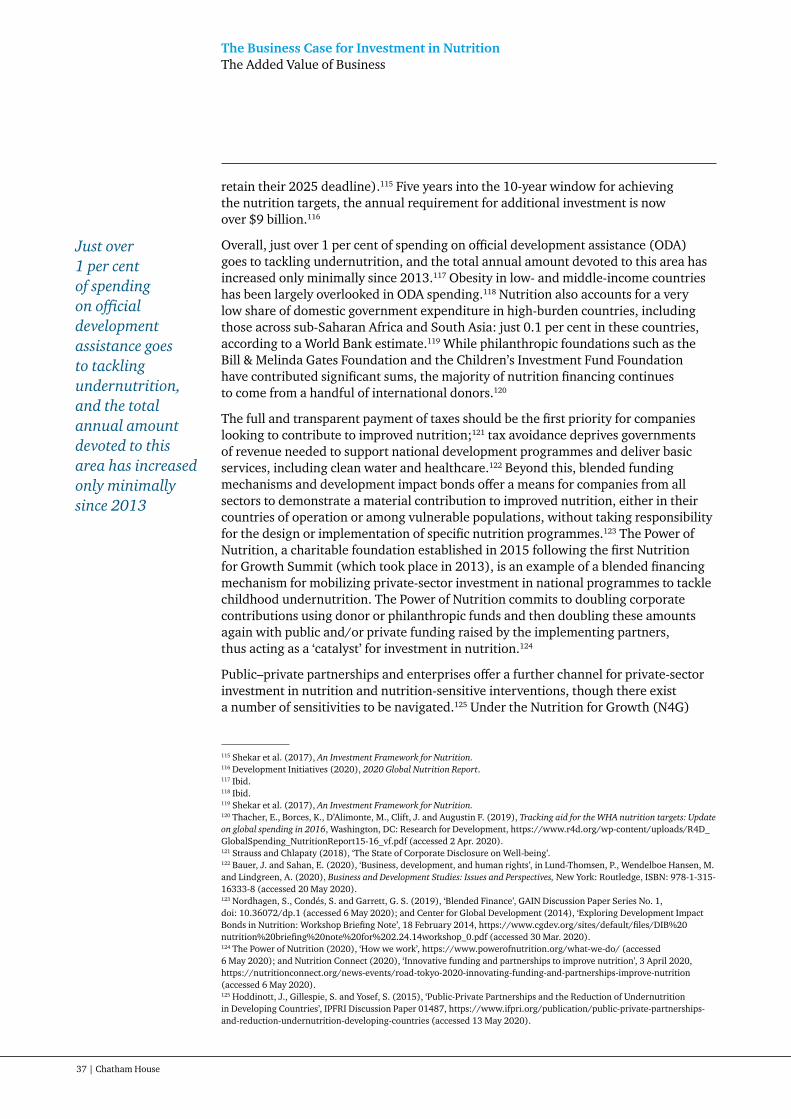
The Business Case for Investment in NutritionThe Added Value of Business
37 | Chatham House
retain their 2025 deadline).115 Five years into the 10-year window for achieving the nutrition targets, the annual requirement for additional investment is now over $9 billion.116
Overall, just over 1 per cent of spending on official development assistance (ODA) goes to tackling undernutrition, and the total annual amount devoted to this area has increased only minimally since 2013.117 Obesity in low- and middle-income countries has been largely overlooked in ODA spending.118 Nutrition also accounts for a very low share of domestic government expenditure in high-burden countries, including those across sub-Saharan Africa and South Asia: just 0.1 per cent in these countries, according to a World Bank estimate.119 While philanthropic foundations such as the Bill & Melinda Gates Foundation and the Children’s Investment Fund Foundation have contributed significant sums, the majority of nutrition financing continues to come from a handful of international donors.120
The full and transparent payment of taxes should be the first priority for companies looking to contribute to improved nutrition;121 tax avoidance deprives governments of revenue needed to support national development programmes and deliver basic services, including clean water and healthcare.122 Beyond this, blended funding mechanisms and development impact bonds offer a means for companies from all sectors to demonstrate a material contribution to improved nutrition, either in their countries of operation or among vulnerable populations, without taking responsibility for the design or implementation of specific nutrition programmes.123 The Power of Nutrition, a charitable foundation established in 2015 following the first Nutrition for Growth Summit (which took place in 2013), is an example of a blended financing mechanism for mobilizing private-sector investment in national programmes to tackle childhood undernutrition. The Power of Nutrition commits to doubling corporate contributions using donor or philanthropic funds and then doubling these amounts again with public and/or private funding raised by the implementing partners, thus acting as a ‘catalyst’ for investment in nutrition.124
Public–private partnerships and enterprises offer a further channel for private-sector investment in nutrition and nutrition-sensitive interventions, though there exist a number of sensitivities to be navigated.125 Under the Nutrition for Growth (N4G)
115 Shekar et al. (2017), An Investment Framework for Nutrition.116 Development Initiatives (2020), 2020 Global Nutrition Report.117 Ibid.118 Ibid.119 Shekar et al. (2017), An Investment Framework for Nutrition.120 Thacher, E., Borces, K., D’Alimonte, M., Clift, J. and Augustin F. (2019), Tracking aid for the WHA nutrition targets: Update on global spending in 2016, Washington, DC: Research for Development, https://www.r4d.org/wp-content/uploads/R4D_GlobalSpending_NutritionReport15-16_vf.pdf (accessed 2 Apr. 2020).121 Strauss and Chlapaty (2018), ‘The State of Corporate Disclosure on Well-being’.122 Bauer, J. and Sahan, E. (2020), ‘Business, development, and human rights’, in Lund-Thomsen, P., Wendelboe Hansen, M. and Lindgreen, A. (2020), Business and Development Studies: Issues and Perspectives, New York: Routledge, ISBN: 978-1-315-16333-8 (accessed 20 May 2020).123 Nordhagen, S., Condés, S. and Garrett, G. S. (2019), ‘Blended Finance’, GAIN Discussion Paper Series No. 1, doi: 10.36072/dp.1 (accessed 6 May 2020); and Center for Global Development (2014), ‘Exploring Development Impact Bonds in Nutrition: Workshop Briefing Note’, 18 February 2014, https://www.cgdev.org/sites/default/files/DIB%20nutrition%20briefing%20note%20for%202.24.14workshop_0.pdf (accessed 30 Mar. 2020).124 The Power of Nutrition (2020), ‘How we work’, https://www.powerofnutrition.org/what-we-do/ (accessed 6 May 2020); and Nutrition Connect (2020), ‘Innovative funding and partnerships to improve nutrition’, 3 April 2020, https://nutritionconnect.org/news-events/road-tokyo-2020-innovating-funding-and-partnerships-improve-nutrition (accessed 6 May 2020).125 Hoddinott, J., Gillespie, S. and Yosef, S. (2015), ‘Public-Private Partnerships and the Reduction of Undernutrition in Developing Countries’, IPFRI Discussion Paper 01487, https://www.ifpri.org/publication/public-private-partnerships-and-reduction-undernutrition-developing-countries (accessed 13 May 2020).
Just over 1 per cent of spending on official development assistance goes to tackling undernutrition, and the total annual amount devoted to this area has increased only minimally since 2013
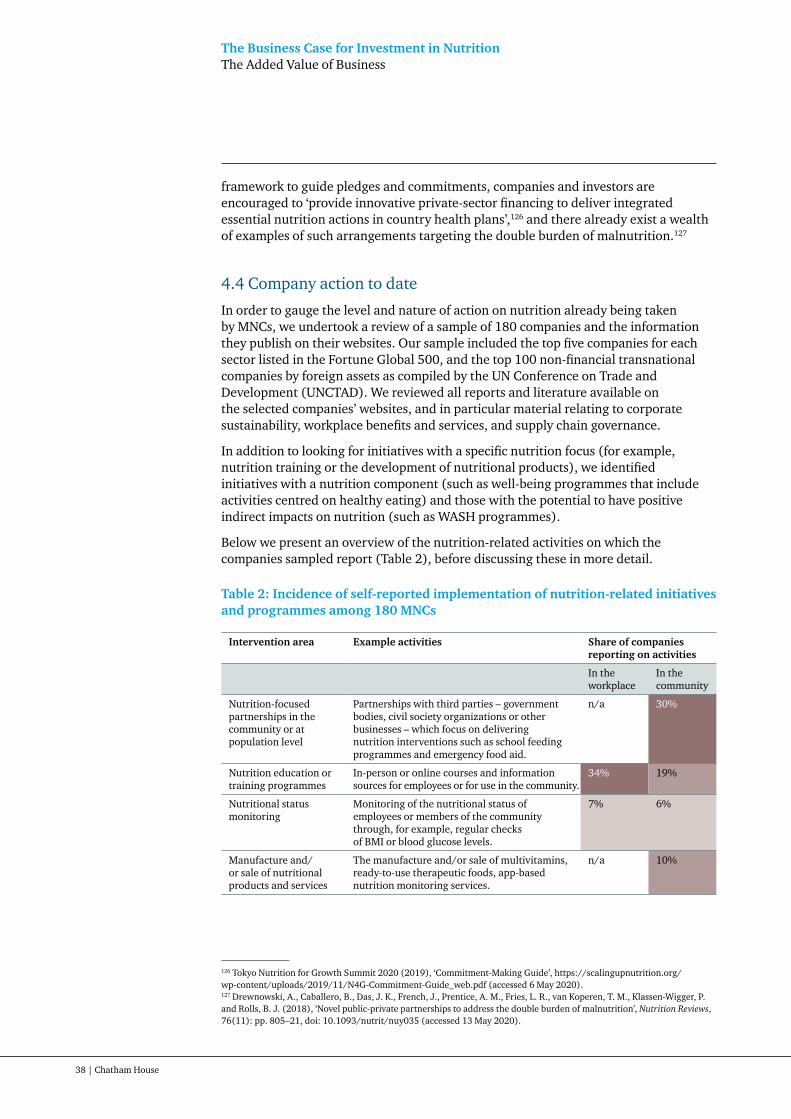
The Business Case for Investment in NutritionThe Added Value of Business
38 | Chatham House
framework to guide pledges and commitments, companies and investors are encouraged to ‘provide innovative private-sector financing to deliver integrated essential nutrition actions in country health plans’,126 and there already exist a wealth of examples of such arrangements targeting the double burden of malnutrition.127
4.4 Company action to date
In order to gauge the level and nature of action on nutrition already being taken by MNCs, we undertook a review of a sample of 180 companies and the information they publish on their websites. Our sample included the top five companies for each sector listed in the Fortune Global 500, and the top 100 non-financial transnational companies by foreign assets as compiled by the UN Conference on Trade and Development (UNCTAD). We reviewed all reports and literature available on the selected companies’ websites, and in particular material relating to corporate sustainability, workplace benefits and services, and supply chain governance.
In addition to looking for initiatives with a specific nutrition focus (for example, nutrition training or the development of nutritional products), we identified initiatives with a nutrition component (such as well-being programmes that include activities centred on healthy eating) and those with the potential to have positive indirect impacts on nutrition (such as WASH programmes).
Below we present an overview of the nutrition-related activities on which the companies sampled report (Table 2), before discussing these in more detail.
Table 2: Incidence of self-reported implementation of nutrition-related initiatives and programmes among 180 MNCs
Intervention area Example activities Share of companies reporting on activities
In the workplace
In the community
Nutrition-focused partnerships in the community or at population level
Partnerships with third parties – government bodies, civil society organizations or other businesses – which focus on delivering nutrition interventions such as school feeding programmes and emergency food aid.
n/a 30%
Nutrition education or training programmes
In-person or online courses and information sources for employees or for use in the community.
34% 19%
Nutritional status monitoring
Monitoring of the nutritional status of employees or members of the community through, for example, regular checks of BMI or blood glucose levels.
7% 6%
Manufacture and/or sale of nutritional products and services
The manufacture and/or sale of multivitamins, ready-to-use therapeutic foods, app-based nutrition monitoring services.
n/a 10%
126 Tokyo Nutrition for Growth Summit 2020 (2019), ‘Commitment-Making Guide’, https://scalingupnutrition.org/wp-content/uploads/2019/11/N4G-Commitment-Guide_web.pdf (accessed 6 May 2020).127 Drewnowski, A., Caballero, B., Das, J. K., French, J., Prentice, A. M., Fries, L. R., van Koperen, T. M., Klassen-Wigger, P. and Rolls, B. J. (2018), ‘Novel public-private partnerships to address the double burden of malnutrition’, Nutrition Reviews, 76(11): pp. 805–21, doi: 10.1093/nutrit/nuy035 (accessed 13 May 2020).

The Business Case for Investment in NutritionThe Added Value of Business
39 | Chatham House
Intervention area Example activities Share of companies reporting on activities
In the workplace
In the community
Breastfeeding support Support for workers or the wider community, for example, through information and support campaigns, the provision of private breastfeeding spaces and equipment, or support for the storage and transport of expressed breastmilk.
18% 6%
Incentives for healthy eating
Nutrition-based food labelling in the workplace and on proprietary products, awareness campaigns around healthy diets.
44% 13%
On-site food provision and community feeding programmes
Staff canteens and food voucher systems offering free or subsidized healthy food, community-based meal provision such as school feeding programmes.
16% 20%
WASH interventions Programmes to provide or promote the use of clean water, drinking water and safe sanitation, including through workplace facilities, handwashing campaigns and support to third-party organizations implementing WASH programmes.
6% 33%
Investment in agricultural production and value chains
Programmes to support farmers to improve productivity and efficiency, either along the company’s value chain (classed as ‘in the workplace’ here) or in the wider community (classed as ‘in the community’ here).
7% 9%
Note: Dark lavender indicates that more than 25 per cent of the 180 companies sampled report on activities; lavender indicates that between 10 and 25 per cent do so; and light lavender indicates that fewer than 10 per cent do so. n/a = not applicable.
4.4.1 Business engagement in nutrition-focused partnerships
Fifty-four companies reported working in partnership with other stakeholders – businesses, governments, CSOs and/or research institutes – on nutrition-related programmes in the community or at population level. Twenty-nine of the reported partnerships are with other businesses, either bilaterally or through business platforms such as the Global Alliance for Improved Nutrition (GAIN), the Scaling up Nutrition Business Network (SBN), the World Business Council for Sustainable Development (WBCSD), or the Consumer Goods Forum (CGF) (Box 10).
Twenty-six of the reported partnerships are with CSOs on initiatives including the distribution of nutrient supplementation, agricultural value chain development, and emergency delivery of ready-to-use therapeutic foods, while eight companies report working with donor agencies such as UNICEF and the World Food Programme. Fourteen of the reported partnerships are with governments in low-income countries, with such arrangements including school meal programmes and investments (through public–private partnerships) in food fortification and nutrient supplementation production facilities and supply chains. Of the 54 companies involved in a nutrition-focused partnership, only nine are not implementing another form of nutrition-centred programme or initiative (such as nutrition education or training in the workplace, or the manufacture and sale of nutritional products).
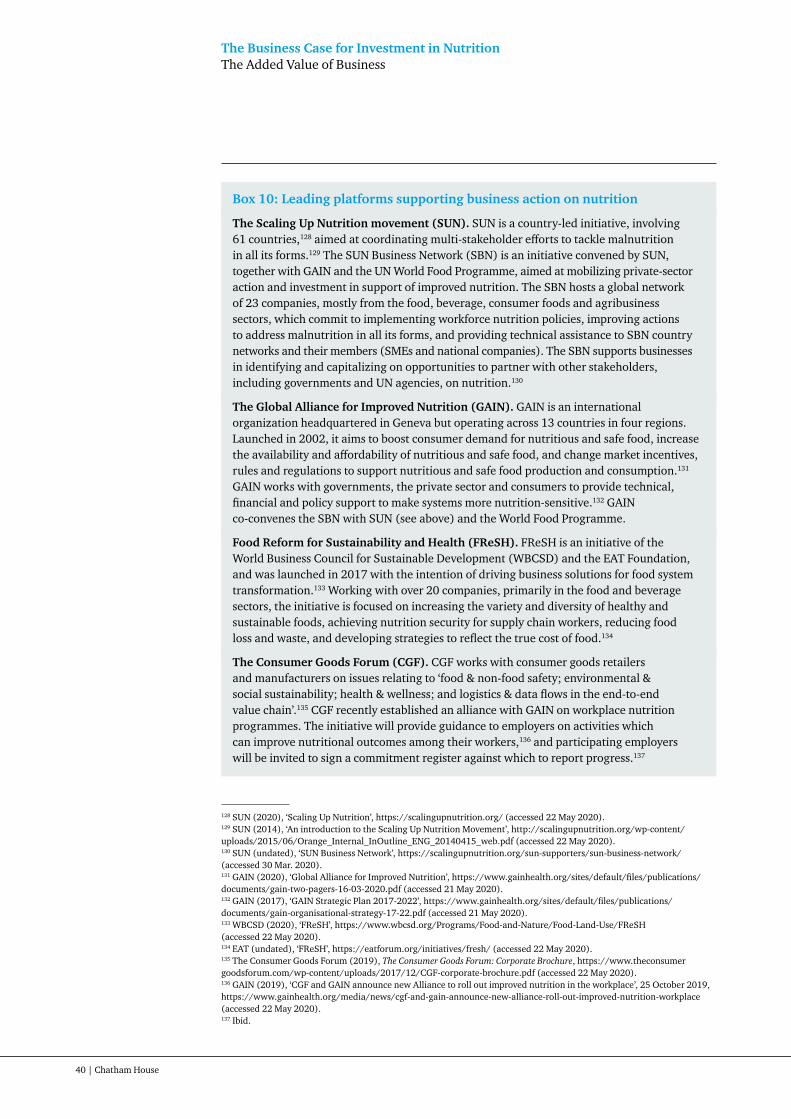
The Business Case for Investment in NutritionThe Added Value of Business
40 | Chatham House
Box 10: Leading platforms supporting business action on nutrition
The Scaling Up Nutrition movement (SUN). SUN is a country-led initiative, involving 61 countries,128 aimed at coordinating multi-stakeholder efforts to tackle malnutrition in all its forms.129 The SUN Business Network (SBN) is an initiative convened by SUN, together with GAIN and the UN World Food Programme, aimed at mobilizing private-sector action and investment in support of improved nutrition. The SBN hosts a global network of 23 companies, mostly from the food, beverage, consumer foods and agribusiness sectors, which commit to implementing workforce nutrition policies, improving actions to address malnutrition in all its forms, and providing technical assistance to SBN country networks and their members (SMEs and national companies). The SBN supports businesses in identifying and capitalizing on opportunities to partner with other stakeholders, including governments and UN agencies, on nutrition.130
The Global Alliance for Improved Nutrition (GAIN). GAIN is an international organization headquartered in Geneva but operating across 13 countries in four regions. Launched in 2002, it aims to boost consumer demand for nutritious and safe food, increase the availability and affordability of nutritious and safe food, and change market incentives, rules and regulations to support nutritious and safe food production and consumption.131 GAIN works with governments, the private sector and consumers to provide technical, financial and policy support to make systems more nutrition-sensitive.132 GAIN co-convenes the SBN with SUN (see above) and the World Food Programme.
Food Reform for Sustainability and Health (FReSH). FReSH is an initiative of the World Business Council for Sustainable Development (WBCSD) and the EAT Foundation, and was launched in 2017 with the intention of driving business solutions for food system transformation.133 Working with over 20 companies, primarily in the food and beverage sectors, the initiative is focused on increasing the variety and diversity of healthy and sustainable foods, achieving nutrition security for supply chain workers, reducing food loss and waste, and developing strategies to reflect the true cost of food.134
The Consumer Goods Forum (CGF). CGF works with consumer goods retailers and manufacturers on issues relating to ‘food & non-food safety; environmental & social sustainability; health & wellness; and logistics & data flows in the end-to-end value chain’.135 CGF recently established an alliance with GAIN on workplace nutrition programmes. The initiative will provide guidance to employers on activities which can improve nutritional outcomes among their workers,136 and participating employers will be invited to sign a commitment register against which to report progress.137
128 SUN (2020), ‘Scaling Up Nutrition’, https://scalingupnutrition.org/ (accessed 22 May 2020).129 SUN (2014), ‘An introduction to the Scaling Up Nutrition Movement’, http://scalingupnutrition.org/wp-content/uploads/2015/06/Orange_Internal_InOutline_ENG_20140415_web.pdf (accessed 22 May 2020).130 SUN (undated), ‘SUN Business Network’, https://scalingupnutrition.org/sun-supporters/sun-business-network/ (accessed 30 Mar. 2020).131 GAIN (2020), ‘Global Alliance for Improved Nutrition’, https://www.gainhealth.org/sites/default/files/publications/documents/gain-two-pagers-16-03-2020.pdf (accessed 21 May 2020).132 GAIN (2017), ‘GAIN Strategic Plan 2017-2022’, https://www.gainhealth.org/sites/default/files/publications/documents/gain-organisational-strategy-17-22.pdf (accessed 21 May 2020).133 WBCSD (2020), ‘FReSH’, https://www.wbcsd.org/Programs/Food-and-Nature/Food-Land-Use/FReSH (accessed 22 May 2020).134 EAT (undated), ‘FReSH’, https://eatforum.org/initiatives/fresh/ (accessed 22 May 2020).135 The Consumer Goods Forum (2019), The Consumer Goods Forum: Corporate Brochure, https://www.theconsumer goodsforum.com/wp-content/uploads/2017/12/CGF-corporate-brochure.pdf (accessed 22 May 2020).136 GAIN (2019), ‘CGF and GAIN announce new Alliance to roll out improved nutrition in the workplace’, 25 October 2019, https://www.gainhealth.org/media/news/cgf-and-gain-announce-new-alliance-roll-out-improved-nutrition-workplace (accessed 22 May 2020).137 Ibid.

The Business Case for Investment in NutritionThe Added Value of Business
41 | Chatham House
4.4.2 Inconsistencies in reporting
Companies vary significantly in the type and depth of information they include in their sustainability reports, annual reports and company websites with regard to nutrition. There is often little consistency at company level from one year to the next, and the information provided is often limited in detail, particularly regarding the longevity and geographical scope of any programmes (our interviews indicate that certain workforce programmes are not implemented uniformly across a company’s countries of operation). Very few companies report on the effectiveness or impact of their programmes or activities.
Our interviews with company representatives suggest that a lack of data on the nutritional status of employees and local populations is a barrier to assessing and responding to the burden of malnutrition among stakeholders:
“ At headquarters level, we’re unlikely to have HR people who have an overview of absenteeism and the reasons for this.
“ Due to privacy laws, there is a limit to the data we can collect.
“ About two-thirds of the workforce are contractors. They do labour-intensive work. Their health status and data are opaque to us.
“ Governments in emerging market countries have their hands full, so we don’t want to rely on them too much as the data may be out of date.
In the absence of a standard practice or common reporting framework for action on nutrition, the lack of mention of any relevant activities in company sustainability and annual reports does not necessarily indicate that no such activities are ongoing, but simply that companies are not reporting on them. The language used to describe activities is often highly specific to each company, making it challenging at times to categorize activities according to the intervention areas above (see Annex IV for detail on the activities included under each area). In some cases, third-party literature indicates that a company is implementing a nutrition-relevant programme, but the company itself does not mention this in its reports or on its website (an indication perhaps of the lack of external interest in corporate reporting on the issue).
4.4.3 Divergence in approach within the company
In total, 150 of the 180 companies sampled report that they are implementing one of the initiatives or programmes listed above in Table 2. Sixty-nine companies say they are doing so in the workplace and in the wider community, while 41 report taking action within the workplace only. A further 40 report on community-focused programmes but indicate no parallel programmes in the workplace.
Discussions with interview participants indicated that outward-facing sustainability initiatives and inward-facing workforce initiatives are rarely linked up, though there were two notable exceptions. These two company representatives, both from the food sector, described a cross-company approach to promoting improved nutrition. The first spoke of combined efforts to assess and improve the affordability and quality of food on offer to employees, to assess and improve the nutrition security of suppliers and their families, and to mainstream improved nutrition and sustainability across the company’s policies, from CSR through to recruitment and internal HR policies.
The lack of mention of any relevant activities in company sustainability and annual reports does not necessarily indicate that no such activities are ongoing, but simply that companies are not reporting on them

The Business Case for Investment in NutritionThe Added Value of Business
42 | Chatham House
The second described integrated activities to promote healthy food choices in the staff canteen, to train all staff in the principles of a healthy diet, to invest in improved food availability and dietary diversity among farmers in sourcing locations, to build cooking skills among those farmers and their families, and to build local supply chains in sourcing locations for the valuing and redistribution of excess produce.
Responses to questions regarding company activities in addressing malnutrition frequently indicated a lack of coordination or consistency between parallel strands of work, with participants either unaware of or unable to attest to initiatives run by separate parts of their organization in different departments or locations:
“ Work at [our company] is pretty fragmented – there’s not a lot of joined-up thinking.
“ I would like to say that [the services we offer] are uniform, but it is likely that they’re not. The company isn’t a top-down company; the local organizations have a lot of autonomy.
“ Certain businesses will be leading the way while others don’t do anything on health and nutrition.
In the case of community or supply chain engagement, participants largely pointed to a handful of countries in which their company has active programmes, designed in response to specific identified needs. Workplace services such as subsidized food or health screenings were noted by participants as being contingent upon, and designed around, local needs, capacities or regulations.
“ We try to look at the barriers to sustainable growth in each of the countries and then identify in which ways we can connect more and support the government in overcoming these barriers.
“ In-country partners run the work on the ground with worker committees and with supply chains and identify where money should be invested.
“ We’re working on a cost–benefit analysis tool focused on workplace health interventions. This would identify the illnesses most costly to a given business and then identify the most cost-effective interventions to tackle those illnesses.
43 | Chatham House
5. Towards an Action Agenda for Business
With the approach of key summits and events, and ‘resilience’ high on the agenda as a result of COVID-19, the next 18 months offer a window of opportunity for business engagement on nutrition.
Sentiment around business action on nutrition is changing. Governments, donors and development actors are increasingly recognizing the pivotal role that the private sector can play, both in mobilizing much-needed funding to support nutrition interventions and in leveraging its expertise and reach to deliver innovative new solutions. The investment community is waking up to the centrality of health and well-being to the sustainability agenda, and pioneering companies are trialling new ways of tracking and strengthening their contributions to improved nutrition and human capital development.
However, time is of the essence. Targets to reduce the prevalence of childhood stunting and wasting and of anaemia among women, and to increase rates of exclusive breastfeeding, are supposed to be met in five years’ time; the broader SDG nutrition targets in 10 years’ time. On current trajectories, these targets will not be met.138 Without rapidly accelerated action from all stakeholders, the costs of malnutrition will rise, the drag on human capital and sustainable development will be more severe, and the SDG agenda will be at risk.
5.1 A window of opportunity
The next 18 months offer an important window of opportunity for businesses to engage in the fight against malnutrition and to help drive progress towards the World Health Assembly targets and wider SDG nutrition targets. Over this period, a series of high-level international events and moments will together provide the foundations for more ambitious and coordinated action to reshape the food system – and the wider economy – to deliver nutritious diets for all.
Coming midway through the UN’s Decade of Action on Nutrition, the Tokyo Nutrition for Growth Summit (currently due to take place in December 2020) will serve as a key moment for the pledging, renewal and ramping up of commitments from governments, multilateral organizations, financiers, investors, civil society and businesses to fill the investment gap that persists around undernutrition. It is also hoped that the summit will boost commitments signalling collective action to tackle the double burden of malnutrition that now threatens the future of societies around the world. The outcomes of the summit will form the basis of a new ‘2020 Compact’ designed to mobilize and accelerate cross-sector action towards achievement of SDG 2.139
In 2021, the UN secretary-general will host the first UN Food Systems Summit to ‘raise global awareness and land global commitments and actions that transform food systems to resolve not only hunger, but to reduce diet-related disease and heal the planet’. The summit will call for engagement from all actors with a stake in shaping the food system, including business stakeholders from across the economy – notably those working in infrastructure, information and technology, financial services and transport, among many others. The summit will offer businesses that have not
138 FAO et al. (2019), The State of Food Security and Nutrition in the World 2019.139 Tokyo Nutrition for Growth Summit 2020 (2019), ‘Commitment-Making Guide’.

The Business Case for Investment in NutritionTowards an Action Agenda for Business
44 | Chatham House
previously engaged in the nutrition agenda an opportunity to signal a commitment to integrated action to deliver against the SDGs, including by contributing to improved nutrition.
Discussions at the 26th Conference of the Parties (COP26) to the UN Framework Convention on Climate Change (UNFCCC), postponed until 2021, will also address the question of how to feed the global population nutritiously and sustainably. As highlighted in a recent special report on climate change and land by the Intergovernmental Panel on Climate Change (IPCC), food systems are a major driver of climate change, and their transformation in support of delivering food and nutrition security for all within the limits of the planet is recognized as a priority for action. Similar issues will be addressed at the 15th Conference of the Parties to the Convention on Biological Diversity (CBD), as global leaders from government and the private sector seek to establish a new pathway for sustainable agriculture that supports – rather than destroys – biodiversity.
Perhaps most importantly, the next 18 months will be a period of rapid change as public and private decision-makers around the world respond to the COVID-19 pandemic and begin preparing for recovery amid an anticipated global economic recession of unprecedented scale. The challenges to which the pandemic gives rise are innumerable, and there is a very real risk of a rolling back on progress made in tackling malnutrition and poverty over recent decades. But there are also opportunities. Governments, business leaders, financiers and investors are coalescing around the need to prioritize public health and resilience. These themes are already the focus of the communities of practice mentioned above, and will now inevitably move to the top of the agenda for the G7 and the G20, as well as for national governments and regional bodies across low- and middle-income countries.
Tackling malnutrition can be a catalyst for driving public health and resilience, and ‘building back better’. As the world comes to terms with the fallout from COVID-19, corporate leaders will come under scrutiny from their shareholders and stakeholders to answer difficult questions: How will you continue to deliver financial returns against the backdrop of a global recession? How will you support small and medium-sized businesses along your value chain? How will you build the resilience of your workforce to future disease outbreaks? Investing in improved nutrition, among the workforce of today and of the next generation, will be a critical ingredient in shoring up productive economies, stalling the spread of poverty, and building the resilience of populations, communities, businesses and households to future public health, economic and environmental shocks.
The Tokyo Nutrition for Growth (N4G) Summit marks the next major milestone in the global fight against malnutrition. Commitments being prepared by public and private stakeholders ahead of this summit will focus on five core themes:
• integrating nutrition into universal health coverage;
• investing in climate-smart food systems that promote healthy diets and nutrition and support producer livelihoods;
• building resilience in conflict-affected and fragile settings by tackling malnutrition and its underlying drivers;
• promoting data-driven accountability; and
• securing new investment and innovation in nutrition financing.140
140 Ibid.
The challenges to which the COVID-19 pandemic gives rise are innumerable, and there is a very real risk of a rolling back on progress made in tackling malnutrition and poverty over recent decades

The Business Case for Investment in NutritionTowards an Action Agenda for Business
45 | Chatham House
These are themes that span far beyond the N4G framework and that will need to guide action, from all stakeholders, to tackle malnutrition in all its forms. Delivering against these themes cannot fall to the private sector alone, and many of the requisite actions and investments will need to be society-wide, driven by governments, donors and international development leaders. But businesses can play a major and central role, both unilaterally and through partnership, above all in advancing transparency and accountability around corporate activity and its impact on nutrition, and in ramping up investment in initiatives to tackle malnutrition.
Concerted efforts will be required – from companies, as well as from civil society and government partners – to develop the evidence base to support proven and effective corporate strategies on nutrition. Currently, that evidence base is weak, owing to limited reporting of nutrition-related corporate activities. As more companies report transparently on relevant initiatives both in the workplace and in the context of corporate sustainability programmes, and trial new ways of delivering improved nutrition outcomes among their stakeholders, examples of best practice – and of learnings from failed interventions – will emerge to inform future action.
For now, it is possible to identify broad actions that business leaders from all sectors can and should take to strengthen their response to the global burden of malnutrition.
5.2 Recommendations for business action
5.2.1 Commit to improving nutritional outcomes among all employees and suppliers
Implement group-wide minimum workplace policies on nutrition. While malnutrition is a global problem, it requires a locally tailored response. As the results of our model show, the relative burden of undernutrition and overweight/obesity varies between countries and sectors, as well as between occupations and sociodemographic groups. To be effective, company actions on nutrition need to be informed by needs and priorities at country level, and even at site level. Actions will need to take into account additional factors that could affect the efficacy or uptake of a given intervention or initiative, including local dietary preferences and perceptions and stigmas surrounding underweight and overweight. Nevertheless, existing and emerging evidence on the potential for workplace interventions to improve the nutritional outcomes of employees points to a small number of basic measures that companies can and should commit to as a minimum. These include:
• mandatory nutrition training for employees on the foundations of a healthy diet and safe food preparation;
• support for breastfeeding mothers, such as flexibility on working hours to allow for continued feeding at home and a private space in work to express milk;
• provision of nutritious and subsidized food in the workplace, with portion control measures and labelling to signal healthier choices;
• the integration of nutritional status monitoring into regular health checks, for example blood pressure measurement and weight monitoring, together with advice on improving nutritional outcomes; and
The Business Case for Investment in NutritionTowards an Action Agenda for Business
46 | Chatham House
• the inclusion of healthy-eating messages and incentives into health and well-being programmes.
None of these policies is in itself a silver bullet but, collectively, they have the potential to positively impact the nutritional well-being of employees.
Support supply chain partners in introducing similar minimum policies. MNCs with long and complex supply chains are in a unique position to support action across an ecosystem of smaller businesses operating in low- and middle-income countries. Where capacity or know-how is lacking, particularly among SMEs, MNCs should look to provide resources and guidance to help supply chain partners implement a minimum policy package. Where necessary, they should consider incentivizing the engagement of supply chain partners, for example through longer contract terms and shorter payment terms. Ultimately, by making such a package a precondition for continuing the business relationship, MNCs can – and should – mobilize action far beyond their own operations.
Work towards following best-practice guidance where available. Evidence of the efficacy of different interventions to improve nutritional outcomes among workers and their families remains scant. Nevertheless, efforts are under way to collate examples of best practice and develop new guidance for businesses. Findings and initiatives emerging from the newly established alliance between GAIN and the Consumer Goods Forum on workforce nutrition interventions should become the first port of call for companies looking to establish, improve and scale up their own programmes and policies.141 Companies should also look to work with platforms such as the SUN Business Network and FReSH initiative, which facilitate and support company-level and collaborative action among the food and beverage industries and beyond.
5.2.2 Seek out partnerships – with business, government and civil society – to deliver improved nutrition to communities and populations
Integrate nutrition into existing corporate sustainability programmes. Investment in support of improved nutritional outcomes among the communities and populations within which companies operate need not require new, dedicated CSR programmes. Many existing programmes relating to WASH, education and women’s health, among others, could be easily adapted to include a nutrition element and yield positive results both in terms of nutrition security and the original goals of the programme. Examples of possible adaptions include: integration into women’s empowerment programmes of guidance on breastfeeding and nutrition during a child’s first 1,000 days of life; inclusion of advice on safe food preparation within community WASH programmes; monitoring of nutrition risk indicators such as blood pressure and BMI during community health checks; and targeting of education and schooling programmes in regions with a high burden of poverty and malnutrition.
Collaborate to deliver effective large-scale solutions. Partnerships are an important means through which companies may participate in the design and delivery of solutions at a scale that may not be possible through unilateral action. Cooperation with governments, donor agencies and development partners can be critical in ensuring that investments are sustainable and effective, particularly
141 GAIN (2019), ‘CGF and GAIN announce new Alliance to roll out improved nutrition in the workplace’.

The Business Case for Investment in NutritionTowards an Action Agenda for Business
47 | Chatham House
for companies without previous experience in this space. The pooling of resources and expertise through such partnerships can create enabling conditions for the delivery of large-scale nutrition programmes – such as the fortification of staple foods or the distribution of ready-to-use therapeutic foods in emergency situations – for which partners working unilaterally may lack the expertise, reach or financial resources. Collaboration between companies, particularly those working in the same region, can also help to accelerate delivery of improved nutrition at population level – a common good from which no single company will derive a competitive advantage.
Commit financial resources at a meaningful scale. Companies from all sectors should use the upcoming Tokyo Nutrition for Growth Summit as a high-profile opportunity to make meaningful financial commitments towards improved nutrition. In addition to workplace pledges, companies should look to make financial and non-workplace programmatic commitments of a scale that can lead to real impact – an example of progress in this area involves India’s Tata Trusts, which has pledged $50 million a year through to 2025 and which is on course to meet this commitment.142 In addition, companies can signal their commitment to financing research and development – among partners or internally – to accelerate the scale-up and distribution of innovative new solutions, from technologies to support improved productivity through to digital platforms for the dissemination of nutrition training and advice. Blended finance mechanisms, including The Power of Nutrition, offer an alternative means of making and fulfilling unilateral commitments, allowing companies to pool their contributions with other companies, foundations and government donors to support the scaling up of proven interventions.
5.2.3 Commit to full transparency and good governance around company action on nutrition
Monitor, evaluate and report on all nutrition-related activity. Companies already implementing relevant programmes and policies should commit to monitoring and evaluation, and to rigorous reporting – both internally and against public commitments such as those under the N4G framework. This will be essential to building the evidence base of what works and what does not. Documenting success stories is key, but so too is reflecting on the failures and limitations of any given intervention and on who was not reached among vulnerable and/or target communities.143
Ensure full disclosure of conflicts of interest. All businesses, but most importantly those in the food and beverage sectors, should be open and transparent in reporting on vested interests when entering into partnerships with public or civil society actors or platforms.144 Such vested interests need not preclude corporate involvement in nutrition activities, but registering those interests and engaging in critical debate with internal and external stakeholders on their possible influence on project design
142 Development Initiatives (2019), ‘Nutrition for Growth Commitment Tracking’, updated 20 October 2019, https://globalnutritionreport.org/resources/nutrition-growth-commitment-tracking/ (accessed 21 May 2020).143 World Bank (2010), What Can We Learn from Nutrition Impact Evaluations: Lessons from a review of interventions to reduce child malnutrition in developing countries, Washington, DC: World Bank, doi: 10.1596/978-0-8213-8406-0 (accessed 3 Apr. 2020).144 Eggersdorfer, M. and Bird, J. K. (2016), ‘How to achieve transparency in public-private partnerships engaged in hunger and malnutrition reduction’, in Biesalski, H. K. and Black, R. E. (eds) (2016), Hidden Hunger: Malnutrition and the First 1,000 Days of Life: Causes, Consequences and Solutions, World Review of Nutrition, Vol. 115: pp. 224–32, doi: 10.1159/000442109 (accessed 1 Apr. 2020).
Documenting success stories is key, but so too is reflecting on the failures and limitations of any given intervention and on who was not reached among vulnerable and/or target communities

The Business Case for Investment in NutritionTowards an Action Agenda for Business
48 | Chatham House
or outcomes should be a priority.145 A commitment to openness and disclosure in this way is critical not only to nutrition-related research, but to all partnership initiatives, lobbying activities and research funding.
Support the integration of nutrition into ESG frameworks. Malnutrition and the impact of business on the nutrition of stakeholders are becoming material risks both to the companies concerned and to institutional investors and asset managers. The investment community is in a strong position to drive greater corporate accountability and influence companies’ impact on nutrition. The integration of nutrition metrics by ESG data providers and sustainability-focused investor groupings can ramp up pressure on poorly performing companies and create a new culture of transparency around the issue. But businesses’ cooperation, through full disclosure, with these ESG frameworks will be critical to success. For those serious about delivery against SDG 2 and the wider SDG agenda, a proactive approach to supporting the measurement of companies’ nutrition impacts – in the workplace and among the wider community and population – is a fundamental first step.
Ensure food and beverage products are supportive of improved nutrition. Companies in the food and beverage sectors have a particular duty to ensure that their products and practices contribute to, rather than threaten, improved nutrition in low- and middle-income countries. This is true not only of the products themselves but of their marketing. There is strong evidence, for example, of the negative impact that the marketing of products high in fat, salt and sugar to children can have in driving overweight, obesity and diet-related disease. Harmful practices, such as non-compliance with the International Code of Marketing of Breastmilk Substitutes or with best-practice guidance on the use of nutritional claims about foods and nutrition products, undermine both trust in industry and progress towards overcoming malnutrition. For companies professing to support improved nutrition through CSR activities, workplace nutrition programmes and healthier product ranges, a commitment to ‘doing no harm’ should be an urgent priority.
145 Alexander, N., Rowe, S., Brackett, R. E., Burton-Freeman, B., Hentges, E. J., Kretser, A., Klurfield, D. M., Meyers, L. D., Mukherjea, R. and Ohlhorst, S. (2015), ‘Achieving a transparent, actionable framework for public-private partnerships for food and nutrition research’, The American Journal of Clinical Nutrition, 101(6): pp. 1359–63, doi: 10.3945/ajcn.115.112805 (accessed 1 Apr. 2020).

49 | Chatham House
Annex I: Methodology – Vivid Economics ModelJason Eis, Cor Marijs, Caroline Vexler and Florence Waites
Here we explain the methodology and data sources used in the modelling analysis to answer the question: ‘What would happen to business output in the short term if workers achieved the physical state associated with good nutritional outcomes?’
We start in Section 1.1 with a review of the human capital approach to estimating worker productivity, followed by a review of the literature on the direct impact of malnutrition on worker productivity. Subsequent sub-sections review the evidence on four specific types of malnutrition: underweight, obesity, anaemia and childhood malnutrition.
Section 1.2 briefly outlines the theoretical approach behind the modelling analysis, before Sections 1.3 to 1.6 describe the steps involved in generating the estimates used to inform this report’s conclusions. As Figure 12 summarizes, there were five stages to the modelling analysis. Below, we explain the data used and our modelling approach.
1.1 The human capital approach
This analysis assumes that malnutrition reduces the capacity of the labour force through compromising the quality of human capital. Mincer’s146 model of human capital expresses wages as a function of worker characteristics.147 The total remuneration of a worker is viewed as a base wage (the marginal productivity of a benchmark worker) plus a wage premium associated with each worker characteristic that raises human capital.148 A typical Mincer wage equation would be:
Wi = Wo ∙ exp(λS Si+λE Ei+λH Hi+λX Xi)
where Wi is the total wage, Wo is the benchmark wage, Si is education, Ei is labour market experience, Hi is a vector of physical and mental health variables, and Xi is a vector of control variables denoting labour market and demographic characteristics. This leads to the widely estimated equation:149
lnWi = λ0+λS Si+λE ln(Ei)+λH Hi+λX Xi+εi
where εi is an error term.
Malnutrition augments numerous terms within the human capital model, highlighting its relevance to the issue of labour productivity. Malnutrition impacts the education (Si) an individual obtains, as children with nutritional difficulties tend to enrol in school later than other children, progress more slowly across grades and attain lower levels of scholarly achievement. Furthermore, malnutrition is the leading cause of ill-health and disability (Hi), which also contributes to lower levels of labour market experience (Ei).
146 Mincer, J. (1974), Schooling, experience and earnings, National Bureau of Economic Research and Columbia University, London: Columbia University Press.147 As a rule, wage differentials reflect productivity differentials between worker groups. Van Biesebroeck, J. (2015), How tight is the link between wages and productivity? A survey of the literature, Conditions of Work and Employment Series No. 54, https://www.ilo.org/wcmsp5/groups/public/---ed_protect/---protrav/---travail/documents/publication/wcms_410267.pdf (accessed 7 Apr. 2020).148 Ibid.149 A common assumption is that the wage premium associated with each year of labour market experience is not constant, but that the elasticity is. This determines the specification for the labour market experience term. Alternatively, experience squared is added to the equation.
The Business Case for Investment in NutritionAnnex I: Methodology – Vivid Economics Model
50 | Chatham House
An extensive literature demonstrates that investments in human capital in labour markets produce substantial returns. The literature, especially in the low-income, lower-middle-income and upper-middle-income settings relevant to this analysis, has largely focused on the returns from education.150 Papers which include health outcomes151 typically find that the returns from physical development and capacity are smaller than those from education. For example, Thomas and Strauss152 find that among male workers in urban Brazil, a literate man earns 50 per cent more than an illiterate man, while a 1 per cent increase in the height of a man is associated with a 2.4 per cent increase in wages. Holding all other factors constant, an illiterate male would have to be 30 cm taller than a literate male to earn the same wage. Whereas this discrepancy is significant, it is likely that workers in low-income countries have fewer opportunities to reap the returns from education in knowledge-intensive sectors than do workers in middle-income countries such as Brazil. In low-income countries, workers are expected to benefit more from physical development and strength. Nonetheless, these results indicate that the impact of malnutrition on worker productivity by suppressing educational attainment can be significant.
1.1.1 Work capacity and malnutrition
As explained above, this study focuses primarily on the direct impact of malnutrition on businesses in terms of reducing workers’ physical and cognitive capacity. Physical work capacity is dependent on an individual’s maximal oxygen uptake: the higher the oxygen intake, the greater the person’s capacity to convert energy into effort.153 Several forms of malnutrition affect an individual’s maximal oxygen uptake, and therefore physical capacity:
• Maximal oxygen uptake is dependent on muscle cell mass, which is closely related to lean body mass – among undernourished populations, a higher body mass index (BMI) is likely to suggest greater lean body mass, greater maximal oxygen uptake and higher work capacity.
• Nutritional deficiencies in childhood are closely related to shorter stature. For a given BMI, shorter stature implies lower lean body mass – therefore childhood malnutrition results in lower maximal oxygen uptake and lower work capacity.
• Studies also show that maximal oxygen uptake depends on the concentration of haemoglobin in the blood – iron or vitamin B12 deficiency reduces blood haemoglobin levels (termed anaemia once haemoglobin levels fall below WHO cut-offs), resulting in lower physical capacity.
150 Kedir (2013), ‘Schooling, BMI, Height and Wages: Panel Evidence on Men and Women’; and Thomas. D and Strauss, J. (1997), ‘Health and wages: Evidence on men and women in urban Brazil’, Journal of Econometrics, 77(1), 159–85, doi: 10.1016/S0304-4076(96)01811-8 (accessed 12 May 2020).151 Croppenstedt, A. and Muller, C. (2000), ‘The Impact of Farmers Health and Nutritional Status on Their Productivity and Efficiency: Evidence from Ethiopia’, Economic Development and Cultural Change, 48 (3), pp. 475–502; Kedir (2013), ‘Schooling, BMI, Height and Wages: Panel Evidence on Men and Women’; Lafave, D. and Thomas, D. (2017), ‘Height and cognition at work: labour market productivity in a low income setting’, Economic and Human Biology, pp. 52–64, doi: 10.1016/j.ehb.2016.10.008 (accessed 12 May 2020); and Yimer, S. and Fantaw, O. (2011), ‘The impacts of health and nutrition on wages in Ethiopia’, African Journal of Business Management, 5 (30), pp. 12174–83, doi: 10.5897/AJBM11.1987 (accessed 12 May 2020).152 Thomas and Strauss (1997), ‘Health and wages: Evidence on men and women in urban Brazil’.153 Broca, S. and Stamoulis, K. (2003), ‘Micro- and Macroevidence on the impact of undernourishment’, pp. 1–13, in Taniguchi, K. and Wang, X. (eds) (2003), Nutrition and Economic Growth, Rome: FAO; and Dasgupta, P. (1997), ‘Nutritional status, the capacity for work, and poverty traps’, Journal of Econometrics, 77 (1), pp. 5–37.

The Business Case for Investment in NutritionAnnex I: Methodology – Vivid Economics Model
51 | Chatham House
Obesity affects productivity through a separate biological mechanism. Instead of impairing maximal oxygen uptake, obesity increases the risk of various diseases such as cancer, diabetes, depression and arthritis, which are assumed to adversely affect labour productivity. Furthermore, obese people can experience greater difficulties with physical tasks and with completing tasks on time.154
The sections below introduce the literature used to estimate the impact of four expressions of malnutrition on labour productivity: underweight, obesity, anaemia and the experience of malnutrition in childhood. The model parameters, discussed in Chapter 2, are drawn directly from this literature review.
1.1.2 Underweight
Underweight reduces the physical and cognitive capacity of workers, which negatively affects labour productivity. There are a number of ways to measure whether a person is underweight or experiencing chronic hunger (which can give rise to underweight). These include both input indicators such as caloric intake and outcome indicators such as BMI. Studies have shown that both input and outcome indicators of underweight and chronic hunger are associated with lower physical and cognitive work capacity.155 Our model utilizes the latter set of indicators. Measuring the impact of underweight on labour productivity is challenging due to simultaneity issues: underweight reduces worker productivity, resulting in low wages which in turn perpetuate chronic hunger – this is known as the efficiency wage hypothesis. Table 3 summarizes how studies have used various approaches to overcome these endogeneity issues. The studies find that in low-income or middle-income countries, increased BMI has a significant positive impact on output and wages. This result is found for both men and women, and in both urban and rural contexts. The impact of being underweight seems to be more severe among manual workers and those with lower educational attainment, who are more likely to work in physically demanding roles.
Table 3 includes four papers156 which estimate the specific impact of being underweight on a person’s labour productivity. These papers are used to establish appropriate coefficients for use in the model.
154 OECD/EU (2016), ‘The labour market impacts of ill-health, Health at a Glance’, in OECD (2016), Health at a Glance: Europe 2016 – State of Health in the EU Cycle, Paris: OECD Publishing, doi: 10.1787/9789264265592-en (accessed 12 May 2020).155 For example, calorie deficiency reduces labour force productivity, with the strongest evidence of this link in the agricultural sector. See Aziz, F. (1995), ‘Nutrition, health and labour productivity analysis of male and female workers: a test of the efficiency wage hypothesis’, Bulletin No. 95-5, University of Minnesota: Economic Development Center; and Okoye, B. C., Abass, A., Bachwenkizi, B., Asumugha, G., Alenkhe, B., Ranaivoson, R., Randrianarivelo, R., Rabemanantsoa, N. and Ralimanana, I. (2015), ‘Analysis of Labour Productivity among Small-holder Cassava Farmers for Food Security and Empowerment in Central Madagascar’, International Journal of Agricultural Management and Development, 6(3): pp. 309–18, http://ijamad.iaurasht.ac.ir/article_524419_d22aa755b5f68e40c5e029d9626446e1.pdf (accessed 7 Apr. 2020).156 Colchero, M. A. and Bishai, D. (2012), ‘Economics and Human Biology Weight and earnings among childbearing women in Metropolitan Cebu, Philippines (1983–2002)’, Economic and Human Biology, 10 (3), pp. 256–63, doi: 10.1016/ j.ehb.2011.04.002 (accessed 12 May 2020); Luo and Zhang (2012), ‘Non-Linear relationship between Body Mass Index and labour market outcomes: new evidence from China’; Shimokawa (2011), ‘The labour market impact of body weight in China: a semiparametric analysis’; and Dinda, S., Gangopadhyay, P. K. and Chattopadhyay, B. P. (2006), ‘Height, weight and earnings among coalminers in India’, Economic and Human Biology, 4 (3), pp. 342–50, doi: 10.1016/j.ehb.2005.10.003 (accessed 12 May 2020).
In low-income or middle-income countries, increased BMI has a significant positive impact on output and wages

The Business Case for Investment in NutritionAnnex I: Methodology – Vivid Economics Model
52 | Chatham House
Table 3: In low-income or middle-income contexts, increased BMI is associated with greater labour productivity and higher earnings
157 Carrillo and Charris (2017), ‘New evidence of the effect of body weight on labor market outcomes in a developing country’.158 Lafave and Thomas (2017), ‘Height and cognition at work: labour market productivity in a low income setting’.159 Kedir (2013), ‘Schooling, BMI, Height and Wages: Panel Evidence on Men and Women’.160 Colchero and Bishai (2012), ‘Economics and Human Biology Weight and earnings among childbearing women in Metropolitan Cebu, Philippines (1983 – 2002)’.161 In the cited study, defined as women who gave birth in 1983.162 Luo and Zhang (2012), ‘Non-Linear relationship between Body Mass Index and labour market outcomes: new evidence from China’.163 Yimer and Fantaw (2011), ‘The impacts of health and nutrition on wages in Ethiopia’.
Study Context Dependent variable Explanatory variables Methods Results
Carrillo and Charris157
Male and female workers, Brazil
Hourly earnings (calculated by monthly labour income divided by hours worked) and sectoral choice (formal, informal)
BMI, individual characteristics (gender, ethnicity, urban/rural), education
Cross-sectional data, instrumental variable approach (sibling BMI)
A 1% increase in BMI is associated with a 0.5% increase in earnings; this effect is larger for women and for workers living in urban areas.
Lafave and Thomas158
Male workers, central Java (rural Indonesia)
Hourly earnings (calculated as total earnings during the previous four months divided by hours worked), occupational choice
Height, cognition, education, health (BMI, blood pressure, self-reported ability to run 1 km)
Panel data, fixed effects
A 1% increase in BMI is associated with a 1.2% increase in hourly earnings, holding other explanatory variables constant.
Kedir159 Male and female workers, urban Ethiopia
Monthly wage Education, height, BMI, individual characteristics (age, experience, location)
Panel data, instrumental variable approach (food prices, household size)
A 1% increase in BMI increases monthly wage by 3.7%; this effect is larger for male workers and people with lower education.
Colchero and Bishai160
Working mothers,161 metropolitan Cebu (urban Philippines)
Hourly earnings Nutrition (underweight, normal, overweight and obese), source of income (wages, piece rate, self-employed, multiple), education, age, breastfeeding
Panel data, fixed effects, instrumental variable (lagged BMI)
Hourly earnings were 8.6% higher among healthy-weight women than in underweight women. The impact of BMI was greater for self-employed women and those with multiple occupations.
Luo and Zhang162 Male and female workers, China
Employment status, monthly wage
Nutrition indicators (BMI, BMI2, underweight, overweight, obese), individual characteristics (age, hukou status, ethnicity, educational attainment, marital status, experience), self-reported health status, occupation
OLS regression, fixed effects
Non-linear impacts of BMI on employment and wages. Being underweight does not significantly affect male employment or wages, but significantly affects female wages (reduction of 40% relative to those with healthy BMI). The authors suggest discrimination is driving the results.
Yimer and Fantaw163
Male and female workers, urban Ethiopia
Monthly wage Height, BMI, schooling, experience
Panel data, instrumental variable quantile regression (past BMI values)
The log wage elasticity with respect to BMI is 0.059. BMI is found to have a statistically significant impact on wages at all income quintiles and is a stronger determinant of female wages and the wages of younger cohorts. The effect of BMI was stronger for those on low incomes.

The Business Case for Investment in NutritionAnnex I: Methodology – Vivid Economics Model
53 | Chatham House
Study Context Dependent variable Explanatory variables Methods Results
Shimokawa164 Male and female workers, China
Monthly wage Nutrition (underweight, overweight, obesity), height, education, individual characteristics (age, marital status, household size, breastfeeding, region)
Panel data, multiple approaches used, both parametric (including fixed effects and instrumental variable regressions), and semi-parametric
Wage penalty for being underweight or obese. The wage penalty is larger and more widespread among men than among women in China, owing to the prevalence of manual labour.
Dinda, Gangopadhyay and Chattopadhyay165
Male coalmine workers, India
Monthly wage Height, BMI, environmental conditions, individual characteristics (experience, age)
Cross-sectional data, OLS
Underweight workers earn 2% less than the reference standard wage.
Schultz166 Male and female workers, Côte d’Ivoire and Ghana
Hourly wage Height, BMI, education, migration status
Instrumental variable approach (community health infrastructure, food prices, parental education)
A unit increase in BMI is associated with a 9% increase in women’s wages in both Côte d’Ivoire and Ghana. A unit of BMI increases men’s wages by 15% in Côte d’Ivoire and by 7% in Ghana. Education and BMI appear somewhat substitutable, particularly for women.
Croppenstedt and Muller167
Male agricultural workers, rural Ethiopia
Agricultural output, daily wage
Agricultural inputs (such as land area and quality), water availability, nutrition of household head (weight-for-height, BMI), education
Cross-sectional data, instrumental variable approach
The male wage elasticity with respect to the BMI is 3.04, which means that an increase of one standard deviation would increase the wage by 26%.
Thomas and Strauss168
Male and female workers, urban south and northeast Brazil
Hourly earnings (calculated as annual earnings divided by hours worked)
Height, BMI, calorie intake, protein intake
Cross-sectional data, instrumental variable approach (food prices)
A 1% increase in BMI is associated with a 2.2% increase in male wages; this effect is larger among the self-employed and those with less education. The effect of BMI is smaller and not statistically significant for women, except for the least educated women.
Source: Vivid Economics.
1.1.3 Obesity
Relatively few studies in developing countries have considered the implications of obesity for labour productivity. In developed countries, where obesity is more common, obesity has been found to have a significantly negative impact on labour market outcomes; some of this is attributable to discrimination.169 For example,
164 Shimokawa (2011), ‘The labour market impact of body weight in China: a semiparametric analysis’.165 Dinda, Gangopadhyay and Chattopadhyay (2006), ‘Height, weight and earnings among coalminers in India’.166 Schultz, T. P. (2003), ‘Wage rentals for reproducible human capital: evidence from Ghana and the Ivory Coast’, Economic and Human Biology, 1 (3), pp. 331–66, doi: 10.1016/j.ehb.2003.08.004 (accessed 15 May 2020).167 Croppenstedt and Muller (2000), ‘The Impact of Farmers Health and Nutritional Status on Their Productivity and Efficiency: Evidence from Ethiopia’.168 Thomas and Strauss (1997), ‘Health and wages: Evidence on men and women in urban Brazil’.169 Carrillo and Charris (2017), ‘New evidence of the effect of body weight on labor market outcomes in a developing country’; Luo and Zhang (2012), ‘Non-Linear relationship between Body Mass Index and labour market outcomes: new evidence from China’.

The Business Case for Investment in NutritionAnnex I: Methodology – Vivid Economics Model
54 | Chatham House
a 2016 OECD study finds that across 14 European countries in 2013, 59 per cent of obese people aged 50–59 were employed, compared to 72 per cent of people who were not obese. Among the employed, obesity is found to increase the likelihood of worker absence and to lower labour productivity. Across these issues, obese women experience greater difficulties than obese men. The only studies in developing countries to have considered the labour market implications of obesity are Luo and Zhang170 and Shimokawa.171 These studies both look at the impact of obesity in China during the country’s transition period to more ‘Western’ diets, when there was a rapid increase in the prevalence of overweight and obesity while the population was still experiencing food insecurity. The two papers find that obesity has negative labour market impacts, consistent with the developed-country literature.
1.1.4 Anaemia
Studies show that anaemia reduces worker productivity, even when workers are consuming sufficient calories.172 Most studies investigating the impact of anaemia have been limited to laboratory experiments or randomized controlled trials, which have estimated the impact of iron supplementation on labour productivity. For example, Edgerton et al.173 find that the productivity of workers on a tea plantation in Sri Lanka increased in response to iron supplementation. Horton and Ross174 review these studies and conclude that iron therapy in anaemic adults is associated with a 5 per cent increase in labour productivity among light manual workers and a 17 per cent increase in productivity among heavy manual workers. These estimates are in line with Weinberger,175 who finds that wages would be 5–17.3 per cent higher if households achieved recommended levels of iron intake.
1.1.5 Childhood malnutrition
Macronutrient and micronutrient deficiencies at different stages of childhood can inhibit growth, development and cognitive function. Nutritional deficiencies at any stage of life can have implications for productivity capacity and cognition, but are particularly impactful during the early formative stages of growth. Undernutrition also increases child morbidity and lowers educational attainment. Anaemia (iron or vitamin B12 deficiency) and zinc deficiency can inhibit child growth and development, while vitamin A deficiency and iodine deficiency disorder can increase the risk of severe diseases and child mortality.176 The costs of child undernutrition on society include poorer health outcomes and the associated burden on society, reduced educational attainment, and lower physical and cognitive capacity.177
170 Luo and Zhang (2012), ‘Non-Linear relationship between Body Mass Index and labour market outcomes: new evidence from China’.171 Shimokawa (2011), ‘The labour market impact of body weight in China: a semiparametric analysis’.172 Horton and Ross (2003), ‘The economics of iron deficiency’; and Weinberger (2003), ‘The impact of micronutrients on labor productivity: evidence from rural India’.173 Edgerton, V. R., Gardner, G. W., Ohiram, Y., Gunawardena, K. A. and Senewiratne, B. (1979), ‘Iron-deficiency anaemia and its effect on worker productivity and activity patterns’, British Medical Journal, 15(2): pp. 1546–49, doi: 10.1136/bmj.2.6204.1546 (accessed 24 May 2020).174 Horton and Ross (2003), ‘The economics of iron deficiency’.175 Weinberger (2003), ‘The impact of micronutrients on labor productivity: evidence from rural India’.176 UN Economic Commission for Latin America and the Caribbean (CEPAL) and WFP (2017), The cost of the double burden of malnutrition: Social and economic impact, https://documents.wfp.org/stellent/groups/public/documents/communications/wfp291993.pdf?_ga=2.94329886.2018043421.1590257659-573510553.1587026866 (accessed 23 May 2020).177 Martínez, R. and Fernández, A. (2007), Model for Analysing the Social and Economic Impact of Child Undernutrition in Latin America, UN CEPAL, https://www.cepal.org/en/publications/5496-model-analysing-social-and-economic-impact-child-undernutrition-latin-america (accessed 24 May 2020).

The Business Case for Investment in NutritionAnnex I: Methodology – Vivid Economics Model
55 | Chatham House
This model analysis uses stunting as a proxy for childhood nutritional deficiencies to represent the most severe impacts of hunger and micronutrient deficiencies in childhood. Stunting is a consequence of maternal malnutrition, undernutrition during infancy and impaired absorption of nutrients. Stunting serves as a proxy for all forms of nutritional deficiencies in childhood because it reflects the strongest impacts in terms of impaired child development, and because its inclusion in the analysis resolves the difficulty of estimating the timing of undernutrition by nutrient during different stages of development.178 Childhood stunting is expected to reduce educational attainment, physical stature and cognitive capacity, impacting future labour productivity.179
Due to the static nature of the model, the analysis focuses on the impact of childhood malnutrition on physical development. In line with the Cost of Hunger in Africa studies180 and the Nutrition PROFILES guidelines,181 this modelling analysis draws on a study in the Philippines in which the wages earned by sugar cane workers were 1.38 per cent higher for every 1 per cent increase in their height.182,183
We interpret the study as an estimate of the impact of malnutrition on labour productivity through the mechanism of reduced physical development.
Box 11: The indirect impacts of childhood malnutrition on business
Childhood malnutrition has been shown to have various negative impacts on cognitive development, educational attainment and adult physical capacity. Childhood malnutrition is assumed to impair physical development, compromising the labour productivity of manual workers. It can also have an indirect impact on business through reducing the educational attainment of the workforce. Malnourished children tend to enrol in school later, progress more slowly through grades and attain lower levels of scholarly achievement. Using stunting as a proxy for childhood malnutrition, Galasso and Wagstaff184 use a meta-analysis to show that stunted children attain 1.6 fewer years of education.
This box is intended to provide an indication of how much larger the results would be if this indirect effect were additionally considered. The labour productivity implications of reduced educational attainment are context-dependent, as high-skilled labour is complementary to businesses’ use of more technologically advanced machinery.185
178 Martins, V. J. B., Toledo Florêncio, T. M. M., Grillo, L. P., Do Carmo P. Franco, M., Martins, P. A., Clemente, A. P. G., Santos, C. D. L., Vieira, M. F. A. and Sawaya, A. L. (2011), ‘Long-Lasting Effects of Undernutrition’, International Journal of Environmental Research and Public Health, 8(6): pp. 1817–46, doi: 10.3390/ijerph8061817 (accessed 24 May 2020).179 Montenegro, C. E. and Patrinos, H. A. (2014), Comparable estimates of returns to schooling around the world, http://documents.worldbank.org/curated/en/830831468147839247/Comparable-estimates-of-returns-to-schooling-around-the-world (accessed 24 May 2020); and Galasso and Wagstaff (2016), The Economic Costs of Stunting and How to Reduce Them.180 African Union Commission, NEPAD Planning and Coordinating Agency, UN Economic Commission for Africa (UNECA) and WFP (2014), The Cost of Hunger in Africa: Social and Economic Impact of Child Undernutrition in Egypt, Ethiopia, Swaziland and Uganda, Addis Ababa: UNECA, https://www.uneca.org/sites/default/files/PublicationFiles/CoHA%20English_web.pdf (accessed 15 May 2020).181 Ross, J. and Stiefel, H. (undated), ‘PROFILES Guidelines: Calculating the effects of Malnutrition on Economic Productivity, Health and Survival’.182 Haddad, L. and Bouis, H. (1991), ‘The impact of nutritional status on agricultural productivity: Wage evidence from the Philippines’, Oxford Bulletin of Economics and Statistics, 53 (1), pp. 45–68, doi: 10.1111/j.1468-0084.1991.mp53001004.x (accessed 15 May 2020).183 In line with PROFILES guidelines, moderate stunting is assumed to reduce adult height by 4.375 per cent.184 Galasso and Wagstaff (2016), The Economic Costs of Stunting and How to Reduce Them.185 Blundell, R., Dearden, L., Meghir, C. and Sianesi, B. (1999), ‘Human capital investment: the returns from education and training to the individual, the firm and the economy’, Fiscal Studies, 20(1), https://www.ifs.org.uk/publications/2225 (accessed 24 May 2020).

The Business Case for Investment in NutritionAnnex I: Methodology – Vivid Economics Model
56 | Chatham House
An additional year of education has been found to increase wages by 5–11 per cent.186 Assuming a tight link between wages and productivity, this would suggest that childhood malnutrition reduces the effectiveness of labour by 8–18 per cent. As such, the impacts of education losses from childhood malnutrition on business are expected to outweigh the physical impacts by a factor of 1.6–3.5.
The physical impact of childhood malnutrition was estimated to impose a cost to business equivalent to 0.4 per cent of GDP annually across the 17 countries for which stunting is modelled. If the education-related indirect impacts are included, this could increase to as much as 1.8 per cent of GDP.
Figure 12: The model analysis was conducted in five stages
Source: Vivid Economics.
1.2 Theoretical approach
Malnutrition is assumed to impact business through compromising the quality of human capital. Figure 13 summarizes the impact channel framework used to model the cost that malnutrition poses to business. The model focuses on the relationship between adult malnutrition and physical development, and on the physical impacts of stunting experienced in childhood. As a result of compromised physical development and reduced physical and cognitive capacity, malnutrition leads to both presenteeism (reduced productivity at work) and absenteeism (physical absence from the workplace). These effects combine to reduce the overall capacity of the workforce, reducing output and negatively affecting businesses.
186 Galasso and Wagstaff (2016), The Economic Costs of Stunting and How to Reduce Them.
Process
Prev
alen
ce
Model Extend Analyse
Estimating the prevalence of current and past malnutrition, disaggregated by country and economic sector.
Utilizing coe�cients from the literature to estimate impact of malnutrition on labour productivity.
Developing an economic model to estimate the impact of reduced labour productivity on sector output.
Extending the model to test sensitivities and explore supply chain impacts with input-output modelling.
Analysing the results of the model to draw conclusions about the impact of malnutrition on business.
Impa
ct

The Business Case for Investment in NutritionAnnex I: Methodology – Vivid Economics Model
57 | Chatham House
Figure 13: Impact channel framework used to model the cost malnutrition poses to business
Source: Vivid Economics.
The model focuses on a narrow aspect of the malnutrition problem. It answers the simple question: ‘What would happen to business output in the short term if workers achieved the physical state associated with good nutritional outcomes?’ Given the broad-ranging and complex relationships between nutrition, productivity and the economy, this model does not take into account the following impacts on business (see also Figure 14):
• Cognitive aspects of childhood malnutrition – reducing childhood malnutrition would increase the size of the workforce (as malnutrition in childhood can lead to disability or mortality) and lead to a more productive workforce (as malnutrition impairs cognitive development and educational attainment).187
• Disposable income – achieving good nutritional outcomes would result in higher labour productivity, which would be expected to increase the wages of the previously malnourished. Overcoming malnutrition would improve health outcomes and reduce household expenditure on medical bills. It would increase households’ disposable income, which would increase their spending on consumption goods and benefit business.
• Improved enabling environment for business and economic development – overcoming malnutrition would increase the fiscal space available to government through two means: (1) reduced healthcare spending and (2) increased tax revenue. The additional fiscal resources could be used to invest in other public priorities, including in business-friendly projects such as infrastructure.
187 Educational attainment is not included in the model, as the static nature of the modelling approach implies that its impacts cannot be fully captured: changing educational attainment would substantially affect the structure of the economy.
Worker malnutrition
Childhood malnutrition
Presenteeism
Reduced workforce capacity Firm costs
Absenteeism
Sector performance
Upstream sector performance
Downstream sector performance
Morbidity/mortality
Physical and cognitive capacity
Physical development
Channel of impactFeedbacks/traps

The Business Case for Investment in NutritionAnnex I: Methodology – Vivid Economics Model
58 | Chatham House
Figure 14: The modelling analysis does not include some potential channels of impact
Note: Grey boxes are used to indicate channels of impact not included in the modelling analysis.Source: Vivid Economics.
Table 4 summarizes the mechanisms by which malnutrition affects business and which of these are included in the modelling analysis.
Table 4: There are a number of mechanisms by which malnutrition impacts business; not all could be incorporated in the modelling analysis
Population Mechanism How does this mechanism impact business?
Incorporated into the modelling analysis?
Workforce (current)
Reduced physical and cognitive capacity
Underweight, hidden hunger and obesity reduce the physical and cognitive capacity of the workforce, resulting in presenteeism.
The impact of underweight on the labour productivity of the workforce is a core aspect of the model.
The impact of obesity on the labour productivity of the workforce is a core aspect of the model.
Data were only available to calculate the prevalence of anaemia in five countries; therefore this is considered an extension to the model and the results cannot be extrapolated.
Workforce (childhood)
Physical development
Childhood malnutrition compromises the physical development and strength of the adult workforce, reducing labour productivity.
The impact is modelled for 17 countries, as proxied by adult short stature. However, the unclear business implications mean this is considered an extension to the core model.
Worker malnutrition
Childhood malnutrition
Firm costs
Firm revenues
Sector performance
Upstream sector performance
Downstream sector performance
Channel of impactFeedbacks/traps
Morbidity/mortality
Physical and cognitive capacity
Physical development
Cognitive development
Presenteeism
Absenteeism
Public and private healthcare costs
Reduced supply of labour
Compromised enabling
environment
Reduced disposable income
Reduced workforce capacity
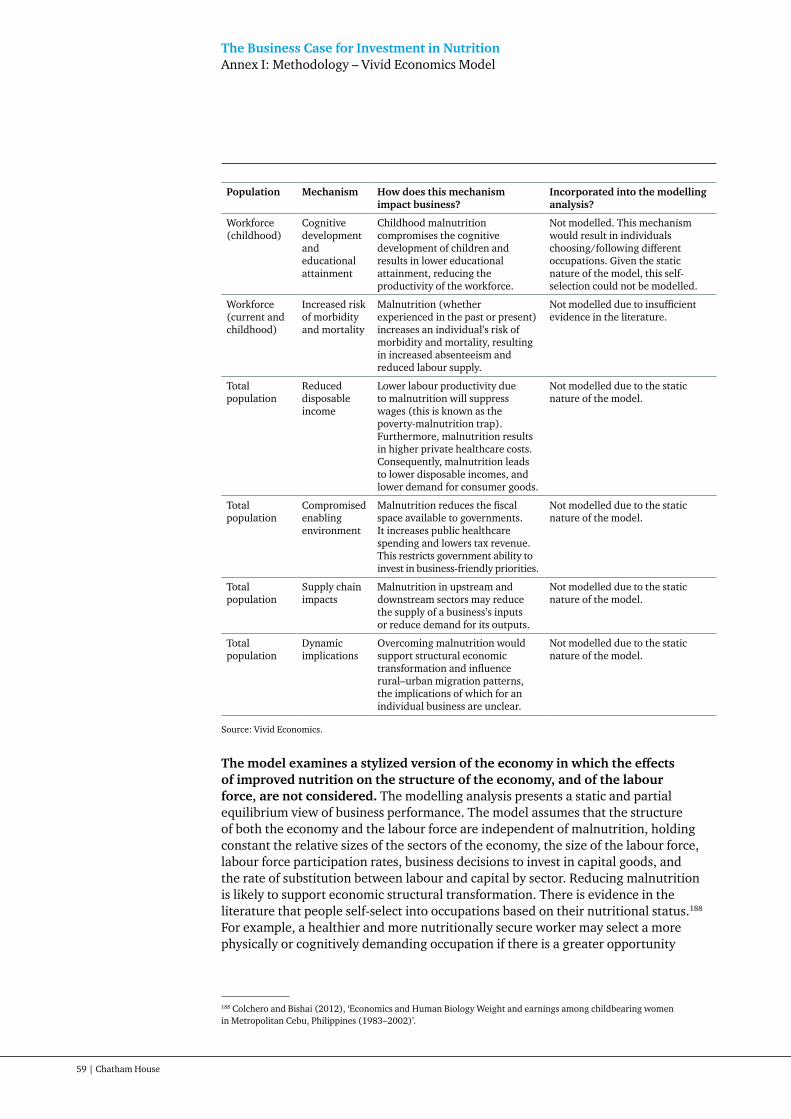
The Business Case for Investment in NutritionAnnex I: Methodology – Vivid Economics Model
59 | Chatham House
Population Mechanism How does this mechanism impact business?
Incorporated into the modelling analysis?
Workforce (childhood)
Cognitive development and educational attainment
Childhood malnutrition compromises the cognitive development of children and results in lower educational attainment, reducing the productivity of the workforce.
Not modelled. This mechanism would result in individuals choosing/following different occupations. Given the static nature of the model, this self-selection could not be modelled.
Workforce (current and childhood)
Increased risk of morbidity and mortality
Malnutrition (whether experienced in the past or present) increases an individual’s risk of morbidity and mortality, resulting in increased absenteeism and reduced labour supply.
Not modelled due to insufficient evidence in the literature.
Total population
Reduced disposable income
Lower labour productivity due to malnutrition will suppress wages (this is known as the poverty-malnutrition trap). Furthermore, malnutrition results in higher private healthcare costs. Consequently, malnutrition leads to lower disposable incomes, and lower demand for consumer goods.
Not modelled due to the static nature of the model.
Total population
Compromised enabling environment
Malnutrition reduces the fiscal space available to governments. It increases public healthcare spending and lowers tax revenue. This restricts government ability to invest in business-friendly priorities.
Not modelled due to the static nature of the model.
Total population
Supply chain impacts
Malnutrition in upstream and downstream sectors may reduce the supply of a business’s inputs or reduce demand for its outputs.
Not modelled due to the static nature of the model.
Total population
Dynamic implications
Overcoming malnutrition would support structural economic transformation and influence rural–urban migration patterns, the implications of which for an individual business are unclear.
Not modelled due to the static nature of the model.
Source: Vivid Economics.
The model examines a stylized version of the economy in which the effects of improved nutrition on the structure of the economy, and of the labour force, are not considered. The modelling analysis presents a static and partial equilibrium view of business performance. The model assumes that the structure of both the economy and the labour force are independent of malnutrition, holding constant the relative sizes of the sectors of the economy, the size of the labour force, labour force participation rates, business decisions to invest in capital goods, and the rate of substitution between labour and capital by sector. Reducing malnutrition is likely to support economic structural transformation. There is evidence in the literature that people self-select into occupations based on their nutritional status.188 For example, a healthier and more nutritionally secure worker may select a more physically or cognitively demanding occupation if there is a greater opportunity
188 Colchero and Bishai (2012), ‘Economics and Human Biology Weight and earnings among childbearing women in Metropolitan Cebu, Philippines (1983–2002)’.

The Business Case for Investment in NutritionAnnex I: Methodology – Vivid Economics Model
60 | Chatham House
for higher income. Furthermore, overcoming malnutrition in childhood would result in a better-educated and more cognitively developed workforce which would work in more highly skilled occupations.189
A further factor not included in the modelling analysis is the impact of malnutrition on peace and stability. Extreme malnutrition, where people lack access to even basic food supplies, can be a cause of forced migration.190 Hunger has a destabilizing effect on societies, and there are historical examples of protests and political turmoil following periods of famine or rising food prices.191 Overcoming malnutrition could help contribute to peace and stability, significantly improving the operating environment for businesses.
Having described the theoretical approach to the modelling analysis, in the following sections we explain in detail the first four stages of the approach.
1.3 Prevalence: what is the prevalence of malnutrition by economic sector?
The first stage of the modelling analysis involves estimating the prevalence of malnutrition by economic sector. Using household survey data, the prevalence of underweight and obesity is estimated for 13 economic sectors across 19 low-, lower-middle- and upper-middle-income countries (with the prevalence of anaemia and short adult stature estimated for smaller subsets of the same countries, across the 13 economic sectors).192 The measure/proxy used for each form of malnutrition modelled is as follows:
• Underweight arising from chronic hunger: proxied by low BMI.193
• Obesity: proxied by high BMI.
• Anaemia: measured by altitude-adjusted blood haemoglobin levels.194
• Physical impacts of childhood stunting: proxied by short adult stature.195,196
189 Pinstrup-Andersen, P. (2017), ‘A conceptual framework for investing in nutrition’, in Babu, S. C., Gajanan, S. N. and Hallam, J. A. (eds.) (2017), Nutrition Economics: Principles and Policy Applications, London: Elsevier, pp. 25–40, doi: 10.1016/B978-0-12-800878-2.00003-7 (accessed 12 May 2020).190 Hammond, L. (2018), ‘Forced Migration and Hunger’, https://www.globalhungerindex.org/issues-in-focus/2018.html (accessed 15 May 2020).191 de Waal, A. (2015), ‘Armed Conflict and the Challenge of Hunger: Is an End in Sight?’, Global Hunger Index, October 2015, https://www.globalhungerindex.org/issues-in-focus/2015.html (accessed 15 May 2020).192 The 19 countries included are: Albania, Bangladesh, Cambodia, Côte d’Ivoire, the Dominican Republic, Egypt, Ethiopia, Ghana, Guatemala, Honduras, India, Mozambique, Namibia, Nepal, Pakistan, Rwanda, Tanzania, Zambia and Zimbabwe. As mentioned, anaemia prevalence was estimated for only five of these countries (Albania, Ethiopia, India, Namibia and Zimbabwe), while adult short stature was modelled for 17 of the countries (Côte d’Ivoire and India were not covered).193 Body mass index (BMI) is a measure of nutritional status in adults. It is defined as a person’s weight in kilogrammes divided by the square of the person’s height in metres (kg/m2). WHO (2019), ‘Body mass index – BMI’.194 Women with levels below 120 g/dL and men with levels below 130 g/dL are considered anaemic. WHO (2011), Haemoglobin concentrations for the diagnosis of anaemia and assessment of severity.195 Based on the expected healthy height of 19-year-olds, with women shorter than 150.1 cm and men shorter than 161.9 cm considered stunted. WHO (2007), ‘Height-for-age (5-19 years)’.196 It is important to note that the modelling exercise offers only an initial exploration into the impacts of childhood stunting on adult workers. Our modelling is limited to the physical impacts of childhood stunting on adult height, using adult short stature as a crude proxy for the experience of stunting in childhood. Further research is required to fully understand – and quantify – the static and dynamic impacts of childhood stunting, and childhood malnutrition more broadly, on labour productivity, human capital development and economic growth.

The Business Case for Investment in NutritionAnnex I: Methodology – Vivid Economics Model
61 | Chatham House
The analysis is based on malnutrition outcome indicators, as opposed to nutrition input indicators such as calorie or micronutrient intake. Firstly, the selected outcome indicators are convenient to measure and consequently have been extensively used in the literature, indicating widespread acceptance.197,198 Secondly, unlike input indicators, outcome indicators do not distinguish between different causes of malnutrition, which is important as WASH, education and health services can greatly exacerbate the health issues caused by inadequate nutritional intake.199 Finally, these indicators allowed us to use the USAID-funded Demographic and Health Surveys (DHS) programme as the basis of the model; the DHS programme reports individual-level data consistently across a large number of developing countries.
For the countries covered by our model, DHS data are used to estimate the prevalence of malnutrition by occupation and gender.200 The DHS programme conducts nationally representative household surveys collecting data in the areas of population, health and nutrition. These surveys are administered consistently across 92 developing countries. The DHS programme collects data both on the employment occupation of individuals and on a range of biomarkers and anthropometry associated with nutritional status. Our analysis identifies malnourished survey respondents according to World Health Organization (WHO) guidelines:
• Underweight is proxied by BMI values of less than 18.5 kg/m2.201
• Obesity is proxied by BMI values greater than 30 kg/m2.202
• Anaemia is measured by altitude-adjusted blood haemoglobin levels203 – women with levels below 120 grams per decilitre (g/dL) and men with levels below 130 g/dL are considered anaemic.
• Short adult stature is proxied by height below that which is two standard deviations below the expected healthy height for 19-year-olds204 – women shorter than 150.1 cm and men shorter than 161.9 cm are considered stunted.
Box 12 summarizes how the DHS data are used in the modelling exercise.
197 Carrillo and Charris (2017), ‘New evidence of the effect of body weight on labor market outcomes in a developing country’.198 Bozoyan and Wolbring highlight several issues with using BMI. However, data for the alternative measures they suggest (fat-free mass and body fat) are not available in the low-income, lower-middle-income and upper-middle-income country contexts we are interested in. Bozoyan, C. and Wolbring, T. (2011), ‘Economics and Human Biology Fat, muscles, and wages’, Economics and Human Biology, 9(4): pp. 356–63, doi; 10.1016/j.ehb.2011.07.001 (accessed 7 Apr. 2020).199 Development Initiatives (2018), 2018 Global Nutrition Report.200 Occupations are disaggregated using the ISCO level 2 classification. International Labour Office (2012), International Standard Classification of Occupations Structure, group definitions and correspondence tables: Volume I, Geneva: International Labour Organization.201 WHO (2019), ‘Body mass index – BMI’.202 Ibid.203 WHO (2011), Haemoglobin concentrations for the diagnosis of anaemia and assessment of severity.204 WHO (2007), ‘Height-for-age tables (boys), 1–7’, https://www.who.int/growthref/who2007_height_for_age/en/ (accessed 15 May 2020).
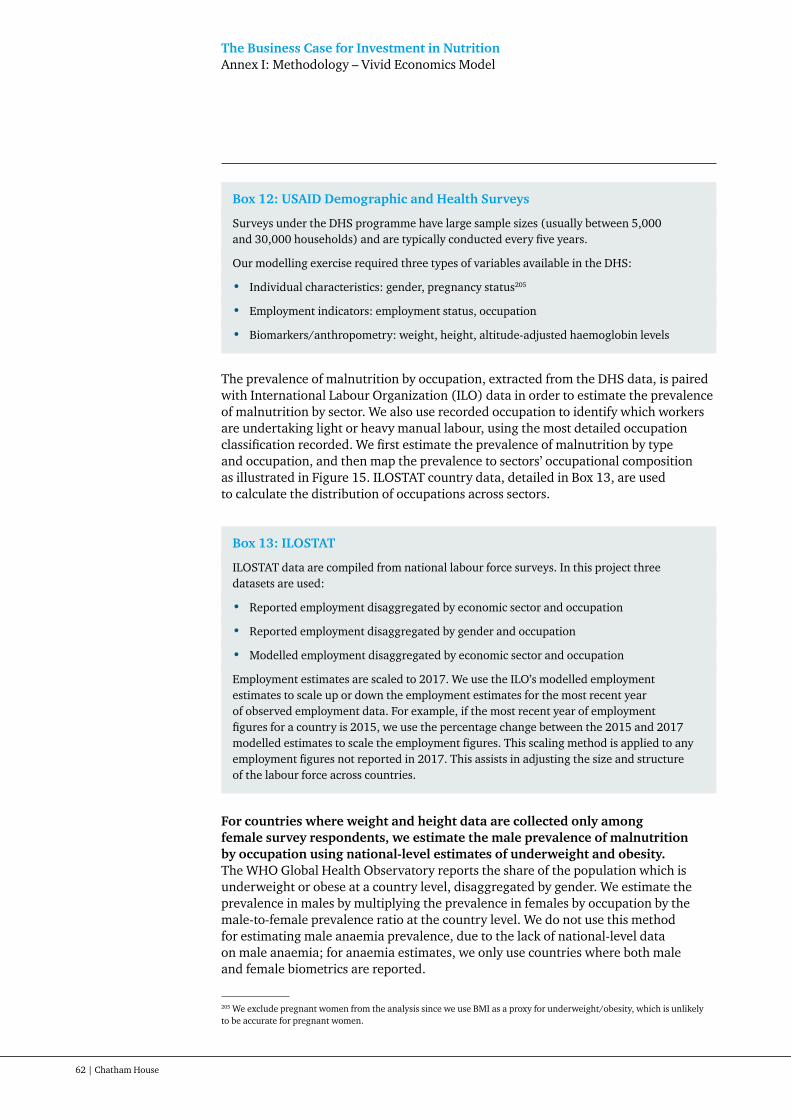
The Business Case for Investment in NutritionAnnex I: Methodology – Vivid Economics Model
62 | Chatham House
Box 12: USAID Demographic and Health Surveys
Surveys under the DHS programme have large sample sizes (usually between 5,000 and 30,000 households) and are typically conducted every five years.
Our modelling exercise required three types of variables available in the DHS:
• Individual characteristics: gender, pregnancy status205
• Employment indicators: employment status, occupation
• Biomarkers/anthropometry: weight, height, altitude-adjusted haemoglobin levels
The prevalence of malnutrition by occupation, extracted from the DHS data, is paired with International Labour Organization (ILO) data in order to estimate the prevalence of malnutrition by sector. We also use recorded occupation to identify which workers are undertaking light or heavy manual labour, using the most detailed occupation classification recorded. We first estimate the prevalence of malnutrition by type and occupation, and then map the prevalence to sectors’ occupational composition as illustrated in Figure 15. ILOSTAT country data, detailed in Box 13, are used to calculate the distribution of occupations across sectors.
Box 13: ILOSTAT
ILOSTAT data are compiled from national labour force surveys. In this project three datasets are used:
• Reported employment disaggregated by economic sector and occupation
• Reported employment disaggregated by gender and occupation
• Modelled employment disaggregated by economic sector and occupation
Employment estimates are scaled to 2017. We use the ILO’s modelled employment estimates to scale up or down the employment estimates for the most recent year of observed employment data. For example, if the most recent year of employment figures for a country is 2015, we use the percentage change between the 2015 and 2017 modelled estimates to scale the employment figures. This scaling method is applied to any employment figures not reported in 2017. This assists in adjusting the size and structure of the labour force across countries.
For countries where weight and height data are collected only among female survey respondents, we estimate the male prevalence of malnutrition by occupation using national-level estimates of underweight and obesity. The WHO Global Health Observatory reports the share of the population which is underweight or obese at a country level, disaggregated by gender. We estimate the prevalence in males by multiplying the prevalence in females by occupation by the male-to-female prevalence ratio at the country level. We do not use this method for estimating male anaemia prevalence, due to the lack of national-level data on male anaemia; for anaemia estimates, we only use countries where both male and female biometrics are reported.
205 We exclude pregnant women from the analysis since we use BMI as a proxy for underweight/obesity, which is unlikely to be accurate for pregnant women.

The Business Case for Investment in NutritionAnnex I: Methodology – Vivid Economics Model
63 | Chatham House
Figure 15: Illustrative example of the approach used to estimate the prevalence of malnutrition by economic sector
Source: Vivid Economics.
1.4 Impact: how does malnutrition affect labour productivity?
The next stage of the analysis involves identifying the impact of malnutrition on the labour productivity of the individual. The model focuses on two core forms of malnutrition: underweight and obesity. For these forms of malnutrition, low, central and high impact scenarios have been developed to create a plausible range for output results, shown in Table 5. The other two forms of malnutrition for which sectoral prevalence is estimated are modelled as extensions to the core model. In the case of anaemia, this is due to data availability, as only five of the DHS surveys used include measures of haemoglobin levels for both male and female respondents, and we are unable to use national-level estimates for males since data on anaemia in men are rarely collected. In the case of childhood stunting, this is due to interpretation considerations. As businesses cannot affect the historical nutrition experiences of their workforces, the impact of childhood stunting on current business performance is not considered a core model result.
Coefficients of labour productivity loss from the literature define the parameters for modelling the impact of malnutrition. Table 5 summarizes the coefficients used. As evident in Table 3, much of the existing literature estimates the impact of malnutrition on wages rather than on labour productivity directly. In line with Van Biesebroeck,206 our analysis assumes that income loss for the
206 Van Biesebroeck, J. (2015), How tight is the link between wages and productivity? A survey of the literature.
27.5%
22%
Agriculture
Manufacturing
30%
10%
25%
Skilled agricultural
Managers
Machine operators
10% managers
80% skilled agricultural
10% machine operators
20% managers
0% skilled agricultural
80% machine operators
ISCO–08 major group occupations
Prevalence of underweightby occupation (DHS survey)
ISIC Rev. 4 economic
sectors
Sector composition by
occupation (ILOSTAT)
Prevalence of underweight
by sector
As businesses cannot affect the historical nutrition experiences of their workforces, the impact of childhood stunting on current business performance is not considered a core model result

The Business Case for Investment in NutritionAnnex I: Methodology – Vivid Economics Model
64 | Chatham House
individual is directly proportional to the individual’s productivity loss. Bias against workers whose malnutrition is evident (for example, because they are short) may cause this assumption to fail. The literature reviewed did not concretely determine whether bias or discrimination was driving the results. For example, several studies find that physical attributes have greater impacts on the earnings of the self-employed, suggesting limited employer discrimination.207 However, Luo and Zhang208 attribute the negative impact of obesity on female employment to discrimination, on the basis that self-reported health status and self-confidence do not fully explain their findings. It is unclear, therefore, how robust this approach is.
Table 5: Coefficients are adapted from the literature to estimate the impact of malnutrition in low, central or high impact scenarios, to generate a plausible range of results
Malnutrition Gender Low impact
Central impact
High impact
Notes
Underweight Male 0.94 0.74 0.74 Values adapted from Shimokawa.209 The central impact value is identical to the high impact value. This is to reflect the literature: some studies find the impact of underweight to be greater for men;210 others find the impact is greater for women.211 Given this, it was decided that the central impact coefficients should be the same for men and women.
Underweight Female 0.90 0.74 0.59 Values adapted from Shimokawa.212
Obesity Male 0.95 0.89 0.83 Values adapted from Shimokawa213 and Luo and Zhang.214
Obesity Female 0.93 0.67 0.41 Values adapted from Shimokawa.215
Note: The coefficients represent labour force effectiveness relative to no impact of malnutrition. A coefficient of 0.94 represents a person working at 94 per cent capacity as a result of malnutrition. Values closer to 1 suggest a lower impact from malnutrition, and values further below 1 suggest a greater impact from malnutrition.This study is based on best available evidence studying the relationship between nutrition outcomes and labour productivity. Where possible, we use a range of estimates from multiple sources, or from a single source where evidence is extremely limited. Accordingly, we note that there are limitations to the interpretation of these coefficients, and that this is an area for future research to explore further the impacts of poor nutrition on labour productivity.Source: Vivid Economics.
207 Colchero and Bishai (2012), ‘Economics and Human Biology Weight and earnings among childbearing women in Metropolitan Cebu, Philippines (1983–2002)’; and Thomas and Strauss (1997), ‘Health and wages: Evidence on men and women in urban Brazil’.208 Luo and Zhang (2012), ‘Non-Linear relationship between Body Mass Index and labour market outcomes: new evidence from China’.209 Shimokawa (2011), ‘The labour market impact of body weight in China: a semiparametric analysis’.210 Kedir (2013), ‘Schooling, BMI, Height and Wages: Panel Evidence on Men and Women’; Schultz (2003), ‘Wage rentals for reproducible human capital: evidence from Ghana and the Ivory Coast’; Shimokawa (2011), ‘The labour market impact of body weight in China: a semiparametric analysis’; and Thomas and Strauss (1997), ‘Health and wages: Evidence on men and women in urban Brazil’.211 Carrillo and Charris (2017), ‘New evidence of the effect of body weight on labor market outcomes in a developing country’; Luo and Zhang (2012), ‘Non-Linear relationship between Body Mass Index and labour market outcomes: new evidence from China’; and Yimer and Fantaw (2011), ‘The impacts of health and nutrition on wages in Ethiopia’.212 Shimokawa (2011), ‘The labour market impact of body weight in China: a semiparametric analysis’.213 Ibid.214 Luo and Zhang (2012), ‘Non-Linear relationship between Body Mass Index and labour market outcomes: new evidence from China’.215 Shimokawa (2011), ‘The labour market impact of body weight in China: a semiparametric analysis’.

The Business Case for Investment in NutritionAnnex I: Methodology – Vivid Economics Model
65 | Chatham House
1.5 Model: how does malnutrition affect sector output?
The next stage in the analysis models the impact of malnutrition on sector output. The prevalence of malnutrition and the impact of malnutrition on labour productivity are combined in a simple multisectoral economic model which estimates the impact of malnutrition on sectoral gross value added (GVA). Figure 16 summarizes the economic model used.
Figure 16: A sector-specific economic model is used to estimate the impact of labour productivity on output
GVAISIC, c= AISIC, c [θISIC, c(KISIC, c)γISIC+(1–θISIC, c)(aISIC, c LISIC, c)
γISIC]1/γISIC
Notes: c = country, ISIC = sector. AISIC, c represents sectoral total factor productivity. KISIC, c represents capital inputs per sector, LISIC, c represents raw labour inputs per sector. θISIC, c represents the sectoral share of capital in the production function, (1–θISIC, c) represents the sectoral share of labour in the production function.aISIC, c is the sectoral effectiveness of labour supply, a function of malnutrition.ρ_s=1 ⁄ ((1–〖γγ_ISIC〗_s ) ) is the sectoral degree of elasticity of substitution, used as an input to determine γISIC, which determines how capital and labour can be substituted in each sectoral production function.Sources: Vivid Economics, based on Costa, Floater, Hooyberghs, Verbeke and De Ridder.216
The model estimates the impact of malnutrition as the difference between current sectoral output and potential sectoral output without the reduction in workforce effectiveness from malnutrition. Malnutrition is assumed to impact the aISIC, c term: the labour supply is less effective due to malnutrition. The sector-specific term aISIC, c is calculated based on the prevalence of malnutrition in that sector and the impact of malnutrition on labour productivity. To illustrate this approach, consider a hypothetical case in which underweight reduces the labour productivity of an agricultural worker by 30 per cent and 10 per cent of agricultural workers experience underweight. Across the agricultural sector in this scenario, underweight reduces labour productivity by 3 per cent, such that aISIC, c is 97 per cent. The losses from malnutrition are calculated as the difference between current sector GVA (where malnutrition among the workforce means aISIC, c < 1) and potential GVA in the ‘no malnutrition’ scenario (aISIC, c =1).
Table 6 summarizes the sources of data for the parameters used to calibrate the model. These data sources are:
• GTAP Social Accounting Matrices (SAMs), from which the costs sectors face relating to land, labour, capital, natural resources and taxes, as well as the elasticities of substitution between primary factors of production, are extracted;
• Penn World Tables, which include data on the total value of capital stock by country; and
• ILOSTAT, which includes employment data by sector.
216 Costa, H., Floater, G., Hooyberghs, H., Verbeke, S. and De Ridder, K. (2016), ‘Climate change, heat stress and labour productivity: A cost methodology for city economies’, Grantham Research Institute on Climate Change and the Environment, Working Paper No. 248, http://www.lse.ac.uk/GranthamInstitute/wp-content/uploads/2016/07/Working-Paper-248-Costa-et-al.pdf (accessed 15 May 2020).

The Business Case for Investment in NutritionAnnex I: Methodology – Vivid Economics Model
66 | Chatham House
Table 6: Description of parameters used in sectoral economic model
Variable Description Unit Calculation method Data sources
AISIC, cSectoral total factor productivity
n/a Calibrated from model All
GVAISIC, cSector value added US$ Sum of payments to land, labour, capital,
natural resources and taxes by sectorGTAP
KISIC, cCapital inputs by sector US$ (Rent paid to capitalISIC,c /Total rent paid
to capitalc) × Value of capital stockc
GTAP and Penn World Tables
θISIC, cSectoral share of capital in the production function
n/a Rent paid to capitalISIC,c /(Rent paid to capitalISIC,c + Rent paid to labourISIC,c )
GTAP
aISIC, cSectoral effectiveness of labour supply
n/a Calculation based on the prevalence of malnutrition and its impact on labour productivity
n/a
LISIC, cLabour supply n/a Extracted from ILO database ILO
γISIC, cSectoral elasticity of substitution between labour and capital
n/a 1–1/ρISIC where ρISIC is the elasticity coefficient from GTAP
GTAP
Notes: All indicators expressed in currency are converted to 2017 US dollars using the US GDP deflator extracted from the IMF World Economic Outlook database.217 n/a = not applicable.Source: Vivid Economics.
Nutritional deficiencies are assumed to be additive in impact. The literature used to determine the coefficients typically aims to estimate the impact of malnutrition on labour productivity holding other explanatory variables constant. For example, the impact of BMI on wages is estimated holding height constant, and the impact of anaemia on productivity is estimated holding calorie consumption constant. However, the literature does not investigate the additionality or interaction between forms of malnutrition, and it is unclear whether the presence of multiple forms of malnutrition would amplify or reduce the observed impact of specific forms of malnutrition on productivity. It is unclear, therefore, how conservative our approach is.
Malnutrition is expected to affect both presenteeism and absenteeism. The literature reviewed has only estimated the impact of malnutrition on output, hourly wages or monthly wages. While monthly wages may take into account some absenteeism impacts, it is reasonable to conclude that the literature has focused on presenteeism. Malnutrition among workers is expected to contribute to absence from work due to illness, and there is a growing body of evidence that shows that poor health in children (which can be caused by malnutrition) imposes costs on business through increasing parental absenteeism.218 The modelling exercise only takes into consideration the impacts of presenteeism on the current workforce.
Given the static, partial equilibrium approach, only labour productivity is assumed to vary with the prevalence of undernutrition. All other inputs to the model are not sensitive to undernutrition. Specifically, employment for each sector is based on current shares of employment by sector for each country; there
217 International Monetary Fund (2019), ‘World Economic Outlook database’, https://www.imf.org/external/pubs/ft/weo/2019/02/weodata/index.aspx (accessed 15 May 2020).218 Kuhlthau, K. A. and Perrin, J. M. (2001), ‘Child Health Status and Parental Employment’, Archives of pediatrics and Adolescent Medicine, 155 (12), pp. 1346–50, 10.1001/archpedi.155.12.1346 (accessed 15 May 2020); and Major, D. A., Cardenas, R. A. and Allard, C. B. (2004), ‘Child health: A legitimate business concern’, Journal of Occupational Health Psychology, 9(4), pp. 306–21, https://doi.org/10.1037/1076-8998.9.4.306 (accessed 15 May 2020).
Malnutrition among workers is expected to contribute to absence from work due to illness, and there is a growing body of evidence that shows that poor health in children imposes costs on business through increasing parental absenteeism

The Business Case for Investment in NutritionAnnex I: Methodology – Vivid Economics Model
67 | Chatham House
is no automatic rebalancing between sectors: i.e. the model does not include any cross-sectoral substitution of labour or capital stock. The limitations of this approach are expanded on in the description of the theoretical approach (Section 1.2).
1.6 Extend: how is the model extended to test sensitivities and explore further impacts?
Sensitivity analysis is used to test the results of the modelling and ensure robustness. Four scenarios were developed, picking up on themes in the literature which identified the largest impacts of malnutrition on the workforce. Table 7 summarizes the changes in coefficients used in these four scenarios.
• Anaemia – for the five countries with haemoglobin data available for both male and female workers, the impact of anaemia on labour productivity and sectoral output is included.
• Childhood malnutrition – childhood malnutrition is not included in the core model, as the interpretation is challenging. Had a worker not experienced malnutrition in childhood, he or she might have accumulated more education and might now be working in a different occupation or sector. As a result, adult short stature resulting from childhood stunting is an extension to the model, and only the impact of childhood stunting on physical capacity in current occupation is considered.
• Additional impact of severe chronic hunger – the literature suggests that there may be additional labour productivity impacts from experiencing severe chronic hunger (as proxied by being severely underweight, a BMI value of below 17.0). Shimokawa’s219 analysis suggests that the impact of being severely underweight is 60 per cent worse than being underweight for men, and 80 per cent worse for women.
• Additional impact of underweight on manual workers – as with anaemia, we would expect the impact of underweight to be more severe for manual workers. The literature points in this direction, with underweight more strongly reducing the labour productivity of the less educated or those on lower incomes, who are more likely to work in manual occupations.220 For sensitivity analysis, it is assumed that underweight only affects the labour productivity of manual workers (this is in line with Kedir).221
219 Shimokawa (2011), ‘The labour market impact of body weight in China: a semiparametric analysis’.220 Kedir (2013), ‘Schooling, BMI, Height and Wages: Panel Evidence on Men and Women’; Schultz (2003), ‘Wage rentals for reproducible human capital: evidence from Ghana and the Ivory Coast’; Thomas and Strauss (1997), ‘Health and wages: Evidence on men and women in urban Brazil’; and Yimer and Fantaw (2011), ‘The impacts of health and nutrition on wages in Ethiopia’.221 Kedir (2013), ‘Schooling, BMI, Height and Wages: Panel Evidence on Men and Women’.

The Business Case for Investment in NutritionAnnex I: Methodology – Vivid Economics Model
68 | Chatham House
Table 7: Coefficients are adapted from those used in the main model to estimate the impact of childhood stunting (proxied by adult short stature) and for sensitivity analysis
Malnutrition Gender Type of worker
Scenario Notes
1 2 3 4
Anaemia n/a Non-manual
1.00 – – – Taken from Horton and Ross.222
n/a Light manual
0.95 – – –
n/a Heavy manual
0.83 – – –
Childhood malnutrition (adult short stature)
n/a Non-manual
– 1.00 – – Adapted from Haddad and Bouis,223 following the approach used in the Cost of Hunger in Africa studies224 and the Nutrition PROFILES guidelines.225
n/a Manual – 0.94 – –
Severe chronic hunger
Male n/a – – 0.61 – The coefficients are adapted using Shimokawa,226 which shows that the impact of being severely underweight is 60% worse than being underweight for men and 80% worse for women. The coefficients are adapted on the assumption that 10% of people experiencing chronic hunger will experience severe chronic hunger.
Female n/a – – 0.57 –
Chronic hunger
Male n/a – – 0.75 –
Female n/a – – 0.76 –
Underweight Both Non-manual
– – – 1.00 The coefficients are adapted using Kedir.227 The findings show that physical attributes only determine the wages of individuals with primary-level schooling or less. They argue that these individuals are manual workers and that those with above primary school education are non-manual workers. The coefficients are adapted on the assumption that in low-income and lower-middle income countries 83% of men and 84% of women work in manual operations.
Both Manual – – – 0.69
Note: Childhood malnutrition is proxied by childhood stunting, which in turn is proxied by adult short stature, as described in previous sections, while severe chronic hunger is proxied by BMI <17 kg/m2 and chronic hunger is proxied by BMI <18.5 kg/m2. ‘n/a’ = not applicable, ‘–’ = not relevant to the scenario.Source: Vivid Economics.
222 Horton and Ross (2003), ‘The economics of iron deficiency’.223 Haddad and Bouis (1991), ‘The impact of nutritional status on agricultural productivity: Wage evidence from the Philippines’224 African Union Commission et al. (2014), The Cost of Hunger in Africa.225 Ross and Stiefel (undated), ‘PROFILES Guidelines: Calculating the effects of Malnutrition on Economic Productivity, Health and Survival’.226 Shimokawa (2011), ‘The labour market impact of body weight in China: a semiparametric analysis’.227 Kedir (2013), ‘Schooling, BMI, Height and Wages: Panel Evidence on Men and Women’.

69 | Chatham House
Annex II: Additional Results from the Vivid Economics Model
Below we include additional results on the prevalence and costs of malnutrition in its different forms.
Figure 17: The prevalence of underweight in the workforce (%)
Notes: Grey cells indicate sectors with too few data points to estimate sectoral prevalence. Bangladesh’s agricultural sector is not included in our findings. The number of agricultural workers surveyed in Bangladesh only just surpassed our threshold for minimum sample size, and all surveyed workers were in the normal range of BMI. Given what we know about agricultural workers in other countries, and the prevalence of underweight in other sectors in Bangladesh (for which the sample size was significantly larger), this is likely not a representative sample. The overall economic cost to business in Bangladesh is therefore likely to be a significant underestimate, and sector-specific findings for Bangladesh will be more salient than the ‘all sector’ average.Source: Vivid Economics.
Agr
icul
ture
Min
ing
Man
ufac
turi
ng
Elec
tric
ity
Wat
er/s
ewer
age
Con
stru
ctio
n
Ret
ail/
trad
e
Tran
spor
tati
on
Info
and
com
ms
Fina
ncia
l/in
sura
nce
Prof
essi
onal
ser
vice
s
Hou
seho
ld s
ervi
ces
Educ
atio
n/he
alth
All
sect
ors
Albania 0.86 1.23 1.16 1.33 1.12 1.05 1.45 1.15 1.60 1.42 1.59 1.47 1.46 1.16
Bangladesh 1.87 2.31 8.05 6.02 0.68 12.16 1.14 11.23 12.67 12.98 4.59 16.24 3.99
Cambodia 13.08 14.80 14.58 9.93 14.59 8.62 3.87 14.71 12.94 15.33 11.23 11.56 12.03
India 21.02 17.62 15.63 14.41 16.36 18.57 12.06 16.06 10.20 10.14 9.48 15.79 11.01 17.48
Nepal 6.50 18.43 4.27 9.60 14.18 8.34 1.58 14.69 10.48 14.38 12.26 12.24 13.12 6.93
Pakistan 23.36 2.16 11.56 7.89 9.56 15.16 6.25 3.09 3.76 2.51 1.92 9.25 3.74 13.88
Egypt 0.22 0.08 0.06 0.16 0.16 0.01 0.32 0.02 0.21 0.13 0.10 0.17 0.15 0.16
Côte d’Ivoire 6.72 1.96 5.64 0.94 5.49 0.83 2.65 5.92 8.66 2.97 3.35 5.09
Ethiopia 30.73 24.91 19.92 20.39 25.49 22.86 19.05 18.85 19.49 19.11 19.34 25.74 20.00 27.71
Ghana 9.99 4.40 5.43 4.62 7.55 5.67 4.20 4.10 3.63 2.98 3.34 4.37 3.98 6.08
Mozambique 10.22 0.71 3.81 5.56 4.76 5.14 5.08 1.83 5.07 3.41 4.61 4.85 4.82 8.65
Namibia 10.94 10.39 11.81 10.60 10.44 12.93 10.90 8.13 8.41 7.09 7.56 11.33 6.74 10.38
Rwanda 9.73 9.15 8.10 7.22 8.34 9.19 6.42 6.28 5.46 4.31 5.22 9.14 5.29 8.32
Tanzania 10.28 12.09 12.08 9.56 8.59 12.57 7.09 8.91 7.56 7.07 7.48 7.03 6.83 9.61
Zambia 13.26 7.02 9.54 8.93 11.00 8.52 2.48 7.87 6.35 5.22 9.70 4.69 9.21
Zimbabwe 7.53 5.26 6.73 5.59 6.82 7.28 6.65 5.29 5.72 4.61 5.65 7.45 5.04 7.13
Dominican Republic 1.73 4.62 5.33 4.28 4.53 5.68 4.60 5.00 4.26 4.70 2.55 4.62 3.02 4.26
Guatemala 2.37 2.20 1.86 1.70 2.34 1.85 2.28 2.14 2.35 2.63 2.36 2.43 2.08 2.22
Honduras 3.23 3.52 2.62 2.16 3.18 2.69 3.79 3.84 2.59 2.88 1.98 3.35 2.47 3.19
All modelled countries 18.23 14.65 12.33 11.48 14.17 15.82 9.90 10.80 9.23 9.65 8.42 13.36 9.13

The Business Case for Investment in NutritionAnnex II: Additional Results from the Vivid Economics Model
70 | Chatham House
Figure 18: The prevalence of obesity in the workforce (%)
Note: Grey cells indicate sectors with too few data points to estimate sectoral prevalence.Source: Vivid Economics.
Figure 19: The combined prevalence of underweight and obesity in the workforce, by country
Source: Vivid Economics.
Agr
icul
ture
Min
ing
Man
ufac
turi
ng
Elec
tric
ity
Wat
er/s
ewer
age
Con
stru
ctio
n
Ret
ail/
trad
e
Tran
spor
tati
on
Info
and
com
ms
Fina
ncia
l/in
sura
nce
Prof
essi
onal
ser
vice
s
Hou
seho
ld s
ervi
ces
Educ
atio
n/he
alth
All
sect
ors
Albania 20.82 21.60 19.79 17.33 17.68 16.58 18.11 20.56 17.70 14.79 17.75 18.69 17.99 19.27
Bangladesh 0.26 0.32 1.07 0.69 0.14 1.79 0.19 1.34 2.07 2.19 0.72 1.57 0.54
Cambodia 1.67 1.05 1.38 3.81 1.48 4.27 0.63 1.83 2.17 1.75 2.57 1.91 2.04
India 1.99 3.19 3.59 4.21 3.52 2.96 4.10 3.37 5.59 5.28 5.84 3.63 5.50 3.04
Nepal 0.78 2.11 0.74 1.92 2.38 1.16 0.25 2.34 2.42 2.53 4.23 2.10 3.14 1.21
Pakistan 6.54 1.14 6.38 5.43 5.34 7.09 11.48 1.97 8.85 4.10 4.92 8.42 11.15 7.64
Egypt 28.90 28.33 26.99 29.33 29.93 25.04 27.96 27.84 29.89 30.59 30.43 29.98 30.31 28.28
Côte d’Ivoire 1.29 0.61 2.72 0.45 1.56 0.35 1.08 2.49 4.18 1.00 1.32 1.25
Ethiopia 0.60 1.98 2.99 3.22 1.83 2.39 3.24 3.04 3.61 3.62 3.53 1.80 3.77 1.32
Ghana 2.08 5.07 9.71 10.95 7.83 9.48 13.26 4.94 9.00 9.39 7.09 10.04 9.12 8.24
Mozambique 1.13 0.80 3.41 4.85 6.01 5.06 7.09 2.69 7.66 7.36 8.34 6.16 6.99 2.45
Namibia 7.63 11.90 10.37 14.32 12.26 8.90 13.51 13.28 19.63 22.25 20.74 11.40 16.82 12.02
Rwanda 1.08 1.39 3.73 3.90 2.08 1.95 6.08 2.56 5.54 5.49 5.58 1.74 4.60 2.72
Tanzania 3.21 6.26 6.69 8.93 9.85 6.78 10.84 5.60 10.50 11.43 11.57 11.12 12.46 5.37
Zambia 2.35 4.58 4.93 4.27 5.40 5.95 1.26 6.52 6.53 6.34 5.03 8.14 4.93
Zimbabwe 7.08 6.26 7.33 10.18 6.14 6.76 8.81 7.40 11.87 12.96 11.45 8.61 14.55 7.85
Dominican Republic 7.68 16.75 14.59 16.60 16.58 13.73 17.26 15.86 16.81 16.48 18.89 16.86 17.67 15.66
Guatemala 10.54 12.30 13.69 10.87 12.37 11.12 18.77 15.01 16.22 16.76 17.15 15.37 17.82 14.47
Honduras 10.49 11.82 15.92 16.55 13.81 15.33 17.87 11.61 18.69 18.75 19.36 15.62 18.99 14.86
All modelled countries 2.82 3.67 4.75 6.93 6.50 4.41 6.65 4.34 6.80 6.02 7.52 5.48 8.82
Prevalence in workforce (%)
ObeseUnderweight
0
5
10
15
20
25
30
35
Ethiopia
Egypt
Namibia
Pakistan
India
Albania
Dominican Rep
.
Honduras
Guatemala
Tanzania
Zimbabwe
Ghana
Zambia
Cambodia
Moza
mbique
RwandaNepal
Côte d’Ivoire
Bangladesh

The Business Case for Investment in NutritionAnnex II: Additional Results from the Vivid Economics Model
71 | Chatham House
Figure 20: The combined cost of underweight and obesity in the workforce (as a proportion of GVA, %)
Note: Grey cells indicate sectors with too few data points to estimate sectoral prevalence.Source: Vivid Economics.
Figure 21: The prevalence of anaemia by occupation
Note: The prevalence by occupation is estimated as an average of the prevalence in the five countries modelled, where the occupation sample size is at least 20 survey respondents.Source: Vivid Economics.
Agr
icul
ture
Min
ing
Man
ufac
turi
ng
Elec
tric
ity
Wat
er/s
ewer
age
Con
stru
ctio
n
Ret
ail/
trad
e
Tran
spor
tati
on
Info
and
com
ms
Fina
ncia
l/in
sura
nce
Prof
essi
onal
ser
vice
s
Hou
seho
ld s
ervi
ces
Educ
atio
n/he
alth
All
sect
ors
Albania 5.35 4.06 0.86 0.52 0.97 0.78 0.13 0.20 0.80 1.22 0.18 1.32 3.50 1.59
Bangladesh 0.24 0.10 0.10 0.52 0.00 0.87 0.08 0.45 0.71 0.08 0.59 1.30 0.31
Cambodia 1.31 0.38 0.26 0.28 0.44 0.49 0.02 0.08 0.10 0.06 0.24 0.95 0.69
India 2.34 2.24 0.58 0.21 0.74 1.59 0.15 0.48 0.19 0.20 0.29 1.15 1.42 1.00
Nepal 0.67 1.90 0.06 0.07 0.17 0.11 0.05 0.12 0.22 0.24 0.16 0.56 1.20 0.45
Pakistan 3.71 0.37 0.14 0.08 0.07 0.85 0.05 0.03 0.18 0.08 0.20 0.62 1.28 0.66
Egypt 6.36 4.97 0.70 0.21 0.37 0.76 1.79 0.63 0.46 2.88 1.05 2.38 4.60 2.58
Côte d’Ivoire 0.30 0.10 0.27 0.07 0.24 0.02 0.20 0.37 0.87 0.16 0.09 0.31
Ethiopia 2.86 3.01 1.04 0.07 0.15 0.71 0.28 0.19 0.17 0.45 0.14 0.65 2.10 1.66
Ghana 1.20 1.14 1.36 0.55 0.95 0.86 2.66 0.21 0.54 0.94 0.35 1.23 1.61 1.15
Mozambique 0.86 0.20 0.19 0.06 0.21 0.52 1.21 0.20 0.24 0.13 0.28 1.66 1.74 0.66
Namibia 2.57 3.59 0.48 0.45 0.42 0.25 0.44 0.24 0.63 0.61 0.13 3.17 3.62 1.42
Rwanda 0.95 0.98 0.34 0.28 0.60 0.41 0.65 0.31 0.40 0.69 0.21 0.99 1.48 0.76
Tanzania 1.48 2.33 0.39 0.19 0.20 0.83 0.79 0.25 0.26 1.06 3.14 1.74 3.82 1.55
Zambia 1.38 1.47 0.22 0.27 0.26 0.54 0.06 0.33 0.25 0.50 0.99 1.76 0.71
Zimbabwe 2.17 1.35 0.39 0.30 0.51 1.31 0.98 0.47 0.62 2.42 0.47 1.73 2.84 1.18
Dominican Republic 1.95 3.69 0.41 0.26 1.10 0.57 0.21 0.22 0.22 0.94 0.07 0.38 3.76 0.81
Guatemala 2.12 2.44 0.86 0.19 1.05 1.12 1.09 1.52 0.25 0.92 0.32 2.77 3.77 1.37
Honduras 2.22 2.49 1.15 0.73 0.88 0.61 0.65 0.41 2.71 1.16 0.35 2.38 4.35 1.69
All modelled countries 2.44 2.93 0.53 0.20 0.59 1.32 0.31 0.36 0.28 0.39 0.35 1.19 1.74
Workforce prevalence of anaemia (%)
Heavy manual Light manual Non-manual
0
2
4
6
8
10
14
12
18
16
20
Elementary
occupatio
nsServ
ice
and sales
Skilled
agricultu
re
Professi
onals
Clerical
support Cra
ft
and trade
Technici
ans
Armed fo
rces
Mach
ine
operato
rs
Managers

The Business Case for Investment in NutritionAnnex II: Additional Results from the Vivid Economics Model
72 | Chatham House
Figure 22: Differences in the prevalence of anaemia between men and women, by occupation
Note: The prevalence by occupation is estimated as an average of the prevalence in the five countries modelled, where the occupation sample size is at least 20 survey respondents.Source: Vivid Economics.
Workforce prevalence of anaemia (%)
Female Male Gender gap, percentage points
0
5
10
15
20
25
30
Elementary
occupatio
nsServ
ice
and sales
Skilled
agricultu
re
Professi
onals
Clerical
support Cra
ft
and trade
Technici
ans
Armed fo
rces
Mach
ine
operato
rs
Managers
13.2 7.1 13.5 17.7 8.4 14.9 14.7 4.0 -0.5-0.5 0.20.2

73 | Chatham House
Annex III: Methodology – Company Interviews
In seeking to elicit insights and opinion from corporate representatives for this report, we conducted semi-structured interviews as a means of guiding the discussion to cover certain topics while allowing space to capture new perspectives from participants and to respond to changing levels of awareness and understanding over the course of each interview.
Response to invitation to participate
A total of 130 companies were invited to participate in an interview. The majority of companies invited were large MNCs, all of which are active in low-, lower-middle- and/or upper-middle-income countries. Where possible, to maximize the chances of response, invitations were sent to individuals with whom Chatham House already had direct contact within the companies. Each contact was asked to pass the invitation on to someone within the company with oversight either of human resources in low- and middle-income countries or of sustainability-related activity in such countries. For companies with which Chatham House had no existing contact, invitations were sent either to contacts of The Power of Nutrition, to individuals in relevant roles (identified using company websites or LinkedIn) or, in a small number of cases, to generic contact email addresses.
Of the 130 companies, 77 (59 per cent) responded either positively or negatively. Of these, 16 agreed to participate in an interview (12 per cent of the total approached; 21 per cent of the total that responded), while 22 provided a reason for their non-participation (29 per cent of those that responded). These reasons are outlined in Table 8 below (wording has been edited slightly to protect the anonymity of companies where necessary).
All 16 companies are MNCs with operations in low- and middle-income countries. Nine of the 16 companies are headquartered in Europe, four in Asia, and three in the United States.
The sectoral spread of the 16 companies is as follows:
• Oil and gas (3)
• Food and beverage (2)
• Nutritional products (2)
• Apparel (2)
• Grocery (2)
• Agribusiness (1)
• Mining (1)
• Pharmaceuticals (1)
• Professional services (1)
• Information and communications (1)

The Business Case for Investment in NutritionAnnex III: Methodology – Company Interviews
74 | Chatham House
Table 8: Reasons provided for non-participation
Theme Reasons provided
Staff unlikely to be malnourished
‘Even though we are present in areas which may fall under the “low- to lower-middle-income” category, we believe undernutrition does not impact our business operations here.’
‘We have offices in a number of developing countries, but these are small offices staffed by well-paid professionals. We do not employ large numbers of people in these markets, though we are invested in companies that do.’
‘We get free food in the company, but I don’t think it is because there is any concern that employees would otherwise be malnourished.’
Not enough time to take part
‘We don’t have enough time.’
‘Unfortunately, the timing right now is not the best.’
‘We don’t have enough bandwidth.’
‘We believe this is an important area, but we are still working on our supply chain strategy and we aren’t at a point where we can meaningfully participate in this kind of conversation.’
‘I’m afraid your email lands at a time when we’re preoccupied with our full-year results.’
Unable to identify the right person
‘I have spent the last few days trying to get senior colleagues interested in this but have failed miserably.’
‘I haven’t quite found the right contact.’
‘I’ve passed it on to our HR department for advice.’
‘I have passed it on to HR colleagues and am afraid they will not be able to participate.’
‘I have passed on your information to our local HR head.’
Outside of the remit or focus area of the company
‘It’s definitely not an area that the company is exploring, nor do I feel we would in the future.’
‘I’m afraid the scope of this research is too far away from our current priorities.’
‘It is not core to our business and expertise.’
‘We don’t consider this as an important issue for the company.’
‘This is outside the remit of our citizenship endeavours and capacity of our business teams which are focused on other areas.’
‘The area of undernutrition is not a scope of our work.’
‘Nutrition is not one of our focus areas for our work in social impact and is therefore not an issue we have a perspective on.’
Staff predominantly located in high-income countries
‘We are a global company, but with virtually all our staff based in high-income countries.’
‘As we are mainly UK-based, this research probably would not apply to us.’

The Business Case for Investment in NutritionAnnex III: Methodology – Company Interviews
75 | Chatham House
Analysis of interviews
Participants were encouraged to speak about the issues of particular interest to them, and in which they had a degree of expertise, as well as being prompted to consider issues that were less familiar to them prior to the interview.
The result is a set of interview responses which are non-equivalent; no two interviews followed precisely the same flow, and the omission of a particular issue or initiative from one interview can be interpreted neither as confirmation that the issue has not been considered by the participant or his/her company nor as an indication that an initiative is not in place. These responses were analysed thematically; we do not attempt to draw any quantitative results from them nor to assert that the views expressed by participants are representative of the organizations they represent or of the wider sector.
The interviews were not recorded (this was at the request of many participants), but instead were transcribed in real time by two transcribers. To the extent possible, these transcriptions were semi-verbatim (capturing the exact wording of the interviewee but not including fillers or hesitations such as ‘uhhh’ or ‘let me think about that for a moment’). Some responses quoted in this report have been very lightly edited for grammar and clarity.
The interview responses were then coded by one researcher before being grouped by theme and analysed. Examples of codes and themes used are included below (Table 9). Codes and themes were identified by hand and were verified by a colleague who had not been involved in the interviews.
Table 9: Example codes and themes (non-exhaustive)
Theme Example codes
Prevalence/significance of undernutrition UndernutritionUnderweightAnaemiaMicronutrient deficiency
Prevalence/significance of overweight/obesity OverweightObesityHigh BMIDiet-related non-communicable diseases
Risk factors for malnutrition AgeIncomeLifestyleGeographical region
Impact of malnutrition Fitness for dutyAbsenteeismPresenteeismLow productivitySkills level Educational attainment
Motivations for action on nutrition Responsible businessSDGsReturn on investmentEmployee well-beingReputational riskHealth strategy

The Business Case for Investment in NutritionAnnex III: Methodology – Company Interviews
76 | Chatham House
Semi-structured interview framework
The questions underpinning the semi-structured interviews, and the background provided to interview participants, are included below:
Introduction to project and interview
Chatham House is undertaking research, supported by The Power of Nutrition and the wider Research Funders Network, to assess the impact of malnutrition in low- and middle-income countries on global business. The output from the research will be a short report, aimed at business and to be launched around the 2020 Nutrition for Growth Summit, that outlines the cost to business of malnutrition and explores particular sectors and regions for which the economic burden of malnutrition on the private sector is particularly great.
Working with Vivid Economics, we will be undertaking an economic analysis of the cost of malnutrition to business. These interviews will complement this quantitative research and are intended to give us an insight into how malnutrition affects businesses’ day-to-day operations, the extent to which the impact of malnutrition on workforce productivity and consumer demand is monitored, and what businesses believe is needed to better manage malnutrition along supply chains and across wider societies.
We are happy to anonymize the results of this interview or to list you as an individual or your business as a participant in the research – this is up to you.
For clarity, we are defining malnutrition as both undernutrition (stunting, wasting, micronutrient deficiencies) and overnutrition (overweight and obesity). When we talk about the impact of malnutrition on business, we are thinking about workforce productivity, workforce skills attainment and consumer demand. For example, we are interested in the extent to which malnutrition contributes to absenteeism and lost work hours, the way in which malnutrition limits the skills attainment of the workforce and affects productivity, and the degree to which malnutrition stifles economic growth and consumer demand for goods and services.
Questions
Malnutrition as it impacts on your company1. Is malnutrition an issue that your company has considered or addressed?
a) If so, in what context?b) Does nutrition form any significant part of your company’s sustainability,
social engagement or value-creation work?c) Has there ever been any assessment or exploration of the nutrition
of your workforce?
2. Do you know of any examples of workers’ ill-health impacting in a material way on your company’s operations, for example high rates of absenteeism or lower than expected productivity?
3. What’s your perception of malnutrition as it relates to your workforce? Would you expect staff at any given point in your supply chain – or in any particular regions – to be affected by undernutrition, anaemia or overweight/obesity?

The Business Case for Investment in NutritionAnnex III: Methodology – Company Interviews
77 | Chatham House
4. Thinking of your operations in low- and middle-income countries, are you aware of any particular skills gap that your company has encountered when trying to recruit – either for skilled or unskilled jobs?
Management strategies5. In terms of facilities and services available to staff…
a) Do your sites and factories provide access to a staff canteen?b) Do you offer or require any particular training on basic nutrition or related
areas like hygiene?
6. In terms of the health and well-being of your staff…
a) What are the principal health concerns with regard to your workforce?b) Do you perceive or know these to have a material impact on your company’s
productivity or profitability?c) Are there particular regions in which your company operates, or nodes
along your supply chain, where you perceive workforce ill-health to be a particularly significant problem for your company?
d) Has your company taken any steps to promote good health among your workforce, such as access to medical check-ups or support on specific health issues such as HIV/AIDS?
7. Thinking about your sustainability, social engagement or value-creation work…
a) To what extent is this work joined up with the day-to-day operations and policies of your company?
b) For example, has there been any effort to undertake impact valuation of these activities for the company?
Engagement with our research8. Chatham House’s research
a) Do you see this work as of potential interest and value to you and the company?b) How might a quantification of the cost of malnutrition to your sector
influence your business planning or decisions?
9. Follow-up
a) Are there other parts of the company which you think we should get in touch with?i) For example, we’re speaking to HR managers from other companies, and
exploring the extent to which existing data or monitoring systems could be used to assess whether worker malnutrition is costing your company.
b) Would you consider sharing an online version of these questions with your suppliers or site managers?
c) Would you be happy for us to be in touch further down the line to share with you some insights from our analysis, and perhaps to talk again with you about their relevance and usefulness for your company?

78 | Chatham House
Annex IV: Methodology – Review of Company Reports
In order to gauge the level of corporate activity on nutrition, the nature of this activity, and the extent to which companies are reporting on it, we undertook a desk-based review of a sample of companies and their online literature: annual reports, sustainability reports, website content and other resources published on company websites. This review cannot be used to draw conclusions on the extent and nature of company activity on nutrition, but rather the extent and nature of nutrition-related activity on which they report.
As our focus was mainly on multinational companies (MNCs) with operations in low- and middle-income countries, we reviewed the top 100 non-financial transnational companies ranked by foreign assets, as identified by the UN Conference on Trade and Development (UNCTAD),228 and the top five companies in each industry as identified by the Fortune Global 500.229 Additional companies with which we were in contact for this project – through semi-structured interview participants, workshop participants and members of the Research Funders Network – were also sampled. In total, 180 companies were sampled.
We identified the group website for each company and then used the website’s search function to search for ‘nutrition’. Companies without websites, or without English-language information, were omitted from the list. For each company, we reviewed the top 10 results and identified any information indicating the company was taking action specifically on nutrition in the workplace at group level, and if it was implementing activities in its supply chains or within the local/global community. We also reviewed the company’s annual and sustainability reports from the past five years for mentions of nutrition.
We then conducted a second search within these documents (the top 10 results for ‘nutrition’ together with the annual reports and sustainability reports from the past five years) to include other key terms related to nutrition: for example, ‘underweight’ and ‘undernutrition’, ‘overweight’ and ‘obesity’, ‘food’, ‘breastfeeding’, ‘canteen’, ‘BMI’. In a third search, we looked for mentions of related areas, such as ‘WASH’ and ‘health’. Finally, we conducted a fourth search for ‘nutrition + [name of company]’ and ‘nutrition + [name of company] + report’ using Google. Where relevant results were returned for resources published on the company’s website, these were included.
Table 10 gives an indicative, though not exhaustive, list of the types of activity included under each category.
228 UNCTAD (2019), ‘Annex table 19: The world’s top 100 non-financial MNEs, ranked by foreign assets, 2018’, World Investment Report, https://unctad.org/en/Pages/DIAE/World%20Investment%20Report/Annex-Tables.aspx (accessed 10 Feb. 2020).229 Fortune (2019), ‘Global 500’, https://fortune.com/global500/search/ (accessed 10 Feb. 2020).

The Business Case for Investment in NutritionAnnex IV: Methodology – Review of Company Reports
79 | Chatham House
Table 10: Indicative examples of company activity included under each ‘intervention’ category
Intervention area Indicative activities included under intervention area
Nutrition education or training programmes
Workforce• Classes or workshops focused on nutrition or including a specific
element on nutrition• Information and awareness campaigns in the workplace on nutrition • Online learning materials on nutrition, including online training
modules, apps to support personal nutritional intake, apps to provide information on nutrition
Supply chain• Training sessions and materials made available to suppliers
Global/local communities• Training and education sessions for local schoolchildren • Information and awareness campaigns for the community
or the public • Gardening projects in partnership with schools to encourage
children and young people to grow their own food and eat more fruits and vegetables
Breastfeeding support Workforce• Provision of breastfeeding equipment • Provision of breastfeeding pods and mothers’ nursing rooms • Flexible working policies specifically aimed at supporting breastfeeding • Onsite crèche facilities for infants of breastfeeding women• Breastmilk delivery services for women on work travel • Apps providing regular advice on breastfeeding
Global/local communities• Provision or financing of pop-up breastfeeding pods in public areas
Manufacture and/or sale of nutritional products and services
Global/local communities• Manufacture or sale of vitamins and supplements• Manufacture or sale of breast pumps and breastfeeding equipment• Manufacture or sale of fortified foods• Development and sale of apps to monitor nutritional intake
and provide nutritional support to users
On-site food provision and community feeding programmes
Workforce• Healthy snacks and lunch available in the workplace • Provision of food vouchers to employees• Distribution of food packages to employees
Global/local communities• Partnerships with food banks, including donations and
volunteer programmes • School meal provision, including donations towards free school
meals and distribution of food packages to local schools
Incentives for healthy eating
Workforce• Nutritional food labelling in staff canteens to encourage healthier
food choices• Well-being programmes and campaigns, including advice
on healthy eating • Support groups and discussion groups around healthy eating
Nutritional status monitoring
Workforce• Dedicated weight-loss or nutrition programme as part of health
plan for workers, with regular check-ups• Monitoring of nutritional health indicators, e.g. BMI and blood
glucose levels, as part of health monitoring
Global/local communities• Monitoring of nutritional status indicators as part of community
health checks

The Business Case for Investment in NutritionAnnex IV: Methodology – Review of Company Reports
80 | Chatham House
Intervention area Indicative activities included under intervention area
Nutrition-focused partnerships in the community or at population level
Civil society organizations (CSOs)• Nutrition-related partnerships with CSOs providing support
and donations, for example food provision to local food banks • Participation in nutrition-focused multi-stakeholder platforms
involving CSOs
Donors, funders and UN agencies• Partnerships with government donor agencies and UN agencies
to deliver nutrition training within global and local communities• Participation in nutrition-focused multi-stakeholder platforms
involving donors, funders and UN agencies • Financing of initiatives delivered by donor agencies, including school
meal programmes delivered by the World Food Programme
Public and government• Partnerships with government agencies to develop and disseminate
awareness and information campaigns focused on nutrition • Participation in stakeholder meetings and working groups with
government departments on nutrition-related issues• Participation in nutrition-focused multi-stakeholder platforms
involving public agencies and government
Private/corporate• Collaboration with other businesses to provide a nutrition-focused
service (e.g. nutrition training) in the workplace or the community • Participation in nutrition-focused business networks• Participation in nutrition-focused multi-stakeholder platforms
involving other businesses
Research and academic• Partnerships with academic institutions to deliver health
and nutrition training in communities• Partnerships with academic institutions to fund nutrition research
Investment in agricultural production and value chains
Supply chain• Delivery of training and extension services to farmers in the supply
chain to boost productivity
Global/local communities• Engagement with farmers in the community to advise on more
efficient ways of farming, including through the delivery of training workshops
• Development and distribution of agricultural products to boost productivity, including seed, fertilizers and equipment

81 | Chatham House
Abbreviations and Acronyms
BMI body mass indexBSR Business for Social Responsibility initiativeCBD Convention on Biological DiversityCEPAL Comisión Económica para América LatinaCGF Consumer Goods ForumCSO civil society organizationCSR corporate social responsibilityDHS Demographic and Health SurveysESG environmental, social and governanceFAO Food and Agriculture Organization of the United NationsFReSH Food Reform for Sustainability and Health initiativeg/dL grams per decilitreGAIN Global Alliance for Improved NutritionGVA gross value addedIFAD International Fund for Agricultural DevelopmentILO International Labour OrganizationIPCC Intergovernmental Panel on Climate ChangeMNC multinational companyN4G Nutrition for GrowthNGO non-governmental organizationODA official development assistanceSASB Sustainability Accounting Standards BoardSBN SUN Business NetworkSDGs Sustainable Development GoalsSME small or medium-sized enterpriseSUN Scaling Up NutritionUNCTAD United Nations Conference on Trade and DevelopmentUNECA United Nations Economic Commission for AfricaUNFCCC United Nations Framework Convention on Climate ChangeUSAID U.S. Agency for International DevelopmentWASH water, sanitation and hygieneWBCSD World Business Council for Sustainable DevelopmentWFP World Food ProgrammeWHO World Health Organization

82 | Chatham House
About the Authors
Laura Wellesley is a senior research fellow in the Energy, Environment and Resources Programme at Chatham House. Laura’s main areas of research interest are policy strategies to promote healthy and sustainable diets, and approaches to managing systemic risks to global food trade. She has also worked on approaches to delivering an inclusive circular economy in low-income countries, and on innovative alternatives to meat. Laura’s past Chatham House publications include the 2017 report, Chokepoints and Vulnerabilities in Global Food Trade, and the 2015 report, Changing Climate, Changing Diets: Pathways to Lower Meat Consumption. Laura is a member of the London Food Board and, prior to joining Chatham House in 2013, was a researcher for Global Witness. Laura has an MSc in Africa and international development from the University of Edinburgh and an MA in modern and medieval languages from the University of Cambridge.
Jason Eis is the executive director of Vivid Economics. Jason manages the company and oversees project work in finance, energy and industry, cities and infrastructure, and natural resources. His clients include multinational companies, international organizations, NGOs and government agencies. Prior to joining Vivid, Jason was regional director for the Global Green Growth Institute, where he oversaw programmes in Latin America, Africa and India, supporting public policy and private-sector investment decisions in the energy, transport, agricultural and forestry sectors. Jason has a PhD in economics from the University of California, Berkeley, and a BA from Yale University.
Cor Marijs is a principal at Vivid Economics, leading the company’s sustainable finance practice group and heading its EU office in Amsterdam. Since joining Vivid in 2011, he has supported a range of clients across government, the private sector, international organizations and NGOs in developing and implementing strategies for navigating today’s sustainability transitions. He led the Vivid teams that created the UN Global Compact’s Blueprint for Business Leadership on the SDGs and that analysed energy demand transition scenarios for the Energy Transition Commissions. He has worked extensively on mobilizing the private sector in generating sustainable economic growth in developing and emerging economies. He holds a BSc and MSc in economics from Utrecht University and an MSc in environmental policy from Oxford University.
Caroline Vexler is an economist at Vivid Economics, focusing on human health and ecosystems. She is experienced in the non-market valuation of well-being and disease incidence; she led on developing the health valuation methodologies for Greenkeeper, an urban greenspace valuation toolkit. Prior to working at Vivid, she gained public-sector experience in the Chemicals & Waste Branch of UN Environment and co-authored a working paper on the economics of water resources and aquatic species management. Caroline holds an MSc in environmental economics from the London School of Economics and Political Science.
Florence Waites is an economist at Vivid Economics, focusing on sustainable development in Africa. Prior to joining Vivid, she worked in the economic and social affairs department of the Trades Union Congress, where she focused on macroeconomic and labour market issues. She holds an MSc in economic policy from University College London and a BA in philosophy, politics and economics from the University of Oxford.

The Business Case for Investment in NutritionAbout the Authors
83 | Chatham House
Professor Tim G. Benton is director of the Energy, Environment and Resources Programme and research director for emerging risks at Chatham House. Tim’s areas of expertise include global food security, food systems and resilience, ecology and natural resources, and climate change impacts. He joined Chatham House in 2016 as a distinguished visiting fellow while also serving as dean of strategic research initiatives at the University of Leeds. He is an author of the Intergovernmental Panel on Climate Change’s special report on Climate Change and Land and the UK Climate Change Risk Assessment 2017, and has published more than 150 academic papers. Tim holds a PhD from the University of Cambridge and a BA from the University of Oxford, both in zoology.

84 | Chatham House
Acknowledgments
Many people have been instrumental in the development of this report. In particular, we would like to thank Ruth Quinn, Charlotte Watts, Richard King, Anna Aberg and Philippa Lockwood at Chatham House, and Rob Bailey (formerly at Chatham House). We also thank Isadora Ferreira (formerly at Chatham House) and Dr Kathrin Demmler (formerly at Imperial College London) for their help in early scoping for this work.
We are very grateful to our reviewers for their careful interrogation of the report: Dr Jess Fanzo (Johns Hopkins Global Food Ethics and Policy Program), Kimberley Neve (School of Health Sciences, City, University of London), Simon Pringle (Project Rome Ltd), Felix Preston (Generation Investment Management) and one blind reviewer.
Thank you to those who participated in the two stakeholder consultation workshops on ‘Making the Business Case for Nutrition’, held on 20 June 2019 and 28 January 2020, which helped generate and clarify ideas for the project, and to all the interview participants for kindly giving their time to take part in this research. We are also grateful to Natasha Maynard (IGD), Michael Healy (Nightingale Health) and Kathleen O’Driscoll (Business Group on Health) for their helpful insights.
The authors are grateful to Jake Statham for his meticulous and insightful editing of the report, and for overseeing the production process. Thanks also to Amy Barry, Oli Courtney and Jon Date for their valuable guidance and support with media outreach; to Nick Capeling, Gitika Bhardwaj, Thomas Farrar, Jessica Pow and Lisa Toremark for their help with the digital launch; and to Sarah Bunney and Autumn Forecast at Soapbox for their work on the design and production of the report.
Finally, our sincere thanks go to The Power of Nutrition and the Research Funders Network (Anglo American, Bayer, Equinor, Kellogg’s, Kirk Humanitarian, Medela, Olam, Otsuka, Royal DSM and Unilever) for their financial support of this research.

Independent thinking since 1920
The Royal Institute of International Affairs Chatham House 10 St James’s Square, London SW1Y 4LE T +44 (0)20 7957 5700 F +44 (0)20 7957 5710 [email protected] www.chathamhouse.org
Charity Registration Number: 2082239 781784 134044
ISBN 978-1-78413-404-4


