Page 1
J Ö N K Ö P I N G I N T E R N A T I O N A L B U S I N E S S S C H O O L JÖNKÖPING UNIVERSITY
Layered Basket Option Hedging
Currency risk management for multinational corporations
- Sandvik AB -
Master Thesis in Corporate Finance
Authors: Gustav Carlsson & Robin Ericsson
Tutors: Andreas Stephan & Louise Nordström
Jönköping May 2012
Page 2
i
Acknowledgement
This thesis would not have been possible without the guidance and help of several
individuals who in one way or another contributed and extended their valuable assistance
in the preparation and completion of this study.
First and foremost, we wish to express our gratitude to the personnel at Sandvik Financial
Services, and above all, to Thomas Hamberg for taking an interest in us and making this
study possible.
We would also like to thank our tutors Andreas Stephan and Louise Nordström, for giving
us support and guidelines throughout this thesis.
Last but not least, we want to offer our sincerest gratitude to our fellow students for all the
feedback received during this study.
Gustav Carlsson Robin Ericsson
Jönköping International Business School 2012
Page 3
ii
Abstract
Master Thesis within Business Administration
Title: Layered Basket Option Hedging Authors: Gustav Carlsson & Robin Ericsson Tutors: Andreas Stephan & Louise Nordström Date: Jönköping May 2012 Key words: Currency risk, Hedging, Options, Basket, Forwards, Diversification
Background: In an increasingly globalized environment, corporations perform
transactions across borders on a day-to-day basis. As multinational corporations expand
their businesses the number of currencies in their operations increases. The consequence of
operating with several currencies is the risk associated with currency fluctuations. Sandvik
AB is a worldwide corporation where activities are conducted through representation in
more than 130 countries. Currency exposures are controlled through risk management
where financial derivatives are applied to protect the corporation from potential losses
caused by fluctuations. Sandvik AB recently implemented a hedging strategy entitled
Layered Basket Option hedging. The strategy is a combination of a layered- and a basket option
approach to maximize the effect of the hedge. There is a limited amount of previous
research regarding Layered Basket Option hedging and Sandvik AB is the first corporation
to actively practice this strategy.
Purpose: The purpose is to investigate and provide information about how currency risk most effectively is
hedged for the multinational corporation Sandvik AB. Furthermore, we want to evaluate if Sandvik’s
recently implemented hedging strategy, Layered Basket Option hedging, is the best-suited strategy for them
and if there are any improvements to be made. This thesis will further investigate the importance of currency
hedging for multinational corporations, which are dependent on reporting to their stakeholders. Hopefully,
this thesis will also facilitate the communication of Sandvik’s currency strategies throughout the organization
and make it more comprehensible.
Method: Exchange rates on daily basis for the period 2002-2012 were collected from Bank
of Canada and Reuters database. The collected data was thereafter used as a basis to
perform calculations to determine if Layered Basket Option hedging is the optimal solution
for Sandvik AB.
Conclusion: The results of this study highlight the benefits from applying a Layered
Basket Option hedging strategy and the strategy succeeds to reduce the volatility caused by
currency fluctuation. The results indicate that the combination of a layered- and a basket
option approach successfully creates a suitable strategy for Sandvik AB.
Furthermore, this thesis has recognized that there exists room for improvement by actively
allocating currencies according to their weights and correlations to fully exploit the effects
from the strategy.
Page 4
iii
Definitions
Correlations A statistical measure determining how assets or currencies move together. Currency peg Refers to a fixed relationship between currencies
Derivatives Financial instruments used to hedge risks. Options and forwards are examples of derivatives.
Exotic option An option that differs from vanilla option in the form of underlying assets or payoff. A basket option is a form of exotic option.
Exposure Refers to the risks associated of operating with different currencies.
Layered hedging Hedges with the same expiry date are entered at regular intervals.
Risk free rate The rate of return with zero risk, where government bonds are an indication of the risk free rate.
Rolling hedging To continuously create hedges between regular intervals with different execution dates.
Spot rate The current price of an asset or currency
Strike price The price at which an instrument can be exercised.
Time to maturity The time until a financial contract expires.
Value at Risk (VaR) The magnitude of adverse outcomes that occur with a specified probability in a specific time interval.
Vanilla option Is a call or put option with standardized terms and no unusual features.
Weight The amount of a single currency in a basket proportionally to other currencies. The weight can both be positive and negative.
Page 5
iv
Table of Contents
1 Introduction ................................................................................. 1
1.1 Background............................................................................................... 1
1.2 Sandvik AB ............................................................................................... 2
1.3 Problem discussion .................................................................................... 3
1.4 Purpose .................................................................................................... 4
1.5 Research questions ..................................................................................... 4
1.6 Delimitations ............................................................................................. 4
2 Theoretical Framework................................................................. 5
2.1 Hedging currency risk ................................................................................. 5
2.2 Options .................................................................................................... 5
2.3 Black-Scholes ............................................................................................ 6
2.4 Basket options ........................................................................................... 7
2.5 Minimum variance portfolio (MVP) .............................................................. 8
2.6 Systematic & non-systematic risk .................................................................. 8
2.7 Layered hedging ......................................................................................... 9
2.7.1 Layered vs. Rolling ................................................................................... 10
2.8 Layered Basket Option Hedging ................................................................. 10
2.9 Forward contracts .................................................................................... 11
2.10 Alternative methods ................................................................................. 11
2.10.1 Value at Risk (VaR) .................................................................................. 12
2.10.2 Futures contracts ..................................................................................... 13
2.10.3 Currency swaps ....................................................................................... 13
3 Method ...................................................................................... 14
3.1 Research approach ................................................................................... 14
3.2 Research design ....................................................................................... 15
3.3 Secondary data ........................................................................................ 15
3.4 Primary data ............................................................................................ 16
3.5 Materials used in the financial analysis ......................................................... 17
3.6 Method for developing a financial analysis ................................................... 17
3.6.1 Correlation .............................................................................................. 18
3.6.2 Standard deviation ................................................................................... 18
3.6.3 Risk free rate ........................................................................................... 18
3.6.4 Weights .................................................................................................. 18
3.6.5 Minimum variance Portfolio ...................................................................... 19
3.6.6 Black-Scholes .......................................................................................... 20
3.7 Assumptions ........................................................................................... 20
3.8 The layered hedging approach .................................................................... 21
3.9 The effects of applying a basket ................................................................. 21
3.10 Alternative hedging strategies ..................................................................... 22
3.11 Improved baskets..................................................................................... 22
3.12 Manipulation of variables to realize the actual effect of changes ...................... 22
3.13 Criticism of theories and models ................................................................ 23
3.14 Reliability and validity ............................................................................... 24
Page 6
v
4 Empirical Findings .................................................................... 25
4.1 Sandvik’s hedging purposes ....................................................................... 25
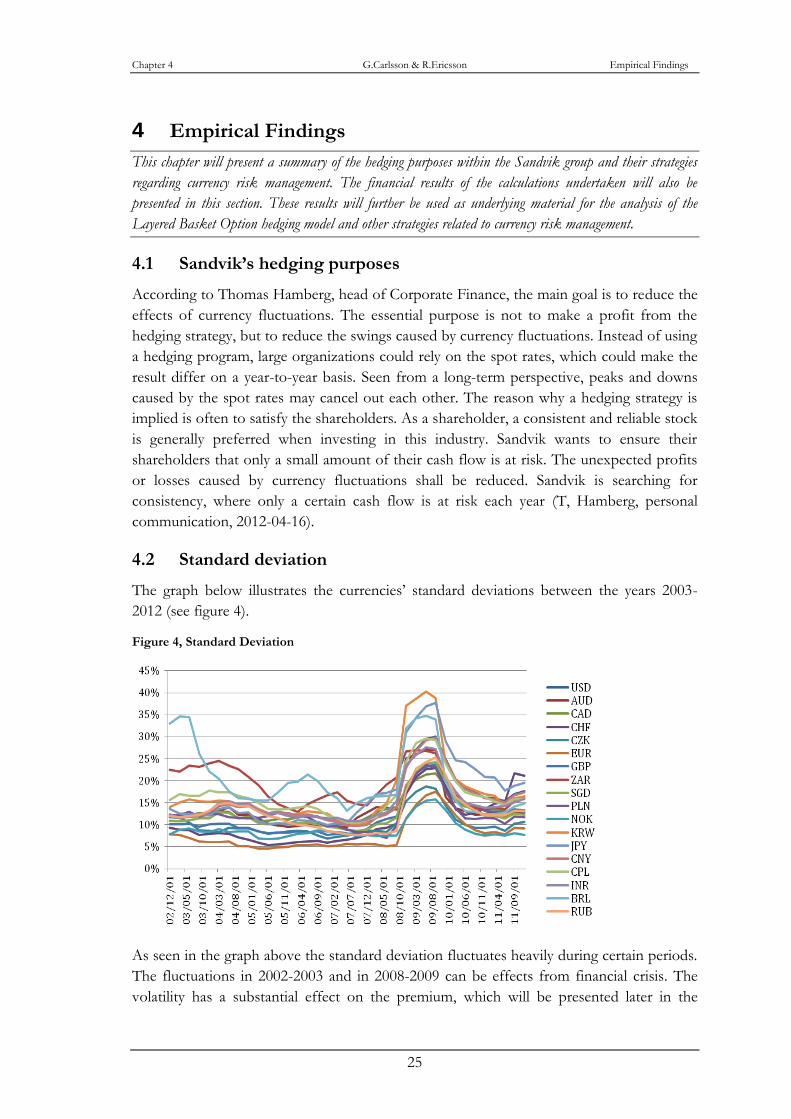
4.2 Standard deviation ................................................................................... 25
4.3 The MVP approach .................................................................................. 26
4.4 The premium using Black-Scholes .............................................................. 26
4.5 The total result of the hedging strategies ...................................................... 27
4.6 The results of the Layered Basket Option .................................................... 29
4.7 The results of the Layered Forward ............................................................ 30
4.8 Manipulated baskets ................................................................................. 30
4.9 The effects of applying a basket ................................................................. 31
4.10 Improved baskets – Divided Layered Basket .................................................... 31
5 Analysis ..................................................................................... 34
5.1 Incentives to hedge .................................................................................. 34
5.2 The Layered approach .............................................................................. 34
5.3 The Basket approach ................................................................................ 35
5.4 The Layered Forward approach ................................................................. 36
5.5 The Layered Basket Option approach ......................................................... 37
5.6 Improvements ......................................................................................... 39
6 Concluding Remarks .................................................................. 41
6.1 Conclusions ............................................................................................ 41
6.2 Discussion and further studies ................................................................... 42
7 List of References ....................................................................... 43
8 Appendices ................................................................................ 47
8.1 Appendix 1-10 Basket Variance, Weights and Premiums 2003-2012 ................ 47
8.2 Appendix 11-20 – Correlation 2003-2012 .................................................... 57
8.3 Appendix 21-22 – Improvements, 2011 Q4 ................................................. 67
Page 7
vi
List of figures
Figure 1, Black-Scholes Diagram .................................................................................................... 7 Figure 2, Layered hedging .............................................................................................................. 10 Figure 3, Rolling hedging ................................................................................................................ 10 Figure 4, Standard Deviation ......................................................................................................... 25 Figure 5, Basket Standard Deviation ............................................................................................ 26 Figure 6, Premium ........................................................................................................................... 27 Figure 7, Result from hedging strategies ...................................................................................... 29 Figure 8, Layered Basket Option vs. Spot Rate .......................................................................... 29 Figure 9, Layered Forward vs. Spot Rate ..................................................................................... 30 Figure 10, Layered Forward ........................................................................................................... 37 Figure 11, Layered Forward vs. Layered Basket ......................................................................... 38
List of tables
Table 1, Johnson & Lidbark, Diversification effect ..................................................................... 8 Table 2, Basket of currencies ......................................................................................................... 17 Table 3, Result from hedging strategies ....................................................................................... 28 Table 4, Manipulated Baskets ........................................................................................................ 30 Table 5, Diversification improvements ........................................................................................ 31 Table 6, Improved baskets ............................................................................................................. 32 Table 7, Improved baskets ............................................................................................................. 33 Table 8, Outcome of strategies ...................................................................................................... 34 Table 9, Diversification 2003 Q3 & 2011 Q3 ............................................................................. 35 Table 10, Spot vs. Layered Basket Option ................................................................................... 38 Table 11, Premium reduction ........................................................................................................ 40 Table 12, Reduction in diversification effect ............................................................................... 40 .
Page 8
Chapter 1 G.Carlsson & R.Ericsson Introduction
1
1 Introduction
This first chapter will introduce the concept to risk management in a global market. It will further be
narrowed down to the problem that the Swedish multinational enterprise, Sandvik AB, is facing and the
model developed to solve this.
The world has accelerated towards a more globalized environment during recent decades.
Cities have transformed from success to failure, where corporations move production from
its origin to areas with cheaper labour and production (Schifferes, 2007). Simultaneously,
restrictions are shifting in more beneficial directions for global businesses. Tolls, quotas
and transportation costs are being reduced, making it cheaper to import and export (Reiter
& Jönsson, 2002). However, the financial volatility is increasing around the world, where
countries such as Greece, Portugal and Ireland are all jeopardous markets for businesses to
enter (Barth, Li, & Prabgavivadhana, 2011). The financial volatility is resulting in fluctuating
currencies, which make transactions between countries a vital phase (IMF, 2011). The risk
of being a multinational corporation is growing and hedging becomes increasingly
fundamental for border-crossing organizations (Lind, Polak, & Robertson, 2011).
Foreign currency management is a crucial procedure for corporations that act on the global
market. An organization needs to discover and analyze their foreign exchange exposure.
Exposure means, that some segment of the organization is affected by exchange rate
fluctuations. The risk connected to exchange rate exposure depends on the potential degree
of fluctuations in the currencies. Therefore, currency risks increase proportionally with the
volatility in the foreign exchange rates. Due to the massive volume of currency constantly
changing hands over a single global market the volatility has increased dramatically the
recent years. Unpredictable rate changes may have an unfavorable effect on multinational
corporations return and can be seen as the “cost of going offshore”. The cost of going
offshore is a cost that a multinational corporation, such as Sandvik should minimize in
order to be a competitive player on the global market. To hedge risk and decrease the
volatility in the currency exchange rates is a strategy that should be considered by financial
managers. Sandvik’s currency exposure is created because of the absence of predictability in
the foreign exchange market (Shoup, 1998).
1.1 Background
The introduction of the Bretton-Woods system was the beginning for structured
relationships between currencies. The world economy needed structure after World War II,
and the Bretton-Woods agreement included guidelines and restrictions to help recompose
the economy. The fundamental idea was to implement a fixed exchange-rate system, which
was an important step for the currency market. After the Bretton-Woods was depleted in
1973, some minor phases passed before a floating system was introduced in the early 1990s
(Reiter & Jönsson, 2002).
A floating exchange-rate system naturally leads to new risks for corporations. Multinational
corporations face the risk of potential losses caused by currency fluctuations. There are
Page 9
Chapter 1 G.Carlsson & R.Ericsson Introduction
2
several incentives in why organizations such as Sandvik AB need to implement a hedging
strategy. The fundamental reason is to avoid additional losses because of currency
fluctuations. In the last 20 years, financial derivatives have become an everyday routine
(Brown & Toft, 2002). There is a wide range of hedging instruments, where each
instrument has its own functions but similar purposes (Mahul, 2001).
The reason why Sandvik AB would apply hedging instruments is not only to avoid losses
caused by unanticipated fluctuations, but also to satisfy their shareholders. An aggressive
hedging strategy that is implemented solely to generate profits is more risky in comparison
to other strategies. If large exposures are hedged completely through options, it will
automatically result in large premiums. A hedging strategy is applied to eliminate the effects
of currency fluctuations. That is, to neither make a profit or loss, but to aim at a precise
and foreseeable result. Sandvik’s goal is to satisfy all stakeholders, where a strategy that
meets the corporate’s and the shareholders’ expectations should be implemented (T,
Hamberg, personal communication, 2012-01-12).
1.2 Sandvik AB
Sandvik was founded in Sandviken, Sweden, when Göran Göransson was the first in
history to use a Bessemer process in steel production (Sandvik AB, 2012). A Bessemer
process is an inexpensive process for mass-production of steel from molten pig iron (Wolf,
2001). Sandvik is active in 130 countries and have a total of 50.000 employees with a
turnover of approximately 100 billion SEK. They are a high-technology engineering group
divided into five different business areas, Sandvik Mining, Sandvik Machining Solutions,
Sandvik Materials Technology, Sandvik Construction and Sandvik Venture (Sandvik AB,
2011).
Sandvik possess an exclusive potential of knowledge within materials technology and
provide their customers with expertise about work processes. They always strive to become
market leaders within the areas they operate in. The world is their market and transactions
across borders occur constantly (Sandvik AB, 2011). Customers are given the option to pay
in their own currency and that leads to currency exposures. Sandvik is exposed in several
currencies, where their exposure depends on the distribution between production and sales.
In present time, Sandvik AB has 10-15 billion SEK exposed to currency risks and they only
hedge a part of this outstanding exposure. Their goal is not solely to make a profit, but to
reduce the volatility. The goal is to aim at an accurate result, with no unexpected outcomes.
The CEO should not have to explain to the shareholders why a result suddenly differs
from the predicted (T, Hamberg, personal communication, 2012-01-12).
Layered Basket Options is a hedging strategy developed by the CitiFX Corporate Solutions
Group (CSG), a bank with a global perspective where Sandvik AB is the optimal customer
to implement this strategy. Because of Sandvik’s diversified foreign exchange portfolio they
demand a hedging strategy that reduces the volatility in their currency exposure but at the
same time is flexible enough to take advantage of potential positive movements in their
exposed currencies. The Layered Basket Option hedging model is according to CSG said to
Page 10
Chapter 1 G.Carlsson & R.Ericsson Introduction
3
be the best solution to meet these requirements. The Layered Basket Option hedging
strategy is a combination of a layered and a basket option approach. The layered approach
divides larger hedges into several smaller hedges with different expiration dates to
smoothen the fluctuations. Instead of applying a static hedge where there is only one
expiration date, the multiple expiration dates allows for peaks and downs to cancel out each
other to further reduce the volatility. The basket option approach takes advantage of the
imperfect correlations. By hedging all currencies through a basket option a diversification
effect is created. These two approaches combined create the Layered Basket Option
hedging (Johnson & Lidbark, 2009).
1.3 Problem discussion
Sandvik AB is exposed to currency risks and risk management strategies are applied to
control the risks. The currency exposure increases as the corporation continues to grow
and the risks associated with currency exposures have a larger impact on the result.
According to Thomas Hamberg, Head of Corporate Finance, the intention of applying a
hedging strategy is not only to avoid losses and maximize the profit. Sandvik AB relies on
their investors and it is of importance to satisfy the shareholders demands. Therefore, to
find and implement a hedging strategy that eliminates the effects from currency
fluctuations is desired. Sandvik AB aims to apply hedging instruments to reach a
foreseeable result, where currency movements do not generate unexpected outcomes.
There is a limited amount of previous research regarding Layered Basket Option hedging.
The strategy was recently developed and Sandvik AB was the first corporation to fully
implement the strategy. This results in obscurities in how Layered Basket Option hedging
stands in relation to other hedging instruments and how effective the strategy is. We strive
to clarify the concept and make it more comprehensible to Sandvik AB and the reader. The
model involves complexity, both in a mathematical and a practical way. The combination
of a layered- and basket option approach needs to be explained in a pedagogical and
detailed procedure to demonstrate why Layered Basket Option hedging is a suitable
strategy for Sandvik AB. The lack of previous studies makes it difficult to determine the
prime approach in how to perform the premium calculations. Therefore, the chosen
mathematical approach needs to be carefully studied to attain an accurate result.
The rising demand for suitable hedging strategies will lead to an investigation to conclude if
a Layered Basket Option hedging strategy is an interesting and suitable approach for
multination corporations and Sandvik AB.
Page 11
Chapter 1 G.Carlsson & R.Ericsson Introduction
4
1.4 Purpose
The purpose is to investigate and provide information about how currency risk most
effectively is hedged for the multinational corporation Sandvik AB. Furthermore, we want
to evaluate if Sandvik’s recently implemented hedging strategy, Layered Basket Option
hedging, is the best-suited strategy for them and if there are any improvements to be made.
This thesis will further investigate the importance of currency hedging for multinational
corporations, which are dependent on reporting to their stakeholders. Hopefully, this thesis
will also facilitate the communication of Sandvik’s currency strategies throughout the
organization and make it more comprehensible.
1.5 Research questions
The problem with currency risk exposure has been recognized in Sandvik AB and has
provided us with three relevant questions to be investigated in this thesis.
- Is Layered Basket Option Hedging the optimal hedging strategy for Sandvik AB?
- How will other hedging strategies affect Sandvik’s currency risk management?
- Is there a superior strategy for hedging currency risk exposure?
1.6 Delimitations
A comprehensive understanding about currency risk management for multinational
corporations is essential to present a relevant result about the investigated hedging model.
There exist many hedging strategies within the currency risk management framework. We
have decided to investigate and focus on the most common strategies and also those
strategies that are relevant according to the goals and ambitions for the Sandvik
Corporation. Furthermore, the Layered Basket Option hedging model had to be broken
down into two parts, the layered approach and the basket option strategy, and investigated
separately to later be merged in our calculations. The effectiveness of the hedge will be
evaluated and compared with other strategies to obtain conclusions regarding if there are
improvements to be made for Sandvik’s present currency risk management.
When evaluating the investigated hedging strategy several approaches may be conducted.
Approaches such as a Monte Carlo simulation had to be discarded due to its complexity
and others strategies was rejected early due to the fact that Sandvik is exposed to negative
weights. We choose to evaluate the strategies through a portfolio theory since several
underlying currencies are investigated and transparency is fundamental for the
communication within the organization.
Page 12
Chapter 2 G.Carlsson & R.Ericsson Theoretical Framework
5
2 Theoretical Framework
This chapter will present and explain the necessary theories and models to answer the different problems
associated with currency risk management. Further this chapter will provide the reader with sufficient
material to understand the concepts and how the problems at hand may be solved.
2.1 Hedging currency risk
Techniques for hedging currency risk involve the use of different financial derivatives,
which protect corporations from the fluctuations in the foreign exchange rates. Some of
the most widely used derivatives or techniques if organizations do not want to trade at a
spot rate, is forward contracts, futures contracts, options and currency swaps (Jorion,
2005).
2.2 Options
Options are securities that give the holder right to exchange an asset against a decided
premium. An option is a right to either buy (call option) or sell an asset (put option). It is
also subject to several conditions, which span over a specified period of time. The
underlying asset of an option is often common stocks but could be any kind of assets such
as currencies or commodities (Black & Scholes, 1973). There are several subcategories
linked to the concept of options. Firstly the financial instrument is divided into vanilla
options (or standard options) and exotic options. Vanilla options are the most common type of
options. The holder of a vanilla option owns the right to buy or sell an underlying asset for
a certain price called exercise- or strike price. The exercise of this right must occur within a
pre-determined time called time to maturity or time to expiration. The conditions connected to
this expiration time would further divide vanilla options into different kinds of options. A
European option allows the holder to only exercise the right at the maturity date. Contrary
to the European, the American option implies that the holder owns the right to exercise
this security at any moment within the time to maturity (Zhang, 1995).
According to Zhang (1995), exotic options are a direct or indirect extension of vanilla
options. If vanilla options are categorized as the first generation of options, exotic options
could be seen as the second generation. An exotic option is a non-standard option that
differs in some aspect from the vanilla option. There are different kinds of exotic options
but if it differs in at least one aspect from the rules of a vanilla option, it should be
categorized as an exotic option. One example of an exotic option that will be further
investigated is the basket option. Options may further be categorized in terms of
“moneyness”. An option could, depending on its strike and spot price, either be “at the
money” (ATM), “out of the money” (OTM) or “in the money” (ITM). When a put option
is ITM it refers to the spot price being below the strike price and the option in this case has
an intrinsic or time value. Contrary, the put option is OTM when the spot price is above
the strike price and the value of the option is subsequently equal to nothing. A put option
that is ATM has only a time value and no intrinsic value, since the strike price is equal to
the spot price (Bakshi, Cao, & Chen, 1997).
Page 13
Chapter 2 G.Carlsson & R.Ericsson Theoretical Framework
6
Hedging currency risk through put options is commenced when the risk encountered is a
downward trend in the investigated currency. An example would be if a corporation wants
to secure a certain currency from a downward trend but at the same time earn money if the
currency increases in value. The corporation wants to secure an amount of USD to the
SEK, it may then buy the right to sell the USD for a certain amount in SEK depending on
the current exchange rate. This would be equal to buy an ATM-put option where the
corporation hedge the risk from a weakening in the USD in comparison to the SEK but it
will still benefit from a strengthening in the USD. This advantageous opportunity however,
does come at cost; a premium has to be paid which is the risk a buyer of the put option has
to consider (Wong, 2003).
2.3 Black-Scholes
There are several methods for valuating options, where one of the most widely used is the
model developed by Fischer Black and Myron Scholes.
There are many factors that influence the price of an option, where the value of the
underlying asset is an important factor that determines the price. If the price of the asset
were much lower than the exercise price of a call option, the value of that option would be
close to nothing. However, if the price of the underlying asset were much higher than the
exercise price the value of that call option would automatically be high. The time to
maturity of the option is a crucial determinant for the value of the option, since the
forecasting and probability that the desired strike price would be fulfilled changes as the
maturity date approaches. Normally the value of the option declines as the maturity date
approaches. Fluctuations and volatility influence the risk that the different parties take on
and therefore also affect the valuation of the option (Black & Scholes, 1973).
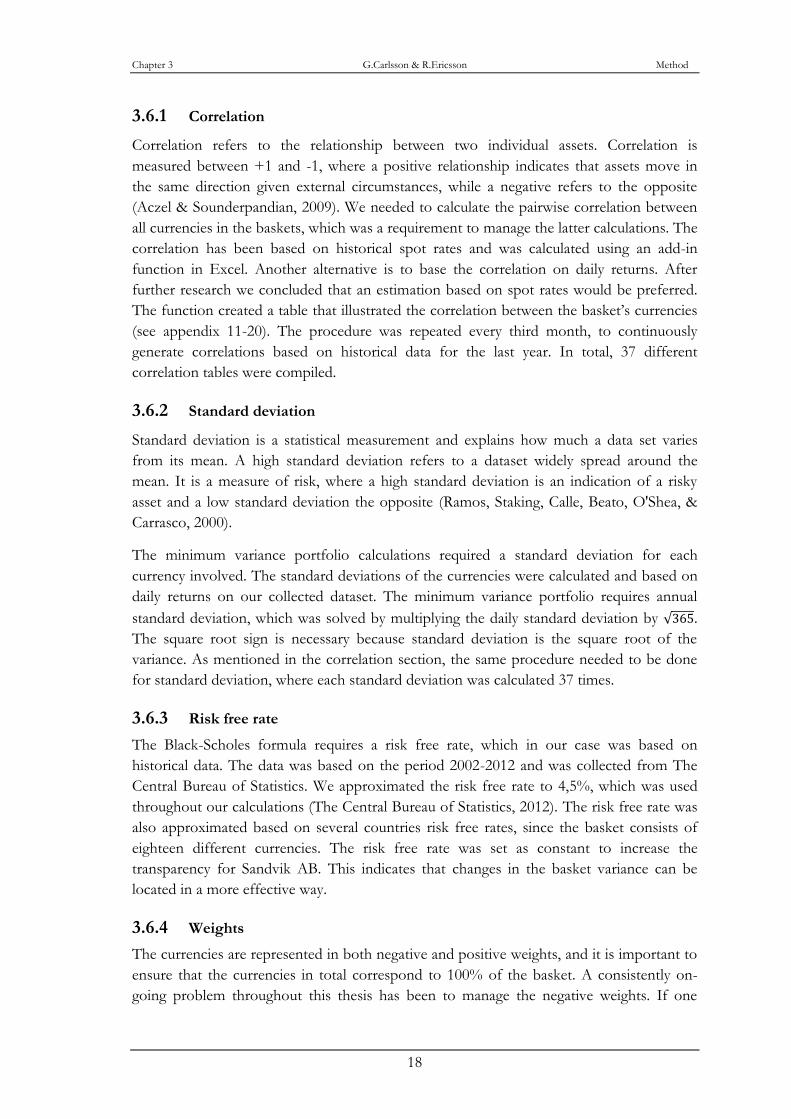
A diagram illustrated by Black and Scholes (1973) (see figure 1) shows the properties
between the call option’s value and the underlying asset price (i.e. stock price). Line A
represents the maximum value of the option with an exercise price of $20, this because the
value of an option cannot exceed the stock price. Line B represents the minimum value
since the option value cannot be negative or smaller than the stock price minus the exercise
price. The remaining lines, T1, T2 and T3 symbolize the value of the option for successively
shorter time to maturity. Notice that the value of the option is more volatile than the stock
price since it is concave upward sloping. This proves that the closer to the maturity date,
the percentage change in the option value is larger than the change in the stock price (Black
& Scholes, 1973).
Page 14
Chapter 2 G.Carlsson & R.Ericsson Theoretical Framework
7
Figure 1, Black-Scholes Diagram
The mathematical approach of this formula, where the necessary variables are included will
be presented in the next chapter together with the methodological approach.
2.4 Basket options
The value of a basket option depends on the average value of the underlying assets over a
specific period (Turnball and Wakemann, 1991). The basket consists of different weights
of each currency depending on the distribution of exposure between the currencies
(Johnson & Lidbark, 2009). The overall cost is normally lower if currencies are hedged
through a basket option compared to individual vanilla options. The reduction is explained
by imperfect correlation between currencies (Hakala and Wystrup, 2008). It implies that
currencies react differently given external circumstances (Madan, 2009). An example is if
oil-prices are rising, currencies can respond differently, where some currencies increase and
others decrease in value. By including currencies that behave differently, it is possible to
reduce the risks and thereafter the premium.
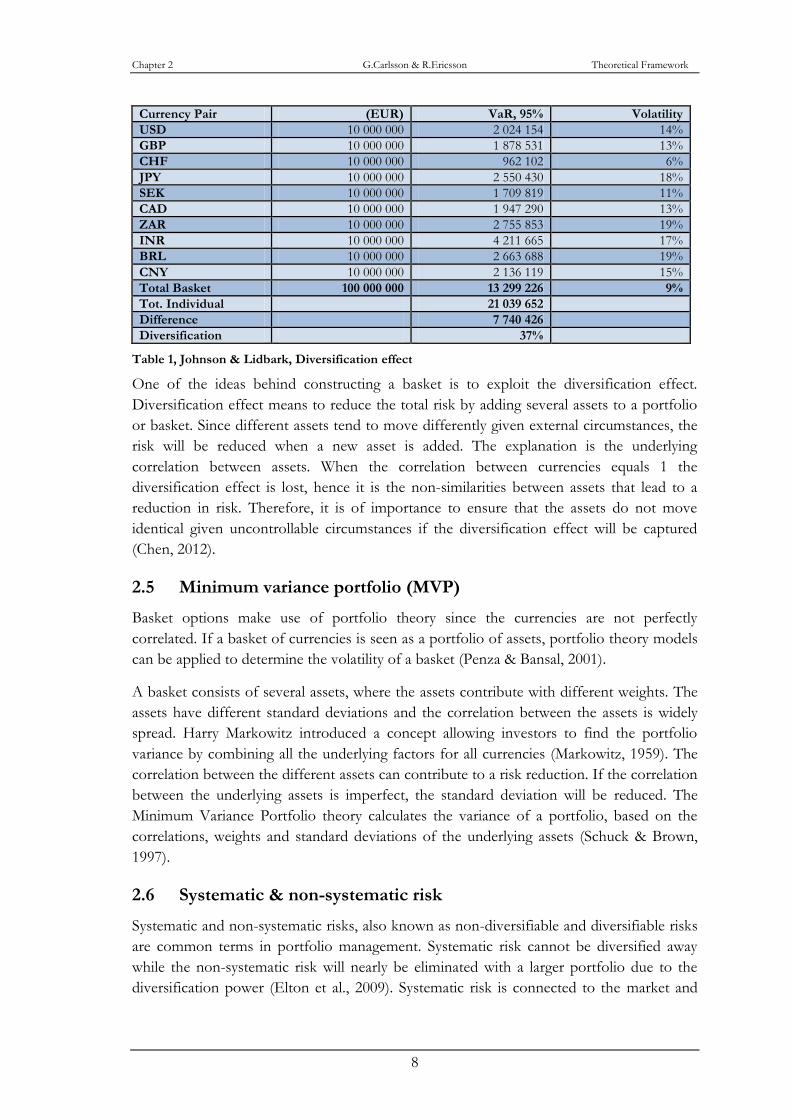
As illustrated by Johnson and Lidbark (2009), the diversification effect reduces the volatility
for the basket in comparison to the individually hedged vanilla options (see table 1). The
exposed amounts are shown in the second column, while the third column illustrates the
amount exposed to risks in relation to regular market movements. The last column displays
the individual volatility for each currency. When the basket’s total value-at-risk is compared
to the total value-at-risk of the individually hedged currencies there is an improvement by
37%. It is explained by the reduction in volatility, where the average volatility between the
currencies equals 14% and the basket’s volatility equals 9%.
Stock Price
Option Price
Page 15
Chapter 2 G.Carlsson & R.Ericsson Theoretical Framework
8
Currency Pair (EUR) VaR, 95% Volatility
USD 10 000 000 2 024 154 14%
GBP 10 000 000 1 878 531 13%
CHF 10 000 000 962 102 6%
JPY 10 000 000 2 550 430 18%
SEK 10 000 000 1 709 819 11%
CAD 10 000 000 1 947 290 13%
ZAR 10 000 000 2 755 853 19%
INR 10 000 000 4 211 665 17%
BRL 10 000 000 2 663 688 19%
CNY 10 000 000 2 136 119 15%
Total Basket 100 000 000 13 299 226 9%
Tot. Individual 21 039 652
Difference 7 740 426
Diversification 37%
Table 1, Johnson & Lidbark, Diversification effect
One of the ideas behind constructing a basket is to exploit the diversification effect.
Diversification effect means to reduce the total risk by adding several assets to a portfolio
or basket. Since different assets tend to move differently given external circumstances, the
risk will be reduced when a new asset is added. The explanation is the underlying
correlation between assets. When the correlation between currencies equals 1 the
diversification effect is lost, hence it is the non-similarities between assets that lead to a
reduction in risk. Therefore, it is of importance to ensure that the assets do not move
identical given uncontrollable circumstances if the diversification effect will be captured
(Chen, 2012).
2.5 Minimum variance portfolio (MVP)
Basket options make use of portfolio theory since the currencies are not perfectly
correlated. If a basket of currencies is seen as a portfolio of assets, portfolio theory models
can be applied to determine the volatility of a basket (Penza & Bansal, 2001).
A basket consists of several assets, where the assets contribute with different weights. The
assets have different standard deviations and the correlation between the assets is widely
spread. Harry Markowitz introduced a concept allowing investors to find the portfolio
variance by combining all the underlying factors for all currencies (Markowitz, 1959). The
correlation between the different assets can contribute to a risk reduction. If the correlation
between the underlying assets is imperfect, the standard deviation will be reduced. The
Minimum Variance Portfolio theory calculates the variance of a portfolio, based on the
correlations, weights and standard deviations of the underlying assets (Schuck & Brown,
1997).
2.6 Systematic & non-systematic risk
Systematic and non-systematic risks, also known as non-diversifiable and diversifiable risks
are common terms in portfolio management. Systematic risk cannot be diversified away
while the non-systematic risk will nearly be eliminated with a larger portfolio due to the
diversification power (Elton et al., 2009). Systematic risk is connected to the market and
Page 16
Chapter 2 G.Carlsson & R.Ericsson Theoretical Framework
9
examples that correspond to this type of risks could be wars, inflations and other
uncontrollable fluctuations in the market (Balvers, 2001).
A mathematical explanation of systematic and non-systematic risk may be derived if we
look at the formula representing the risk of a portfolio presented by Elton et al. (2009)
where N represent the number of underlying assets in the portfolio:
(∑
) (1)
The non-diversifiable systematic risk is denoted by
which entails that it is not related
to the number of assets N and will not change since is constant. According to the
formula above, it is shown that the non-systematic risk ( ) will approach to zero as N
goes to infinity (Elton et al., 2009).
2.7 Layered hedging
According to Hirigoyen (2003) a key concern for multinational corporations, which depend
on reporting stable currency results, is to manage their foreign exchange risks. Extending
and layering the hedge horizon to reduce the problem of forecasting accuracy several years
ahead should solve the problem.
Companies’ goal is to reduce their year-on-year currency impact on their result due to the
volatility in the exchange rates. This goal is not best reached with static hedging programs
since a static hedge one year, is totally isolated from the following year. The most
important aspect to achieve this goal is to discover the link between the aim of the
corporation’s risk management and the layout of the hedging strategy. When the link has
been detected, the best strategy to reduce the year-on-year volatility in exchange rate is, as
mentioned before, to create longer hedging tenors. Forecasting errors and opportunity
costs should be taken into consideration when extending the tenors since these kinds of
negative outcomes tend to increase with a longer time horizon (Lidbark, 2006). A good
strategy to implement when dealing with forecasting accuracy in a long tenor is to layer the
hedge with several intervals to make room for adjustments along the period (Hirigoyen,
2003).
With a layered hedging program, hedges with the same expiry date are entered at regular
intervals. In the model below (see figure 2), 25% of the exposure of the four upcoming
quarters is hedged every quarter. With this strategy the hedging rate becomes an average of
the previous tenors. In the example given, a moving average of hedging rates becomes
available for four previous quarters. The year-on-year changes in the hedging rates are
connected to the created moving average. Due to this connection the layered strategy
creates smaller year-on-year changes compared to the volatility created by a spot strategy.
Hedging with a layered program is rather used as an averaging tool than a delaying one,
which is the result of several other hedging programs and strategies (Johnson & Lidbark,
2009).
Page 17
Chapter 2 G.Carlsson & R.Ericsson Theoretical Framework
10
Figure 2, Layered hedging
2.7.1 Layered vs. Rolling
In a rolling hedging program the hedges are entered at regular intervals but with different
execution dates (see figure 3). This would generate the hedging rate of year-on-year
changes to be driven by the spot rate. The rolling hedging strategy would delay the
outcome of the hedge and push either the positive or negative effect further in the future
(Johnson & Lidbark, 2009).
Figure 3, Rolling hedging
According to Johnson and Lidbark (2009) the layered hedging program is far more
attractive than the rolling program if options are used as the hedging tool. This comes from
the perspective of premium spending, since the average tenor for a regular 12-month
rolling hedging program is 12 months, whereas the average tenor for a 12-month quarterly
layered program is ((3+6+9+12)/4) 7.5 months. As mentioned before, the value of the
options will decline as the maturity date approaches. When the value declines the price of
the option must decline as well and the shorter average tenor will result in a lower premium
(Black & Scholes, 1973).
2.8 Layered Basket Option Hedging
Sandvik and Citibank have developed a hedging model called Layered Basket Option hedging.
The model is built on the concept of regularly buying options, which gives the right to sell
a basket of currencies that reflects the corporate group’s currency exposure. The strategy
implies that they combine two independent hedging models, the layered hedging procedure
and the basket option approach, that both reduce the volatility and decrease the premium
payments. The layered program possesses much more desirable risk characteristics as they
reduce the year-on-year changes in effective hedging rates by spreading out execution over
Page 18
Chapter 2 G.Carlsson & R.Ericsson Theoretical Framework
11
time and creating an averaging process. The volatility may be further reduced due to basket
hedging. Instead of hedging each individual currency, a basket of several currencies is
applied. This creates diversification power, due to correlations between currencies
(Johnson & Lidbark, 2009).
Sandvik AB computes the exposure in foreign currency that they have realized in the past
12 months. The total sum of the different foreign currency exposures from the underlying
companies all over the world is put together in one single basket. This basket contains of
18 different currencies with diverse amounts depending on the operations undertaken in
that certain country. Sandvik is, either in a short or long position in a local currency, which
implies that the basket will contain negative exposures in some currencies. The subsequent
valuation process will result in a price for an ATM-basket put option of the underlying
currencies with respectively three, six, nine and twelve months to maturity. This gives
Sandvik an opportunity of negotiation and will make a closure with the bank that offers the
lowest premiums (T, Hamberg, personal communication, 2012-01-12).
2.9 Forward contracts
A forward contract is a simple and efficient financial derivative applied to protect a
corporation from currency fluctuations. A forward is an agreement between two parts, that
is to either sell or buy an asset at a specific date in the future for a predetermined price. The
two parties in the contract are presented by either two financial institutes or between a
client and a financial institute. The parties take either a long or short position, which
implies that the party that is going long agrees to buy the underlying asset for a certain
price in the future. The other party will take a short position and is obligated to sell the
underlying asset for the predetermined price on the agreed date in the future. This indicates
that the two parts have different beliefs in the market they operate in or that at least one
party is eager to hedge the risk of fluctuations in the underlying asset price. Since the
forward contract is binding and there is no premium involved, the possible payout
defaulted or received will represent the value or cost of this contract. This also implies that
there is always one winner and one loser in this binding commitment (Hull, 2012).
According to Hull (2012) forward contracts can be used to hedge foreign currency risk.
Assume that a corporation that is active on the global market wants to report its result in
their domestic currency and wants to convert a basket of foreign currency to the domestic.
The corporation may then take a short position in a forward contract and be safe from
exchange fluctuations and sell the basket at a predetermined price for a sum in its domestic
currency. This hedge is effective in terms of protecting a corporation from drops in foreign
exchange rates but it will lose the opportunities from a strengthening in the foreign
currency.
2.10 Alternative methods
Derivatives that may be used as a hedging tool but does not correspond to Sandvik’s
hedging strategies will still enlighten the overall understanding of currency risk
management. Furthermore, alternative valuation processes should be taken into
Page 19
Chapter 2 G.Carlsson & R.Ericsson Theoretical Framework
12
consideration when valuating derivatives and performing an active currency risk
management within a corporation.
2.10.1 Value at Risk (VaR)
Value at risk is a version of the safety-first rules, where focus is concentrated on the size of
adverse outcomes that occur with a specified probability in a specific time interval (Elton,
Gruber, Brown, & Goetzmann, 2009). VaR measures the loss caused by regular market
movements and losses beyond the “value at risk” only occur with a particular probability.
Compared to other statistical risk-measuring concepts, the model generates a transparent
result and increasing the general understanding and communication within organizations. It
is an appropriate measurement for larger business, allowing members of the board to
understand and realize the organizations risk exposures. Assume there is an asset with a
VaR of 1000 SEK at a 95% confidence level. It implies that there is a 95% probability that
the possible losses will not exceed 1000 SEK. Then there is only a 5% chance that the asset
will drop more than 1000 SEK. The 95% confidence represents the normal movements in
the market and the remaining 5% represents abnormal movements (Hopper, 1996). Value
at risk is basically the value or price of a derivative, for example the value of a basket
option.
There are three different approaches to Value at Risk, the Historical, Variance-Covariance and
the Monte Carlo approach. The historical approach is based on historical changes in market-
rates and prices. The data is then used to predict future outcomes to anticipate the value at
risk as the loss exceeds a certain percentage (1, 5 or 10%) (Linsmeier & Pearson, 1996).
The Variance-Covariance approach assumes that returns are normally distributed around a
mean return of zero. There are only two factors applied when calculating Variance-
Covariance method, the estimated standard deviation and the cut-off factor in the left tail
of the distribution. These factors are then used to predict future outcomes based on today’s
data (Hopper, 1996).
The Monte Carlo approach is a parametric method, which generates random changes in
risk factors from estimated parametric distribution. The process is divided into two
different steps. The first step involves a parametric stochastic process for all risk factors. It
means that factors such as standard deviation can be derived from historical data. The
second step is based on the first step, where random price paths are simulated from the
different risk factors (Jorion, 2007). The simulated processes are realized using a
pseudorandom generator, which is an instrument, built on an algorithm that generates
possible outcomes. The Monte Carlo process is relatively similar to the historical process,
but does not base future outcomes on sampled historical data (Linsmeier & Pearson, 1996).
Since a basket option can involve many variables, a Monte Carlo simulation gives the most
accurate result because of the number of possible outcomes generated from the process
(Hakala & Wystrup, 2002). The disadvantage is that a Monte Carlo simulation is time-
consuming (Hull, 2012). Assume there are ten different currencies in a basket. Then there
are different risk factors connected to each individual currency and some currencies are
affected by changes in one another A Monte Carlo approach randomly creates different
Page 20
Chapter 2 G.Carlsson & R.Ericsson Theoretical Framework
13
price paths, allowing a business to realize the value-at-risk. The Monte Carlo approach is
superior to other methods because of its flexibility and the ability to take a wide range of
risks into account (Jorion, 2007).
2.10.2 Futures contracts
Similar to the forward contract, a futures contract is an arrangement between two parties to
sell or buy an asset at a certain price at a predetermined time in the future. Any of the two
parties does not necessarily have to be represented by a financial institute and unlike
forward contracts the futures contracts are normally traded on an open exchange market.
The underlying asset of a future includes a wide range of commodities and financial assets,
where the financial asset includes Treasury bonds, stock indices and currencies. The price
of a futures contract is determined by the laws of supply and demand and the exchange
market provides mechanisms which ensure that the contract will be honored (Hull, 2003).
2.10.3 Currency swaps
Currency swaps are agreements between two parties to exchange one currency for another
at a specific date. For the swap to be justified, a price is paid that corresponds to the
difference in interest rates between the two currencies. The main purpose with currency
swaps is to minimize currency exposures. Assume there is an exporting business that needs
10 million USD to make a payment today and they do not have any USD in their account.
At the same time, they are expecting a payment of 10 million USD in three months. The
business needs USD today, but they want to avoid exchanging money at two different
occasions. The business then makes a currency swap, where they buy USD at the current
rate and at the same time sells USD to be delivered in three months. This is done to avoid
exchanging twice and to minimize the risk exposure (Shoup, 1998).
Page 21
Chapter 3 G.Carlsson & R.Ericsson Method
14
3 Method
The following chapter will explain and examine the different methods applied in this thesis. We will further
discuss and motivate the applied methods and provide the reader with insight into the research, as well as a
credibility assessment.
3.1 Research approach
The purpose of this thesis is to evaluate a new hedging model for currency risk
management in the multinational corporation Sandvik AB. Theories and models developed
solely for this purpose had to be investigated. A key factor was to discover a relationship
between the reality, which is the possible outcome of the hedge, and the existing theories
for valuing the undertaken hedging methods. The reason to hedge currency risk is to
protect the exposure in the foreign currency from negative fluctuations. By collecting daily
historical data from several currencies, the hedging results may be investigated from
different hedging models and theories. Personal contact with personnel at Sandvik
Financial services was necessary to conduct reliable and relevant research within this
specific subject.
Patel and Davidson (2003) states that the most central problem for a scientific research is
to identify and connect theory to reality. Three key concepts when dealing with this
problem are deduction, induction and abduction. The deductive approach allows a researcher to
draw conclusions and obtain results through already proven existing theories. An inductive
approach implies that the researcher formulates a theory based on the data collected and
the analysis received from it. A combination of these two approaches would be the
abduction approach. Two other expressions within business research are quantitative and
qualitative and are used to distinguish different data analysis processes and data collection
techniques. A qualitative approach implies that the techniques and analysis of the data and
procedure is based on, or generates non-numerical data. A quantitative approach could be
used as a synonym for data collection techniques and analysis that generates and is based
on numerical data. The quantitative data analysis procedure predominately involve
analyzing statistics and graphs, while in the qualitative manner the collection is mostly
focused on interviews and the analysis of the data are achieved through conceptualization
(Saunders, Lewis, & Thornhill, 2009).
According to Saunders, et al. (2009) the deductive approach involves testing theories rather
than building them. A hypothesis about the relationship between several variables must be
deduced. The hypothesis would due to the large amount of different currencies, involve the
relationship between the correlation and the volatility of currencies. Furthermore, because
of the framing of the investigated model, the relationship between the volatility and the
hedging tenor should be of significant importance.
A collection of quantitative data, which is a characteristic of a deductive approach, was
necessary to test this hypothesis between hedge tenors, correlation and volatility. The
Page 22
Chapter 3 G.Carlsson & R.Ericsson Method
15
quantitative data collection contains daily historical exchange rates from 18 different
currencies with the SEK as the base currency, nearly ten years back in time. The large
numerical sample size would be sufficient to fulfill the deductive characteristic, called
generalization. That is, a sufficient numerical sample size is necessary for generalizing a
statistical behavior (Saunders, et al., 2009).
The procedure of evaluating the Layered Basket Option hedging clearly shows that we have
undertaken mainly a deductive and quantitative approach. Statistical data has been central
to conduct the subsequent calculations based on the theories of currency risk management.
The personal contact with representatives from the Sandvik group has been a crucial part
for us to succeed with our research and a qualitative approach should not be totally
detracted.
3.2 Research design
There are three main research perspectives; exploratory, descriptive and explanatory
(Saunders et al, 2009). We have applied a combination of an exploratory and an explanatory
approach. Exploratory research means to achieve improved knowledge within a subject
and to clarify dimensions that have not been fully explained. An exploratory study refers to
exploring the unknown, and concludes if a study is worth pursuing. In an exploratory study
the researcher must be willing to change direction if new findings are found (Saunders et al,
2009). Layered Basket Option hedging is a recently developed model. Due to this novelty,
there is a lack of information within the subject. Information was gathered through articles
provided from Citibank and interactions with our contact person at Sandvik Financial
services, Thomas Hamberg. Explanatory research explains the relationships between
variables to clarify a situation or a problem (Saunders et al., 2009). Layered Basket Option
hedging differs from other strategies in the sense of the number of variables taken into
consideration. For example, the imperfect correlation between assets helps explain why the
basket volatility is being reduced in comparison to the average volatility between
individually hedged currencies. In order to conduct this research we were dependent on
secondary data, where daily exchange rates were the foundation of our collection.
3.3 Secondary data
Secondary data is a form of data that has been gathered through former studies (Saunders
et al., 2009). The purpose of the previous studies is not necessarily the same as ours. It is
important to realize the procedure of data gathering, to comprehend if the data was
conducted in a biased or unbiased way (Befring & Andersson, 1994). The majority of the
information was gathered through secondary data. Information in how multinational
organizations manage their hedging strategies and how the model, Layered Basket Option
hedging, stands in relation to other strategies were collected. There was a necessity to
understand other hedging strategies to realize the unique aspects of the model. Deeper
studies were derived from secondary data in the form of textbooks, academic articles,
relevant newspaper articles and organizational articles.
Page 23
Chapter 3 G.Carlsson & R.Ericsson Method
16
In order to complete our numerical section, other types of secondary data needed to be
collected. Firstly, information regarding theories and models were gathered through
textbooks and academic articles to get knowledge about theories such as Black Scholes,
Value at Risk and portfolio theories. After we determined the best-suited approach,
exchange rates on daily basis needed to be gathered. The data was collected through Bank
of Canada and from Reuters' database.
3.4 Primary data
When the secondary data could no longer fully answer our research questions, we had to
collect further relevant data for our research. This kind of data is equivalent to primary data
and should be collected accordingly to our research questions (Ghauri & Grønhaug, 2005).
According to Churchill (1999, p. 215), “Begin with secondary data, and only when the secondary
data are exhausted or show diminishing returns, proceed to primary data.”
The procedure stated above has been conducted through our research. Our primary data
involved communication with personnel within the Sandvik group. The communication
consisted of personal contact and mail conversations. We have been in contact with the
Head of Corporate Finance and the CEO of Sandvik Treasury AB. The personal
communication have been somewhat informal since we all strove for the same goal, which
was to improve and evaluate the hedging strategy for Sandvik AB. Communication in form
of mail conversations with personnel within the CitiFX Corporate Solutions Group, the
developer of the model, was added to the primary data collected.
Page 24
Chapter 3 G.Carlsson & R.Ericsson Method
17
3.5 Materials used in the financial analysis
Sandvik’s current situation regarding exposed currencies is reflected in their basket. We
have chosen to work with a fixed basket to enable a comparison between periods. The
exposed sums will be fixed in foreign currencies, while the SEK will vary since the spot
rates fluctuate on a day-to-day basis. For example, a USD may be worth 7,00 SEK one day
and 7,10 the day after. This implies, if our foreign currencies stand as fixed, the SEK will
still vary because of currency fluctuations.
Currency Spot Exposure SEK Weight
USD 8,6957 497 200 000 4 323 478 261 36%
AUD 4,8924 269 200 000 1 317 025 440 11%
CAD 5,5036 26 800 000 147 495 872 1%
CHF 6,2854 -373 200 000 -2 345 694 532 -19%
CZK 0,2889 691 600 000 199 792 004 2%
EUR 9,1158 22 800 000 207 839 562 2%
GBP 13,9860 55 600 000 777 622 378 6%
ZAR 1,0138 1 986 400 000 2 013 787 510 17%
SGD 5,0125 -138 000 000 -691 729 323 -6%
PLN 2,2701 180 400 000 409 534 620 3%
NOK 1,2531 -306 000 000 -383 458 647 -3%
KRW 0,0073 95 184 000 000 697 771 538 6%
JPY 0,0732 7 868 800 000 576 063 721 5%
CNY 1,0501 3 144 400 000 3 301 900 662 27%
CPL 0,0121 67 610 800 000 816 018 078 7%
INR 0,1813 -3 287 200 000 -595 929 363 -5%
BRL 2,4558 133 200 000 327 111 984 3%
RUB 0,2721 3 422 800 000 931 333 602 8%
Total 12 029 963 366 100%
Table 2, Basket of currencies
The table above (see table 2) illustrates how a basket is structured according to Sandvik’s
exposure. The “spot” column refers to the spot prices between a foreign currency and the
SEK. The “Exposure” column represents the fixed amounts in foreign currencies that
Sandvik is exposed in and the SEK column is the exposed sum represented in SEK. Some
of the exposures are negative since Sandvik has a larger proportion of production than
sales in some countries and need to make payments in foreign currencies. The last column
demonstrates the basket’s distribution of currencies. The weights will vary between periods
because of exchange rates fluctuations. The weights are calculated by dividing the exposed
sum of a foreign currency represented in SEK, by the total exposed sum in SEK.
3.6 Method for developing a financial analysis
The instruments chosen in our investigation were a combination of the Minimum Variance
Portfolio Theory and the Black-Scholes formula. The models will be used to calculate the
volatility of the baskets and eventually the value of the basket options. The period
investigated will be set to 10 years to achieve sufficient and realistic outcomes. The results
will be compared to the outcomes of other hedging instruments to conclude if the Layered
Basket Option hedging strategy is the appropriate alternative according to Sandviks
strategies.
Page 25
Chapter 3 G.Carlsson & R.Ericsson Method
18
3.6.1 Correlation
Correlation refers to the relationship between two individual assets. Correlation is
measured between +1 and -1, where a positive relationship indicates that assets move in
the same direction given external circumstances, while a negative refers to the opposite
(Aczel & Sounderpandian, 2009). We needed to calculate the pairwise correlation between
all currencies in the baskets, which was a requirement to manage the latter calculations. The
correlation has been based on historical spot rates and was calculated using an add-in
function in Excel. Another alternative is to base the correlation on daily returns. After
further research we concluded that an estimation based on spot rates would be preferred.
The function created a table that illustrated the correlation between the basket’s currencies
(see appendix 11-20). The procedure was repeated every third month, to continuously
generate correlations based on historical data for the last year. In total, 37 different
correlation tables were compiled.
3.6.2 Standard deviation
Standard deviation is a statistical measurement and explains how much a data set varies
from its mean. A high standard deviation refers to a dataset widely spread around the
mean. It is a measure of risk, where a high standard deviation is an indication of a risky
asset and a low standard deviation the opposite (Ramos, Staking, Calle, Beato, O'Shea, &
Carrasco, 2000).
The minimum variance portfolio calculations required a standard deviation for each
currency involved. The standard deviations of the currencies were calculated and based on
daily returns on our collected dataset. The minimum variance portfolio requires annual
standard deviation, which was solved by multiplying the daily standard deviation by √ .
The square root sign is necessary because standard deviation is the square root of the
variance. As mentioned in the correlation section, the same procedure needed to be done
for standard deviation, where each standard deviation was calculated 37 times.
3.6.3 Risk free rate
The Black-Scholes formula requires a risk free rate, which in our case was based on
historical data. The data was based on the period 2002-2012 and was collected from The
Central Bureau of Statistics. We approximated the risk free rate to 4,5%, which was used
throughout our calculations (The Central Bureau of Statistics, 2012). The risk free rate was
also approximated based on several countries risk free rates, since the basket consists of
eighteen different currencies. The risk free rate was set as constant to increase the
transparency for Sandvik AB. This indicates that changes in the basket variance can be
located in a more effective way.
3.6.4 Weights
The currencies are represented in both negative and positive weights, and it is important to
ensure that the currencies in total correspond to 100% of the basket. A consistently on-
going problem throughout this thesis has been to manage the negative weights. If one
Page 26
Chapter 3 G.Carlsson & R.Ericsson Method
19
currency equals -20%, the remaining currencies should represent 120%. The reason why
there are negatively weighted currencies is because of Sandvik’s currency exposure. To
clarify this, if each currency were to be hedged individually, there would be both put- and
call options. Therefore, the basket will contain both positive and negative weights, but still
be classified as a basket put option.
3.6.5 Minimum variance Portfolio
The Minimum Variance Portfolio is an approach to calculate the basket variance based on
several variables.
∑
∑ ∑
(2)
The formula above illustrates how to calculate the variance of a basket. The X’s represents
the weights of the different assets, denotes the standard deviation of an individual asset
and is the correlation between two currencies (Elton, Gruber, Brown and Goetzmann,
2009).
An example that illustrates the concept is provided:
Asset 1 Assets 2
Weight: 50% Weight: 50% Correlation: 0,3
Standard Deviation: 30% Standard Deviation: 20% Avg. Std. = 25%
Basket Variance
√
The basket standard deviation was calculated to approximately 20% which demonstrates
the effect of diversifying risks by including more assets to a portfolio since the average
standard deviation between the two assets equal 25%. A larger amount of assets will most
likely reduce the basket variance in relation to the average variance between each asset
from an individual perspective (Yunker & Melkumian, 2013). The individual risks approach
to zero as the number of currencies goes to infinity, which refers to a non-systematic risk.
(Elton et al, 2009).
Sandvik’s basket consists of 18 currencies and it is necessary to use a matrix to compute the
variance. If the calculations were performed manually it would be too complex and time-
consuming.
[ ] [
] [
] (3)
(Chiang & Wainwright, 2005)
Page 27
Chapter 3 G.Carlsson & R.Ericsson Method
20
The matrix calculates the basket variance and is a conversion of the numerical version of
the portfolio variance formula (see formula 2).
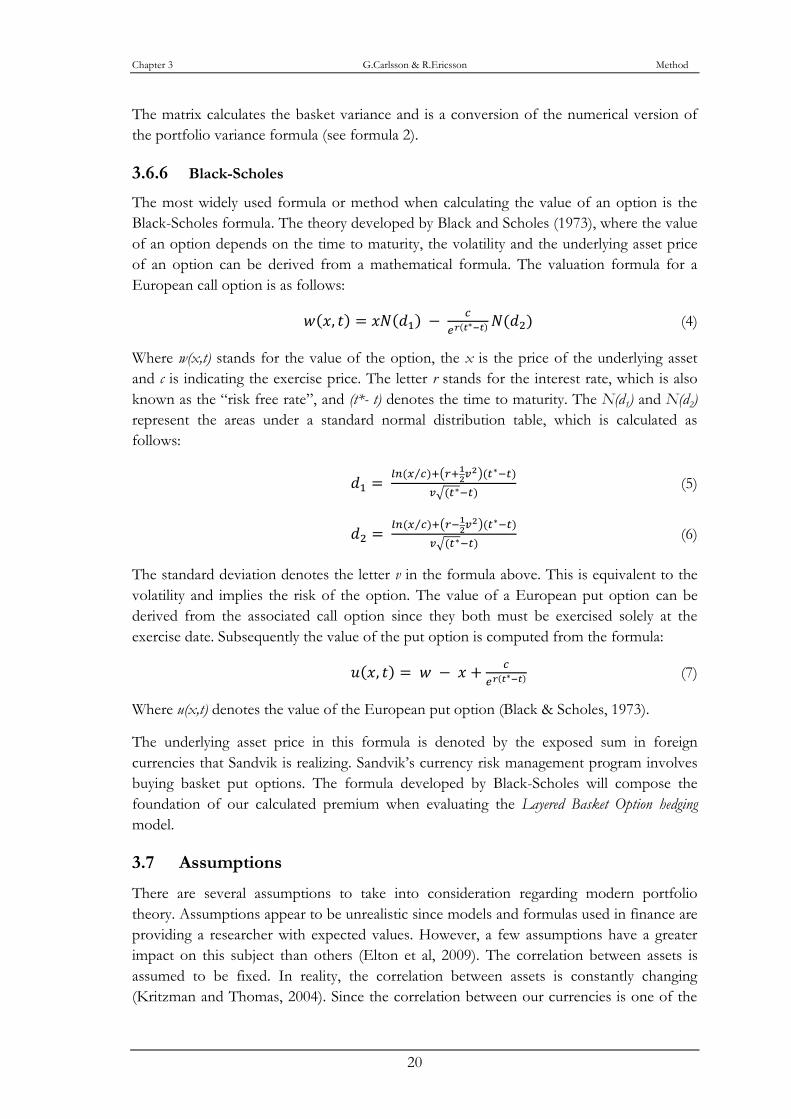
3.6.6 Black-Scholes
The most widely used formula or method when calculating the value of an option is the
Black-Scholes formula. The theory developed by Black and Scholes (1973), where the value
of an option depends on the time to maturity, the volatility and the underlying asset price
of an option can be derived from a mathematical formula. The valuation formula for a
European call option is as follows:
(4)
Where w(x,t) stands for the value of the option, the x is the price of the underlying asset
and c is indicating the exercise price. The letter r stands for the interest rate, which is also
known as the “risk free rate”, and (t*- t) denotes the time to maturity. The N(d1) and N(d2)
represent the areas under a standard normal distribution table, which is calculated as
follows:
⁄ (
)
√ (5)
⁄ (
)
√ (6)
The standard deviation denotes the letter v in the formula above. This is equivalent to the
volatility and implies the risk of the option. The value of a European put option can be
derived from the associated call option since they both must be exercised solely at the
exercise date. Subsequently the value of the put option is computed from the formula:
(7)
Where u(x,t) denotes the value of the European put option (Black & Scholes, 1973).
The underlying asset price in this formula is denoted by the exposed sum in foreign
currencies that Sandvik is realizing. Sandvik’s currency risk management program involves
buying basket put options. The formula developed by Black-Scholes will compose the
foundation of our calculated premium when evaluating the Layered Basket Option hedging
model.
3.7 Assumptions
There are several assumptions to take into consideration regarding modern portfolio
theory. Assumptions appear to be unrealistic since models and formulas used in finance are
providing a researcher with expected values. However, a few assumptions have a greater
impact on this subject than others (Elton et al, 2009). The correlation between assets is
assumed to be fixed. In reality, the correlation between assets is constantly changing
(Kritzman and Thomas, 2004). Since the correlation between our currencies is one of the
Page 28
Chapter 3 G.Carlsson & R.Ericsson Method
21
key variables when determining the basket variance, this assumption is fundamental for this
thesis.
Another assumption that had to be considered was transaction costs. A transaction cost is
referred to as a cost incurred in making a transaction or an exchange (McDowell, Thom,
Frank, & Bernanke, 2006). An example is when a person is selling or buying stocks and has
to pay a fee to a broker. In our case only the premium is taken into consideration and other
transaction costs has been ignored. The last assumption we had to consider was to ensure
that the collected data was normally distributed. Normal distribution means that most of
your data is gathered around a mean and the distribution follows a bell-shaped curve (Aczel
& Sounderpandian, 2009).
3.8 The layered hedging approach
A layered approach is conducted when performing the hedging strategy and the time to
maturity (t*- t) is therefore three, six, nine and twelve months respectively. This obliges us
to further divide the basket into four options with equal exposure and calculate the value
respectively with the different hedge tenors. These different values, where the option with
three months has the lowest value and the one with twelve has the highest and are
summarized to attain a total value of an ATM-basket put options. The summarized value
obtained by using the Black-Scholes formula is the premium of the basket option (see
formulas 4-7).
3.9 The effects of applying a basket
A basket of 18 currencies have been used throughout our examined period. When the
currencies are placed in a basket, a diversification effect is created. If the currencies were
hedged individually, the effect would disappear. There is a possibility that the basket’s
variance eventuates higher than the average variance between the individual currencies.
Currencies with large weights in combination with high correlations and standard
deviations can result in a higher basket variance. We have calculated the effects of
diversification throughout our investigated time-period. The reason why this is performed
is to conclude whether a basket is consistently the best alternative.
∑ (8)
The X represents the amount in one currency and denotes for that currency’s standard
deviation. The symbolizes the confidence interval and is set to 95% (Linsmeier and
Pearson, 1996).
Page 29
Chapter 3 G.Carlsson & R.Ericsson Method
22
3.10 Alternative hedging strategies
Besides calculating the outcomes when a Layered Basket Option hedging strategy has been
used, the results from other strategies have been calculated as a comparison.
Spot Rates – The spot rate indicates that no hedging strategy is applied, and the
corporation instead relies on the spot rates.
3-month Forwards – We have computed the outcome if forward contracts with an expiry
date in three months were used as Sandvik’s hedging strategy.
Layered Forwards – A combination between two strategies, where forward contracts with
different expiration dates were used. This strategy is similar to the Layered Basket Option
hedging but the options have been swapped for forward contracts.
3-month Basket Options – This strategy demonstrates the outcome if the layered
approach was excluded from the Layered Basket Option hedging strategy. Basket options
with an expiration date in three month have been tested as Sandvik’s hedging strategy.
3.11 Improved baskets
Instead of having a basket consisting of 18 different currencies we have tried to reduce the
basket’s variance by dividing the large basket into several smaller baskets. The correlation
has been the benchmark when the new baskets have been constructed. Baskets with
optimal structure have been searched for, where the correlation and weights have been
strategically examined and assembled to reach a lower total variance. We have examined
certain quarters in order to establish an improved currency distribution between baskets.
3.12 Manipulation of variables to realize the actual effect of changes
We have performed a simulation where the underlying variables in the Minimum Variance
Portfolio formula have been manipulated. The correlation has varied between different
periods, and it has been difficult to grasp the actual outcomes caused by changes in the
correlation. The correlation was reduced by 10 percent. This implies that if two currencies
have a correlation of 0,4 it will be changed to 0,36, while if the correlation between to
currencies equals -0,6 it will be shifted to -0,66. The currencies standard deviation has been
relatively consistent throughout the examined time-period. Each currencies standard
deviation was reduced by 10 percent to understand the relationship between the basket
variance and the underlying currencies standard deviation. That is, to realize with what
percent the variance will change after a 10 percent change in the standard deviation.
The purpose is to simplify the searches for improved baskets. If we understand why
baskets behave in different ways, it will simplify our restructuring of a basket to reach a
more desired outcome.
Page 30
Chapter 3 G.Carlsson & R.Ericsson Method
23
3.13 Criticism of theories and models
Decision-makers often use financial models to determine future investments. Even if the
models provide a relatively accurate result there are some limitations to keep in mind.
There are assumptions linked to each financial model, which are unrealistic. Both the
Black-Scholes- and the Minimum Variance Portfolio formula are connected to some
assumptions (Elton et al, 2009).
Black-Scholes
- A possibility to borrow and lend at a constant risk-free interest rate
- No transaction costs
- A constant Volatility
Minimum Variance Portfolio
- Correlation between assets are fixed
- No taxes or transaction costs
The Black-Scholes formula determines the premiums for the basket options. The calculated
value will probably be lower than the actual payment because of transaction costs. Sandvik
usually supply banks with a basket of currencies and the bank will respond with an offer
(Berk & DeMarzo, 2011). In the minimum variance portfolio formula, the correlation is
one of the key variables and the correlation assumes to be fixed. It is not idealistic since
that aspect does not reflect the reality. The dilemma was adjusted by shifting the calculated
correlation every third month. The calculated correlation was based on the last 12-monts
and updated every third month. If we calculated the volatility in April 2010, a correlation
based on the period 1 April 2009 – 31 March 2010 was used. This procedure was
performed to achieve a more realistic result (Kritzman and Thomas, 2004). In the Black-
Scholes formula, the volatility is assumed to be constant, which is misleading since the
volatility is based on the correlation (Berk & DeMarzo, 2011).
An interesting notion is the effect of diversification. When currencies are added to a basket,
the non-systematic risk can be reduced. What studies often fail to mention is when a new
asset is added to a basket or portfolio, the systematic risk will increase (Armstrong &
Vashishtha, 2012). A country has its own problems, where country-specific aspects affect
the domestic currency. This eventually leads to the question whether or not a large amount
of currencies in a basket is the best solution or if a basket should be divided into several
smaller baskets to strategically place the risks.
Another problem with financial models concerns the actual outcome. The outcome can
never be completely accurate. The models do only provide a researcher with an expected
value and not the actual outcome. A model will only take a certain number of variables into
account and these variables rely on certain assumptions. In reality, almost an infinite
number of variables need to be included. Financial models fail to include parts such as
domestic or national circumstances as well as the human factor (Berk & DeMarzo, 2011).
Page 31
Chapter 3 G.Carlsson & R.Ericsson Method
24
This dilemma is impossible to get around. Financial models are the closest to reality a
researcher can accomplish, and this issue is therefore something we had to accept when
writing this thesis.
3.14 Reliability and validity
“Reliability refers to the extent to which your data collection techniques or analysis procedures will yield
consistent findings.”(Saunders et al., 2009, p. 156)
A credible result for a researcher should be of biggest concern and therefore, reliability in
the data collection and analysis must exist. According to Easterby-Smith, Thorpe, Jackson
& Lowe (2008) reliable research should be conducted through three questions. Firstly, will
the same results be yielded from the measures at different occasions? Second, will similar
observations be made from different researchers? Finally, is there a transparency in the
results drawn from the raw data? The data collected for this research was essential to
achieve reliable results. Data in the form of daily, instead of monthly exchange rates from
the currencies that Sandvik is exposed to seemed as an obvious approach to acquire reliable
findings. Daily data in a time span of ten years was collected to further ensure reliable
outcomes. Our results are based on historical values. Transparency from the raw data is
proven since we have not excluded any statistics and all steps are easily followed in our
calculations. Due to the substantial numerical sample size and the large number of different
currencies the three questions stated by Easterby-Smith et al. (2008) are exhibited and
reliability is proven.
The validity of research depends upon the extent the research findings are about what they
claim to be (Saunders et al., 2009). Furthermore, the material collected must be relevant to
the stated purpose and research questions of the thesis (Eriksson & Wiedersheim-Paul,
2011). The problem this thesis is investigating states that we want to evaluate a hedging
model implemented by Sandvik. To achieve this, it is essential to obtain valid data and
material that is related to our purpose. To find such comprehensive data as daily exchange
rates was a central matter for us, and the validity had to be proven. By searching through
respected databases such as Reuters and Bank of Canada, we eventually found this
numerical data from two different sources. This allowed us to confirm their validity after
comparison. Additional secondary data was found solely from respected journals and
publications from the organization that has developed the model. Hence, the theories
applied were clearly relevant to our purpose. The primary data was gathered directly from
persons with important positions within the Sandvik group.
Page 32
Chapter 4 G.Carlsson & R.Ericsson Empirical Findings
25
4 Empirical Findings
This chapter will present a summary of the hedging purposes within the Sandvik group and their strategies
regarding currency risk management. The financial results of the calculations undertaken will also be
presented in this section. These results will further be used as underlying material for the analysis of the
Layered Basket Option hedging model and other strategies related to currency risk management.
4.1 Sandvik’s hedging purposes
According to Thomas Hamberg, head of Corporate Finance, the main goal is to reduce the
effects of currency fluctuations. The essential purpose is not to make a profit from the
hedging strategy, but to reduce the swings caused by currency fluctuations. Instead of using
a hedging program, large organizations could rely on the spot rates, which could make the
result differ on a year-to-year basis. Seen from a long-term perspective, peaks and downs
caused by the spot rates may cancel out each other. The reason why a hedging strategy is
implied is often to satisfy the shareholders. As a shareholder, a consistent and reliable stock
is generally preferred when investing in this industry. Sandvik wants to ensure their
shareholders that only a small amount of their cash flow is at risk. The unexpected profits
or losses caused by currency fluctuations shall be reduced. Sandvik is searching for
consistency, where only a certain cash flow is at risk each year (T, Hamberg, personal
communication, 2012-04-16).
4.2 Standard deviation
The graph below illustrates the currencies’ standard deviations between the years 2003-
2012 (see figure 4).
Figure 4, Standard Deviation
As seen in the graph above the standard deviation fluctuates heavily during certain periods.
The fluctuations in 2002-2003 and in 2008-2009 can be effects from financial crisis. The
volatility has a substantial effect on the premium, which will be presented later in the
Page 33
Chapter 4 G.Carlsson & R.Ericsson Empirical Findings
26
empirical findings. It is reflected that some currencies respond stronger to crisis than
others. Certain currencies have a volatility of approximately 40% during 2008-2009, while
others only have a volatility of 10% (see appendix 1-10). When corporations operate with
multiple currencies it is important to understand the behavior of each currency to
successfully handle the risk management processes. The graph implies that currencies
respond relatively similar in directions but different in proportion given external
circumstances.
4.3 The MVP approach
Through the MVP-approach the basket’s standard deviation have been calculated and are
illustrated in the graph below (see figure 5). The standard deviation is a fundamental part
when the premium is calculated and is derived from the portfolio variance.
Figure 5, Basket Standard Deviation
As seen in the graph above, the basket’s standard deviation is reflected in the currencies’
individual standard deviation, which in particular is seen during 2008-2009. The
diversification effect result in a lower standard deviation of the basket compared to the
individual currencies (see figure 4).
4.4 The premium using Black-Scholes
The Black–Scholes formula has some assumptions that have to be considered in the form
of normality and transaction costs among others. These assumptions lead to that the value
derived from the formula does not fully represent the premium. From the value derived, a
qualified hint of the premium may be retrieved.
The standard deviations of the baskets options retrieved from the MVP approach have
been used in the Black-Scholes formula, which is denoted by the letter v and the chosen
risk free rate r (see formulas 4-7). Further, the time to maturity (t*- t) has provided four
different values that have been summarized to one total value of an ATM-basket put
option. The values derived from the Black-Scholes formula have been set as premiums
over the investigated time period and are presented in the following graph (see figure 6).
Page 34
Chapter 4 G.Carlsson & R.Ericsson Empirical Findings
27
The graph illustrates the premium as a percentage of the exposed amount, which will give a
more applicable picture of the scenario.
Figure 6, Premium
According to the graph above the premium is indeed connected to the standard deviation.
It follows the same pattern and between the years 2008-2009 the premium is noticeably
high due to the high standard deviation presented in figure 4 and 5.
4.5 The total result of the hedging strategies
Sandvik AB is presently using three different strategies when conducting their currency risk
management. These strategies involve the use of forward contracts and the recently
implemented model Layered Basket Option hedging. The third strategy is to not actively
conduct any risk management and currencies are exchanged according to the spot rates. A
comparison of these strategies is necessary to obtain material for an analysis relevant to the
investigated problem.
Page 35
Chapter 4 G.Carlsson & R.Ericsson Empirical Findings
28
Date Spot Rate 3-Months Basket Option
3-Months Forwards
Layered forward
Layered Basket Option
2003-12-31 2 752 966 634 2 858 072 406 2 887 871 990 2 951 664 573 2 898 728 238
2004-03-31 2 939 608 901 2 884 916 681 2 752 966 634 2 888 033 521 2 906 414 582
2004-06-30 2 887 038 400 2 897 028 261 2 939 608 901 2 877 573 161 2 866 974 148
2004-09-30 2 800 737 387 2 834 772 042 2 887 038 400 2 866 871 481 2 830 216 854
2004-12-31 2 692 557 652 2 760 873 342 2 800 737 387 2 845 087 831 2 786 570 345
2005-03-31 2 798 745 475 2 757 499 588 2 692 557 652 2 829 985 585 2 794 533 023
2005-06-30 3 064 324 650 3 019 164 849 2 798 745 475 2 794 769 729 3 006 346 421
2005-09-30 3 118 595 204 3 060 533 159 3 064 324 650 2 839 091 291 3 060 517 220
2005-12-31 3 200 001 606 3 140 247 129 3 118 595 204 2 918 555 745 3 142 052 523
2006-03-31 3 153 032 524 3 141 298 407 3 200 001 606 3 045 416 734 3 100 486 731
2006-06-30 2 853 690 732 3 099 902 474 3 153 032 524 3 133 988 496 3 063 795 740
2006-09-29 2 881 630 999 2 827 980 756 2 853 690 732 3 081 330 017 3 015 778 791
2006-12-29 2 769 289 448 2 830 072 333 2 881 630 999 3 022 088 965 2 949 564 266
2007-03-30 2 823 777 555 2 782 285 962 2 769 289 448 2 914 410 926 2 860 179 057
2007-06-30 2 833 049 701 2 802 178 485 2 823 777 555 2 832 097 184 2 788 271 974
2007-09-28 2 723 895 484 2 803 521 466 2 833 049 701 2 826 936 926 2 771 992 178
2007-12-31 2 732 145 591 2 702 490 052 2 723 895 484 2 787 503 047 2 744 930 570
2008-03-30 2 473 384 035 2 695 802 557 2 732 145 591 2 778 217 083 2 741 142 970
2008-06-30 2 545 833 743 2 508 253 058 2 473 384 035 2 690 618 703 2 672 685 050
2008-09-30 2 789 031 583 2 737 140 895 2 545 833 743 2 618 814 713 2 747 589 770
2008-12-31 2 897 798 012 2 843 846 772 2 789 031 583 2 635 098 738 2 850 482 148
2009-03-31 3 018 911 324 2 927 413 755 2 897 798 012 2 676 511 843 2 962 646 623
2009-06-30 3 050 018 284 2 957 409 401 3 018 911 324 2 812 893 666 3 009 984 422
2009-09-30 2 808 626 041 2 964 894 069 3 050 018 284 2 938 939 801 2 851 337 355
2009-12-31 2 904 463 130 2 850 227 321 2 808 626 041 2 943 838 415 2 863 715 128
2010-03-31 2 932 294 806 2 877 539 289 2 904 463 130 2 945 504 695 2 876 246 826
2010-06-30 3 070 082 228 3 001 016 089 2 932 294 806 2 923 850 565 2 972 828 126
2010-09-30 2 793 851 164 2 996 334 305 3 070 082 228 2 928 866 551 2 839 458 887
2010-12-31 2 825 091 267 2 761 286 898 2 793 851 164 2 925 172 832 2 847 013 000
2011-03-31 2 655 539 009 2 765 350 905 2 825 091 267 2 905 329 866 2 817 817 697
2011-06-30 2 641 921 514 2 585 801 499 2 655 539 009 2 836 140 917 2 744 802 789
2011-09-30 2 710 583 942 2 638 884 217 2 641 921 514 2 729 100 739 2 671 546 634
2011-12-31 2 790 610 812 2 738 533 433 2 710 583 942 2 708 283 933 2 711 405 902
Average 2 846 458 450 2 850 077 935 2 849 405 758 2 862 199 645 2 871 759 272
St. Deviation 5,03% 4,10% 5,07% 2,26% 2,67%
Table 3, Result from hedging strategies
Table 3 illustrates the outcome for each investigated strategy between the periods 2003-
2012. The sums represent the amount in SEK Sandvik acquired accordingly to each
strategy, and at the bottom of the table the average outcome for the total period is
presented. The standard deviation is based on the outcomes and indicates to what degree
the strategies’ outcome fluctuates between periods.
As seen in table 3, the Layered Forward and the Layered Basket Option hedging strategy are
generating the highest outcomes and the lowest volatility between periods. The 3-month
basket option lowers the volatility from 5,03% to 4,10% while the layered basket option
approach reduces the volatility from 5,03% to 2,67% in relation to the spot rate. The
layered forward reduces the volatility from 5,03% to 2,26%.
Page 36
Chapter 4 G.Carlsson & R.Ericsson Empirical Findings
29
Figure 7, Result from hedging strategies
A comparison between the hedging strategies applied by Sandvik is illustrated in the graph
above (see figure 7). The 3-month forward contract only delays the outcome of the spot
rate and actually has a higher volatility during the investigated period. The 3-month basket
option slightly improves the outcome and volatility compared to the spot rate, but this
hedging strategy fails to capture the smoothening effect given by the layered approach. The
layered basket option and layered forward approach clearly show improvements of the
volatility and the total outcome in the currency exposure.
4.6 The results of the Layered Basket Option
The outcome of the Layered Basket Option, after testing it between the years 2003-2012,
compared to the spot rate is shown in the graph below. As mentioned earlier the average
volatility decreased from 5,03% to 2,67% when using this hedging strategy. It is illustrated
in the following graph that the hedging strategy prevent losses caused by downward
fluctuations in the spot rates but at the same time allow profits to be made when there is an
upward trend. The effectiveness of the hedge is clearly shown in the graph around June
2006, March 2008 and March 2011 (see figure 8).
Figure 8, Layered Basket Option vs. Spot Rate
Page 37
Chapter 4 G.Carlsson & R.Ericsson Empirical Findings
30
4.7 The results of the Layered Forward
A comparison of the spot rate and the layered forward approach between the years 2003-
2012 is illustrated in the following graph. The volatility was decreased from 5,03% to
2,26% and the effectiveness of the hedge is shown around the same dates as the layered
basket option. During June 2006, March 2008 and March 2011 the hedging strategy of
forward contracts has a significant impact on the downward fluctuations of the spot rates
(see figure 9).
Figure 9, Layered Forward vs. Spot Rate
4.8 Manipulated baskets
In the table below it is shown that the currencies’ standard deviations have a larger effect
on the basket’s variance compared to a proportionally equally large change in correlation. A
reduction of the individual currencies standard deviation by 10 percent decreased the
variance by 19%, while a 10% reduction in the pairwise correlation decreased the basket
variance by 10% (see table 4).
2012 Q1 Change Effect on the Basket's Variance
Standard Deviation Reduction by 10% -19%
Correlation Reduction by 10% -10% Table 4, Manipulated Baskets
Since a similar procedure has been made on each quarter, it became clear that the standard
deviation consistently had a larger impact on the basket variance compared to the
correlation.
Page 38
Chapter 4 G.Carlsson & R.Ericsson Empirical Findings
31
4.9 The effects of applying a basket
The table below illustrates the effects of applying a basket option instead of hedging the
currencies as individual vanilla options (see table 5). The percentage indicates how much
the volatility is reduced if a basket option is applied in comparison to the average volatility
if each currency were hedged separately through vanilla options.
Date Diversification improvements
Date
Diversification improvements
2003 Q1 17% 2007 Q3 44%
2003 Q2 37% 2007 Q4 52%
2003 Q3 109% 2008 Q1 50%
2003 Q4 103% 2008 Q2 34%
2004 Q1 82% 2008 Q3 24%
2004 Q2 62% 2008 Q4 47%
2004 Q3 68% 2009 Q1 124%
2004 Q4 49% 2009 Q2 74%
2005 Q1 53% 2009 Q3 66%
2005 Q2 57% 2009 Q4 83%
2005 Q3 48% 2010 Q1 91%
2005 Q4 18% 2010 Q2 55%
2006 Q1 9% 2010 Q3 16%
2006 Q2 12% 2010 Q4 11%
2006 Q3 17% 2011 Q1 15%
2006 Q4 11% 2011 Q2 -3%
2007 Q1 9% 2011 Q3 -9%
2007 Q2 22% 2011 Q4 -10%
Table 5, Diversification improvements
The effects of diversification differ between periods. During unstable periods the effects of
diversification are strong. In late 2003 and early 2009 the effects are perceptually large
compared to other periods. According to the table, applying a basket approach is preferable
in contrast to using vanilla options except in 2011 (see table 5).
4.10 Improved baskets – Divided Layered Basket
When working on the supposition that correlations of the currencies affect the total
volatility of the basket give us an opportunity to improve Sandvik’s current hedging
strategy. Matching currencies that are highly negatively correlated will decrease the total
volatility of the basket. When one currency has an upward trend the other will have a
downward trend. This will smoothen the fluctuations of the exposed currencies and further
hedge the risk. This leads to a reduced volatility and subsequently lower premiums of the
options. Furthermore, the weights of the currencies in the basket play a significant role in
matching the currencies to improve the basket options. Currencies with a large weight have
a great impact on the basket regardless of the correlation with the other currencies.
The problem is to find the ideal allocation of currencies in the baskets and create divided
layered basket options with currencies that have optimal correlations and weights according to
this hedging strategy.
Page 39
Chapter 4 G.Carlsson & R.Ericsson Empirical Findings
32
An example that supports our findings to actively allocate the currencies into smaller
basket can be seen in the fourth quarter of 2011. The premium becomes substantially lower
when strategically dividing the basket option into two smaller baskets with currencies that
are mainly negatively correlated. Further, the weights (positive and negative) have played an
important role when allocating the baskets according to this strategy. The newly developed
baskets are presented below and a comparison between them and the original layered
basket option shows that the premium is reduced (see table 6 and appendix 9).
Basket 1 Weight SEK 2011 Q4 Basket 2 Weight SEK
CAD 3,91% 44 002 699 USD 53,49% 847 920 925
CHF -62,48% -703 142 870 AUD 28,23% 447 500 612
CZK 5,71% 64 259 696 GBP 9,35% 148 215 753
EUR 4,65% 52 330 575 SGD -11,41% -180 870 775
ZAR 37,52% 422 245 846 NOK -5,64% -89 405 011
PLN 8,32% 93 632 341 CPL 14,01% 222 085 851
KRW 12,22% 137 522 501 INR -7,21% -114 292 576
JPY 15,48% 174 210 173 BRL 7,75% 122 852 630
CNY 74,67% 840 327 754 RUB 11,43% 181 187 814
100% 1 125 388 716 100% 1 585 195 224
Premium 3 months 7 442 129 Premium 3 months 7 400 193
6 months 9 316 777 6 months 10 076 577
9 months 11 210 756 9 months 11 299 096
12 months 12 038 323 12 months 11 130 701
TOTAL 40 007 985 TOTAL 39 906 567
Table 6, Improved baskets
The premium paid in the fourth quarter 2011 was 91.339.419 SEK for the layered basket
option, compared to the divided layered basket option, which is (40007985 + 39906567)
79.914.552 SEK. This gives us a reduction of 12,5% of the premium paid.
A more simple approach is to remove the currency with the largest weight and highest
correlation. By removing the USD exposure from the basket in the third quarter of 2011
and hedging it separately as a vanilla option will further lower the premium of the layered
basket. In the following example the divided layered baskets option decrease the premium to
the amount of (53803779 + 26382435) 80.186.214 SEK, which gives us an improvement of
9,89% of the premium paid (see table 7 and appendix 9).
Page 40
Chapter 4 G.Carlsson & R.Ericsson Empirical Findings
33
Basket 1 Weight SEK 2011 Q3 Basket 2 Weight SEK
AUD 24,48% 455 037 187
CAD 2,36% 43 790 850
CHF -37,60% -698 876 404
CZK 3,50% 65 046 462
EUR 2,81% 52 197 802
GBP 7,58% 140 830 800
ZAR 24,92% 463 159 858
SGD -9,53% -177 104 723
PLN 5,58% 103 702 000
NOK -4,83% -89 704 503
KRW 7,56% 140 598 578
JPY 8,27% 153 776 402
CNY 41,24% 766 552 901
CPL 12,25% 227 689 336
INR -6,25% -116 125 933
BRL 7,24% 134 545 455
RUB 10,41% 193 566 630 USD 100% 783 238 815
100% 1 858 682 698 100% 783 238 815
Premium 3 months 10 494 535 Premium 3 months 5 168 693
6 months 13 644 673 6 months 6 501 204
9 months 13 255 470 9 months 7 069 818
12 months 16 409 101 12 months 7 642 719
TOTAL 53 803 779 TOTAL 26 382 435
Table 7, Improved baskets
These examples prove that by actively constructing favorable baskets the premium may be
considerably decreased. The correlations and weights change over time so by constantly
evaluating the variables connected to the basket of currencies will result in an improved
currency risk management.
Page 41
Chapter 5 G.Carlsson & R.Ericsson Analysis
34
5 Analysis
In this chapter an analysis of the different hedging methods is presented. The following discussions are built
on our empirical findings and why there exists incentives for multinational corporations to hedge currency
risk. Further, the analysis is based on how Sandvik AB perform during a fluctuating exchange market
and which hedging approach that suits the goals and strategies of the organization.
5.1 Incentives to hedge
This thesis has consistently argued the different reasons in why multinational corporations
should invest in a hedging strategy. Sandvik AB is a multinational corporation where the
general concern is to satisfy the shareholders. Therefore, the organization’s main priority is
not to implement an aggressive strategy with the intention to make substantial profits.
Instead, they emphasize the importance of reducing the effects caused by currency
fluctuations. The fundamental objective is consequently to exploit derivatives to attain a
predictable result. A hedging strategy should not jeopardize the accuracy of a desired result.
Hence, this thesis has proven that Sandvik’s purpose is to use a hedging strategy to achieve
a result that is easy to forecast, and it should protect the organization from fluctuations that
might affect the result.
5.2 The Layered approach
This thesis has proven that the layered approach has significant impacts on the results of
the different hedging strategies. By layering the hedge quarterly over a year generates
notable effects on the results compared to a spot strategy. The layered approach creates a
smoothening effect, which is difficult to achieve with any other approach. The
effectiveness of the layered approach is shown when implementing this strategy combined
with forward contracts. When entering static forward contracts every third month with the
same period the outcome is delayed by three months. This leads to no reduction in the
volatility, which is argued to be a goal for multinational corporations. However, a layered
forward strategy leads to a reduction of the volatility with approximately 55 % compared to
the spot strategy. The effectiveness of the layered approach is further proven when
comparing statically hedged basket options with quarterly intervals and basket options that
are hedged with a layered strategy. The three months static basket option has an overall
volatility of a total of 4,10%, compared to a layered approach combined with basket
options that gives an overall volatility of 2,67% (see table 8).
Strategy Spot Rate 3-Months Basket Option
3-Months Forwards
Layered forward
Layered Basket Option
Average 2 846 458 450 2 850 077 935 2 849 405 758 2 862 199 645 2 871 759 272
St. Deviation 5,03% 4,10% 5,07% 2,26% 2,67%
Table 8, Outcome of strategies
Dividing the hedging exposure and later hedge them with different time intervals
automatically spread the risk since the peaks and downs of the currency rates cancel out
each other. By increasing the number of different expiration dates may further decrease the
Page 42
Chapter 5 G.Carlsson & R.Ericsson Analysis
35
volatility since the hedges become more precise. Layering the hedge monthly over a year
would lead to twelve expiration dates for twelve parts of the exposure, but the complexity
of creating such an extensive layering strategy would probably cost more than the positive
outcome of the hedge.
The layered strategy cannot be used alone but has to be combined with another hedging
strategy for it to be useful. The two derivatives that have been combined with the layered
approach in this thesis are the basket option and the forward contracts. Both strategies
have different strengths and weaknesses, but it is proven that the two derivatives in
combination with the layered strategy generate favorable results.
5.3 The Basket approach
The positive effect from applying a basket is a reduction in the non-systematic risk. The
risk reduction is a result from the imperfect correlation between the underlying currencies,
where a correlation less than one will decrease the basket’s volatility and eventually also the
premium. By using formula 9 as a benchmark, it is easier to realize the effects. If the
correlation between two currencies is negative, the second part of the formula will turn
negative, which will reduce the basket’s variance. It will generate a lower variance if a large
proportion of the correlations are negative.
1st part 2nd part
∑
∑ ∑
(9)
Each currency will contribute with a non-diversifiable risk. If the correlation between two
currencies is 1, the diversification effect will be eliminated. Instead, their participation will
result in an increase in the basket’s variance because of the non-diversifiable risk. However,
the effects from adding additional currencies to a basket have a positive effect as long as
the correlation is less than one (see formula 9). Seen from a multinational corporation’s
perspective, premium costs can be reduced by using the concept of a basket approach.
Therefore, the correlation between the different currencies needs to be examined carefully
before creating a basket.
The effects of applying a basket is illustrated in table 9 where the average variance between
the individual currencies is compared to the basket’s variance. The result from applying a
basket varies between different time periods. By examining two periods where the
diversification effect differs, it is possible to localize why the effect differs. In 2003 Q3, the
diversification effect was 109%, compared to -9% in 2011 Q3. This implies that applying a
basket in 2011 Q3 results in a worse scenario in comparison to regular vanilla options. First
of all, the average correlation in 2003 Q3 was 0,52, compared to 0,66 in 2011 Q3 (see
appendix 11 and 19). This has an effect, where a lower correlation results in a lower
variance.
Diversification Improvement
Diversification Improvement 2003 Q3 109% 2011 Q3 -9%
Table 9, Diversification 2003 Q3 & 2011 Q3
Page 43
Chapter 5 G.Carlsson & R.Ericsson Analysis
36
Although, a generalization of the outcome based on the average correlation is not
sufficient. The average correlation shows the average between all currencies, but each
currency is represented by different weights, making the generalization unfair. A high
correlation between currencies that represent larger weights will have a larger effect.
Therefore, a high correlation between currencies that represent a larger weight will have a
larger impact on the basket variance.
The same logic is applicable for the standard deviation, where a high standard deviation
combined with a large weight will lead to a larger effect on the basket variance. These
notions need to be considered when a basket is created, since a weak structure of the
basket will eliminate the diversification effect, resulting in a high basket variance.
The conclusions drawn above are not applicable for all currencies in the basket. Some
currencies are represented by negative weights (see appendix 1-10). For currencies that
represent a negative weight, a positive correlation is required if the diversification effect will
be seized. By applying formula 9 as a benchmark, the second part turn negative if the weight
is negative. A negative correlation in combination with a negative weight will increase the
variance. For currencies with negative weights, a high positive correlation is therefore
desired, resulting in a decrease in the basket’s variance.
Overall, this thesis has proven that a basket approach has a substantial effect if used in a
carefully prepared manner. The underlying factors need to be examined and evaluated. If
the proportion and structure between the weights and correlation is carefully planned,
applying a basket approach can seize significant advantages. Although, a basket that is not
carefully planned can result in a basket variance that is higher compared to the average
variance between individual currencies.
At last, we believe that a perfectly built basket is a benefit for every organization that is
exposed to currency risks in several currencies.
5.4 The Layered Forward approach
When combining the derivative of forward contracts and the strategy of layered hedging an
effective tool for risk management has been developed. We have earlier discussed the
benefits when conducting the layered approach together with forward contracts. The
results of the outcome from our test period state that the layered forward approach has the
lowest volatility among our investigated strategies. There is especially one great benefit in
using the layered forward approach when undertaking currency risk management within a
multinational corporation. This benefit is that a forward contract does not have any
premium costs to consider. The different parties only enter a binding contract to exchange
an amount of currencies at a specific date in the future. The absence of premiums paid is a
great advantage for the forward contract, but as mentioned earlier there is always one
winner and loser in a binding contract where no premiums exist.
The party that oblige itself to receive a predetermined amount of SEK in the future, in our
case Sandvik, bet on a weakening of the foreign currencies and is safe from drops in the
Page 44
Chapter 5 G.Carlsson & R.Ericsson Analysis
37
exchange rates. If this scenario occurs, Sandvik becomes the winner in this contract. The
financial institute that has agreed to buy the currencies will become the winner when the
currency market is strong and Sandvik will miss out of realized exchange profits. Sandvik is
obligated to prosecute the contract and sell the foreign currency at the specific date. Their
exposure becomes fixed and the cash flow is negatively affected. There is no limit of how
much profit a company that hedge with forward contracts can miss out on. An unforeseen
strength in the foreign currency exposure will have a negative effect in the corporation’s
economic reports if they do not follow the upward trend that their competitors are
realizing. Some negative effects may be illustrated in our results during the years of 2005
and 2008-2009 where the layered forward strategy miss out of the upward trends in the
spot rate (see figure 10).
Figure 10, Layered Forward
The foreign exchange market is a very volatile market where an infinite amount of variables
affects the movements of different currencies. Our results show that the volatility is
decreased by actively hedge with layered forwards and that the organization is safe from
drops in the exchange rates. The shareholders play an important role in the management’s
decision-making process. From a shareholder’s perspective, it is sometimes unacceptable
when the market outperforms the corporate strategy. A strategy where the corporate is safe
from drops in the exchange rates but at the same time follows the strong upward trends is
preferable to satisfy the shareholders and other stakeholders.
5.5 The Layered Basket Option approach
Buying options is a well-known hedging strategy, not at least when it comes to currency
risk management. A basket option is an extension of the vanilla option that captures the
diversification effect. The theory of basket options states that due to the correlation
between the currencies the overall volatility decreases when they are hedged together
instead of separately. The basket put option combined with a layered approach could lead
to an optimal hedging strategy for corporations that are exposed to foreign currencies.
The benefits of buying put options as a hedging tool are several; firstly the owner only buys
the right to sell the underlying asset and not the obligation to do so. This means that when
Page 45
Chapter 5 G.Carlsson & R.Ericsson Analysis
38
a strengthening in the foreign currencies occurs, the owner of the option can let the
contract default and be a part of the upward trend and only realize the loss of the premium
paid. When a drop in the currency market occurs, the owner still possesses the right to sell
the currencies for the already predetermined strike price. This allows the owner of a put
option to secure itself from downward trends in the foreign exchange market and at the
same time earn profits when the market is strong.
We have argued that a strong incentive for corporations, such as Sandvik, to hedge risks in
the foreign exchange market is to decrease the volatility and to eliminate fluctuations in the
rates. According to our result, the layered basket approach has clearly reduced the volatility
compared to the spot rates (see table 10).
Strategy Spot Rate Layered Basket Option Hedging
Average 2 846 458 450 2 871 759 272
St. Deviation 5,03% 2,67%
Table 10, Spot vs. Layered Basket Option
The effectiveness of the strategy is shown in figure 8 where the basket put option avoids
losses due to drops in the spot rates. Contrary to the layered forward approach there
cannot be discovered any obvious deviations when the spot rates strongly outperform the
layered basket option approach (see figure 11). During the years 2005 and 2008-2009
where the layered forward hedge was clearly outperformed by the foreign exchange market,
the layered basket option approach made it possible to make earnings from the positive
movements in the spot rates that covered the premiums paid and realized profits.
Figure 11, Layered Forward vs. Layered Basket
A comparison between the Layered Forward and the Layered Basket Option hedging
methods is necessary to draw relevant conclusions regarding the currency risk management
within Sandvik AB because of the similar reduction in volatility. The investigated time
period is a relatively long period, which involves two financial crises and large fluctuations
in the foreign exchange market. During this period the Layered Forward strategy has
performed slightly better in terms of volatility, than the Layered Basket Option hedging
method. This is because of the unpredictable downward fluctuations that have occurred
during this time period. A shorter investigated time period where the foreign exchange
Page 46
Chapter 5 G.Carlsson & R.Ericsson Analysis
39
market performs stronger would clearly show unfavorable results for the forward contracts.
A hedging strategy that yields consistency with the spot rates should probably satisfy the
stakeholders in a short- as well as a long-term perspective. As mentioned earlier, the
shareholders play a central role in the decision making of what kind of risk management
program the corporation should undertake. Even though it may be difficult to justify high
premium costs a Layered Basket Option hedging approach would be in all stakeholders’
interest. The company secures itself from large drops in their foreign currency but at the
same time follows the upward trend, while a forward contract adds a risk to the currency
risk program in the form of lost profits.
We believe that a layered approach combined with basket options would be an optimal
hedging strategy for Sandvik and other multinational corporations. To communicate the
strategy to the stakeholders is of great importance. To make it even more attractive to
implement, improvements that creates lower premiums should be of great interest for risk
managers.
5.6 Improvements
According to our findings, there are improvement possibilities in the third and fourth
quarters in 2011 (see table 6 and 7)
The USD and the CNY have a correlation of approximately 1 (see appendix 1-10). If two
currencies have a correlation of 1, their correlation with other currencies coincides. The
explanation is the current peg, which is placed on the USD by the Chinese government.
This creates a problem, since the pegging makes the currencies move in identical patterns.
The pegging results in a correlation close to 1 and a similar standard deviation. There is no
effect of including the USD and CNY in one basket since they move in identical patterns.
Furthermore, the USD and the CNY consistently represent the largest weight in the basket.
The two currencies combined represent approximately 60% of the weights in the baskets
(see appendix 1-10). If a currency represents a large weight, it will obviously have a larger
effect on the basket variance. If the American and Chinese currencies represent 60% of the
basket’s weight, the basket will be strongly reflected in those currencies. A large weight
equals a strong influence on the basket’s variance. If a currency has a low standard
deviation and is negatively correlated with several currencies, the impact will still be
strongly determined by the weight it represents. Therefore, when building new baskets, the
foundation should be to split currencies with large weights that are highly correlated. In our
case, the primer idea has been to split American and Chinese currencies.
Table 6 illustrates an example when a larger basket was divided into two smaller baskets.
The idea was to separate the USD from the CNY, and thereafter place currencies
strategically in the best-suited basket. The goal was to capture the diversification effect to
maximally reduce the non-systematic risk, where the correlation between currencies was
the benchmark. The original basket consists of both positive and negative weights, where
the negative weighted currencies will lower the exposed amount, leading to a reduction in
premium. The negatively weighted currencies need to be highly correlated with other
Page 47
Chapter 5 G.Carlsson & R.Ericsson Analysis
40
currencies for the diversification effect to be seized. The CHF is the largest negatively
weighted currency (see appendix 1-10), which allows us to lower the exposed amount in a
basket. The optimal situation would be to have a correlation of 1 between the CHF and a
currency that represents a large positive weight. That would lead to a variance reduction as
well as a decrease in the exposed amount.
The outcome from dividing the basket seen in table 11 illustrates a premium reduction by
12,5% in comparison to the original basket. The example proves that active choices can
lead to distinguishable effects on the premiums. If Sandvik would hedge their entire
exposed amount through the Layered Basket Option hedging, the yearly premiums would
correspond to approximately 300.000.000 SEK. If Sandvik could manage to lower their
premiums by 12,5%, they would reduce their premium expenditures by approximately
37.500.000 SEK a year.
Divided Baskets Original Basket Improvement
40 007 985
39 906 567
79 914 552 91 339 419 12,5%
Table 11, Premium reduction
The improvement-strategy includes dividing larger basket into smaller baskets. The
interesting factor concerns portfolio theory and the concept behind the diversification
effect. When additional assets are added to a basket, the risk is generally reduced. If the
correlations between currencies are too high, the diversification effect will not be fully
exploited. Instead we are separating currencies to correct the misuse of the concept of
applying a basket theory. As seen in “2011 Q2 - Q4”, an incorrect structure of a basket
will lead to a reduction of the diversification effect, which will increase the basket’s
variance in comparison to vanilla options (see table 12). Organizations that apply basket
options should carefully plan and investigate the structure of their baskets to understand
the actual effects.
Date Diversification Improvements
2011 Q2 -3%
2011 Q3 -9%
2011 Q4 -10%
Table 12, Reduction in diversification effect
Overall, organizations that are exposed to currency risks should constantly strive to find
the best hedging alternative. If the strategy involves a basket option, it is important to
realize the actual effects from the basket. The structure of the basket builds the foundation
of the hedging strategy’s outcome.
Page 48
Chapter 6 G.Carlsson & R.Ericsson Concluding Remarks
41
6 Concluding Remarks
In this last chapter, the research questions will be answered along with the purpose of this thesis. A
conclusion will be drawn from the empirical findings and the discussion in the analysis section. A shorter
section will present and discuss recommendations of further studies within this subject.
6.1 Conclusions
The range of hedging strategies is wide and complex, and it is difficult to select one strategy
as superior. The fundamental issue within corporations is to determine the most suitable
strategy according to their objectives and goals. Furthermore, corporations need to adapt
their strategy to the external environment. That is, corporations need to be aware that
hedging instruments behave differently in diverse environments. This thesis has mainly
focused on forward contracts and options, where some distinctive disparities are
recognized considering external circumstances. The connection between the objectives,
goals and the environment need to be linked before a strategy is selected and implemented.
The volatility of the market has a large impact of what hedging strategy a corporation
should implement. A high volatility will be reflected in an option’s premium, while a
forward contract is cost-free regardless of the financial climate. On the contrary, an option
has the possibility to capture rises, while a forward contract only protects corporations
from drops in the exchange market.
Multinational corporations ought to constantly seek for improved hedging strategies. An
innovative procedure is to combine hedging strategies to seize the benefits from several
alternatives. This thesis suggests that there is no superior hedging strategy, since
corporations need to adapt their strategy accordingly to their objectives.
To hedge or not to hedge has been actively discussed in this thesis among others. An in-
depth evaluation of the Layered Basket Option hedging model has been conducted
together with comparisons with other hedging strategies. The question still lies at hand, is
the Layered Basket Option hedging model the optimal strategy for a corporation such as
Sandvik AB? The role of the shareholders has been discussed in the analysis. The hedging
model must correspond to the overall goals and strategies throughout the organization as
well as the shareholders expectations.
The results have undoubtedly stated that the Layered Basket Option hedging strategy
should be implemented instead of following a spot rate strategy. The volatility in the
exchange rates becomes substantially diminished when this strategy is implemented. The
strategy of layering basket options of currencies allows the corporation to capture upward
trends and at the same time be secured from drops in the exchange rates. Improvements of
actively allocating optimal baskets allow lower premiums to be paid which will make it even
more attractive to the shareholders.
Page 49
Chapter 6 G.Carlsson & R.Ericsson Concluding Remarks
42
According to our results and discussions in our analysis the Layered Basket Option hedging
strategy is indeed an optimal strategy for Sandvik AB and other organizations with similar
currency risk management strategies.
6.2 Discussion and further studies
We have stated that the Layered Basket Option is the most suitable hedging strategy for
Sandvik AB and there are several motives in why this is stated. The layered approach
generates a lower volatility but the Layered Basket Option hedging strategy contributes
with certain attributes that cannot be ignored. The improvement possibilities sometimes
generate such favorable outcomes that cannot be overlooked. Also, during some time-
periods the layered forward approach is outperformed by the market, which is not
acceptable from a shareholders perspective. A layered forward approach also results in a
fixed cash flow since the corporation is obligated to fulfill the contract. Another downside
with the layered approach is the process of finding a second party in an agreement. A
counterpart may be in an unfavorable position in the market. Therefore, a corporation may
not always find a contract that meets their terms of conditions.
The Layered Basket Option hedging requires further investigations since it is a recently
developed model. It has been proven that there exist great potential with this model as far
as hedging currency risk is concerned. Furthermore, improvement possibilities have been
discovered and additional studies are required regarding this interesting finding.
This thesis has further shown evidence that currency risk hedging is a crucial process for
Sandvik and other corporations that are active on the global market. The investigated
effectiveness of the hedging strategies depends on how the volatility in the foreign
exchange market is calculated. To get the volatility right when pricing the premiums for the
basket options is fundamental to achieve fair evaluations of the Layered Basket Option
hedging model. The volatility we based our calculations on was received through portfolio
theory and we suggest that further studies regarding the estimation of the volatility are
conducted. Other models, such as a Monte Carlo simulation to determine the volatility
would provide further insight into the premium pricing of the Layered Basket Option.
“…stochastic volatility does not make a huge difference as far as the pricing is concerned if you get the
average volatility right. It makes a big difference as far as hedging is concerned.”
- John Hull –
Page 50
Chapter 7 G.Carlsson & R.Ericsson List of References
43
7 List of References
Aczel, A., & Sounderpandian, J. (2009). Complete business statistics (7 ed.). Boston: McGraw-Hill.
Armstrong, C., & Vashishtha, R. (2012). Executive Stock Options, differential risk-taking incentives and firm value. Journal of Financial Economics, 70-88.
Bakshi, G., Cao, C., & Chen, Z. (1997). Empirical Performance of Alternative Option Pricing Models. The Journal of Finance, 52(5), 2003-2049.
Balvers, R. J. (2001). Foundtations of Asset Pricing. West Virginia: West Virginia University.
Barth, J., Li, T., & Prabgavivadhana, A. (2011). Greece's "Unpleasant Arithmetic", containing the Threat to the Global Economy. Global Economy Journal, 11, 1-13.
Befring, & Andersson. (1994). Forskningsmetodik och statistik. Lund: Studentlitteratur.
Berk, J., & DeMarzo, P. (2011). Corporate Finance. Boston: Pearson Education Inc.
Black, F., & Scholes, M. S. (1973). The Pricing of Options and Corporate Liabilities. Journal of Political Economy, 81(3), 637-654.
Brown, G., & Toft, B. (2002). How firms should hedge. The Review of Financial Studies, 1283-1324.
Chen, Z. (2012). Dependence structure of risk factors and diversification effects. Insurance: Mathematics and Economics, 46(3), 531-540.
Chiang, A. C., & Wainwright, K. C. (2005). Fundamental Methods of Mathematical Economics (4th ed.). : McGraw Hill.
Churchill, G. (1999). Marketing Research:Methodological Foundations (7th ed.). Fort Worth: TX:Dryden Press.
Easterby-Smith, M., Thorpe, R., Jackson, P., & Lowe, A. (2008). Management Research (3rd ed.). London: Sage.
Edward, J., Schuck, Gerald, R., & Brown. (1997). Value weighting and real estate portfolio risk. Journal of Property Research, 3(14), 169-187.
Elton, J. E., Gruber, M. J., Brown, S. J., & Goetzmann, W. N. (2009). Modern Portfolio Theory and Investment Analysis. London: Wiley.
Eriksson, L. T., & Wiedersheim-Paul, F. (2011). Att utreda forska och rapportera (9th ed.). Malmö: Liber.
Ghauri, P., & Grønhaug, K. (2005). Research Methods in Business Studies: A Practical Guide (3rd ed.). Harlow: Financial Times Prentice Hall.
Hakala, J., & Wystrup, U. (2002). Foreign Exchange Risk: Models, Instruments and Strategies. London: Risk Waters Group Ltd.
Hirigoyen, D. (2003, May). The hedge tenor dilemma. The Tresasurer, 43-45.
Page 51
Chapter 7 G.Carlsson & R.Ericsson List of References
44
Hopper, G. P. (1996). Value at Risk: A new Methodology for Measuring Portfolio Risk. Federal Reserve Bank of Philadelphia, Business Review(July), 19-31.
Hull, J. (2003). Options, futures and other derivatives (5 ed.). Upper Saddle River: Prentice Hall Interantional.
Hull, J. (2012). Options, futures, and other derivatives (8th ed.). Upper Saddle River: Prentice Hall International.
Johnson, E., & Lidbark, J. (2009). Layered Basket Options: A Cost Efficient Approach to Reduce FX volatility . CSG Monthly.
Jorion, P. (2005). Financial Risk Manager Handbook (3rd ed.). Hoboken, New Jersey: Wiley.
Jorion, P. (2007). Business and the organization. New York: The McGraw-Hill Companies, Inc.
Leblang, D. (2003, December). To devalue or to defend? The political economy of exchange rate policy. International Studies Quartely, 47(4), 533-559.
Lidbark, J. (2006). Minimizing year-on-year currency impact on earnings: A layered hedging approach, The CitiFX Currency Advisor. Corporate Edition(11).
Lidbark, J. (2008). Diversifying the Accounting Impact: Hedging Forecasted Exposures, The CitiFX Currency Advisor. Corporate Edition(36), .
Lidbark, J., & Middleton, A. (2002). Back-testing FX hedging strategies from a EUR perspective. Journal of Risk Analysis, .
Lind, M., Polak, P., & Robertson, D. (2011). The New Role of the Corporate Treasurer: Emerging Trends in Response to the Financial Crisis. International Research Jounral of Finance and Economics, 78, 4869.
Linsmeier, T. J., & Pearson, N. D. (1996). Risk Measurement: An introduction to value at Risk. University of Illinois, 1-45.
Madan, D. (2009). Pricing and Hedging Basket Options to prespecified levels of acceptability. , .
Mahul, O. (2001). Hedging in Futures and Options Markets with Basis Risk. Journal of Futures Markets, 22(1), 59-72.
Markowitz, H. (1959). Portfolio Selection: Efficient Diversification of Investment. New York: John Wiley and Sons.
McDowell, M., Thom, R., Frank, R., & Bernanke, B. (2006). Principles of Economics, (European edition). Maidenhead: McGraw-Hill.
Milevsky, M., & Posner, S. (1998). Valuing Exotic Options by Approximating the SPD with Higher Moments. Journal of Financial Engineering, 7(2), 54-61.
Patel, R., & Davidsson, B. (2003). Forskningsmetodikens grunder - Att planera, genomföra och rapportera en undersökning (3rd edition ed.). Lund: Studentlitteratur.
Penza, P., & Bansal, V. (2001). Measuring Market Risk with Value at Risk. New York: John Wiley & Sons, Inc.
Page 52
Chapter 7 G.Carlsson & R.Ericsson List of References
45
Ramos, J., Staking, K., Calle, A., Beato, P., O'Shea, M. E., & Carrasco, B. (2000). Financial Risk Management. Washington D.C: Inter-American Development Bank.
Reiter, J., & Jönsson, C. (2002). Handelspolitik i förändring, Organisation och förhandling i Sverige, EU och WTO. Stockholm: Författarna och SNS förlag.
Saunders, M., Lewis, P., & Thornhill, A. (2009). Research methods for business students (5th ed.). Harlow: Financial Times Prentice Hall.
Shoup, G. (1998). Currency Risk Management, a Handbook for Financial Managers, Brokers, and Their Consultants. Chicago and London: Fitzroy Dearborn Publishers.
Turnball, S., & Wakemann, L. (1991). A quick algorithm for pricing European average options. The Journal of financial and quantitative analysis, 26(3), 377-389.
Wolf, M. (2001). Henry Bessemer and continous casting. Revue de Metallurgie, 98(1), 63-73.
Wong, K. P. (2003). Currency hedging with options and futures. European Economic Review, 47, 833-839.
Yunker, A. J., & Melkumian, A. (2013). Optimal Diversification and Risk-taking: a theoretical and empirical analysis. Applied Economics, 45(11), 1482-1492.
Zhang, P. G. (1995). An introduction to exotic options. European financial management, 1(1), 87-95.
Electronic Sources
Bank of Canada. (2012, February 15). Bank of Canada. Retrieved February 15, 2012, from Bank of Canada: http://www.bankofcanada.ca/rates/exchange/10-year-converter/
Centralbyrån, S. (2012, 02 15). Sverige Ekonomi, Kort och Lång Ränta. Retrieved 02 15, 2012, from Statistiska Centralbyrån: http://www.scb.se/Pages/TableAndChart____32290.aspx
IMF. (2011). Mild Slowdown of the Global Expansion, and increasing. Retrieved January 13, 2012, from International Monetary Fund: http://www.imf.org/external/pubs/ft/weo/2011/update/02/pdf/0611.pdf
Sandvik AB. (2012, January 24). Sandvik AB - Rapporter. Retrieved January 24, 2012, from Sandvik AB: http://www.sandvik.com/en/investor-relations/financial-information/reports/annual/
Schifferes, S. (2007, January 21). BBC News. Retrieved January 24, 2012, from BBC: http://news.bbc.co.uk/2/hi/business/6279679.stm#top
Interviews
Hamberg, T. (2012, April 16). Head of Corporate Fiance, Sandvik Financial Services. (G. Carlsson, & R. Ericsson, Interviewers) Sandviken.
Hamberg, T. (2012, January 12). Head of Corporate Finance, Sandvik Financial Services. (G. Carlsson, & R. Ericsson, Interviewers) Stockholm.
Page 53
Chapter 7 G.Carlsson & R.Ericsson List of References
46
Recommended Readings
Chang, C. (2009). To hedge or not to hedge: Revenue Management and Exchange rate Risk. Cornell Hospitality Quarterly, 50, 301.
Jacquier, E., & Marcus, A. J. (2001). Asset Allocation Models and Market Volatility. Financial Analysts Journal, 57(2), 16-30.
Muller, A., & Verschoor, W. (2005). Foreign Exchange Risk Exposure: Survey and Suggestions. Journal of Multinational Financial Management, 385-410.
Xidonas, P., Mavrotas, G., & Psarras, J. (2010). A multiple criteria decision-making approach for the selection of stocks. Journal of the Operational Research Society, 61(8), 1273-1287.
Page 54
Chapter 8 G.Carlsson & R.Ericsson Appendices
47
8 Appendices
8.1 Appendix 1-10 Basket Variance, Weights and Premiums 2003-2012
Appendix 1 - 2003
2003 Q1 Weight (wn) Annual volatil ity (σn) wnσn 2003 Q2 Weight (wn) Annual volatil ity (σn) wnσn
USD 35,94% 12,04% 4,33% USD 35,30% 11,59% 4,09%
AUD 10,95% 12,28% 1,34% AUD 11,56% 12,04% 1,39%
CAD 1,23% 11,86% 0,15% CAD 1,30% 11,61% 0,15%
CHF -19,50% 9,24% -1,80% CHF -19,58% 8,91% -1,74%
CZK 1,66% 11,72% 0,19% CZK 1,67% 11,59% 0,19%
EUR 1,73% 7,85% 0,14% EUR 1,77% 7,61% 0,13%
GBP 6,46% 10,16% 0,66% GBP 6,23% 10,13% 0,63%
ZAR 16,74% 22,56% 3,78% ZAR 17,87% 22,06% 3,94%
SGD -5,75% 10,88% -0,63% SGD -5,55% 10,81% -0,60%
PLN 3,40% 11,90% 0,41% PLN 3,12% 12,29% 0,38%
NOK -3,19% 7,82% -0,25% NOK -2,99% 8,86% -0,26%
KRW 5,80% 14,02% 0,81% KRW 5,41% 15,08% 0,82%
JPY 4,79% 13,61% 0,65% JPY 4,73% 12,53% 0,59%
CNY 27,45% 12,05% 3,31% CNY 26,97% 11,54% 3,11%
CPL 6,78% 15,58% 1,06% CPL 6,53% 16,92% 1,10%
INR -4,95% 12,35% -0,61% INR -4,92% 11,51% -0,57%
BRL 2,72% 32,97% 0,90% BRL 2,84% 34,65% 0,98%
RUB 7,74% 12,01% 0,93% RUB 7,75% 11,72% 0,91%
100% Indv. Std 15,36% 100% Indv. Std 15,26%
Basket Variance 1,72% Basket Variance 1,25%
Std. Basket 13,11% Std. Basket 11,17%
Premium using Black & Scholes Premium using Black & Scholes
3 months 14 007 115 3 months 13 909 690
6 months 19 127 601 6 months 13 320 801
9 months 21 467 996 9 months 18 499 389
12 months 23798439,4 12 months 18 200 476
TOTAL 78 401 151 TOTAL 63 930 356
2003 Q3 Weight (wn) Annual volatil ity (σn) wnσn 2003 Q4 Weight (wn) Annual volatil ity (σn) wnσn
USD 33,91% 11,91% 4,04% USD 33,34% 12,01% 4,00%
AUD 12,33% 11,80% 1,45% AUD 12,28% 12,71% 1,56%
CAD 1,35% 12,08% 0,16% CAD 1,33% 12,70% 0,17%
CHF -18,83% 8,79% -1,65% CHF -18,97% 7,62% -1,45%
CZK 1,72% 10,52% 0,18% CZK 1,69% 8,79% 0,15%
EUR 1,79% 6,98% 0,13% EUR 1,78% 6,18% 0,11%
GBP 6,27% 10,26% 0,64% GBP 6,20% 9,50% 0,59%
ZAR 18,06% 23,42% 4,23% ZAR 19,16% 23,11% 4,43%
SGD -5,35% 11,08% -0,59% SGD -5,35% 11,48% -0,61%
PLN 3,16% 12,88% 0,41% PLN 3,07% 11,92% 0,37%
NOK -2,89% 9,19% -0,27% NOK -2,91% 8,55% -0,25%
KRW 5,44% 15,75% 0,86% KRW 5,55% 15,39% 0,85%
JPY 4,48% 12,33% 0,55% JPY 4,74% 12,36% 0,59%
CNY 25,91% 11,86% 3,07% CNY 25,49% 12,03% 3,07%
CPL 6,62% 16,51% 1,09% CPL 6,86% 16,60% 1,14%
INR -4,84% 11,86% -0,57% INR -4,83% 12,14% -0,59%
BRL 3,18% 34,42% 1,09% BRL 3,05% 26,07% 0,80%
RUB 7,70% 12,01% 0,92% RUB 7,51% 12,21% 0,92%
100% Indv. Std 15,75% 100% Indv. Std 15,84%
Basket Variance 0,57% Basket Variance 0,61%
Std. Basket 7,53% Std. Basket 7,82%
Premium using Black & Scholes Premium using Black & Scholes
3 months 7 940 205 3 months 7 867 151
6 months 7 715 071 6 months 7 630 072
9 months 10 200 431 9 months 10 098 378
12 months 10 210 859 12 months 7 751 668
TOTAL 36 066 565 TOTAL 33 347 270
Page 55
Chapter 8 G.Carlsson & R.Ericsson Appendices
48
Appendix 2 - 2004
2004 Q1 Weight (wn) Annual volatil ity (σn) wnσn 2004 Q2 Weight (wn) Annual volatil ity (σn) wnσn
USD 32,48% 12,71% 4,13% USD 31,91% 14,34% 4,58%
AUD 13,24% 12,71% 1,68% AUD 13,18% 13,07% 1,72%
CAD 1,36% 12,16% 0,16% CAD 1,31% 12,89% 0,17%
CHF -19,70% 7,90% -1,56% CHF -18,90% 8,04% -1,52%
CZK 1,76% 8,64% 0,15% CZK 1,66% 8,34% 0,14%
EUR 1,88% 6,09% 0,11% EUR 1,80% 6,06% 0,11%
GBP 6,48% 10,07% 0,65% GBP 6,57% 10,26% 0,67%
ZAR 19,42% 23,93% 4,65% ZAR 20,21% 24,54% 4,96%
SGD -5,31% 11,51% -0,61% SGD -5,29% 12,74% -0,67%
PLN 3,16% 12,41% 0,39% PLN 3,00% 12,38% 0,37%
NOK -3,00% 8,38% -0,25% NOK -2,86% 9,02% -0,26%
KRW 5,22% 15,27% 0,80% KRW 5,33% 15,51% 0,83%
JPY 4,80% 12,15% 0,58% JPY 4,85% 13,67% 0,66%
CNY 24,82% 12,74% 3,16% CNY 24,38% 14,35% 3,50%
CPL 7,46% 17,82% 1,33% CPL 7,07% 17,35% 1,23%
INR -4,72% 13,04% -0,62% INR -4,87% 14,99% -0,73%
BRL 3,01% 22,06% 0,66% BRL 2,94% 20,44% 0,60%
RUB 7,65% 13,14% 1,01% RUB 7,70% 14,68% 1,13%
100% Indv. Std 16,44% 100% Indv. Std 17,49%
Basket Variance 0,82% Basket Variance 1,16%
Std. Basket 9,04% Std. Basket 10,79%
Premium using Black & Scholes Premium using Black & Scholes
3 months 7 449 896 3 months 13 673 055
6 months 9 750 897 6 months 15 926 486
9 months 12 072 467 9 months 18 258 958
12 months 12 001 268 12 months 17 920 955
TOTAL 41 274 528 TOTAL 65 779 454
2004 Q3 Weight (wn) Annual volatil ity (σn) wnσn 2004 Q4 Weight (wn) Annual volatil ity (σn) wnσn
USD 32,40% 14,71% 4,77% USD 32,32% 13,97% 4,51%
AUD 12,19% 13,98% 1,70% AUD 12,68% 12,29% 1,56%
CAD 1,30% 12,89% 0,17% CAD 1,38% 11,51% 0,16%
CHF -19,42% 8,01% -1,56% CHF -19,47% 7,08% -1,38%
CZK 1,72% 9,26% 0,16% CZK 1,77% 9,19% 0,16%
EUR 1,81% 6,19% 0,11% EUR 1,84% 5,16% 0,10%
GBP 6,57% 10,28% 0,68% GBP 6,55% 9,32% 0,61%
ZAR 20,79% 23,46% 4,88% ZAR 19,95% 22,64% 4,52%
SGD -5,23% 12,68% -0,66% SGD -5,33% 11,65% -0,62%
PLN 3,18% 11,77% 0,37% PLN 3,34% 11,56% 0,39%
NOK -2,87% 8,39% -0,24% NOK -2,96% 8,44% -0,25%
KRW 5,37% 15,37% 0,83% KRW 5,38% 14,58% 0,78%
JPY 4,69% 13,97% 0,66% JPY 4,64% 12,62% 0,59%
CNY 24,77% 14,72% 3,65% CNY 24,70% 13,98% 3,45%
CPL 6,92% 17,38% 1,20% CPL 7,21% 16,62% 1,20%
INR -4,66% 15,42% -0,72% INR -4,66% 14,64% -0,68%
BRL 2,80% 17,67% 0,49% BRL 3,03% 16,09% 0,49%
RUB 7,67% 15,02% 1,15% RUB 7,62% 14,25% 1,09%
100% Indv. Std 17,64% 100% Indv. Std 16,66%
Basket Variance 1,10% Basket Variance 1,25%
Std. Basket 10,50% Std. Basket 11,19%
Premium using Black & Scholes Premium using Black & Scholes
3 months 10 645 160 3 months 13 074 728
6 months 12 950 451 6 months 17 803 388
9 months 15 299 604 9 months 19 963 346
12 months 15 092 797 12 months 22 186 488
TOTAL 53 988 012 TOTAL 73 027 950
Page 56
Chapter 8 G.Carlsson & R.Ericsson Appendices
49
Appendix 3 – 2005
2005 Q1 Weight (wn) Annual volatil ity (σn) wnσn 2005 Q2 Weight (wn) Annual volatil ity (σn) wnσn
USD 30,80% 14,34% 4,42% USD 31,39% 13,09% 4,11%
AUD 13,00% 12,31% 1,60% AUD 13,13% 11,50% 1,51%
CAD 1,38% 11,81% 0,16% CAD 1,40% 10,84% 0,15%
CHF -20,26% 6,58% -1,33% CHF -19,70% 5,99% -1,18%
CZK 1,91% 9,12% 0,17% CZK 1,89% 8,52% 0,16%
EUR 1,91% 5,17% 0,10% EUR 1,87% 4,63% 0,09%
GBP 6,60% 9,33% 0,62% GBP 6,63% 8,54% 0,57%
ZAR 21,73% 20,87% 4,53% ZAR 20,16% 18,97% 3,82%
SGD -5,24% 11,69% -0,61% SGD -5,28% 10,42% -0,55%
PLN 3,72% 11,47% 0,43% PLN 3,61% 11,54% 0,42%
NOK -3,12% 8,43% -0,26% NOK -3,04% 6,88% -0,21%
KRW 5,70% 14,81% 0,84% KRW 5,91% 13,60% 0,80%
JPY 4,75% 12,75% 0,61% JPY 4,63% 10,79% 0,50%
CNY 23,53% 14,32% 3,37% CNY 23,97% 13,12% 3,15%
CPL 7,54% 15,98% 1,20% CPL 7,28% 14,93% 1,09%
INR -4,70% 14,90% -0,70% INR -4,75% 13,22% -0,63%
BRL 3,11% 15,91% 0,49% BRL 3,15% 15,53% 0,49%
RUB 7,65% 14,33% 1,10% RUB 7,75% 12,91% 1,00%
100% Indv. Std 16,73% 100% Indv. Std 15,28%
Basket Variance 1,20% Basket Variance 0,95%
Std. Basket 10,95% Std. Basket 9,72%
Premium using Black & Scholes Premium using Black & Scholes
3 months 9 966 011 3 months 10 311 472
6 months 14 587 989 6 months 12 534 323
9 months 14 233 819 9 months 12 225 379
12 months 16 414 838 12 months 14 623 124
TOTAL 55 202 657 TOTAL 49 694 299
2005 Q3 Weight (wn) Annual volatil ity (σn) wnσn 2005 Q4 Weight (wn) Annual volatil ity (σn) wnσn
USD 31,64% 12,63% 4,00% USD 30,80% 12,86% 3,96%
AUD 13,05% 10,22% 1,33% AUD 12,75% 9,87% 1,26%
CAD 1,39% 10,90% 0,15% CAD 1,43% 11,26% 0,16%
CHF -18,52% 5,38% -1,00% CHF -17,95% 5,49% -0,99%
CZK 1,77% 7,99% 0,14% CZK 1,75% 8,22% 0,14%
EUR 1,75% 4,58% 0,08% EUR 1,70% 4,90% 0,08%
GBP 6,34% 8,12% 0,52% GBP 6,10% 8,28% 0,50%
ZAR 18,93% 16,44% 3,11% ZAR 19,38% 14,73% 2,85%
SGD -5,21% 10,11% -0,53% SGD -5,06% 10,37% -0,52%
PLN 3,44% 12,00% 0,41% PLN 3,44% 12,75% 0,44%
NOK -2,98% 6,76% -0,20% NOK -2,90% 6,81% -0,20%
KRW 5,86% 12,63% 0,74% KRW 5,66% 12,76% 0,72%
JPY 4,52% 10,13% 0,46% JPY 4,30% 10,43% 0,45%
CNY 24,18% 12,65% 3,06% CNY 24,13% 12,95% 3,13%
CPL 7,43% 13,60% 1,01% CPL 7,92% 13,53% 1,07%
INR -4,81% 12,53% -0,60% INR -4,63% 12,63% -0,59%
BRL 3,59% 15,54% 0,56% BRL 3,73% 17,34% 0,65%
RUB 7,61% 12,01% 0,91% RUB 7,45% 11,58% 0,86%
100% Indv. Std 14,16% 100% Indv. Std 13,99%
Basket Variance 0,92% Basket Variance 1,40%
Std. Basket 9,58% Std. Basket 11,83%
Premium using Black & Scholes Premium using Black & Scholes
3 months 11 289 950 3 months 14 515 511
6 months 13 711 893 6 months 16 840 614
9 months 13 402 933 9 months 19 309 636
12 months 15 982 254 12 months 21 846 583
TOTAL 54 387 030 TOTAL 72 512 345
Page 57
Chapter 8 G.Carlsson & R.Ericsson Appendices
50
Appendix 4 - 2006
2006 Q1 Weight (wn) Annual volatil ity (σn) wnσn 2006 Q2 Weight (wn) Annual volatil ity (σn) wnσn
USD 30,88% 12,45% 3,84% USD 30,63% 12,11% 3,71%
AUD 12,26% 9,63% 1,18% AUD 11,88% 9,72% 1,16%
CAD 1,43% 11,15% 0,16% CAD 1,41% 11,71% 0,17%
CHF -17,61% 5,75% -1,01% CHF -17,66% 6,06% -1,07%
CZK 1,75% 8,47% 0,15% CZK 1,82% 8,66% 0,16%
EUR 1,68% 4,98% 0,08% EUR 1,71% 5,40% 0,09%
GBP 5,93% 8,28% 0,49% GBP 5,96% 8,49% 0,51%
ZAR 19,45% 13,80% 2,68% ZAR 19,88% 12,97% 2,58%
SGD -5,15% 10,17% -0,52% SGD -5,26% 10,35% -0,54%
PLN 3,45% 12,66% 0,44% PLN 3,44% 12,05% 0,41%
NOK -2,82% 7,44% -0,21% NOK -2,88% 8,00% -0,23%
KRW 5,84% 12,18% 0,71% KRW 6,03% 12,58% 0,76%
JPY 4,14% 10,27% 0,43% JPY 4,13% 11,00% 0,45%
CNY 24,20% 12,50% 3,02% CNY 24,17% 12,16% 2,94%
CPL 8,16% 13,61% 1,11% CPL 7,90% 13,91% 1,10%
INR -4,54% 11,93% -0,54% INR -4,55% 11,61% -0,53%
BRL 3,54% 19,59% 0,69% BRL 3,78% 19,84% 0,75%
RUB 7,40% 10,54% 0,78% RUB 7,61% 9,95% 0,76%
100% Indv. Std 13,48% 100% Indv. Std 13,16%
Basket Variance 1,54% Basket Variance 1,38%
Std. Basket 12,41% Std. Basket 11,74%
Premium using Black & Scholes Premium using Black & Scholes
3 months 14 938 619 3 months 14 675 800
6 months 20 341 383 6 months 17 026 577
9 months 22 809 257 9 months 19 522 864
12 months 22 469 322 12 months 22 087 826
TOTAL 80 558 581 TOTAL 73 313 068
2006 Q3 Weight (wn) Annual volatil ity (σn) wnσn 2006 Q4 Weight (wn) Annual volatil ity (σn) wnσn
USD 31,43% 12,29% 3,86% USD 31,55% 11,84% 3,74%
AUD 12,63% 10,09% 1,27% AUD 12,74% 9,96% 1,27%
CAD 1,52% 11,98% 0,18% CAD 1,52% 11,65% 0,18%
CHF -19,27% 6,17% -1,19% CHF -18,93% 6,32% -1,20%
CZK 1,96% 8,43% 0,17% CZK 1,97% 7,48% 0,15%
EUR 1,84% 5,45% 0,10% EUR 1,83% 5,54% 0,10%
GBP 6,50% 8,31% 0,54% GBP 6,60% 8,46% 0,56%
ZAR 17,51% 14,70% 2,57% ZAR 16,27% 15,71% 2,56%
SGD -5,51% 10,48% -0,58% SGD -5,52% 10,05% -0,55%
PLN 3,58% 11,77% 0,42% PLN 3,66% 10,53% 0,38%
NOK -3,11% 8,15% -0,25% NOK -2,98% 8,75% -0,26%
KRW 6,34% 13,03% 0,83% KRW 6,38% 12,86% 0,82%
JPY 4,34% 10,93% 0,48% JPY 4,23% 10,63% 0,45%
CNY 24,87% 12,35% 3,07% CNY 25,22% 11,73% 2,96%
CPL 7,94% 14,24% 1,13% CPL 8,00% 13,60% 1,09%
INR -4,53% 12,07% -0,55% INR -4,56% 11,69% -0,53%
BRL 3,89% 21,44% 0,83% BRL 3,90% 19,95% 0,78%
RUB 8,06% 9,77% 0,79% RUB 8,11% 9,41% 0,76%
100% Indv. Std 13,68% 100% Indv. Std 13,24%
Basket Variance 1,37% Basket Variance 1,43%
Std. Basket 11,69% Std. Basket 11,95%
Premium using Black & Scholes Premium using Black & Scholes
3 months 13 282 513 3 months 13 412 561
6 months 15 410 113 6 months 18 308 072
9 months 17 669 408 9 months 20 558 756
12 months 17 399 143 12 months 20 186 587
TOTAL 63 761 175 TOTAL 72 465 976
Page 58
Chapter 8 G.Carlsson & R.Ericsson Appendices
51
Appendix 5 - 2007
2007 Q1 Weight (wn) Annual volatil ity (σn) wnσn 2007 Q2 Weight (wn) Annual volatil ity (σn) wnσn
USD 30,70% 11,11% 3,41% USD 30,74% 10,83% 3,33%
AUD 13,10% 9,63% 1,26% AUD 13,49% 9,76% 1,32%
CAD 1,42% 11,49% 0,16% CAD 1,44% 11,34% 0,16%
CHF -18,89% 5,89% -1,11% CHF -19,03% 6,35% -1,21%
CZK 2,05% 6,92% 0,14% CZK 2,04% 7,26% 0,15%
EUR 1,86% 5,15% 0,10% EUR 1,88% 5,28% 0,10%
GBP 6,72% 7,64% 0,51% GBP 6,77% 7,99% 0,54%
ZAR 17,39% 16,69% 2,90% ZAR 16,83% 17,36% 2,92%
SGD -5,55% 9,59% -0,53% SGD -5,62% 9,25% -0,52%
PLN 3,84% 9,68% 0,37% PLN 3,86% 9,67% 0,37%
NOK -3,03% 8,44% -0,26% NOK -3,11% 8,41% -0,26%
KRW 6,32% 12,49% 0,79% KRW 6,25% 11,20% 0,70%
JPY 4,08% 9,93% 0,41% JPY 4,14% 10,40% 0,43%
CNY 24,87% 11,08% 2,76% CNY 25,14% 10,73% 2,70%
CPL 7,84% 12,08% 0,95% CPL 7,74% 11,43% 0,89%
INR -4,60% 11,33% -0,52% INR -4,71% 11,59% -0,55%
BRL 3,85% 17,36% 0,67% BRL 4,00% 16,03% 0,64%
RUB 8,03% 8,59% 0,69% RUB 8,15% 8,22% 0,67%
100% Indv. Std 12,70% 100% Indv. Std 12,38%
Basket Variance 1,36% Basket Variance 1,03%
Std. Basket 11,67% Std. Basket 10,17%
Premium using Black & Scholes Premium using Black & Scholes
3 months 12 889 667 3 months 10 372 898
6 months 14 954 340 6 months 12 646 431
9 months 17 146 814 9 months 14 928 286
12 months 16 884 542 12 months 12 283 109
TOTAL 61 875 363 TOTAL 50 230 723
2007 Q3 Weight (wn) Annual volatil ity (σn) wnσn 2007 Q4 Weight (wn) Annual volatil ity (σn) wnσn
USD 30,05% 9,85% 2,96% USD 29,56% 9,78% 2,89%
AUD 13,81% 9,37% 1,29% AUD 14,18% 11,55% 1,64%
CAD 1,52% 10,51% 0,16% CAD 1,60% 10,53% 0,17%
CHF -18,42% 6,62% -1,22% CHF -19,01% 7,01% -1,33%
CZK 1,97% 7,59% 0,15% CZK 2,13% 8,00% 0,17%
EUR 1,86% 5,63% 0,10% EUR 1,93% 5,56% 0,11%
GBP 6,74% 8,00% 0,54% GBP 6,74% 8,13% 0,55%
ZAR 17,03% 15,45% 2,63% ZAR 17,15% 14,71% 2,52%
SGD -5,45% 8,83% -0,48% SGD -5,53% 8,57% -0,47%
PLN 3,91% 8,94% 0,35% PLN 4,04% 8,29% 0,34%
NOK -3,14% 8,07% -0,25% NOK -3,36% 7,46% -0,25%
KRW 6,23% 10,33% 0,64% KRW 6,19% 10,13% 0,63%
JPY 3,85% 10,42% 0,40% JPY 4,07% 12,81% 0,52%
CNY 24,96% 9,78% 2,44% CNY 24,90% 9,72% 2,42%
CPL 7,76% 10,46% 0,81% CPL 7,87% 10,39% 0,82%
INR -4,89% 10,88% -0,53% INR -4,93% 10,81% -0,53%
BRL 4,17% 13,25% 0,55% BRL 4,31% 15,02% 0,65%
RUB 8,03% 7,76% 0,62% RUB 8,17% 7,62% 0,62%
100% Indv. Std 11,18% 100% Indv. Std 11,45%
Basket Variance 0,61% Basket Variance 0,56%
Std. Basket 7,78% Std. Basket 7,51%
Premium using Black & Scholes Premium using Black & Scholes
3 months 7 788 630 3 months 7 382 059
6 months 10 034 970 6 months 7 172 750
9 months 7 441 548 9 months 7 179 094
12 months 9 941 779 12 months 9 493 100
TOTAL 35 206 928 TOTAL 31 227 002
Page 59
Chapter 8 G.Carlsson & R.Ericsson Appendices
52
Appendix 6- 2008
2008 Q1 Weight (wn) Annual volatil ity (σn) wnσn 2008 Q2 Weight (wn) Annual volatil ity (σn) wnσn
USD 29,39% 10,29% 3,02% USD 29,84% 11,77% 3,51%
AUD 13,96% 12,85% 1,79% AUD 14,76% 14,01% 2,07%
CAD 1,60% 11,62% 0,19% CAD 1,56% 12,85% 0,20%
CHF -19,46% 7,62% -1,48% CHF -22,57% 9,00% -2,03%
CZK 2,24% 8,58% 0,19% CZK 2,60% 8,56% 0,22%
EUR 1,97% 5,62% 0,11% EUR 2,16% 5,58% 0,12%
GBP 6,52% 9,09% 0,59% GBP 6,63% 10,54% 0,70%
ZAR 17,11% 14,45% 2,47% ZAR 14,64% 16,86% 2,47%
SGD -5,67% 8,88% -0,50% SGD -6,01% 10,10% -0,61%
PLN 4,32% 8,42% 0,36% PLN 4,86% 7,65% 0,37%
NOK -3,33% 7,71% -0,26% NOK -3,61% 7,47% -0,27%
KRW 6,01% 10,53% 0,63% KRW 5,77% 13,26% 0,77%
JPY 4,16% 14,81% 0,62% JPY 4,73% 16,92% 0,80%
CNY 25,44% 10,02% 2,55% CNY 26,92% 11,60% 3,12%
CPL 8,02% 10,98% 0,88% CPL 9,32% 11,68% 1,09%
INR -4,94% 11,20% -0,55% INR -4,92% 12,27% -0,60%
BRL 4,42% 15,98% 0,71% BRL 4,58% 16,37% 0,75%
RUB 8,23% 7,76% 0,64% RUB 8,75% 8,12% 0,71%
100% Indv. Std 11,97% 100% Indv. Std 13,39%
Basket Variance 0,63% Basket Variance 1,00%
Std. Basket 7,96% Std. Basket 9,99%
Premium using Black & Scholes Premium using Black & Scholes
3 months 7 413 885 3 months 9 085 759
6 months 9 689 633 6 months 11 024 897
9 months 7 231 507 9 months 13 061 790
12 months 7 296 775 12 months 12 946 145
TOTAL 31 631 800 TOTAL 46 118 590
2008 Q3 Weight (wn) Annual volatil ity (σn) wnσn 2008 Q4 Weight (wn) Annual volatil ity (σn) wnσn
USD 29,41% 12,46% 3,66% USD 30,97% 14,07% 4,36%
AUD 15,23% 13,94% 2,12% AUD 13,25% 13,44% 1,78%
CAD 1,56% 13,61% 0,21% CAD 1,58% 14,05% 0,22%
CHF -21,63% 9,33% -2,02% CHF -20,78% 10,20% -2,12%
CZK 2,69% 8,31% 0,22% CZK 2,47% 10,22% 0,25%
EUR 2,12% 5,11% 0,11% EUR 2,00% 5,40% 0,11%
GBP 6,55% 11,36% 0,74% GBP 6,17% 11,80% 0,73%
ZAR 15,05% 19,06% 2,87% ZAR 14,88% 20,71% 3,08%
SGD -6,00% 10,36% -0,62% SGD -6,00% 11,56% -0,69%
PLN 5,01% 7,06% 0,35% PLN 4,66% 9,67% 0,45%
NOK -3,55% 7,53% -0,27% NOK -3,24% 7,55% -0,24%
KRW 5,38% 14,81% 0,80% KRW 4,91% 20,08% 0,99%
JPY 4,38% 17,25% 0,76% JPY 4,63% 18,02% 0,83%
CNY 27,13% 12,34% 3,35% CNY 28,61% 13,90% 3,98%
CPL 7,62% 14,35% 1,09% CPL 7,67% 16,72% 1,28%
INR -4,53% 12,77% -0,58% INR -4,41% 15,30% -0,67%
BRL 4,94% 16,55% 0,82% BRL 4,32% 16,80% 0,73%
RUB 8,63% 7,92% 0,68% RUB 8,31% 8,64% 0,72%
100% Indv. Std 14,31% 100% Indv. Std 15,77%
Basket Variance 1,32% Basket Variance 1,15%
Std. Basket 11,50% Std. Basket 10,73%
Premium using Black & Scholes Premium using Black & Scholes
3 months 9 395 171 3 months 12 972 672
6 months 13 801 475 6 months 12 451 870
9 months 15 779 845 9 months 14 762 020
12 months 17 813 368 12 months 14 536 645
TOTAL 56 789 859 TOTAL 54 723 207
Page 60
Chapter 8 G.Carlsson & R.Ericsson Appendices
53
Appendix 7 - 2009
2009 Q1 Weight (wn) Annual volatil ity (σn) wnσn 2009 Q2 Weight (wn) Annual volatil ity (σn) wnσn
USD 33,80% 23,10% 7,81% USD 33,97% 27,07% 9,19%
AUD 12,77% 25,01% 3,19% AUD 12,74% 26,01% 3,31%
CAD 1,49% 18,07% 0,27% CAD 1,45% 20,40% 0,30%
CHF -23,76% 16,99% -4,04% CHF -22,38% 20,94% -4,69%
CZK 2,44% 15,30% 0,37% CZK 2,29% 17,55% 0,40%
EUR 2,16% 11,49% 0,25% EUR 2,07% 14,61% 0,30%
GBP 5,53% 18,37% 1,02% GBP 5,44% 21,87% 1,19%
ZAR 14,46% 26,71% 3,86% ZAR 14,24% 26,93% 3,84%
SGD -6,52% 18,96% -1,24% SGD -6,20% 21,95% -1,36%
PLN 4,13% 18,21% 0,75% PLN 3,53% 21,51% 0,76%
NOK -2,98% 11,35% -0,34% NOK -3,10% 14,20% -0,44%
KRW 5,13% 37,10% 1,90% KRW 4,73% 38,72% 1,83%
JPY 5,89% 30,97% 1,83% JPY 5,42% 34,41% 1,87%
CNY 31,34% 22,87% 7,17% CNY 31,44% 26,84% 8,44%
CPL 7,20% 24,42% 1,76% CPL 7,92% 28,50% 2,26%
INR -4,60% 23,58% -1,08% INR -4,42% 25,82% -1,14%
BRL 3,91% 31,94% 1,25% BRL 3,95% 34,17% 1,35%
RUB 7,62% 17,80% 1,36% RUB 6,89% 22,73% 1,57%
100% Indv. Std 26,08% 100% Indv. Std 28,98%
Basket Variance 1,36% Basket Variance 2,78%
Std. Basket 11,65% Std. Basket 16,68%
Premium using Black & Scholes Premium using Black & Scholes
3 months 13 487 810 3 months 22 874 392
6 months 15 648 295 6 months 27 944 462
9 months 20 622 973 9 months 32 919 168
12 months 17 668 068 12 months 32 311 506
TOTAL 67 427 145 TOTAL 116 049 529
2009 Q3 Weight (wn) Annual volatil ity (σn) wnσn 2009 Q4 Weight (wn) Annual volatil ity (σn) wnσn
USD 31,52% 29,47% 9,29% USD 30,86% 30,02% 9,26%
AUD 13,75% 27,14% 3,73% AUD 14,75% 27,05% 3,99%
CAD 1,46% 21,45% 0,31% CAD 1,55% 21,73% 0,34%
CHF -21,77% 22,58% -4,92% CHF -22,32% 22,90% -5,11%
CZK 2,36% 18,72% 0,44% CZK 2,48% 18,22% 0,45%
EUR 2,03% 16,65% 0,34% EUR 2,07% 17,52% 0,36%
GBP 5,80% 23,11% 1,34% GBP 5,53% 23,67% 1,31%
ZAR 16,27% 26,81% 4,36% ZAR 16,36% 26,26% 4,30%
SGD -6,04% 23,84% -1,44% SGD -6,08% 24,29% -1,48%
PLN 3,59% 23,55% 0,85% PLN 3,89% 23,08% 0,90%
NOK -3,01% 15,44% -0,47% NOK -3,29% 15,81% -0,52%
KRW 4,73% 40,29% 1,91% KRW 5,02% 38,73% 1,95%
JPY 5,18% 36,89% 1,91% JPY 5,46% 37,76% 2,06%
CNY 29,19% 29,20% 8,52% CNY 28,59% 29,75% 8,50%
CPL 8,06% 29,57% 2,38% CPL 7,64% 29,24% 2,23%
INR -4,37% 27,57% -1,20% INR -4,24% 27,17% -1,15%
BRL 4,30% 34,69% 1,49% BRL 4,66% 33,97% 1,58%
RUB 6,96% 24,27% 1,69% RUB 7,08% 25,28% 1,79%
100% Indv. Std 30,54% 100% Indv. Std 30,76%
Basket Variance 3,38% Basket Variance 2,84%
Std. Basket 18,39% Std. Basket 16,84%
Premium using Black & Scholes Premium using Black & Scholes
3 months 23 152 221 3 months 21 281 054
6 months 31 148 399 6 months 25 997 962
9 months 36 236 007 9 months 27 957 956
12 months 41 267 732 12 months 32 477 352
TOTAL 131 804 359 TOTAL 107 714 324
Page 61
Chapter 8 G.Carlsson & R.Ericsson Appendices
54
Appendix 8 - 2010
2010 Q1 Weight (wn) Annual volatil ity (σn) wnσn 2010 Q2 Weight (wn) Annual volatil ity (σn) wnσn
USD 30,61% 24,87% 7,61% USD 30,54% 20,20% 6,17%
AUD 14,88% 16,33% 2,43% AUD 15,16% 13,76% 2,09%
CAD 1,58% 18,62% 0,29% CAD 1,62% 15,23% 0,25%
CHF -22,18% 18,66% -4,14% CHF -21,76% 13,53% -2,95%
CZK 2,32% 14,27% 0,33% CZK 2,26% 11,21% 0,25%
EUR 2,01% 14,93% 0,30% EUR 1,89% 12,15% 0,23%
GBP 5,54% 20,02% 1,11% GBP 5,19% 15,83% 0,82%
ZAR 16,57% 19,83% 3,29% ZAR 16,63% 16,70% 2,78%
SGD -6,05% 19,86% -1,20% SGD -6,06% 16,22% -0,98%
PLN 3,88% 17,63% 0,68% PLN 3,88% 13,79% 0,54%
NOK -3,25% 13,34% -0,43% NOK -3,16% 10,33% -0,33%
KRW 5,03% 23,95% 1,20% KRW 5,17% 20,39% 1,05%
JPY 5,20% 28,97% 1,51% JPY 5,17% 24,65% 1,27%
CNY 28,36% 24,70% 7,01% CNY 28,29% 20,07% 5,68%
CPL 8,20% 23,88% 1,96% CPL 7,93% 19,84% 1,57%
INR -4,36% 20,87% -0,91% INR -4,49% 17,55% -0,79%
BRL 4,70% 19,83% 0,93% BRL 4,60% 15,49% 0,71%
RUB 6,95% 21,26% 1,48% RUB 7,14% 16,23% 1,16%
100% Indv. Std 23,45% 100% Indv. Std 19,53%
Basket Variance 1,51% Basket Variance 1,60%
Std. Basket 12,30% Std. Basket 12,64%
Premium using Black & Scholes Premium using Black & Scholes
3 months 13 558 952 3 months 13 688 879
6 months 15 693 893 6 months 18 639 657
9 months 20 702 691 9 months 20 952 807
12 months 23 008 168 12 months 23 252 679
TOTAL 72 963 705 TOTAL 76 534 021
2010 Q3 Weight (wn) Annual volatil ity (σn) wnσn 2010 Q4 Weight (wn) Annual volatil ity (σn) wnσn
USD 31,39% 18,17% 5,70% USD 30,10% 17,19% 5,17%
AUD 14,41% 13,02% 1,88% AUD 15,71% 12,31% 1,93%
CAD 1,60% 14,12% 0,23% CAD 1,58% 14,05% 0,22%
CHF -21,86% 12,25% -2,68% CHF -23,03% 12,84% -2,96%
CZK 2,09% 9,92% 0,21% CZK 2,32% 9,32% 0,22%
EUR 1,77% 10,13% 0,18% EUR 1,88% 8,80% 0,17%
GBP 5,25% 14,29% 0,75% GBP 5,30% 13,87% 0,73%
ZAR 16,44% 15,12% 2,48% ZAR 17,18% 13,78% 2,37%
SGD -6,24% 14,26% -0,89% SGD -6,35% 13,20% -0,84%
PLN 3,39% 11,51% 0,39% PLN 3,74% 11,25% 0,42%
NOK -2,98% 8,89% -0,26% NOK -3,14% 7,94% -0,25%
KRW 4,92% 18,70% 0,92% KRW 5,05% 17,79% 0,90%
JPY 5,61% 24,25% 1,36% JPY 5,70% 22,58% 1,29%
CNY 29,27% 18,07% 5,29% CNY 28,45% 17,08% 4,86%
CPL 7,82% 17,36% 1,36% CPL 8,46% 16,71% 1,41%
INR -4,47% 14,98% -0,67% INR -4,47% 14,36% -0,64%
BRL 4,68% 13,08% 0,61% BRL 4,75% 12,97% 0,62%
RUB 6,93% 14,67% 1,02% RUB 6,77% 13,24% 0,90%
100% Indv. Std 17,87% 100% Indv. Std 16,52%
Basket Variance 2,37% Basket Variance 2,23%
Std. Basket 15,39% Std. Basket 14,93%
Premium using Black & Scholes Premium using Black & Scholes
3 months 17 266 535 3 months 18 436 981
6 months 25 482 945 6 months 23 112 581
9 months 27 711 757 9 months 25 171 414
12 months 29 957 371 12 months 27 242 123
TOTAL 100 418 608 TOTAL 93 963 099
Page 62
Chapter 8 G.Carlsson & R.Ericsson Appendices
55
Appendix 9 - 2011
2011 Q1 Weight (wn) Annual volatil ity (σn) wnσn 2011 Q2 Weight (wn) Annual volatil ity (σn) wnσn
USD 29,61% 16,20% 4,80% USD 29,55% 15,98% 4,72%
AUD 16,41% 12,45% 2,04% AUD 16,58% 13,05% 2,16%
CAD 1,60% 13,30% 0,21% CAD 1,64% 13,56% 0,22%
CHF -23,79% 13,58% -3,23% CHF -24,23% 14,84% -3,60%
CZK 2,21% 9,24% 0,20% CZK 2,38% 9,54% 0,23%
EUR 1,82% 8,13% 0,15% EUR 1,92% 8,33% 0,16%
GBP 5,17% 13,22% 0,68% GBP 5,31% 12,97% 0,69%
ZAR 17,96% 13,43% 2,41% ZAR 17,45% 14,02% 2,45%
SGD -6,40% 12,17% -0,78% SGD -6,51% 11,94% -0,78%
PLN 3,64% 11,55% 0,42% PLN 3,77% 11,44% 0,43%
NOK -3,13% 7,56% -0,24% NOK -3,29% 7,76% -0,26%
KRW 5,05% 16,94% 0,86% KRW 5,15% 16,61% 0,86%
JPY 5,78% 20,86% 1,21% JPY 5,65% 20,75% 1,17%
CNY 28,41% 16,04% 4,56% CNY 28,56% 15,79% 4,51%
CPL 8,60% 16,31% 1,40% CPL 8,43% 15,27% 1,29%
INR -4,38% 13,85% -0,61% INR -4,39% 13,98% -0,61%
BRL 4,78% 12,44% 0,59% BRL 4,86% 12,41% 0,60%
RUB 6,68% 12,16% 0,81% RUB 7,16% 12,14% 0,87%
100% Indv. Std 15,49% 100% Indv. Std 15,12%
Basket Variance 1,81% Basket Variance 2,42%
Std. Basket 13,44% Std. Basket 15,56%
Premium using Black & Scholes Premium using Black & Scholes
3 months 15 951 092 3 months 14 935 091
6 months 18 045 942 6 months 22 042 066
9 months 22 760 764 9 months 26 473 153
12 months 22 375 153 12 months 28 387 546
TOTAL 79 132 951 TOTAL 91 837 856
2011 Q3 Weight (wn) Annual volatil ity (σn) wnσn 2011 Q4 Weight (wn) Annual volatil ity (σn) wnσn
USD 29,65% 15,32% 4,54% USD 31,28% 16,97% 5,31%
AUD 17,22% 11,90% 2,05% AUD 16,51% 12,72% 2,10%
CAD 1,66% 12,87% 0,21% CAD 1,62% 13,48% 0,22%
CHF -26,45% 15,22% -4,03% CHF -25,94% 21,70% -5,63%
CZK 2,46% 8,67% 0,21% CZK 2,37% 10,18% 0,24%
EUR 1,98% 7,80% 0,15% EUR 1,93% 9,26% 0,18%
GBP 5,33% 12,86% 0,69% GBP 5,47% 13,42% 0,73%
ZAR 17,53% 13,46% 2,36% ZAR 15,58% 15,30% 2,38%
SGD -6,70% 11,51% -0,77% SGD -6,67% 12,47% -0,83%
PLN 3,93% 10,30% 0,40% PLN 3,46% 11,79% 0,41%
NOK -3,40% 7,60% -0,26% NOK -3,30% 8,02% -0,26%
KRW 5,32% 14,27% 0,76% KRW 5,07% 16,07% 0,81%
JPY 5,82% 17,84% 1,04% JPY 6,43% 18,81% 1,21%
CNY 29,01% 15,10% 4,38% CNY 31,00% 16,70% 5,18%
CPL 8,62% 14,56% 1,26% CPL 8,19% 15,72% 1,29%
INR -4,40% 14,30% -0,63% INR -4,22% 15,03% -0,63%
BRL 5,09% 12,85% 0,65% BRL 4,53% 14,09% 0,64%
RUB 7,33% 12,06% 0,88% RUB 6,69% 13,23% 0,88%
100% Indv. Std 13,91% 100% Indv. Std 14,22%
Basket Variance 2,32% Basket Variance 2,50%
Std. Basket 15,24% Std. Basket 15,81%
Premium using Black & Scholes Premium using Black & Scholes
3 months 17 434 378 3 months 17 924 931
6 months 21 929 035 6 months 22 498 961
9 months 23 847 012 9 months 24 446 843
12 months 25 779 448 12 months 26 468 683
TOTAL 88 989 872 TOTAL 91 339 419
Page 63
Chapter 8 G.Carlsson & R.Ericsson Appendices
56
Appendix 10 - 2012
2012 Q1 Weight (wn) Annual volatil ity (σn) wnσn
USD 30,47% 17,58% 5,36%
AUD 17,13% 12,80% 2,19%
CAD 1,63% 13,34% 0,22%
CHF -24,54% 21,18% -5,20%
CZK 2,15% 10,64% 0,23%
EUR 1,82% 9,12% 0,17%
GBP 5,34% 12,92% 0,69%
ZAR 15,17% 16,45% 2,50%
SGD -6,60% 12,26% -0,81%
PLN 3,24% 11,76% 0,38%
NOK -3,18% 7,71% -0,24%
KRW 5,09% 16,49% 0,84%
JPY 6,29% 19,49% 1,23%
CNY 30,62% 17,39% 5,33%
CPL 8,09% 15,85% 1,28%
INR -3,79% 15,96% -0,61%
BRL 4,45% 14,84% 0,66%
RUB 6,62% 13,03% 0,86%
100% Indv. Std 15,07%
Basket Variance 1,28%
Std. Basket 11,33%
Premium using Black & Scholes
3 months 13 019 345
6 months 15 128 460
9 months 17 297 047
12 months 16 991 664
TOTAL 62 436 516
Page 64
Chapter 8 G.Carlsson & R.Ericsson Appendices
57
8.2 Appendix 11-20 – Correlation 2003-2012
Appendix 11- Correlation 2003
2003 Q1 USD AUD CAD CHF CZK EUR GBP ZAR SGD PLN NOK KRW JPY CNY CPL INR BRL RUB
USD 1 0,8672 0,9634 0,0360 -0,1318 0,0421 0,7630 -0,0287 0,9747 0,9072 -0,8161 0,6338 0,6543 1,0000 0,9566 0,9966 0,9495 0,9992
AUD 0,8672 1 0,9408 0,0182 0,0278 0,0334 0,4966 0,2363 0,8477 0,8827 -0,6285 0,6297 0,5872 0,8670 0,9194 0,8359 0,8989 0,8676
CAD 0,9634 0,9408 1 0,0680 -0,0148 0,0875 0,6543 0,0617 0,9604 0,8930 -0,7331 0,7080 0,7083 0,9635 0,9653 0,9424 0,9665 0,9664
CHF 0,0360 0,0182 0,0680 1 0,6463 0,9572 0,4641 0,1182 0,2009 -0,0117 0,4083 0,5412 0,5739 0,0365 0,0378 0,0111 0,0348 0,0304
CZK -0,1318 0,0278 -0,0148 0,6463 1 0,6784 0,1608 -0,0561 -0,0093 -0,2188 0,5306 0,4337 0,4265 -0,1313 -0,1061 -0,1849 -0,0496 -0,1329
EUR 0,0421 0,0334 0,0875 0,9572 0,6784 1 0,4563 0,1125 0,2233 -0,0291 0,4299 0,6052 0,6125 0,0426 0,0442 0,0147 0,0410 0,0382
GBP 0,7630 0,4966 0,6543 0,4641 0,1608 0,4563 1 -0,1194 0,7963 0,6231 -0,4544 0,5974 0,6551 0,7633 0,6489 0,7749 0,6326 0,7532
ZAR -0,0287 0,2363 0,0617 0,1182 -0,0561 0,1125 -0,1194 1 -0,0171 0,2652 0,1505 -0,0021 -0,1435 -0,0293 0,1623 -0,0396 0,0511 -0,0325
SGD 0,9747 0,8477 0,9604 0,2009 -0,0093 0,2233 0,7963 -0,0171 1 0,8639 -0,7146 0,7636 0,7881 0,9749 0,9420 0,9649 0,9432 0,9753
PLN 0,9072 0,8827 0,8930 -0,0117 -0,2188 -0,0291 0,6231 0,2652 0,8639 1 -0,7751 0,4613 0,4705 0,9070 0,9517 0,9047 0,9086 0,9052
NOK -0,8161 -0,6285 -0,7331 0,4083 0,5306 0,4299 -0,4544 0,1505 -0,7146 -0,7751 1 -0,2199 -0,2556 -0,8159 -0,7749 -0,8351 -0,7780 -0,8203
KRW 0,6338 0,6297 0,7080 0,5412 0,4337 0,6052 0,5974 -0,0021 0,7636 0,4613 -0,2199 1 0,9375 0,6342 0,6409 0,5914 0,6693 0,6389
JPY 0,6543 0,5872 0,7083 0,5739 0,4265 0,6125 0,6551 -0,1435 0,7881 0,4705 -0,2556 0,9375 1 0,6548 0,6445 0,6191 0,6884 0,6585
CNY 1,0000 0,8670 0,9635 0,0365 -0,1313 0,0426 0,7633 -0,0293 0,9749 0,9070 -0,8159 0,6342 0,6548 1 0,9565 0,9966 0,9494 0,9993
CPL 0,9566 0,9194 0,9653 0,0378 -0,1061 0,0442 0,6489 0,1623 0,9420 0,9517 -0,7749 0,6409 0,6445 0,9565 1 0,9426 0,9788 0,9578
INR 0,9966 0,8359 0,9424 0,0111 -0,1849 0,0147 0,7749 -0,0396 0,9649 0,9047 -0,8351 0,5914 0,6191 0,9966 0,9426 1 0,9320 0,9950
BRL 0,9495 0,8989 0,9665 0,0348 -0,0496 0,0410 0,6326 0,0511 0,9432 0,9086 -0,7780 0,6693 0,6884 0,9494 0,9788 0,9320 1 0,9552
RUB 0,9992 0,8676 0,9664 0,0304 -0,1329 0,0382 0,7532 -0,0325 0,9753 0,9052 -0,8203 0,6389 0,6585 0,9993 0,9578 0,9950 0,9552 1
2003 Q2 USD AUD CAD CHF CZK EUR GBP ZAR SGD PLN NOK KRW JPY CNY CPL INR BRL RUB
USD 1 0,8213 0,9438 0,1559 0,6062 0,0962 0,8628 -0,4621 0,9821 0,8854 0,0122 0,8299 0,8490 1,0000 0,9679 0,9975 0,9022 0,9971
AUD 0,8213 1 0,9330 0,1079 0,4078 0,1064 0,4858 -0,0313 0,7773 0,8218 -0,2986 0,5863 0,6263 0,8212 0,8710 0,8160 0,9079 0,8489
CAD 0,9438 0,9330 1 0,1892 0,5833 0,1730 0,6949 -0,2682 0,9215 0,8383 -0,1750 0,7469 0,8124 0,9439 0,9488 0,9376 0,9474 0,9614
CHF 0,1559 0,1079 0,1892 1 0,4443 0,9456 0,3413 0,0600 0,2608 0,1013 0,1568 0,3288 0,4335 0,1563 0,1401 0,1553 0,1961 0,1684
CZK 0,6062 0,4078 0,5833 0,4443 1 0,4552 0,6981 -0,5655 0,6819 0,3686 0,3546 0,7774 0,8133 0,6068 0,5420 0,5739 0,5254 0,5981
EUR 0,0962 0,1064 0,1730 0,9456 0,4552 1 0,2567 0,1049 0,2001 0,0136 0,0926 0,2725 0,3938 0,0966 0,0892 0,0945 0,1573 0,1147
GBP 0,8628 0,4858 0,6949 0,3413 0,6981 0,2567 1 -0,6284 0,8918 0,7268 0,3472 0,8438 0,8220 0,8628 0,7799 0,8615 0,6545 0,8344
ZAR -0,4621 -0,0313 -0,2682 0,0600 -0,5655 0,1049 -0,6284 1 -0,5013 -0,1953 -0,4660 -0,5990 -0,5636 -0,4624 -0,3086 -0,4410 -0,2053 -0,4224
SGD 0,9821 0,7773 0,9215 0,2608 0,6819 0,2001 0,8918 -0,5013 1 0,8553 0,1311 0,9047 0,9209 0,9822 0,9519 0,9732 0,8818 0,9746
PLN 0,8854 0,8218 0,8383 0,1013 0,3686 0,0136 0,7268 -0,1953 0,8553 1 -0,0112 0,6756 0,6368 0,8851 0,9340 0,8871 0,8838 0,8835
NOK 0,0122 -0,2986 -0,1750 0,1568 0,3546 0,0926 0,3472 -0,4660 0,1311 -0,0112 1 0,4306 0,2544 0,0123 -0,0274 -0,0216 -0,1838 -0,0485
KRW 0,8299 0,5863 0,7469 0,3288 0,7774 0,2725 0,8438 -0,5990 0,9047 0,6756 0,4306 1 0,9412 0,8299 0,7997 0,8000 0,7109 0,8079
JPY 0,8490 0,6263 0,8124 0,4335 0,8133 0,3938 0,8220 -0,5636 0,9209 0,6368 0,2544 0,9412 1 0,8494 0,8090 0,8269 0,7629 0,8425
CNY 1,0000 0,8212 0,9439 0,1563 0,6068 0,0966 0,8628 -0,4624 0,9822 0,8851 0,0123 0,8299 0,8494 1 0,9678 0,9974 0,9021 0,9971
CPL 0,9679 0,8710 0,9488 0,1401 0,5420 0,0892 0,7799 -0,3086 0,9519 0,9340 -0,0274 0,7997 0,8090 0,9678 1 0,9620 0,9526 0,9708
INR 0,9975 0,8160 0,9376 0,1553 0,5739 0,0945 0,8615 -0,4410 0,9732 0,8871 -0,0216 0,8000 0,8269 0,9974 0,9620 1 0,8969 0,9955
BRL 0,9022 0,9079 0,9474 0,1961 0,5254 0,1573 0,6545 -0,2053 0,8818 0,8838 -0,1838 0,7109 0,7629 0,9021 0,9526 0,8969 1 0,9232
RUB 0,9971 0,8489 0,9614 0,1684 0,5981 0,1147 0,8344 -0,4224 0,9746 0,8835 -0,0485 0,8079 0,8425 0,9971 0,9708 0,9955 0,9232 1
2003 Q3 USD AUD CAD CHF CZK EUR GBP ZAR SGD PLN NOK KRW JPY CNY CPL INR BRL RUB
USD 1 -0,0659 0,6415 0,7357 0,6863 0,2336 0,9605 -0,6776 0,9872 0,8430 0,8459 0,9518 0,9522 1,0000 0,9284 0,9975 0,3296 0,9876
AUD -0,0659 1 0,5928 -0,2057 0,2767 0,2437 -0,1528 0,0668 -0,0819 -0,3622 -0,3971 -0,0751 -0,0045 -0,0648 0,0302 -0,0405 0,4742 0,0450
CAD 0,6415 0,5928 1 0,3182 0,7544 0,3921 0,5358 -0,5134 0,6280 0,2658 0,2509 0,6014 0,6795 0,6425 0,7115 0,6540 0,7293 0,7392
CHF 0,7357 -0,2057 0,3182 1 0,5286 0,6447 0,7549 -0,3328 0,7792 0,6792 0,7581 0,7614 0,8155 0,7353 0,6192 0,7196 0,1915 0,6845
CZK 0,6863 0,2767 0,7544 0,5286 1 0,4949 0,6857 -0,6549 0,7140 0,4812 0,5383 0,7476 0,7665 0,6869 0,7375 0,6674 0,7075 0,7380
EUR 0,2336 0,2437 0,3921 0,6447 0,4949 1 0,2696 -0,0551 0,3004 0,0861 0,1598 0,3258 0,4296 0,2337 0,2638 0,2293 0,4842 0,2708
GBP 0,9605 -0,1528 0,5358 0,7549 0,6857 0,2696 1 -0,7177 0,9665 0,8815 0,8773 0,9559 0,9168 0,9603 0,8888 0,9551 0,2659 0,9377
ZAR -0,6776 0,0668 -0,5134 -0,3328 -0,6549 -0,0551 -0,7177 1 -0,7025 -0,5649 -0,5888 -0,7015 -0,6488 -0,6781 -0,6323 -0,6653 -0,3096 -0,7020
SGD 0,9872 -0,0819 0,6280 0,7792 0,7140 0,3004 0,9665 -0,7025 1 0,8634 0,8727 0,9783 0,9750 0,9872 0,9325 0,9789 0,3668 0,9711
PLN 0,8430 -0,3622 0,2658 0,6792 0,4812 0,0861 0,8815 -0,5649 0,8634 1 0,9315 0,8705 0,7879 0,8425 0,8166 0,8255 0,1111 0,7748
NOK 0,8459 -0,3971 0,2509 0,7581 0,5383 0,1598 0,8773 -0,5888 0,8727 0,9315 1 0,8758 0,8178 0,8453 0,7802 0,8216 0,1286 0,7721
KRW 0,9518 -0,0751 0,6014 0,7614 0,7476 0,3258 0,9559 -0,7015 0,9783 0,8705 0,8758 1 0,9643 0,9517 0,9305 0,9382 0,4328 0,9371
JPY 0,9522 -0,0045 0,6795 0,8155 0,7665 0,4296 0,9168 -0,6488 0,9750 0,7879 0,8178 0,9643 1 0,9522 0,9206 0,9417 0,4928 0,9491
CNY 1,0000 -0,0648 0,6425 0,7353 0,6869 0,2337 0,9603 -0,6781 0,9872 0,8425 0,8453 0,9517 0,9522 1 0,9286 0,9975 0,3304 0,9878
CPL 0,9284 0,0302 0,7115 0,6192 0,7375 0,2638 0,8888 -0,6323 0,9325 0,8166 0,7802 0,9305 0,9206 0,9286 1 0,9227 0,5451 0,9380
INR 0,9975 -0,0405 0,6540 0,7196 0,6674 0,2293 0,9551 -0,6653 0,9789 0,8255 0,8216 0,9382 0,9417 0,9975 0,9227 1 0,3225 0,9895
BRL 0,3296 0,4742 0,7293 0,1915 0,7075 0,4842 0,2659 -0,3096 0,3668 0,1111 0,1286 0,4328 0,4928 0,3304 0,5451 0,3225 1 0,4271
RUB 0,9876 0,0450 0,7392 0,6845 0,7380 0,2708 0,9377 -0,7020 0,9711 0,7748 0,7721 0,9371 0,9491 0,9878 0,9380 0,9895 0,4271 1
2003 Q4 USD AUD CAD CHF CZK EUR GBP ZAR SGD PLN NOK KRW JPY CNY CPL INR BRL RUB
USD 1 -0,4312 0,0534 0,7224 0,5923 -0,1064 0,9477 -0,5447 0,9858 0,8647 0,8112 0,9185 0,9386 1,0000 0,8322 0,9603 -0,5846 0,9604
AUD -0,4312 1 0,7694 -0,6902 -0,5784 0,2608 -0,5180 0,5974 -0,4777 -0,6428 -0,8044 -0,3254 -0,3748 -0,4309 -0,1637 -0,1909 0,7225 -0,1943
CAD 0,0534 0,7694 1 -0,4072 -0,2156 0,1335 -0,0922 0,2762 -0,0254 -0,2933 -0,4717 0,0139 0,0406 0,0543 0,2541 0,2636 0,5067 0,2875
CHF 0,7224 -0,6902 -0,4072 1 0,6131 0,2675 0,7307 -0,4345 0,7662 0,7719 0,8511 0,6151 0,7159 0,7220 0,3308 0,5726 -0,7567 0,5603
CZK 0,5923 -0,5784 -0,2156 0,6131 1 0,0256 0,6542 -0,7537 0,5932 0,6512 0,6784 0,4204 0,4397 0,5924 0,3004 0,4235 -0,5171 0,5099
EUR -0,1064 0,2608 0,1335 0,2675 0,0256 1 -0,1365 0,3205 -0,0957 -0,1072 -0,1471 -0,1400 -0,1104 -0,1069 -0,3242 -0,0521 0,1153 -0,0496
GBP 0,9477 -0,5180 -0,0922 0,7307 0,6542 -0,1365 1 -0,6621 0,9605 0,8951 0,8639 0,9182 0,8880 0,9475 0,7732 0,8774 -0,6549 0,8771
ZAR -0,5447 0,5974 0,2762 -0,4345 -0,7537 0,3205 -0,6621 1 -0,5777 -0,6045 -0,6633 -0,4788 -0,4285 -0,5450 -0,3404 -0,3916 0,5983 -0,4475
SGD 0,9858 -0,4777 -0,0254 0,7662 0,5932 -0,0957 0,9605 -0,5777 1 0,9027 0,8561 0,9402 0,9506 0,9858 0,8120 0,9316 -0,6375 0,9221
PLN 0,8647 -0,6428 -0,2933 0,7719 0,6512 -0,1072 0,8951 -0,6045 0,9027 1 0,9316 0,8584 0,7904 0,8642 0,6992 0,7511 -0,6347 0,7455
NOK 0,8112 -0,8044 -0,4717 0,8511 0,6784 -0,1471 0,8639 -0,6633 0,8561 0,9316 1 0,7656 0,7645 0,8108 0,5802 0,6452 -0,7558 0,6365
KRW 0,9185 -0,3254 0,0139 0,6151 0,4204 -0,1400 0,9182 -0,4788 0,9402 0,8584 0,7656 1 0,9179 0,9182 0,8489 0,9181 -0,5191 0,8826
JPY 0,9386 -0,3748 0,0406 0,7159 0,4397 -0,1104 0,8880 -0,4285 0,9506 0,7904 0,7645 0,9179 1 0,9385 0,8180 0,9195 -0,5606 0,8848
CNY 1,0000 -0,4309 0,0543 0,7220 0,5924 -0,1069 0,9475 -0,5450 0,9858 0,8642 0,8108 0,9182 0,9385 1 0,8322 0,9604 -0,5843 0,9605
CPL 0,8322 -0,1637 0,2541 0,3308 0,3004 -0,3242 0,7732 -0,3404 0,8120 0,6992 0,5802 0,8489 0,8180 0,8322 1 0,8743 -0,2227 0,8504
INR 0,9603 -0,1909 0,2636 0,5726 0,4235 -0,0521 0,8774 -0,3916 0,9316 0,7511 0,6452 0,9181 0,9195 0,9604 0,8743 1 -0,4175 0,9879
BRL -0,5846 0,7225 0,5067 -0,7567 -0,5171 0,1153 -0,6549 0,5983 -0,6375 -0,6347 -0,7558 -0,5191 -0,5606 -0,5843 -0,2227 -0,4175 1 -0,4057
RUB 0,9604 -0,1943 0,2875 0,5603 0,5099 -0,0496 0,8771 -0,4475 0,9221 0,7455 0,6365 0,8826 0,8848 0,9605 0,8504 0,9879 -0,4057 1
Page 65
Chapter 8 G.Carlsson & R.Ericsson Appendices
58
Appendix 12 - Correlation 2004
2004 Q1 USD AUD CAD CHF CZK EUR GBP ZAR SGD PLN NOK KRW JPY CNY CPL INR BRL RUB
USD 1 -0,5734 0,0822 0,8628 0,6123 0,6919 0,8318 -0,3166 0,9839 0,8793 0,7639 0,9136 0,6597 1,0000 -0,1137 0,9396 -0,1348 0,9312
AUD -0,5734 1 0,5689 -0,7748 -0,7200 -0,3558 -0,5139 0,7223 -0,5999 -0,7612 -0,8281 -0,4603 -0,1441 -0,5736 0,5676 -0,3015 0,4503 -0,2683
CAD 0,0822 0,5689 1 -0,2969 -0,1699 0,1466 -0,1805 0,4377 -0,0052 -0,2317 -0,4855 0,1043 0,0859 0,0825 0,2083 0,3390 0,7067 0,3304
CHF 0,8628 -0,7748 -0,2969 1 0,7582 0,7195 0,8109 -0,5196 0,8917 0,8889 0,9004 0,7150 0,5197 0,8628 -0,3274 0,6695 -0,4680 0,6837
CZK 0,6123 -0,7200 -0,1699 0,7582 1 0,6994 0,5197 -0,6685 0,6136 0,7511 0,6793 0,4657 0,0447 0,6123 -0,6386 0,3987 -0,1475 0,4391
EUR 0,6919 -0,3558 0,1466 0,7195 0,6994 1 0,5345 -0,3527 0,6756 0,6843 0,4688 0,5823 0,1884 0,6920 -0,3594 0,6458 0,0221 0,7010
GBP 0,8318 -0,5139 -0,1805 0,8109 0,5197 0,5345 1 -0,3803 0,8696 0,7827 0,8086 0,8004 0,7047 0,8315 0,0627 0,7381 -0,4027 0,7450
ZAR -0,3166 0,7223 0,4377 -0,5196 -0,6685 -0,3527 -0,3803 1 -0,3821 -0,5585 -0,5705 -0,3115 0,1048 -0,3168 0,6332 -0,0974 0,3195 -0,0809
SGD 0,9839 -0,5999 -0,0052 0,8917 0,6136 0,6756 0,8696 -0,3821 1 0,9021 0,8168 0,9276 0,6913 0,9838 -0,1173 0,9045 -0,2325 0,8897
PLN 0,8793 -0,7612 -0,2317 0,8889 0,7511 0,6843 0,7827 -0,5585 0,9021 1 0,8890 0,8382 0,4082 0,8791 -0,3303 0,7221 -0,2323 0,7177
NOK 0,7639 -0,8281 -0,4855 0,9004 0,6793 0,4688 0,8086 -0,5705 0,8168 0,8890 1 0,6856 0,4985 0,7636 -0,2186 0,5377 -0,5141 0,5273
KRW 0,9136 -0,4603 0,1043 0,7150 0,4657 0,5823 0,8004 -0,3115 0,9276 0,8382 0,6856 1 0,6556 0,9134 -0,0502 0,9140 -0,0626 0,8559
JPY 0,6597 -0,1441 0,0859 0,5197 0,0447 0,1884 0,7047 0,1048 0,6913 0,4082 0,4985 0,6556 1 0,6596 0,4834 0,7016 -0,2881 0,6604
CNY 1,0000 -0,5736 0,0825 0,8628 0,6123 0,6920 0,8315 -0,3168 0,9838 0,8791 0,7636 0,9134 0,6596 1 -0,1140 0,9397 -0,1345 0,9312
CPL -0,1137 0,5676 0,2083 -0,3274 -0,6386 -0,3594 0,0627 0,6332 -0,1173 -0,3303 -0,2186 -0,0502 0,4834 -0,1140 1 0,0725 0,1452 0,0805
INR 0,9396 -0,3015 0,3390 0,6695 0,3987 0,6458 0,7381 -0,0974 0,9045 0,7221 0,5377 0,9140 0,7016 0,9397 0,0725 1 0,0693 0,9771
BRL -0,1348 0,4503 0,7067 -0,4680 -0,1475 0,0221 -0,4027 0,3195 -0,2325 -0,2323 -0,5141 -0,0626 -0,2881 -0,1345 0,1452 0,0693 1 0,0665
RUB 0,9312 -0,2683 0,3304 0,6837 0,4391 0,7010 0,7450 -0,0809 0,8897 0,7177 0,5273 0,8559 0,6604 0,9312 0,0805 0,9771 0,0665 1
2004 Q2 USD AUD CAD CHF CZK EUR GBP ZAR SGD PLN NOK KRW JPY CNY CPL INR BRL RUB
USD 1 -0,5750 0,7733 0,7231 0,6255 0,2748 -0,0642 0,0807 0,9841 0,8770 0,7525 0,9364 0,3868 1,0000 -0,4744 0,9528 0,8385 0,8375
AUD -0,5750 1 -0,2888 -0,5385 -0,7001 0,1952 0,6463 0,3823 -0,4989 -0,7436 -0,8209 -0,4195 0,2209 -0,5754 0,8359 -0,3576 -0,4628 -0,0824
CAD 0,7733 -0,2888 1 0,2819 0,3606 0,0249 -0,1526 0,2198 0,7608 0,5721 0,4500 0,8214 0,4911 0,7733 -0,2906 0,8413 0,8364 0,6618
CHF 0,7231 -0,5385 0,2819 1 0,7319 0,6180 0,1432 -0,1608 0,7454 0,8139 0,7721 0,5571 0,1040 0,7232 -0,4738 0,5853 0,4415 0,6175
CZK 0,6255 -0,7001 0,3606 0,7319 1 0,3046 -0,1718 -0,3688 0,6057 0,7894 0,7602 0,4787 -0,2269 0,6254 -0,7857 0,4414 0,5369 0,3373
EUR 0,2748 0,1952 0,0249 0,6180 0,3046 1 0,6605 -0,1073 0,3650 0,3270 0,0778 0,2720 -0,0051 0,2746 -0,0043 0,2983 0,1744 0,5716
GBP -0,0642 0,6463 -0,1526 0,1432 -0,1718 0,6605 1 0,2528 0,0280 -0,2335 -0,3443 -0,0112 0,2733 -0,0645 0,5101 0,0601 -0,1590 0,4187
ZAR 0,0807 0,3823 0,2198 -0,1608 -0,3688 -0,1073 0,2528 1 0,0922 -0,1845 -0,0807 0,1577 0,6112 0,0802 0,4906 0,2492 0,0103 0,2799
SGD 0,9841 -0,4989 0,7608 0,7454 0,6057 0,3650 0,0280 0,0922 1 0,8598 0,7174 0,9473 0,4292 0,9841 -0,4409 0,9579 0,8130 0,8753
PLN 0,8770 -0,7436 0,5721 0,8139 0,7894 0,3270 -0,2335 -0,1845 0,8598 1 0,8480 0,7726 0,0407 0,8770 -0,6849 0,7419 0,7413 0,6133
NOK 0,7525 -0,8209 0,4500 0,7721 0,7602 0,0778 -0,3443 -0,0807 0,7174 0,8480 1 0,5685 0,0890 0,7524 -0,6593 0,5796 0,5311 0,4048
KRW 0,9364 -0,4195 0,8214 0,5571 0,4787 0,2720 -0,0112 0,1577 0,9473 0,7726 0,5685 1 0,4543 0,9364 -0,4058 0,9684 0,8779 0,8473
JPY 0,3868 0,2209 0,4911 0,1040 -0,2269 -0,0051 0,2733 0,6112 0,4292 0,0407 0,0890 0,4543 1 0,3867 0,4225 0,5556 0,2732 0,5509
CNY 1,0000 -0,5754 0,7733 0,7232 0,6254 0,2746 -0,0645 0,0802 0,9841 0,8770 0,7524 0,9364 0,3867 1 -0,4747 0,9528 0,8384 0,8373
CPL -0,4744 0,8359 -0,2906 -0,4738 -0,7857 -0,0043 0,5101 0,4906 -0,4409 -0,6849 -0,6593 -0,4058 0,4225 -0,4747 1 -0,2988 -0,4599 -0,0793
INR 0,9528 -0,3576 0,8413 0,5853 0,4414 0,2983 0,0601 0,2492 0,9579 0,7419 0,5796 0,9684 0,5556 0,9528 -0,2988 1 0,8370 0,9088
BRL 0,8385 -0,4628 0,8364 0,4415 0,5369 0,1744 -0,1590 0,0103 0,8130 0,7413 0,5311 0,8779 0,2732 0,8384 -0,4599 0,8370 1 0,6806
RUB 0,8375 -0,0824 0,6618 0,6175 0,3373 0,5716 0,4187 0,2799 0,8753 0,6133 0,4048 0,8473 0,5509 0,8373 -0,0793 0,9088 0,6806 1
2004 Q3 USD AUD CAD CHF CZK EUR GBP ZAR SGD PLN NOK KRW JPY CNY CPL INR BRL RUB
USD 1 -0,3184 0,8326 0,4217 0,4112 0,2300 -0,1667 0,0911 0,9634 0,8444 0,6631 0,9637 0,4189 1,0000 -0,4665 0,9486 0,8218 0,8186
AUD -0,3184 1 -0,1012 -0,2915 -0,4744 0,3379 0,4000 -0,0147 -0,1448 -0,4779 -0,5134 -0,2787 0,2603 -0,3188 0,8287 -0,1360 -0,0044 0,0475
CAD 0,8326 -0,1012 1 0,0563 0,1344 -0,0150 -0,3683 0,0901 0,7784 0,6727 0,4794 0,7767 0,5841 0,8323 -0,2062 0,7941 0,8945 0,5678
CHF 0,4217 -0,2915 0,0563 1 0,7093 0,7045 0,5231 0,2900 0,4764 0,5542 0,4563 0,4667 0,0656 0,4219 -0,4343 0,4260 0,0198 0,6221
CZK 0,4112 -0,4744 0,1344 0,7093 1 0,3193 0,2884 0,2664 0,3888 0,4996 0,5452 0,4185 -0,0808 0,4110 -0,6279 0,3689 0,0454 0,4131
EUR 0,2300 0,3379 -0,0150 0,7045 0,3193 1 0,6517 0,0003 0,3486 0,2979 -0,0258 0,2611 0,0180 0,2299 0,0764 0,2884 0,1080 0,6125
GBP -0,1667 0,4000 -0,3683 0,5231 0,2884 0,6517 1 0,3720 0,0194 -0,2324 -0,0966 -0,0315 0,1171 -0,1667 0,2665 0,0138 -0,3734 0,3746
ZAR 0,0911 -0,0147 0,0901 0,2900 0,2664 0,0003 0,3720 1 0,1835 0,0100 0,4066 0,1705 0,4002 0,0911 -0,0313 0,2126 -0,1819 0,2488
SGD 0,9634 -0,1448 0,7784 0,4764 0,3888 0,3486 0,0194 0,1835 1 0,7703 0,6446 0,9726 0,5322 0,9635 -0,3391 0,9830 0,7819 0,9025
PLN 0,8444 -0,4779 0,6727 0,5542 0,4996 0,2979 -0,2324 0,0100 0,7703 1 0,5732 0,8004 0,1712 0,8444 -0,6213 0,7131 0,6415 0,6132
NOK 0,6631 -0,5134 0,4794 0,4563 0,5452 -0,0258 -0,0966 0,4066 0,6446 0,5732 1 0,6406 0,2557 0,6632 -0,5725 0,6763 0,3555 0,5213
KRW 0,9637 -0,2787 0,7767 0,4667 0,4185 0,2611 -0,0315 0,1705 0,9726 0,8004 0,6406 1 0,5096 0,9638 -0,4500 0,9599 0,7709 0,8404
JPY 0,4189 0,2603 0,5841 0,0656 -0,0808 0,0180 0,1171 0,4002 0,5322 0,1712 0,2557 0,5096 1 0,4193 0,2268 0,5715 0,4606 0,4820
CNY 1,0000 -0,3188 0,8323 0,4219 0,4110 0,2299 -0,1667 0,0911 0,9635 0,8444 0,6632 0,9638 0,4193 1 -0,4665 0,9487 0,8216 0,8186
CPL -0,4665 0,8287 -0,2062 -0,4343 -0,6279 0,0764 0,2665 -0,0313 -0,3391 -0,6213 -0,5725 -0,4500 0,2268 -0,4665 1 -0,3113 -0,1588 -0,1642
INR 0,9486 -0,1360 0,7941 0,4260 0,3689 0,2884 0,0138 0,2126 0,9830 0,7131 0,6763 0,9599 0,5715 0,9487 -0,3113 1 0,7862 0,8890
BRL 0,8218 -0,0044 0,8945 0,0198 0,0454 0,1080 -0,3734 -0,1819 0,7819 0,6415 0,3555 0,7709 0,4606 0,8216 -0,1588 0,7862 1 0,5819
RUB 0,8186 0,0475 0,5678 0,6221 0,4131 0,6125 0,3746 0,2488 0,9025 0,6132 0,5213 0,8404 0,4820 0,8186 -0,1642 0,8890 0,5819 1
2004 Q4 USD AUD CAD CHF CZK EUR GBP ZAR SGD PLN NOK KRW JPY CNY CPL INR BRL RUB
USD 1 -0,1093 0,6000 0,1481 0,2157 -0,0797 0,1521 0,3818 0,8945 0,1199 0,6468 0,8750 0,6382 0,9999 -0,1550 0,8706 0,5026 0,7262
AUD -0,1093 1 -0,0711 -0,3496 -0,5655 0,3377 0,1689 -0,2416 0,1157 -0,6244 -0,3962 -0,1674 0,3895 -0,1098 0,8098 0,2369 0,3362 0,2792
CAD 0,6000 -0,0711 1 -0,1717 0,1208 -0,2870 -0,2154 0,2876 0,4860 0,3896 0,3204 0,5400 0,5160 0,5990 0,0270 0,4106 0,7346 0,1909
CHF 0,1481 -0,3496 -0,1717 1 0,7705 0,6581 0,7638 0,5689 0,2112 0,5356 0,3412 0,3617 -0,0517 0,1483 -0,5179 0,0298 -0,5271 0,3846
CZK 0,2157 -0,5655 0,1208 0,7705 1 0,3163 0,5171 0,6321 0,1792 0,7652 0,4076 0,3972 -0,2014 0,2152 -0,6439 -0,0448 -0,3930 0,1607
EUR -0,0797 0,3377 -0,2870 0,6581 0,3163 1 0,8671 0,1942 0,1397 0,1346 -0,1504 0,1109 0,0017 -0,0797 0,1407 0,0114 -0,2920 0,5041
GBP 0,1521 0,1689 -0,2154 0,7638 0,5171 0,8671 1 0,4543 0,3669 0,2391 0,0757 0,3811 0,0671 0,1518 -0,0633 0,2078 -0,3491 0,6642
ZAR 0,3818 -0,2416 0,2876 0,5689 0,6321 0,1942 0,4543 1 0,3890 0,5248 0,4684 0,4961 0,1742 0,3808 -0,4401 0,2344 -0,1833 0,3281
SGD 0,8945 0,1157 0,4860 0,2112 0,1792 0,1397 0,3669 0,3890 1 0,0632 0,5822 0,9073 0,7086 0,8945 0,0259 0,9262 0,4879 0,8583
PLN 0,1199 -0,6244 0,3896 0,5356 0,7652 0,1346 0,2391 0,5248 0,0632 1 0,2610 0,3446 -0,1757 0,1197 -0,5403 -0,2201 -0,1386 -0,0395
NOK 0,6468 -0,3962 0,3204 0,3412 0,4076 -0,1504 0,0757 0,4684 0,5822 0,2610 1 0,5682 0,2714 0,6465 -0,4580 0,5413 0,0524 0,3789
KRW 0,8750 -0,1674 0,5400 0,3617 0,3972 0,1109 0,3811 0,4961 0,9073 0,3446 0,5682 1 0,5954 0,8748 -0,2555 0,7799 0,3922 0,7316
JPY 0,6382 0,3895 0,5160 -0,0517 -0,2014 0,0017 0,0671 0,1742 0,7086 -0,1757 0,2714 0,5954 1 0,6384 0,2552 0,7606 0,6085 0,5548
CNY 0,9999 -0,1098 0,5990 0,1483 0,2152 -0,0797 0,1518 0,3808 0,8945 0,1197 0,6465 0,8748 0,6384 1 -0,1550 0,8709 0,5021 0,7266
CPL -0,1550 0,8098 0,0270 -0,5179 -0,6439 0,1407 -0,0633 -0,4401 0,0259 -0,5403 -0,4580 -0,2555 0,2552 -0,1550 1 0,1260 0,4673 0,1467
INR 0,8706 0,2369 0,4106 0,0298 -0,0448 0,0114 0,2078 0,2344 0,9262 -0,2201 0,5413 0,7799 0,7606 0,8709 0,1260 1 0,5428 0,7990
BRL 0,5026 0,3362 0,7346 -0,5271 -0,3930 -0,2920 -0,3491 -0,1833 0,4879 -0,1386 0,0524 0,3922 0,6085 0,5021 0,4673 0,5428 1 0,2322
RUB 0,7262 0,2792 0,1909 0,3846 0,1607 0,5041 0,6642 0,3281 0,8583 -0,0395 0,3789 0,7316 0,5548 0,7266 0,1467 0,7990 0,2322 1
Page 66
Chapter 8 G.Carlsson & R.Ericsson Appendices
59
Appendix 13 - Correlation 2005
2005 Q1 USD AUD CAD CHF CZK EUR GBP ZAR SGD PLN NOK KRW JPY CNY CPL INR BRL RUB
USD 1 0,3630 0,1630 0,4528 -0,2260 0,7734 0,8480 0,1194 0,9626 -0,5481 0,1772 0,5419 0,7847 1,0000 0,3824 0,8991 0,3138 0,9516
AUD 0,3630 1 -0,0270 -0,2543 -0,7398 0,6015 0,4178 -0,3388 0,4398 -0,7456 -0,4191 -0,0789 0,6361 0,3627 0,8039 0,4987 0,5304 0,4992
CAD 0,1630 -0,0270 1 0,1654 0,1601 -0,0209 -0,0778 0,2732 0,2469 0,4036 0,3689 0,3461 0,1524 0,1634 -0,0467 0,0403 0,5064 0,0398
CHF 0,4528 -0,2543 0,1654 1 0,4816 0,3950 0,5453 0,6226 0,3905 0,1316 0,4999 0,5381 0,3622 0,4529 -0,4501 0,3109 -0,3561 0,3700
CZK -0,2260 -0,7398 0,1601 0,4816 1 -0,2934 -0,1062 0,6711 -0,2551 0,7786 0,5035 0,3091 -0,4185 -0,2260 -0,7244 -0,3123 -0,4087 -0,3282
EUR 0,7734 0,6015 -0,0209 0,3950 -0,2934 1 0,8585 0,0501 0,7199 -0,5886 -0,1749 0,2348 0,7565 0,7727 0,5081 0,6991 0,2474 0,8128
GBP 0,8480 0,4178 -0,0778 0,5453 -0,1062 0,8585 1 0,3093 0,8073 -0,5301 0,0237 0,5098 0,7598 0,8476 0,2852 0,8077 0,0970 0,8807
ZAR 0,1194 -0,3388 0,2732 0,6226 0,6711 0,0501 0,3093 1 0,1482 0,4743 0,4695 0,6175 0,0790 0,1195 -0,4919 0,1188 -0,1795 0,0990
SGD 0,9626 0,4398 0,2469 0,3905 -0,2551 0,7199 0,8073 0,1482 1 -0,5301 0,2480 0,6346 0,8461 0,9627 0,4223 0,9446 0,4427 0,9497
PLN -0,5481 -0,7456 0,4036 0,1316 0,7786 -0,5886 -0,5301 0,4743 -0,5301 1 0,3685 0,1153 -0,5930 -0,5478 -0,6728 -0,6266 -0,1761 -0,6357
NOK 0,1772 -0,4191 0,3689 0,4999 0,5035 -0,1749 0,0237 0,4695 0,2480 0,3685 1 0,6183 0,0382 0,1777 -0,5149 0,2285 -0,0519 0,1143
KRW 0,5419 -0,0789 0,3461 0,5381 0,3091 0,2348 0,5098 0,6175 0,6346 0,1153 0,6183 1 0,4969 0,5424 -0,1346 0,6224 0,2673 0,5757
JPY 0,7847 0,6361 0,1524 0,3622 -0,4185 0,7565 0,7598 0,0790 0,8461 -0,5930 0,0382 0,4969 1 0,7849 0,5181 0,8404 0,4300 0,8419
CNY 1,0000 0,3627 0,1634 0,4529 -0,2260 0,7727 0,8476 0,1195 0,9627 -0,5478 0,1777 0,5424 0,7849 1 0,3821 0,8993 0,3140 0,9517
CPL 0,3824 0,8039 -0,0467 -0,4501 -0,7244 0,5081 0,2852 -0,4919 0,4223 -0,6728 -0,5149 -0,1346 0,5181 0,3821 1 0,4765 0,6952 0,4770
INR 0,8991 0,4987 0,0403 0,3109 -0,3123 0,6991 0,8077 0,1188 0,9446 -0,6266 0,2285 0,6224 0,8404 0,8993 0,4765 1 0,4156 0,9580
BRL 0,3138 0,5304 0,5064 -0,3561 -0,4087 0,2474 0,0970 -0,1795 0,4427 -0,1761 -0,0519 0,2673 0,4300 0,3140 0,6952 0,4156 1 0,3696
RUB 0,9516 0,4992 0,0398 0,3700 -0,3282 0,8128 0,8807 0,0990 0,9497 -0,6357 0,1143 0,5757 0,8419 0,9517 0,4770 0,9580 0,3696 1
2005 Q2 USD AUD CAD CHF CZK EUR GBP ZAR SGD PLN NOK KRW JPY CNY CPL INR BRL RUB
USD 1 0,3188 0,1497 0,5938 -0,6241 0,7766 0,8833 0,0824 0,9580 -0,8095 0,0701 -0,1168 0,8310 1,0000 0,4264 0,8661 -0,0550 0,9373
AUD 0,3188 1 0,2773 -0,0179 -0,0729 0,4395 0,3681 0,0823 0,5213 -0,1867 0,2012 0,4838 0,5693 0,3186 0,6477 0,5859 0,5738 0,4912
CAD 0,1497 0,2773 1 -0,0348 -0,1722 0,1091 -0,0521 -0,1033 0,2081 0,0353 -0,0523 -0,0187 0,1891 0,1498 0,2448 -0,0175 0,3700 0,0406
CHF 0,5938 -0,0179 -0,0348 1 -0,2836 0,6774 0,7205 0,4714 0,4538 -0,4972 0,0635 -0,2210 0,5021 0,5935 -0,2184 0,3536 -0,5141 0,4999
CZK -0,6241 -0,0729 -0,1722 -0,2836 1 -0,1395 -0,3920 0,0945 -0,5496 0,8822 -0,0128 0,6456 -0,5409 -0,6248 -0,1918 -0,4578 0,2609 -0,4501
EUR 0,7766 0,4395 0,1091 0,6774 -0,1395 1 0,8738 0,3479 0,7704 -0,4363 0,1192 0,2061 0,7228 0,7759 0,3590 0,7330 0,0323 0,8266
GBP 0,8833 0,3681 -0,0521 0,7205 -0,3920 0,8738 1 0,3893 0,8406 -0,6685 0,0152 0,0349 0,8067 0,8829 0,3026 0,8168 -0,1309 0,8947
ZAR 0,0824 0,0823 -0,1033 0,4714 0,0945 0,3479 0,3893 1 0,0276 0,0447 -0,4449 -0,0065 0,2239 0,0821 -0,0600 0,0173 -0,1609 0,0886
SGD 0,9580 0,5213 0,2081 0,4538 -0,5496 0,7704 0,8406 0,0276 1 -0,7393 0,1343 0,0749 0,8896 0,9579 0,5931 0,9376 0,1578 0,9609
PLN -0,8095 -0,1867 0,0353 -0,4972 0,8822 -0,4363 -0,6685 0,0447 -0,7393 1 -0,1880 0,4603 -0,6864 -0,8099 -0,2181 -0,7093 0,3451 -0,7127
NOK 0,0701 0,2012 -0,0523 0,0635 -0,0128 0,1192 0,0152 -0,4449 0,1343 -0,1880 1 0,1234 0,0497 0,0697 -0,1152 0,1951 -0,1467 0,1593
KRW -0,1168 0,4838 -0,0187 -0,2210 0,6456 0,2061 0,0349 -0,0065 0,0749 0,4603 0,1234 1 0,1011 -0,1175 0,3739 0,2156 0,6237 0,1700
JPY 0,8310 0,5693 0,1891 0,5021 -0,5409 0,7228 0,8067 0,2239 0,8896 -0,6864 0,0497 0,1011 1 0,8311 0,5590 0,8647 0,1461 0,8585
CNY 1,0000 0,3186 0,1498 0,5935 -0,6248 0,7759 0,8829 0,0821 0,9579 -0,8099 0,0697 -0,1175 0,8311 1 0,4264 0,8661 -0,0551 0,9372
CPL 0,4264 0,6477 0,2448 -0,2184 -0,1918 0,3590 0,3026 -0,0600 0,5931 -0,2181 -0,1152 0,3739 0,5590 0,4264 1 0,6534 0,7482 0,5508
INR 0,8661 0,5859 -0,0175 0,3536 -0,4578 0,7330 0,8168 0,0173 0,9376 -0,7093 0,1951 0,2156 0,8647 0,8661 0,6534 1 0,1960 0,9630
BRL -0,0550 0,5738 0,3700 -0,5141 0,2609 0,0323 -0,1309 -0,1609 0,1578 0,3451 -0,1467 0,6237 0,1461 -0,0551 0,7482 0,1960 1 0,0885
RUB 0,9373 0,4912 0,0406 0,4999 -0,4501 0,8266 0,8947 0,0886 0,9609 -0,7127 0,1593 0,1700 0,8585 0,9372 0,5508 0,9630 0,0885 1
2005 Q3 USD AUD CAD CHF CZK EUR GBP ZAR SGD PLN NOK KRW JPY CNY CPL INR BRL RUB
USD 1 0,4792 0,6767 0,7168 -0,0436 0,7594 0,8612 0,0453 0,9428 -0,2869 0,3417 0,3012 0,8714 1,0000 0,5486 0,8014 0,4198 0,8818
AUD 0,4792 1 0,7574 0,5830 0,7146 0,7372 0,6074 -0,1537 0,6995 0,5493 0,8530 0,8823 0,6355 0,4793 0,8143 0,8286 0,8785 0,7405
CAD 0,6767 0,7574 1 0,5489 0,2562 0,6105 0,5289 -0,3494 0,7950 0,1619 0,7454 0,5765 0,7060 0,6772 0,7252 0,7683 0,7019 0,7124
CHF 0,7168 0,5830 0,5489 1 0,1589 0,8133 0,8358 0,3098 0,7005 -0,1488 0,5030 0,3838 0,7511 0,7165 0,4053 0,6605 0,4061 0,7205
CZK -0,0436 0,7146 0,2562 0,1589 1 0,4975 0,2614 -0,0992 0,2293 0,8908 0,6544 0,8563 0,1534 -0,0441 0,6079 0,5093 0,7003 0,3976
EUR 0,7594 0,7372 0,6105 0,8133 0,4975 1 0,8943 0,1527 0,8294 0,1703 0,6130 0,6428 0,7547 0,7587 0,6866 0,8705 0,6335 0,9088
GBP 0,8612 0,6074 0,5289 0,8358 0,2614 0,8943 1 0,3008 0,8452 -0,0663 0,4282 0,4719 0,8003 0,8608 0,5473 0,8186 0,4793 0,8973
ZAR 0,0453 -0,1537 -0,3494 0,3098 -0,0992 0,1527 0,3008 1 -0,0896 -0,2054 -0,3627 -0,2838 0,0291 0,0450 -0,2738 -0,1277 -0,3434 -0,0359
SGD 0,9428 0,6995 0,7950 0,7005 0,2293 0,8294 0,8452 -0,0896 1 -0,0005 0,5678 0,5678 0,9137 0,9428 0,7440 0,9305 0,6626 0,9529
PLN -0,2869 0,5493 0,1619 -0,1488 0,8908 0,1703 -0,0663 -0,2054 -0,0005 1 0,5204 0,6997 -0,0568 -0,2872 0,4846 0,2738 0,5788 0,1105
NOK 0,3417 0,8530 0,7454 0,5030 0,6544 0,6130 0,4282 -0,3627 0,5678 0,5204 1 0,8583 0,5067 0,3417 0,7482 0,7283 0,8735 0,6170
KRW 0,3012 0,8823 0,5765 0,3838 0,8563 0,6428 0,4719 -0,2838 0,5678 0,6997 0,8583 1 0,4909 0,3010 0,8341 0,7936 0,9340 0,6861
JPY 0,8714 0,6355 0,7060 0,7511 0,1534 0,7547 0,8003 0,0291 0,9137 -0,0568 0,5067 0,4909 1 0,8715 0,6384 0,8468 0,5717 0,8547
CNY 1,0000 0,4793 0,6772 0,7165 -0,0441 0,7587 0,8608 0,0450 0,9428 -0,2872 0,3417 0,3010 0,8715 1 0,5487 0,8014 0,4200 0,8817
CPL 0,5486 0,8143 0,7252 0,4053 0,6079 0,6866 0,5473 -0,2738 0,7440 0,4846 0,7482 0,8341 0,6384 0,5487 1 0,8834 0,9365 0,7765
INR 0,8014 0,8286 0,7683 0,6605 0,5093 0,8705 0,8186 -0,1277 0,9305 0,2738 0,7283 0,7936 0,8468 0,8014 0,8834 1 0,8420 0,9654
BRL 0,4198 0,8785 0,7019 0,4061 0,7003 0,6335 0,4793 -0,3434 0,6626 0,5788 0,8735 0,9340 0,5717 0,4200 0,9365 0,8420 1 0,7141
RUB 0,8818 0,7405 0,7124 0,7205 0,3976 0,9088 0,8973 -0,0359 0,9529 0,1105 0,6170 0,6861 0,8547 0,8817 0,7765 0,9654 0,7141 1
2005 Q4 USD AUD CAD CHF CZK EUR GBP ZAR SGD PLN NOK KRW JPY CNY CPL INR BRL RUB
USD 1 0,9197 0,9310 0,8734 0,6807 0,9174 0,8839 0,1946 0,9865 0,5695 0,9064 0,8366 0,9068 0,9901 0,8879 0,9630 0,9241 0,9617
AUD 0,9197 1 0,8971 0,8955 0,8297 0,9313 0,9211 0,2826 0,9505 0,7400 0,9292 0,9386 0,8856 0,9221 0,8926 0,9544 0,9513 0,9558
CAD 0,9310 0,8971 1 0,8797 0,7124 0,8878 0,8137 0,3672 0,9143 0,6384 0,9323 0,7766 0,8192 0,9565 0,9237 0,8928 0,9029 0,8963
CHF 0,8734 0,8955 0,8797 1 0,7065 0,9035 0,8744 0,3100 0,8786 0,5712 0,9356 0,8302 0,8426 0,8761 0,8264 0,8761 0,8840 0,8789
CZK 0,6807 0,8297 0,7124 0,7065 1 0,8551 0,8192 0,4643 0,7419 0,9301 0,8090 0,8934 0,6311 0,7205 0,8467 0,8120 0,8440 0,8259
EUR 0,9174 0,9313 0,8878 0,9035 0,8551 1 0,9043 0,3678 0,9392 0,7236 0,9289 0,9085 0,8307 0,9241 0,9078 0,9590 0,9391 0,9642
GBP 0,8839 0,9211 0,8137 0,8744 0,8192 0,9043 1 0,2532 0,8968 0,6945 0,8870 0,9169 0,8471 0,8760 0,8453 0,9244 0,9119 0,9395
ZAR 0,1946 0,2826 0,3672 0,3100 0,4643 0,3678 0,2532 1 0,2161 0,5228 0,3367 0,2269 0,1208 0,2766 0,4668 0,2353 0,3516 0,2379
SGD 0,9865 0,9505 0,9143 0,8786 0,7419 0,9392 0,8968 0,2161 1 0,6288 0,9175 0,8885 0,9235 0,9810 0,8962 0,9796 0,9397 0,9750
PLN 0,5695 0,7400 0,6384 0,5712 0,9301 0,7236 0,6945 0,5228 0,6288 1 0,6957 0,7724 0,5468 0,6149 0,7687 0,7003 0,7443 0,7007
NOK 0,9064 0,9292 0,9323 0,9356 0,8090 0,9289 0,8870 0,3367 0,9175 0,6957 1 0,8934 0,8368 0,9273 0,9181 0,9308 0,9522 0,9346
KRW 0,8366 0,9386 0,7766 0,8302 0,8934 0,9085 0,9169 0,2269 0,8885 0,7724 0,8934 1 0,8322 0,8365 0,8490 0,9407 0,9362 0,9431
JPY 0,9068 0,8856 0,8192 0,8426 0,6311 0,8307 0,8471 0,1208 0,9235 0,5468 0,8368 0,8322 1 0,8810 0,7790 0,9107 0,8580 0,8875
CNY 0,9901 0,9221 0,9565 0,8761 0,7205 0,9241 0,8760 0,2766 0,9810 0,6149 0,9273 0,8365 0,8810 1 0,9323 0,9563 0,9374 0,9578
CPL 0,8879 0,8926 0,9237 0,8264 0,8467 0,9078 0,8453 0,4668 0,8962 0,7687 0,9181 0,8490 0,7790 0,9323 1 0,9111 0,9528 0,9127
INR 0,9630 0,9544 0,8928 0,8761 0,8120 0,9590 0,9244 0,2353 0,9796 0,7003 0,9308 0,9407 0,9107 0,9563 0,9111 1 0,9677 0,9915
BRL 0,9241 0,9513 0,9029 0,8840 0,8440 0,9391 0,9119 0,3516 0,9397 0,7443 0,9522 0,9362 0,8580 0,9374 0,9528 0,9677 1 0,9659
RUB 0,9617 0,9558 0,8963 0,8789 0,8259 0,9642 0,9395 0,2379 0,9750 0,7007 0,9346 0,9431 0,8875 0,9578 0,9127 0,9915 0,9659 1
Page 67
Chapter 8 G.Carlsson & R.Ericsson Appendices
60
Appendix 14 - Correlation 2006
2006 Q1 USD AUD CAD CHF CZK EUR GBP ZAR SGD PLN NOK KRW JPY CNY CPL INR BRL RUB
USD 1 0,9573 0,9619 0,9382 0,8734 0,9562 0,9184 0,6199 0,9916 0,7697 0,9390 0,9644 0,6639 0,9925 0,9336 0,9511 0,9783 0,9946
AUD 0,9573 1 0,9178 0,9028 0,8453 0,9166 0,9319 0,5815 0,9538 0,7584 0,9316 0,9482 0,6820 0,9507 0,8801 0,9423 0,9523 0,9558
CAD 0,9619 0,9178 1 0,9125 0,9340 0,9371 0,8663 0,7432 0,9533 0,8701 0,9167 0,9067 0,5072 0,9800 0,9772 0,8656 0,9596 0,9582
CHF 0,9382 0,9028 0,9125 1 0,8858 0,9707 0,9402 0,6150 0,9265 0,7391 0,9418 0,9103 0,5721 0,9363 0,8851 0,8545 0,9340 0,9508
CZK 0,8734 0,8453 0,9340 0,8858 1 0,9030 0,8364 0,8065 0,8805 0,9057 0,8524 0,8492 0,3625 0,9071 0,9406 0,7512 0,8872 0,8826
EUR 0,9562 0,9166 0,9371 0,9707 0,9030 1 0,9080 0,6479 0,9490 0,7600 0,9426 0,9130 0,5818 0,9578 0,9038 0,8937 0,9417 0,9670
GBP 0,9184 0,9319 0,8663 0,9402 0,8364 0,9080 1 0,5364 0,9037 0,7002 0,9098 0,9228 0,6630 0,9048 0,8324 0,8809 0,9075 0,9306
ZAR 0,6199 0,5815 0,7432 0,6150 0,8065 0,6479 0,5364 1 0,6430 0,8182 0,5333 0,5741 0,0522 0,6720 0,8000 0,4445 0,6637 0,6125
SGD 0,9916 0,9538 0,9533 0,9265 0,8805 0,9490 0,9037 0,6430 1 0,7754 0,9213 0,9741 0,6579 0,9865 0,9334 0,9435 0,9656 0,9844
PLN 0,7697 0,7584 0,8701 0,7391 0,9057 0,7600 0,7002 0,8182 0,7754 1 0,7244 0,7074 0,2649 0,8123 0,8764 0,6299 0,7907 0,7611
NOK 0,9390 0,9316 0,9167 0,9418 0,8524 0,9426 0,9098 0,5333 0,9213 0,7244 1 0,9092 0,6665 0,9442 0,8705 0,9160 0,9451 0,9500
KRW 0,9644 0,9482 0,9067 0,9103 0,8492 0,9130 0,9228 0,5741 0,9741 0,7074 0,9092 1 0,6621 0,9515 0,8872 0,9357 0,9436 0,9676
JPY 0,6639 0,6820 0,5072 0,5721 0,3625 0,5818 0,6630 0,0522 0,6579 0,2649 0,6665 0,6621 1 0,6153 0,4423 0,8194 0,6050 0,6438
CNY 0,9925 0,9507 0,9800 0,9363 0,9071 0,9578 0,9048 0,6720 0,9865 0,8123 0,9442 0,9515 0,6153 1 0,9634 0,9292 0,9828 0,9887
CPL 0,9336 0,8801 0,9772 0,8851 0,9406 0,9038 0,8324 0,8000 0,9334 0,8764 0,8705 0,8872 0,4423 0,9634 1 0,8189 0,9509 0,9283
INR 0,9511 0,9423 0,8656 0,8545 0,7512 0,8937 0,8809 0,4445 0,9435 0,6299 0,9160 0,9357 0,8194 0,9292 0,8189 1 0,9158 0,9435
BRL 0,9783 0,9523 0,9596 0,9340 0,8872 0,9417 0,9075 0,6637 0,9656 0,7907 0,9451 0,9436 0,6050 0,9828 0,9509 0,9158 1 0,9781
RUB 0,9946 0,9558 0,9582 0,9508 0,8826 0,9670 0,9306 0,6125 0,9844 0,7611 0,9500 0,9676 0,6438 0,9887 0,9283 0,9435 0,9781 1
2006 Q2 USD AUD CAD CHF CZK EUR GBP ZAR SGD PLN NOK KRW JPY CNY CPL INR BRL RUB
USD 1 0,8373 0,9179 0,7850 0,7645 0,8980 0,7440 0,5641 0,9061 0,7857 0,8106 0,7794 0,2492 0,9801 0,8803 0,8906 0,9092 0,9541
AUD 0,8373 1 0,7070 0,8062 0,4855 0,7707 0,8186 0,3123 0,6357 0,5948 0,8107 0,4809 0,4929 0,7887 0,6711 0,8009 0,6767 0,6902
CAD 0,9179 0,7070 1 0,6294 0,9210 0,7958 0,5884 0,7964 0,9302 0,9412 0,6637 0,8532 -0,0688 0,9649 0,9702 0,7627 0,9526 0,9368
CHF 0,7850 0,8062 0,6294 1 0,4794 0,8919 0,8923 0,2417 0,5413 0,4955 0,8557 0,3588 0,4096 0,7350 0,6299 0,5979 0,5959 0,6607
CZK 0,7645 0,4855 0,9210 0,4794 1 0,6854 0,4492 0,8870 0,8905 0,9371 0,4829 0,8738 -0,2659 0,8499 0,9175 0,6041 0,8858 0,8580
EUR 0,8980 0,7707 0,7958 0,8919 0,6854 1 0,7881 0,4550 0,7577 0,6534 0,8696 0,5814 0,2932 0,8790 0,7716 0,7630 0,7796 0,8570
GBP 0,7440 0,8186 0,5884 0,8923 0,4492 0,7881 1 0,2020 0,5178 0,4855 0,7988 0,3760 0,5057 0,6805 0,5596 0,6207 0,5617 0,6386
ZAR 0,5641 0,3123 0,7964 0,2417 0,8870 0,4550 0,2020 1 0,7682 0,8587 0,1820 0,7968 -0,4652 0,6676 0,8069 0,4033 0,7412 0,6731
SGD 0,9061 0,6357 0,9302 0,5413 0,8905 0,7577 0,5178 0,7682 1 0,8656 0,5789 0,9587 -0,0020 0,9321 0,8879 0,8310 0,9391 0,9605
PLN 0,7857 0,5948 0,9412 0,4955 0,9371 0,6534 0,4855 0,8587 0,8656 1 0,5148 0,8318 -0,1937 0,8631 0,9291 0,6346 0,8762 0,8311
NOK 0,8106 0,8107 0,6637 0,8557 0,4829 0,8696 0,7988 0,1820 0,5789 0,5148 1 0,3872 0,4972 0,7847 0,6393 0,7337 0,6759 0,7150
KRW 0,7794 0,4809 0,8532 0,3588 0,8738 0,5814 0,3760 0,7968 0,9587 0,8318 0,3872 1 -0,1294 0,8172 0,8049 0,7299 0,8794 0,8793
JPY 0,2492 0,4929 -0,0688 0,4096 -0,2659 0,2932 0,5057 -0,4652 -0,0020 -0,1937 0,4972 -0,1294 1 0,1228 -0,1145 0,4725 -0,0286 0,0837
CNY 0,9801 0,7887 0,9649 0,7350 0,8499 0,8790 0,6805 0,6676 0,9321 0,8631 0,7847 0,8172 0,1228 1 0,9443 0,8497 0,9453 0,9637
CPL 0,8803 0,6711 0,9702 0,6299 0,9175 0,7716 0,5596 0,8069 0,8879 0,9291 0,6393 0,8049 -0,1145 0,9443 1 0,6774 0,9207 0,8858
INR 0,8906 0,8009 0,7627 0,5979 0,6041 0,7630 0,6207 0,4033 0,8310 0,6346 0,7337 0,7299 0,4725 0,8497 0,6774 1 0,7861 0,8465
BRL 0,9092 0,6767 0,9526 0,5959 0,8858 0,7796 0,5617 0,7412 0,9391 0,8762 0,6759 0,8794 -0,0286 0,9453 0,9207 0,7861 1 0,9585
RUB 0,9541 0,6902 0,9368 0,6607 0,8580 0,8570 0,6386 0,6731 0,9605 0,8311 0,7150 0,8793 0,0837 0,9637 0,8858 0,8465 0,9585 1
2006 Q3 USD AUD CAD CHF CZK EUR GBP ZAR SGD PLN NOK KRW JPY CNY CPL INR BRL RUB
USD 1 0,8175 0,5782 0,7388 -0,0818 0,8193 0,6948 0,5986 0,6285 0,4419 0,2777 0,2403 0,6130 0,9760 0,7416 0,8680 0,6224 0,7413
AUD 0,8175 1 0,2938 0,7959 -0,3448 0,7199 0,7487 0,5229 0,2568 0,3821 0,3512 -0,1212 0,7922 0,7472 0,5546 0,8190 0,3581 0,3392
CAD 0,5782 0,2938 1 0,3741 0,6431 0,4739 0,4268 0,5150 0,7919 0,7404 0,1195 0,6948 -0,1427 0,6933 0,8208 0,2215 0,8148 0,8190
CHF 0,7388 0,7959 0,3741 1 -0,1110 0,8910 0,9323 0,2406 0,2270 0,3002 0,6335 -0,1445 0,6623 0,6989 0,5023 0,5538 0,3063 0,4270
CZK -0,0818 -0,3448 0,6431 -0,1110 1 0,0145 -0,0183 0,2446 0,5703 0,5676 -0,0622 0,7733 -0,5993 0,0808 0,4156 -0,3504 0,5151 0,4623
EUR 0,8193 0,7199 0,4739 0,8910 0,0145 1 0,8368 0,3413 0,4880 0,3206 0,6760 0,1116 0,6254 0,7981 0,5676 0,6338 0,5149 0,6839
GBP 0,6948 0,7487 0,4268 0,9323 -0,0183 0,8368 1 0,2266 0,2335 0,3543 0,6234 -0,0975 0,6322 0,6718 0,5083 0,5077 0,3356 0,4597
ZAR 0,5986 0,5229 0,5150 0,2406 0,2446 0,3413 0,2266 1 0,6677 0,7743 -0,1316 0,5476 0,2343 0,6369 0,7701 0,6383 0,6616 0,4841
SGD 0,6285 0,2568 0,7919 0,2270 0,5703 0,4880 0,2335 0,6677 1 0,6338 -0,0415 0,8850 -0,0206 0,7142 0,7321 0,4469 0,8302 0,8876
PLN 0,4419 0,3821 0,7404 0,3002 0,5676 0,3206 0,3543 0,7743 0,6338 1 -0,0207 0,5826 0,0096 0,5395 0,7930 0,3039 0,6757 0,5021
NOK 0,2777 0,3512 0,1195 0,6335 -0,0622 0,6760 0,6234 -0,1316 -0,0415 -0,0207 1 -0,2523 0,3768 0,2699 0,1491 0,0889 0,1922 0,2591
KRW 0,2403 -0,1212 0,6948 -0,1445 0,7733 0,1116 -0,0975 0,5476 0,8850 0,5826 -0,2523 1 -0,3881 0,3611 0,5374 0,0946 0,7155 0,6875
JPY 0,6130 0,7922 -0,1427 0,6623 -0,5993 0,6254 0,6322 0,2343 -0,0206 0,0096 0,3768 -0,3881 1 0,4847 0,1513 0,7878 -0,0100 0,1032
CNY 0,9760 0,7472 0,6933 0,6989 0,0808 0,7981 0,6718 0,6369 0,7142 0,5395 0,2699 0,3611 0,4847 1 0,8342 0,7899 0,7145 0,8140
CPL 0,7416 0,5546 0,8208 0,5023 0,4156 0,5676 0,5083 0,7701 0,7321 0,7930 0,1491 0,5374 0,1513 0,8342 1 0,4931 0,7835 0,7061
INR 0,8680 0,8190 0,2215 0,5538 -0,3504 0,6338 0,5077 0,6383 0,4469 0,3039 0,0889 0,0946 0,7878 0,7899 0,4931 1 0,4113 0,4781
BRL 0,6224 0,3581 0,8148 0,3063 0,5151 0,5149 0,3356 0,6616 0,8302 0,6757 0,1922 0,7155 -0,0100 0,7145 0,7835 0,4113 1 0,8530
RUB 0,7413 0,3392 0,8190 0,4270 0,4623 0,6839 0,4597 0,4841 0,8876 0,5021 0,2591 0,6875 0,1032 0,8140 0,7061 0,4781 0,8530 1
2006 Q4 USD AUD CAD CHF CZK EUR GBP ZAR SGD PLN NOK KRW JPY CNY CPL INR BRL RUB
USD 1 0,9015 0,9006 0,8566 -0,0806 0,8698 0,6470 0,7872 0,8255 0,6830 0,5452 0,4919 0,8893 0,9966 0,9395 0,9512 0,7745 0,8531
AUD 0,9015 1 0,8269 0,8732 -0,1414 0,8282 0,7455 0,7340 0,6532 0,7680 0,5394 0,2926 0,8614 0,8879 0,8773 0,8498 0,6973 0,6592
CAD 0,9006 0,8269 1 0,7922 0,1887 0,8138 0,6281 0,7503 0,8546 0,7003 0,4864 0,6156 0,7884 0,9029 0,9083 0,8578 0,7781 0,8265
CHF 0,8566 0,8732 0,7922 1 -0,0585 0,9224 0,7669 0,6465 0,5856 0,5900 0,7677 0,2467 0,9086 0,8353 0,7974 0,7802 0,5563 0,6560
CZK -0,0806 -0,1414 0,1887 -0,0585 1 0,0924 0,0677 0,1025 0,3558 0,2251 -0,0144 0,5399 -0,1038 -0,0553 0,0384 -0,0592 0,2134 0,2307
EUR 0,8698 0,8282 0,8138 0,9224 0,0924 1 0,8239 0,6013 0,6971 0,5893 0,7229 0,3434 0,8542 0,8739 0,8025 0,7780 0,6895 0,8268
GBP 0,6470 0,7455 0,6281 0,7669 0,0677 0,8239 1 0,2742 0,4032 0,4824 0,4622 0,0284 0,6007 0,6607 0,5571 0,5000 0,4661 0,5980
ZAR 0,7872 0,7340 0,7503 0,6465 0,1025 0,6013 0,2742 1 0,8187 0,8335 0,4818 0,6779 0,8011 0,7627 0,8745 0,8855 0,7074 0,6001
SGD 0,8255 0,6532 0,8546 0,5856 0,3558 0,6971 0,4032 0,8187 1 0,7115 0,3479 0,8608 0,6978 0,8406 0,8483 0,8573 0,8456 0,8815
PLN 0,6830 0,7680 0,7003 0,5900 0,2251 0,5893 0,4824 0,8335 0,7115 1 0,3036 0,5304 0,7006 0,6709 0,7817 0,7504 0,6440 0,5028
NOK 0,5452 0,5394 0,4864 0,7677 -0,0144 0,7229 0,4622 0,4818 0,3479 0,3036 1 0,1178 0,7028 0,5165 0,5226 0,4716 0,4146 0,4614
KRW 0,4919 0,2926 0,6156 0,2467 0,5399 0,3434 0,0284 0,6779 0,8608 0,5304 0,1178 1 0,3994 0,5098 0,5874 0,6078 0,6531 0,6363
JPY 0,8893 0,8614 0,7884 0,9086 -0,1038 0,8542 0,6007 0,8011 0,6978 0,7006 0,7028 0,3994 1 0,8656 0,8559 0,9039 0,6226 0,6811
CNY 0,9966 0,8879 0,9029 0,8353 -0,0553 0,8739 0,6607 0,7627 0,8406 0,6709 0,5165 0,5098 0,8656 1 0,9329 0,9426 0,7946 0,8815
CPL 0,9395 0,8773 0,9083 0,7974 0,0384 0,8025 0,5571 0,8745 0,8483 0,7817 0,5226 0,5874 0,8559 0,9329 1 0,9204 0,7894 0,7684
INR 0,9512 0,8498 0,8578 0,7802 -0,0592 0,7780 0,5000 0,8855 0,8573 0,7504 0,4716 0,6078 0,9039 0,9426 0,9204 1 0,7689 0,7928
BRL 0,7745 0,6973 0,7781 0,5563 0,2134 0,6895 0,4661 0,7074 0,8456 0,6440 0,4146 0,6531 0,6226 0,7946 0,7894 0,7689 1 0,8455
RUB 0,8531 0,6592 0,8265 0,6560 0,2307 0,8268 0,5980 0,6001 0,8815 0,5028 0,4614 0,6363 0,6811 0,8815 0,7684 0,7928 0,8455 1
Page 68
Chapter 8 G.Carlsson & R.Ericsson Appendices
61
Appendix 15 - Correlation 2007
2007 Q1 USD AUD CAD CHF CZK EUR GBP ZAR SGD PLN NOK KRW JPY CNY CPL INR BRL RUB
USD 1 0,8391 0,9068 0,8310 0,3236 0,8732 0,3347 0,8448 0,9706 0,5570 0,5311 0,9334 0,9001 0,9874 0,9386 0,9446 0,8353 0,9056
AUD 0,8391 1 0,7462 0,7172 0,3848 0,7214 0,4769 0,8111 0,8369 0,8133 0,3791 0,7999 0,7825 0,8350 0,8824 0,8653 0,7685 0,6674
CAD 0,9068 0,7462 1 0,8944 0,4259 0,9239 0,4304 0,7161 0,8941 0,3930 0,6226 0,8598 0,8982 0,8671 0,8275 0,7710 0,7625 0,8938
CHF 0,8310 0,7172 0,8944 1 0,3901 0,9103 0,3222 0,7881 0,7809 0,3932 0,7892 0,7709 0,9627 0,7542 0,7686 0,7243 0,5864 0,7298
CZK 0,3236 0,3848 0,4259 0,3901 1 0,5606 0,5825 0,3139 0,4487 0,4450 0,3364 0,4449 0,3738 0,3367 0,3857 0,3011 0,4598 0,4614
EUR 0,8732 0,7214 0,9239 0,9103 0,5606 1 0,5119 0,7179 0,8895 0,4361 0,6724 0,8448 0,9035 0,8439 0,8214 0,7520 0,7540 0,8970
GBP 0,3347 0,4769 0,4304 0,3222 0,5825 0,5119 1 0,0667 0,4096 0,4160 -0,0707 0,3100 0,2736 0,3867 0,3168 0,2724 0,3647 0,4652
ZAR 0,8448 0,8111 0,7161 0,7881 0,3139 0,7179 0,0667 1 0,8115 0,6752 0,6985 0,8276 0,8766 0,7951 0,8969 0,8825 0,7221 0,6323
SGD 0,9706 0,8369 0,8941 0,7809 0,4487 0,8895 0,4096 0,8115 1 0,5922 0,5097 0,9586 0,8644 0,9765 0,9464 0,9245 0,9058 0,9407
PLN 0,5570 0,8133 0,3930 0,3932 0,4450 0,4361 0,4160 0,6752 0,5922 1 0,1562 0,5793 0,5114 0,5852 0,7123 0,6990 0,6201 0,3723
NOK 0,5311 0,3791 0,6226 0,7892 0,3364 0,6724 -0,0707 0,6985 0,5097 0,1562 1 0,5433 0,7629 0,4246 0,5222 0,4218 0,3912 0,4699
KRW 0,9334 0,7999 0,8598 0,7709 0,4449 0,8448 0,3100 0,8276 0,9586 0,5793 0,5433 1 0,8521 0,9364 0,9439 0,9190 0,8790 0,8866
JPY 0,9001 0,7825 0,8982 0,9627 0,3738 0,9035 0,2736 0,8766 0,8644 0,5114 0,7629 0,8521 1 0,8377 0,8652 0,8338 0,6876 0,7757
CNY 0,9874 0,8350 0,8671 0,7542 0,3367 0,8439 0,3867 0,7951 0,9765 0,5852 0,4246 0,9364 0,8377 1 0,9373 0,9521 0,8614 0,9170
CPL 0,9386 0,8824 0,8275 0,7686 0,3857 0,8214 0,3168 0,8969 0,9464 0,7123 0,5222 0,9439 0,8652 0,9373 1 0,9546 0,8706 0,8119
INR 0,9446 0,8653 0,7710 0,7243 0,3011 0,7520 0,2724 0,8825 0,9245 0,6990 0,4218 0,9190 0,8338 0,9521 0,9546 1 0,8185 0,7855
BRL 0,8353 0,7685 0,7625 0,5864 0,4598 0,7540 0,3647 0,7221 0,9058 0,6201 0,3912 0,8790 0,6876 0,8614 0,8706 0,8185 1 0,8542
RUB 0,9056 0,6674 0,8938 0,7298 0,4614 0,8970 0,4652 0,6323 0,9407 0,3723 0,4699 0,8866 0,7757 0,9170 0,8119 0,7855 0,8542 1
2007 Q2 USD AUD CAD CHF CZK EUR GBP ZAR SGD PLN NOK KRW JPY CNY CPL INR BRL RUB
USD 1 0,4684 0,9014 0,7970 0,1211 0,7269 -0,0085 0,6862 0,8744 -0,0623 0,5740 0,9235 0,8472 0,9128 0,8945 0,7185 0,6925 0,9261
AUD 0,4684 1 0,3258 0,3690 0,6088 0,6904 0,4701 0,4515 0,7433 0,6138 0,3647 0,5066 0,3592 0,6022 0,5472 0,6608 0,7669 0,5937
CAD 0,9014 0,3258 1 0,8951 0,0897 0,6690 -0,0828 0,6152 0,6620 -0,1065 0,5916 0,8114 0,9207 0,6874 0,8204 0,4466 0,4877 0,7988
CHF 0,7970 0,3690 0,8951 1 0,2991 0,7989 -0,1053 0,6640 0,6176 -0,0250 0,7975 0,7284 0,9688 0,5799 0,7348 0,4134 0,4010 0,7371
CZK 0,1211 0,6088 0,0897 0,2991 1 0,5998 0,3767 0,1721 0,3585 0,5871 0,2756 0,1422 0,2101 0,2152 0,1832 0,3112 0,2892 0,2994
EUR 0,7269 0,6904 0,6690 0,7989 0,5998 1 0,2816 0,5047 0,8148 0,2267 0,6828 0,6548 0,7260 0,7429 0,6402 0,6313 0,6466 0,8616
GBP -0,0085 0,4701 -0,0828 -0,1053 0,3767 0,2816 1 -0,2777 0,2578 0,3001 -0,2304 -0,0452 -0,1887 0,2229 -0,0882 0,1551 0,2176 0,2115
ZAR 0,6862 0,4515 0,6152 0,6640 0,1721 0,5047 -0,2777 1 0,6107 0,2207 0,7901 0,7581 0,7515 0,5250 0,8051 0,6277 0,5679 0,4892
SGD 0,8744 0,7433 0,6620 0,6176 0,3585 0,8148 0,2578 0,6107 1 0,2031 0,5078 0,8451 0,6503 0,9588 0,8087 0,8837 0,8584 0,9185
PLN -0,0623 0,6138 -0,1065 -0,0250 0,5871 0,2267 0,3001 0,2207 0,2031 1 0,0309 0,0884 -0,0071 0,0555 0,2428 0,2731 0,3879 0,0291
NOK 0,5740 0,3647 0,5916 0,7975 0,2756 0,6828 -0,2304 0,7901 0,5078 0,0309 1 0,5571 0,7788 0,4005 0,5473 0,4057 0,3577 0,4974
KRW 0,9235 0,5066 0,8114 0,7284 0,1422 0,6548 -0,0452 0,7581 0,8451 0,0884 0,5571 1 0,8045 0,8567 0,9372 0,8042 0,7095 0,8137
JPY 0,8472 0,3592 0,9207 0,9688 0,2101 0,7260 -0,1887 0,7515 0,6503 -0,0071 0,7788 0,8045 1 0,6162 0,8201 0,4802 0,4511 0,7292
CNY 0,9128 0,6022 0,6874 0,5799 0,2152 0,7429 0,2229 0,5250 0,9588 0,0555 0,4005 0,8567 0,6162 1 0,7981 0,8595 0,8051 0,9469
CPL 0,8945 0,5472 0,8204 0,7348 0,1832 0,6402 -0,0882 0,8051 0,8087 0,2428 0,5473 0,9372 0,8201 0,7981 1 0,7614 0,7377 0,7731
INR 0,7185 0,6608 0,4466 0,4134 0,3112 0,6313 0,1551 0,6277 0,8837 0,2731 0,4057 0,8042 0,4802 0,8595 0,7614 1 0,8047 0,7233
BRL 0,6925 0,7669 0,4877 0,4010 0,2892 0,6466 0,2176 0,5679 0,8584 0,3879 0,3577 0,7095 0,4511 0,8051 0,7377 0,8047 1 0,7380
RUB 0,9261 0,5937 0,7988 0,7371 0,2994 0,8616 0,2115 0,4892 0,9185 0,0291 0,4974 0,8137 0,7292 0,9469 0,7731 0,7233 0,7380 1
2007 Q3 USD AUD CAD CHF CZK EUR GBP ZAR SGD PLN NOK KRW JPY CNY CPL INR BRL RUB
USD 1 -0,1742 0,6674 0,8727 0,0227 0,3503 0,3097 0,3980 0,8523 -0,5168 0,0394 0,9175 0,8876 0,8485 0,8541 -0,2583 0,1140 0,8736
AUD -0,1742 1 0,3299 -0,2409 0,4009 0,7041 0,5125 -0,1248 0,0683 0,7632 0,4930 -0,0818 -0,4167 0,2455 -0,0015 0,8563 0,8612 0,2452
CAD 0,6674 0,3299 1 0,5788 -0,0524 0,5643 0,2606 0,3476 0,4358 -0,0044 0,3215 0,6488 0,5047 0,6598 0,7989 0,2872 0,5754 0,7300
CHF 0,8727 -0,2409 0,5788 1 0,1570 0,3929 0,0957 0,4512 0,7053 -0,4977 0,2299 0,7406 0,9588 0,6227 0,7192 -0,4246 -0,0534 0,7700
CZK 0,0227 0,4009 -0,0524 0,1570 1 0,5868 0,3851 -0,1686 0,3466 0,4029 0,1867 0,0047 0,0130 0,2089 -0,0111 0,2092 0,2795 0,3112
EUR 0,3503 0,7041 0,5643 0,3929 0,5868 1 0,5712 0,0116 0,5546 0,3920 0,6193 0,3345 0,1806 0,6351 0,3618 0,5546 0,7664 0,7458
GBP 0,3097 0,5125 0,2606 0,0957 0,3851 0,5712 1 -0,1634 0,5699 0,2494 0,0720 0,3573 -0,0212 0,6503 0,2322 0,4084 0,5681 0,5410
ZAR 0,3980 -0,1248 0,3476 0,4512 -0,1686 0,0116 -0,1634 1 0,1777 -0,2912 0,4304 0,2283 0,4762 0,1119 0,2701 -0,3524 -0,0589 0,2211
SGD 0,8523 0,0683 0,4358 0,7053 0,3466 0,5546 0,5699 0,1777 1 -0,2824 0,0968 0,7964 0,6724 0,9077 0,6669 -0,0364 0,2817 0,8993
PLN -0,5168 0,7632 -0,0044 -0,4977 0,4029 0,3920 0,2494 -0,2912 -0,2824 1 0,2212 -0,4107 -0,6219 -0,1538 -0,1967 0,7390 0,5785 -0,1370
NOK 0,0394 0,4930 0,3215 0,2299 0,1867 0,6193 0,0720 0,4304 0,0968 0,2212 1 -0,0508 0,0539 0,1424 -0,0555 0,2686 0,4693 0,2894
KRW 0,9175 -0,0818 0,6488 0,7406 0,0047 0,3345 0,3573 0,2283 0,7964 -0,4107 -0,0508 1 0,7475 0,8579 0,8522 -0,1053 0,1810 0,8199
JPY 0,8876 -0,4167 0,5047 0,9588 0,0130 0,1806 -0,0212 0,4762 0,6724 -0,6219 0,0539 0,7475 1 0,5625 0,7302 -0,5495 -0,2102 0,6819
CNY 0,8485 0,2455 0,6598 0,6227 0,2089 0,6351 0,6503 0,1119 0,9077 -0,1538 0,1424 0,8579 0,5625 1 0,7538 0,2060 0,5181 0,9431
CPL 0,8541 -0,0015 0,7989 0,7192 -0,0111 0,3618 0,2322 0,2701 0,6669 -0,1967 -0,0555 0,8522 0,7302 0,7538 1 -0,0179 0,2706 0,7870
INR -0,2583 0,8563 0,2872 -0,4246 0,2092 0,5546 0,4084 -0,3524 -0,0364 0,7390 0,2686 -0,1053 -0,5495 0,2060 -0,0179 1 0,8540 0,1355
BRL 0,1140 0,8612 0,5754 -0,0534 0,2795 0,7664 0,5681 -0,0589 0,2817 0,5785 0,4693 0,1810 -0,2102 0,5181 0,2706 0,8540 1 0,4844
RUB 0,8736 0,2452 0,7300 0,7700 0,3112 0,7458 0,5410 0,2211 0,8993 -0,1370 0,2894 0,8199 0,6819 0,9431 0,7870 0,1355 0,4844 1
2007 Q4 USD AUD CAD CHF CZK EUR GBP ZAR SGD PLN NOK KRW JPY CNY CPL INR BRL RUB
USD 1 -0,3204 0,0289 0,7955 -0,0870 0,1356 0,5345 0,3228 0,9298 -0,4949 -0,5408 0,9541 0,7932 0,8471 0,8030 -0,2261 -0,1995 0,8100
AUD -0,3204 1 0,6106 -0,3163 0,1956 0,6219 0,3237 -0,1027 -0,1939 0,7851 0,6732 -0,2410 -0,5137 0,0848 -0,0631 0,8246 0,8927 0,1464
CAD 0,0289 0,6106 1 0,1048 0,3356 0,6084 0,2644 -0,3054 -0,0479 0,6417 0,5206 0,0230 0,0290 0,3902 0,4814 0,7494 0,7878 0,4091
CHF 0,7955 -0,3163 0,1048 1 0,3416 0,3726 0,4053 -0,0375 0,7795 -0,2609 -0,2250 0,6868 0,9380 0,7173 0,7053 -0,2302 -0,2055 0,7835
CZK -0,0870 0,1956 0,3356 0,3416 1 0,6753 0,1906 -0,4535 0,0752 0,4424 0,5784 -0,2371 0,2999 0,2146 0,0246 0,3285 0,2692 0,3157
EUR 0,1356 0,6219 0,6084 0,3726 0,6753 1 0,5673 -0,2835 0,3145 0,6403 0,6827 0,0513 0,1630 0,5599 0,2722 0,7190 0,6881 0,6737
GBP 0,5345 0,3237 0,2644 0,4053 0,1906 0,5673 1 0,1834 0,6397 0,0344 0,1144 0,5156 0,2669 0,7768 0,3796 0,3528 0,3556 0,7005
ZAR 0,3228 -0,1027 -0,3054 -0,0375 -0,4535 -0,2835 0,1834 1 0,3113 -0,2701 -0,4693 0,4761 -0,0319 0,1187 0,1834 -0,2097 -0,2120 0,0461
SGD 0,9298 -0,1939 -0,0479 0,7795 0,0752 0,3145 0,6397 0,3113 1 -0,4014 -0,3638 0,8578 0,7358 0,8674 0,6566 -0,1304 -0,1159 0,8621
PLN -0,4949 0,7851 0,6417 -0,2609 0,4424 0,6403 0,0344 -0,2701 -0,4014 1 0,7875 -0,4733 -0,4086 -0,0992 -0,0743 0,8142 0,7509 0,0113
NOK -0,5408 0,6732 0,5206 -0,2250 0,5784 0,6827 0,1144 -0,4693 -0,3638 0,7875 1 -0,5809 -0,3666 -0,0610 -0,3033 0,6854 0,7159 0,0145
KRW 0,9541 -0,2410 0,0230 0,6868 -0,2371 0,0513 0,5156 0,4761 0,8578 -0,4733 -0,5809 1 0,6642 0,7719 0,7799 -0,2200 -0,1689 0,7238
JPY 0,7932 -0,5137 0,0290 0,9380 0,2999 0,1630 0,2669 -0,0319 0,7358 -0,4086 -0,3666 0,6642 1 0,6431 0,7018 -0,3611 -0,3685 0,6699
CNY 0,8471 0,0848 0,3902 0,7173 0,2146 0,5599 0,7768 0,1187 0,8674 -0,0992 -0,0610 0,7719 0,6431 1 0,7545 0,2387 0,2649 0,9554
CPL 0,8030 -0,0631 0,4814 0,7053 0,0246 0,2722 0,3796 0,1834 0,6566 -0,0743 -0,3033 0,7799 0,7018 0,7545 1 0,0748 0,1026 0,7620
INR -0,2261 0,8246 0,7494 -0,2302 0,3285 0,7190 0,3528 -0,2097 -0,1304 0,8142 0,6854 -0,2200 -0,3611 0,2387 0,0748 1 0,8853 0,2650
BRL -0,1995 0,8927 0,7878 -0,2055 0,2692 0,6881 0,3556 -0,2120 -0,1159 0,7509 0,7159 -0,1689 -0,3685 0,2649 0,1026 0,8853 1 0,2873
RUB 0,8100 0,1464 0,4091 0,7835 0,3157 0,6737 0,7005 0,0461 0,8621 0,0113 0,0145 0,7238 0,6699 0,9554 0,7620 0,2650 0,2873 1
Page 69
Chapter 8 G.Carlsson & R.Ericsson Appendices
62
Appendix 16 - Correlation 2008
2008 Q1 USD AUD CAD CHF CZK EUR GBP ZAR SGD PLN NOK KRW JPY CNY CPL INR BRL RUB
USD 1 -0,3177 -0,6016 0,4787 -0,6297 -0,0929 0,8860 0,4992 0,8815 -0,7551 -0,5983 0,9657 0,5222 0,9217 0,6341 0,0303 -0,6068 0,8467
AUD -0,3177 1 0,7123 -0,4094 0,0472 0,2595 -0,0358 0,1084 -0,3426 0,4141 0,5872 -0,1479 -0,5713 -0,1777 0,1812 0,6140 0,7671 -0,1169
CAD -0,6016 0,7123 1 -0,3077 0,4555 0,4297 -0,3684 -0,2819 -0,5575 0,6797 0,8393 -0,5346 -0,3726 -0,3381 0,0486 0,6042 0,8819 -0,2834
CHF 0,4787 -0,4094 -0,3077 1 0,2660 0,6133 0,3386 -0,0861 0,6651 -0,0410 -0,1498 0,3017 0,8982 0,5988 0,2835 -0,1043 -0,2765 0,7287
CZK -0,6297 0,0472 0,4555 0,2660 1 0,6622 -0,6437 -0,4592 -0,2830 0,8543 0,5304 -0,7388 0,1941 -0,4023 -0,2256 -0,0398 0,4957 -0,2307
EUR -0,0929 0,2595 0,4297 0,6133 0,6622 1 -0,0590 -0,2439 0,1527 0,6454 0,5245 -0,1952 0,3984 0,2240 0,3224 0,4439 0,5006 0,4318
GBP 0,8860 -0,0358 -0,3684 0,3386 -0,6437 -0,0590 1 0,5068 0,7012 -0,6714 -0,4189 0,9128 0,3552 0,8540 0,5933 0,2216 -0,3979 0,7619
ZAR 0,4992 0,1084 -0,2819 -0,0861 -0,4592 -0,2439 0,5068 1 0,4852 -0,3520 -0,4236 0,6143 -0,0983 0,3671 0,4086 0,0019 -0,2005 0,3032
SGD 0,8815 -0,3426 -0,5575 0,6651 -0,2830 0,1527 0,7012 0,4852 1 -0,5004 -0,4823 0,7966 0,6875 0,8572 0,6232 -0,1139 -0,5054 0,8708
PLN -0,7551 0,4141 0,6797 -0,0410 0,8543 0,6454 -0,6714 -0,3520 -0,5004 1 0,6640 -0,7759 -0,2152 -0,5068 -0,1678 0,2850 0,7644 -0,3499
NOK -0,5983 0,5872 0,8393 -0,1498 0,5304 0,5245 -0,4189 -0,4236 -0,4823 0,6640 1 -0,5775 -0,1985 -0,3425 -0,0026 0,4116 0,7762 -0,2138
KRW 0,9657 -0,1479 -0,5346 0,3017 -0,7388 -0,1952 0,9128 0,6143 0,7966 -0,7759 -0,5775 1 0,3350 0,8603 0,6264 0,1023 -0,5276 0,7685
JPY 0,5222 -0,5713 -0,3726 0,8982 0,1941 0,3984 0,3552 -0,0983 0,6875 -0,2152 -0,1985 0,3350 1 0,5827 0,2832 -0,2299 -0,4623 0,6689
CNY 0,9217 -0,1777 -0,3381 0,5988 -0,4023 0,2240 0,8540 0,3671 0,8572 -0,5068 -0,3425 0,8603 0,5827 1 0,7722 0,2604 -0,3342 0,9490
CPL 0,6341 0,1812 0,0486 0,2835 -0,2256 0,3224 0,5933 0,4086 0,6232 -0,1678 -0,0026 0,6264 0,2832 0,7722 1 0,5479 0,0217 0,7633
INR 0,0303 0,6140 0,6042 -0,1043 -0,0398 0,4439 0,2216 0,0019 -0,1139 0,2850 0,4116 0,1023 -0,2299 0,2604 0,5479 1 0,5665 0,2721
BRL -0,6068 0,7671 0,8819 -0,2765 0,4957 0,5006 -0,3979 -0,2005 -0,5054 0,7644 0,7762 -0,5276 -0,4623 -0,3342 0,0217 0,5665 1 -0,2588
RUB 0,8467 -0,1169 -0,2834 0,7287 -0,2307 0,4318 0,7619 0,3032 0,8708 -0,3499 -0,2138 0,7685 0,6689 0,9490 0,7633 0,2721 -0,2588 1
2008 Q2 USD AUD CAD CHF CZK EUR GBP ZAR SGD PLN NOK KRW JPY CNY CPL INR BRL RUB
USD 1 0,2173 0,1553 -0,4721 -0,7885 -0,2569 0,9154 0,7317 0,6332 -0,8074 -0,4944 0,9443 -0,2733 0,8002 -0,2092 0,8701 -0,3813 0,9133
AUD 0,2173 1 0,5149 -0,3240 -0,2256 -0,1917 0,2630 0,2373 0,2452 -0,1645 0,2033 0,3370 -0,4078 0,2298 0,0901 0,3185 0,5371 0,1698
CAD 0,1553 0,5149 1 -0,4028 -0,1669 -0,0256 0,3101 0,4194 0,0578 -0,1199 0,5058 0,3106 -0,2663 0,1509 -0,2170 0,4976 0,5364 0,2410
CHF -0,4721 -0,3240 -0,4028 1 0,8148 0,8184 -0,6670 -0,8150 0,1631 0,7380 0,2206 -0,6961 0,8995 0,0373 0,7429 -0,5711 0,1936 -0,2122
CZK -0,7885 -0,2256 -0,1669 0,8148 1 0,7334 -0,8807 -0,7986 -0,0827 0,9561 0,5190 -0,8662 0,7126 -0,3182 0,5722 -0,7100 0,4883 -0,5256
EUR -0,2569 -0,1917 -0,0256 0,8184 0,7334 1 -0,4219 -0,4549 0,3890 0,7132 0,3483 -0,4383 0,8166 0,2594 0,5886 -0,2103 0,3936 0,1270
GBP 0,9154 0,2630 0,3101 -0,6670 -0,8807 -0,4219 1 0,8384 0,3714 -0,8752 -0,4242 0,9488 -0,4754 0,5718 -0,4700 0,8332 -0,3707 0,7892
ZAR 0,7317 0,2373 0,4194 -0,8150 -0,7986 -0,4549 0,8384 1 0,2360 -0,7219 -0,3005 0,8755 -0,6260 0,3261 -0,6541 0,8122 -0,2208 0,6196
SGD 0,6332 0,2452 0,0578 0,1631 -0,0827 0,3890 0,3714 0,2360 1 -0,1368 -0,2025 0,4827 0,3297 0,8574 0,3898 0,5290 0,0322 0,7729
PLN -0,8074 -0,1645 -0,1199 0,7380 0,9561 0,7132 -0,8752 -0,7219 -0,1368 1 0,4926 -0,8564 0,5776 -0,3653 0,5237 -0,6691 0,5544 -0,5463
NOK -0,4944 0,2033 0,5058 0,2206 0,5190 0,3483 -0,4242 -0,3005 -0,2025 0,4926 1 -0,4313 0,2445 -0,2139 0,2346 -0,2562 0,6272 -0,2911
KRW 0,9443 0,3370 0,3106 -0,6961 -0,8662 -0,4383 0,9488 0,8755 0,4827 -0,8564 -0,4313 1 -0,5040 0,6343 -0,4223 0,8989 -0,2948 0,8090
JPY -0,2733 -0,4078 -0,2663 0,8995 0,7126 0,8166 -0,4754 -0,6260 0,3297 0,5776 0,2445 -0,5040 1 0,2039 0,6390 -0,3625 0,0636 0,0081
CNY 0,8002 0,2298 0,1509 0,0373 -0,3182 0,2594 0,5718 0,3261 0,8574 -0,3653 -0,2139 0,6343 0,2039 1 0,2971 0,7245 -0,0364 0,8979
CPL -0,2092 0,0901 -0,2170 0,7429 0,5722 0,5886 -0,4700 -0,6541 0,3898 0,5237 0,2346 -0,4223 0,6390 0,2971 1 -0,2580 0,3115 -0,0368
INR 0,8701 0,3185 0,4976 -0,5711 -0,7100 -0,2103 0,8332 0,8122 0,5290 -0,6691 -0,2562 0,8989 -0,3625 0,7245 -0,2580 1 -0,0716 0,8393
BRL -0,3813 0,5371 0,5364 0,1936 0,4883 0,3936 -0,3707 -0,2208 0,0322 0,5544 0,6272 -0,2948 0,0636 -0,0364 0,3115 -0,0716 1 -0,1890
RUB 0,9133 0,1698 0,2410 -0,2122 -0,5256 0,1270 0,7892 0,6196 0,7729 -0,5463 -0,2911 0,8090 0,0081 0,8979 -0,0368 0,8393 -0,1890 1
2008 Q3 USD AUD CAD CHF CZK EUR GBP ZAR SGD PLN NOK KRW JPY CNY CPL INR BRL RUB
USD 1 0,2646 0,7795 -0,5366 -0,8226 -0,2867 0,9521 0,8476 0,5907 -0,8799 -0,1486 0,9418 -0,0184 0,7623 0,0931 0,9119 -0,3241 0,9514
AUD 0,2646 1 0,4313 -0,4954 -0,2851 -0,4514 0,2886 0,3085 0,2646 -0,2473 0,1269 0,2965 -0,4889 0,2020 -0,1390 0,1980 0,5467 0,1508
CAD 0,7795 0,4313 1 -0,6520 -0,7381 -0,3676 0,8376 0,8852 0,4217 -0,7878 0,1417 0,8704 -0,1384 0,3893 0,0338 0,8505 -0,0875 0,7317
CHF -0,5366 -0,4954 -0,6520 1 0,7917 0,8209 -0,6527 -0,7650 0,0659 0,6771 -0,0100 -0,6123 0,7570 -0,0492 0,4635 -0,5075 0,0699 -0,3441
CZK -0,8226 -0,2851 -0,7381 0,7917 1 0,6985 -0,8975 -0,8640 -0,1091 0,9566 0,1648 -0,8687 0,3739 -0,3111 0,0717 -0,8065 0,4794 -0,6485
EUR -0,2867 -0,4514 -0,3676 0,8209 0,6985 1 -0,4163 -0,4393 0,3722 0,5977 0,0721 -0,3853 0,7411 0,1976 0,3348 -0,2579 0,1880 -0,0051
GBP 0,9521 0,2886 0,8376 -0,6527 -0,8975 -0,4163 1 0,9108 0,3993 -0,9329 -0,1746 0,9610 -0,1638 0,5598 -0,0136 0,9089 -0,3592 0,8751
ZAR 0,8476 0,3085 0,8852 -0,7650 -0,8640 -0,4393 0,9108 1 0,3276 -0,8487 -0,0315 0,9210 -0,2801 0,3954 -0,1083 0,8912 -0,2252 0,7791
SGD 0,5907 0,2646 0,4217 0,0659 -0,1091 0,3722 0,3993 0,3276 1 -0,2205 0,0402 0,4593 0,4354 0,8606 0,3643 0,5194 0,1816 0,7132
PLN -0,8799 -0,2473 -0,7878 0,6771 0,9566 0,5977 -0,9329 -0,8487 -0,2205 1 0,1390 -0,9274 0,1959 -0,4115 -0,0587 -0,8784 0,4869 -0,7382
NOK -0,1486 0,1269 0,1417 -0,0100 0,1648 0,0721 -0,1746 -0,0315 0,0402 0,1390 1 -0,1032 0,0760 -0,1245 0,1452 -0,0647 0,2019 -0,1084
KRW 0,9418 0,2965 0,8704 -0,6123 -0,8687 -0,3853 0,9610 0,9210 0,4593 -0,9274 -0,1032 1 -0,1016 0,5583 0,1295 0,9750 -0,3082 0,8759
JPY -0,0184 -0,4889 -0,1384 0,7570 0,3739 0,7411 -0,1638 -0,2801 0,4354 0,1959 0,0760 -0,1016 1 0,3045 0,6523 0,0363 -0,2191 0,1687
CNY 0,7623 0,2020 0,3893 -0,0492 -0,3111 0,1976 0,5598 0,3954 0,8606 -0,4115 -0,1245 0,5583 0,3045 1 0,2087 0,5643 -0,0267 0,8267
CPL 0,0931 -0,1390 0,0338 0,4635 0,0717 0,3348 -0,0136 -0,1083 0,3643 -0,0587 0,1452 0,1295 0,6523 0,2087 1 0,2614 -0,2135 0,1590
INR 0,9119 0,1980 0,8505 -0,5075 -0,8065 -0,2579 0,9089 0,8912 0,5194 -0,8784 -0,0647 0,9750 0,0363 0,5643 0,2614 1 -0,3342 0,8830
BRL -0,3241 0,5467 -0,0875 0,0699 0,4794 0,1880 -0,3592 -0,2252 0,1816 0,4869 0,2019 -0,3082 -0,2191 -0,0267 -0,2135 -0,3342 1 -0,2527
RUB 0,9514 0,1508 0,7317 -0,3441 -0,6485 -0,0051 0,8751 0,7791 0,7132 -0,7382 -0,1084 0,8759 0,1687 0,8267 0,1590 0,8830 -0,2527 1
2008 Q4 USD AUD CAD CHF CZK EUR GBP ZAR SGD PLN NOK KRW JPY CNY CPL INR BRL RUB
USD 1 -0,1476 0,7593 -0,0891 -0,3079 0,2002 0,5783 0,6660 0,7647 -0,3043 0,0639 0,5432 0,4690 0,6619 0,1087 0,6077 0,1176 0,9095
AUD -0,1476 1 0,3036 -0,5062 -0,2383 -0,4290 0,3535 0,2238 -0,2473 -0,2662 0,3764 0,3440 -0,5615 -0,4163 0,0197 0,1814 0,0797 -0,1063
CAD 0,7593 0,3036 1 -0,4836 -0,6961 -0,2377 0,8892 0,8627 0,3024 -0,6912 0,2384 0,8266 0,0746 0,0996 0,2362 0,8099 -0,1984 0,6388
CHF -0,0891 -0,5062 -0,4836 1 0,7269 0,8236 -0,6071 -0,6716 0,4158 0,5986 -0,3203 -0,5908 0,7541 0,4762 0,1518 -0,4661 0,0705 0,0341
CZK -0,3079 -0,2383 -0,6961 0,7269 1 0,7169 -0,7819 -0,7427 0,2987 0,9539 -0,2893 -0,8117 0,2518 0,4575 -0,3970 -0,8102 0,5155 -0,1170
EUR 0,2002 -0,4290 -0,2377 0,8236 0,7169 1 -0,3544 -0,3319 0,6447 0,6559 -0,3154 -0,4212 0,6758 0,6668 -0,0864 -0,3190 0,2343 0,4202
GBP 0,5783 0,3535 0,8892 -0,6071 -0,7819 -0,3544 1 0,9016 0,0204 -0,7852 0,1289 0,9337 -0,1400 -0,1871 0,2328 0,8814 -0,3250 0,5400
ZAR 0,6660 0,2238 0,8627 -0,6716 -0,7427 -0,3319 0,9016 1 0,1184 -0,6685 0,2256 0,8692 -0,1553 -0,0313 0,0785 0,8360 -0,1305 0,6107
SGD 0,7647 -0,2473 0,3024 0,4158 0,2987 0,6447 0,0204 0,1184 1 0,2680 -0,0572 -0,0049 0,7041 0,9304 -0,0007 0,0907 0,3693 0,7583
PLN -0,3043 -0,2662 -0,6912 0,5986 0,9539 0,6559 -0,7852 -0,6685 0,2680 1 -0,2384 -0,8414 0,1453 0,4628 -0,5222 -0,8398 0,5749 -0,1257
NOK 0,0639 0,3764 0,2384 -0,3203 -0,2893 -0,3154 0,1289 0,2256 -0,0572 -0,2384 1 0,2115 -0,2212 -0,1215 0,2072 0,2018 0,0778 -0,0066
KRW 0,5432 0,3440 0,8266 -0,5908 -0,8117 -0,4212 0,9337 0,8692 -0,0049 -0,8414 0,2115 1 -0,1208 -0,2269 0,4132 0,9613 -0,2880 0,4973
JPY 0,4690 -0,5615 0,0746 0,7541 0,2518 0,6758 -0,1400 -0,1553 0,7041 0,1453 -0,2212 -0,1208 1 0,6468 0,3951 0,0540 -0,1128 0,4389
CNY 0,6619 -0,4163 0,0996 0,4762 0,4575 0,6668 -0,1871 -0,0313 0,9304 0,4628 -0,1215 -0,2269 0,6468 1 -0,2089 -0,1370 0,5197 0,6547
CPL 0,1087 0,0197 0,2362 0,1518 -0,3970 -0,0864 0,2328 0,0785 -0,0007 -0,5222 0,2072 0,4132 0,3951 -0,2089 1 0,5373 -0,4896 0,0514
INR 0,6077 0,1814 0,8099 -0,4661 -0,8102 -0,3190 0,8814 0,8360 0,0907 -0,8398 0,2018 0,9613 0,0540 -0,1370 0,5373 1 -0,3403 0,5506
BRL 0,1176 0,0797 -0,1984 0,0705 0,5155 0,2343 -0,3250 -0,1305 0,3693 0,5749 0,0778 -0,2880 -0,1128 0,5197 -0,4896 -0,3403 1 0,2319
RUB 0,9095 -0,1063 0,6388 0,0341 -0,1170 0,4202 0,5400 0,6107 0,7583 -0,1257 -0,0066 0,4973 0,4389 0,6547 0,0514 0,5506 0,2319 1
Page 70
Chapter 8 G.Carlsson & R.Ericsson Appendices
63
Appendix 17 - Correlation 2009
2009 Q1 USD AUD CAD CHF CZK EUR GBP ZAR SGD PLN NOK KRW JPY CNY CPL INR BRL RUB
USD 1 -0,7418 0,7782 0,9213 0,6475 0,8843 0,2922 0,0111 0,9881 -0,1510 -0,7172 -0,3021 0,9731 0,9899 -0,3602 0,6890 -0,5256 0,9667
AUD -0,7418 1 -0,3839 -0,6998 -0,4637 -0,5688 -0,1465 0,2229 -0,7057 0,0221 0,6538 0,5200 -0,7262 -0,7628 0,4098 -0,3475 0,5649 -0,7300
CAD 0,7782 -0,3839 1 0,6291 0,2879 0,6276 0,5652 0,4165 0,7396 -0,3313 -0,3836 0,1543 0,7019 0,7160 0,0255 0,7842 -0,3800 0,7335
CHF 0,9213 -0,6998 0,6291 1 0,7195 0,9558 0,1115 -0,1684 0,9543 -0,1364 -0,8029 -0,3488 0,9689 0,9242 -0,3293 0,5925 -0,6297 0,8516
CZK 0,6475 -0,4637 0,2879 0,7195 1 0,7385 -0,1497 -0,3111 0,7136 0,5193 -0,6120 -0,5966 0,6630 0,7280 -0,7186 0,0539 -0,1932 0,6372
EUR 0,8843 -0,5688 0,6276 0,9558 0,7385 1 0,0463 -0,0526 0,9309 -0,0865 -0,7324 -0,3096 0,9369 0,8874 -0,3352 0,5858 -0,5863 0,8057
GBP 0,2922 -0,1465 0,5652 0,1115 -0,1497 0,0463 1 0,3747 0,2090 -0,3606 -0,0552 0,4336 0,1825 0,2037 0,2348 0,5703 -0,1551 0,3807
ZAR 0,0111 0,2229 0,4165 -0,1684 -0,3111 -0,0526 0,3747 1 -0,0448 -0,2198 0,3077 0,6482 -0,1005 -0,0685 0,2690 0,4235 0,2030 -0,0362
SGD 0,9881 -0,7057 0,7396 0,9543 0,7136 0,9309 0,2090 -0,0448 1 -0,1033 -0,7492 -0,3360 0,9827 0,9877 -0,3933 0,6443 -0,5355 0,9407
PLN -0,1510 0,0221 -0,3313 -0,1364 0,5193 -0,0865 -0,3606 -0,2198 -0,1033 1 0,0460 -0,5160 -0,1969 -0,0295 -0,6438 -0,6590 0,4283 -0,0969
NOK -0,7172 0,6538 -0,3836 -0,8029 -0,6120 -0,7324 -0,0552 0,3077 -0,7492 0,0460 1 0,3893 -0,7455 -0,7415 0,4065 -0,3500 0,5627 -0,6473
KRW -0,3021 0,5200 0,1543 -0,3488 -0,5966 -0,3096 0,4336 0,6482 -0,3360 -0,5160 0,3893 1 -0,3445 -0,4098 0,6990 0,3997 0,2464 -0,3289
JPY 0,9731 -0,7262 0,7019 0,9689 0,6630 0,9369 0,1825 -0,1005 0,9827 -0,1969 -0,7455 -0,3445 1 0,9645 -0,3130 0,6682 -0,6323 0,9266
CNY 0,9899 -0,7628 0,7160 0,9242 0,7280 0,8874 0,2037 -0,0685 0,9877 -0,0295 -0,7415 -0,4098 0,9645 1 -0,4607 0,5875 -0,4899 0,9585
CPL -0,3602 0,4098 0,0255 -0,3293 -0,7186 -0,3352 0,2348 0,2690 -0,3933 -0,6438 0,4065 0,6990 -0,3130 -0,4607 1 0,3014 -0,0404 -0,3789
INR 0,6890 -0,3475 0,7842 0,5925 0,0539 0,5858 0,5703 0,4235 0,6443 -0,6590 -0,3500 0,3997 0,6682 0,5875 0,3014 1 -0,4457 0,6578
BRL -0,5256 0,5649 -0,3800 -0,6297 -0,1932 -0,5863 -0,1551 0,2030 -0,5355 0,4283 0,5627 0,2464 -0,6323 -0,4899 -0,0404 -0,4457 1 -0,4654
RUB 0,9667 -0,7300 0,7335 0,8516 0,6372 0,8057 0,3807 -0,0362 0,9407 -0,0969 -0,6473 -0,3289 0,9266 0,9585 -0,3789 0,6578 -0,4654 1
2009 Q2 USD AUD CAD CHF CZK EUR GBP ZAR SGD PLN NOK KRW JPY CNY CPL INR BRL RUB
USD 1 -0,3147 0,9440 0,9653 0,5436 0,9410 0,4434 0,5479 0,9949 -0,7429 0,3389 -0,0797 0,9789 0,9993 0,5092 0,9530 -0,2761 0,1730
AUD -0,3147 1 -0,1562 -0,1913 -0,1118 -0,0885 -0,1862 0,2589 -0,2759 0,0230 0,4946 0,3875 -0,3437 -0,3182 0,3404 -0,2515 0,6031 -0,5741
CAD 0,9440 -0,1562 1 0,9160 0,4842 0,9045 0,4768 0,6770 0,9423 -0,7066 0,4470 -0,0262 0,9046 0,9440 0,5874 0,9026 -0,1642 0,0626
CHF 0,9653 -0,1913 0,9160 1 0,5472 0,9818 0,3601 0,5528 0,9795 -0,7828 0,3726 0,0301 0,9674 0,9627 0,5776 0,9427 -0,2865 0,0473
CZK 0,5436 -0,1118 0,4842 0,5472 1 0,5801 0,3807 0,2768 0,5599 -0,0049 -0,0162 -0,0935 0,4969 0,5587 -0,0396 0,4102 -0,1474 0,4968
EUR 0,9410 -0,0885 0,9045 0,9818 0,5801 1 0,3158 0,6135 0,9603 -0,7680 0,4232 0,0522 0,9413 0,9386 0,6058 0,9220 -0,2524 0,0118
GBP 0,4434 -0,1862 0,4768 0,3601 0,3807 0,3158 1 0,1445 0,4201 -0,0775 0,2296 -0,2425 0,3348 0,4461 0,1626 0,3855 0,0073 0,3573
ZAR 0,5479 0,2589 0,6770 0,5528 0,2768 0,6135 0,1445 1 0,5512 -0,4817 0,6342 0,2865 0,4744 0,5522 0,6198 0,5469 0,3015 -0,3192
SGD 0,9949 -0,2759 0,9423 0,9795 0,5599 0,9603 0,4201 0,5512 1 -0,7439 0,3285 -0,0351 0,9849 0,9939 0,5125 0,9581 -0,2871 0,1557
PLN -0,7429 0,0230 -0,7066 -0,7828 -0,0049 -0,7680 -0,0775 -0,4817 -0,7439 1 -0,5905 -0,0796 -0,7632 -0,7298 -0,7710 -0,7815 0,1569 0,4071
NOK 0,3389 0,4946 0,4470 0,3726 -0,0162 0,4232 0,2296 0,6342 0,3285 -0,5905 1 0,1435 0,2530 0,3316 0,8049 0,3686 0,4485 -0,5997
KRW -0,0797 0,3875 -0,0262 0,0301 -0,0935 0,0522 -0,2425 0,2865 -0,0351 -0,0796 0,1435 1 -0,0574 -0,0832 0,3167 0,0828 0,3815 -0,3778
JPY 0,9789 -0,3437 0,9046 0,9674 0,4969 0,9413 0,3348 0,4744 0,9849 -0,7632 0,2530 -0,0574 1 0,9758 0,4759 0,9565 -0,3825 0,1557
CNY 0,9993 -0,3182 0,9440 0,9627 0,5587 0,9386 0,4461 0,5522 0,9939 -0,7298 0,3316 -0,0832 0,9758 1 0,4916 0,9457 -0,2654 0,1788
CPL 0,5092 0,3404 0,5874 0,5776 -0,0396 0,6058 0,1626 0,6198 0,5125 -0,7710 0,8049 0,3167 0,4759 0,4916 1 0,6126 0,1519 -0,5188
INR 0,9530 -0,2515 0,9026 0,9427 0,4102 0,9220 0,3855 0,5469 0,9581 -0,7815 0,3686 0,0828 0,9565 0,9457 0,6126 1 -0,2520 0,0943
BRL -0,2761 0,6031 -0,1642 -0,2865 -0,1474 -0,2524 0,0073 0,3015 -0,2871 0,1569 0,4485 0,3815 -0,3825 -0,2654 0,1519 -0,2520 1 -0,4072
RUB 0,1730 -0,5741 0,0626 0,0473 0,4968 0,0118 0,3573 -0,3192 0,1557 0,4071 -0,5997 -0,3778 0,1557 0,1788 -0,5188 0,0943 -0,4072 1
2009 Q3 USD AUD CAD CHF CZK EUR GBP ZAR SGD PLN NOK KRW JPY CNY CPL INR BRL RUB
USD 1 0,0643 0,8552 0,9414 0,2848 0,9040 0,3006 0,3357 0,9888 -0,7688 0,4587 0,0764 0,9680 0,9999 0,6727 0,9629 -0,2221 -0,0935
AUD 0,0643 1 0,4243 0,2836 0,3159 0,3744 0,2553 0,8455 0,1565 -0,4187 0,5839 0,6706 0,0102 0,0673 0,6507 0,1204 0,7350 -0,5946
CAD 0,8552 0,4243 1 0,8858 0,2785 0,8731 0,4465 0,6586 0,8833 -0,7985 0,5901 0,2956 0,8050 0,8572 0,8042 0,8549 0,0978 -0,2924
CHF 0,9414 0,2836 0,8858 1 0,3755 0,9771 0,2907 0,4886 0,9723 -0,8355 0,4986 0,2435 0,9362 0,9427 0,7505 0,9246 -0,1040 -0,2575
CZK 0,2848 0,3159 0,2785 0,3755 1 0,4427 0,3708 0,2316 0,3364 -0,0073 0,0857 0,0845 0,2537 0,2840 0,2081 0,2234 -0,0388 0,2837
EUR 0,9040 0,3744 0,8731 0,9771 0,4427 1 0,2667 0,5460 0,9428 -0,8169 0,5540 0,2842 0,8950 0,9047 0,7901 0,8984 -0,0541 -0,2936
GBP 0,3006 0,2553 0,4465 0,2907 0,3708 0,2667 1 0,2660 0,3068 -0,1207 0,2857 -0,0392 0,1976 0,3001 0,3175 0,2993 0,2391 0,1714
ZAR 0,3357 0,8455 0,6586 0,4886 0,2316 0,5460 0,2660 1 0,4072 -0,6417 0,6313 0,6396 0,2669 0,3394 0,7711 0,3598 0,5857 -0,6021
SGD 0,9888 0,1565 0,8833 0,9723 0,3364 0,9428 0,3068 0,4072 1 -0,7928 0,4578 0,1647 0,9727 0,9892 0,7002 0,9664 -0,1827 -0,1351
PLN -0,7688 -0,4187 -0,7985 -0,8355 -0,0073 -0,8169 -0,1207 -0,6417 -0,7928 1 -0,6245 -0,3354 -0,7587 -0,7717 -0,8124 -0,7571 -0,1270 0,6006
NOK 0,4587 0,5839 0,5901 0,4986 0,0857 0,5540 0,2857 0,6313 0,4578 -0,6245 1 0,3535 0,3214 0,4601 0,8533 0,4585 0,5229 -0,6612
KRW 0,0764 0,6706 0,2956 0,2435 0,0845 0,2842 -0,0392 0,6396 0,1647 -0,3354 0,3535 1 0,0589 0,0785 0,4919 0,1703 0,5728 -0,5281
JPY 0,9680 0,0102 0,8050 0,9362 0,2537 0,8950 0,1976 0,2669 0,9727 -0,7587 0,3214 0,0589 1 0,9677 0,5791 0,9533 -0,3223 -0,0744
CNY 0,9999 0,0673 0,8572 0,9427 0,2840 0,9047 0,3001 0,3394 0,9892 -0,7717 0,4601 0,0785 0,9677 1 0,6751 0,9619 -0,2209 -0,0980
CPL 0,6727 0,6507 0,8042 0,7505 0,2081 0,7901 0,3175 0,7711 0,7002 -0,8124 0,8533 0,4919 0,5791 0,6751 1 0,6798 0,4263 -0,6257
INR 0,9629 0,1204 0,8549 0,9246 0,2234 0,8984 0,2993 0,3598 0,9664 -0,7571 0,4585 0,1703 0,9533 0,9619 0,6798 1 -0,1242 -0,1225
BRL -0,2221 0,7350 0,0978 -0,1040 -0,0388 -0,0541 0,2391 0,5857 -0,1827 -0,1270 0,5229 0,5728 -0,3223 -0,2209 0,4263 -0,1242 1 -0,4965
RUB -0,0935 -0,5946 -0,2924 -0,2575 0,2837 -0,2936 0,1714 -0,6021 -0,1351 0,6006 -0,6612 -0,5281 -0,0744 -0,0980 -0,6257 -0,1225 -0,4965 1
2009 Q4 USD AUD CAD CHF CZK EUR GBP ZAR SGD PLN NOK KRW JPY CNY CPL INR BRL RUB
USD 1 -0,1842 0,5119 0,7725 0,0843 0,7384 0,3729 -0,1820 0,9687 -0,1606 0,5271 0,2732 0,8699 0,9998 0,5157 0,9489 -0,1385 0,2619
AUD -0,1842 1 0,6094 0,3197 0,3688 0,3772 0,1318 0,9534 -0,0197 -0,5793 0,5001 0,5521 -0,1882 -0,1799 0,6564 -0,1653 0,8993 -0,6646
CAD 0,5119 0,6094 1 0,7151 0,2289 0,7260 0,5002 0,5914 0,6194 -0,4784 0,7305 0,5819 0,4005 0,5153 0,8240 0,5614 0,6138 -0,2942
CHF 0,7725 0,3197 0,7151 1 0,2906 0,9538 0,2934 0,2938 0,8733 -0,4755 0,6543 0,5648 0,7656 0,7753 0,7645 0,7618 0,2735 -0,1642
CZK 0,0843 0,3688 0,2289 0,2906 1 0,4002 0,3738 0,3286 0,1843 0,2751 0,1018 0,2340 0,0095 0,0815 0,2383 0,0557 0,2786 0,2328
EUR 0,7384 0,3772 0,7260 0,9538 0,4002 1 0,3038 0,3515 0,8478 -0,4370 0,6639 0,5700 0,7163 0,7398 0,7875 0,7374 0,2641 -0,1431
GBP 0,3729 0,1318 0,5002 0,2934 0,3738 0,3038 1 0,1089 0,3949 0,1830 0,2938 0,1863 0,1139 0,3719 0,3677 0,4297 0,2577 0,3281
ZAR -0,1820 0,9534 0,5914 0,2938 0,3286 0,3515 0,1089 1 -0,0205 -0,5946 0,5269 0,5517 -0,1986 -0,1763 0,6541 -0,1653 0,8552 -0,6747
SGD 0,9687 -0,0197 0,6194 0,8733 0,1843 0,8478 0,3949 -0,0205 1 -0,2288 0,5529 0,4409 0,8823 0,9693 0,6058 0,9572 -0,0152 0,1843
PLN -0,1606 -0,5793 -0,4784 -0,4755 0,2751 -0,4370 0,1830 -0,5946 -0,2288 1 -0,6600 -0,3858 -0,2172 -0,1673 -0,6750 -0,1241 -0,5631 0,8034
NOK 0,5271 0,5001 0,7305 0,6543 0,1018 0,6639 0,2938 0,5269 0,5529 -0,6600 1 0,4101 0,3399 0,5324 0,8699 0,4333 0,5413 -0,4817
KRW 0,2732 0,5521 0,5819 0,5648 0,2340 0,5700 0,1863 0,5517 0,4409 -0,3858 0,4101 1 0,2261 0,2786 0,6166 0,3640 0,4703 -0,2811
JPY 0,8699 -0,1882 0,4005 0,7656 0,0095 0,7163 0,1139 -0,1986 0,8823 -0,2172 0,3399 0,2261 1 0,8675 0,3837 0,8695 -0,1798 0,1621
CNY 0,9998 -0,1799 0,5153 0,7753 0,0815 0,7398 0,3719 -0,1763 0,9693 -0,1673 0,5324 0,2786 0,8675 1 0,5215 0,9482 -0,1335 0,2553
CPL 0,5157 0,6564 0,8240 0,7645 0,2383 0,7875 0,3677 0,6541 0,6058 -0,6750 0,8699 0,6166 0,3837 0,5215 1 0,4793 0,6432 -0,4888
INR 0,9489 -0,1653 0,5614 0,7618 0,0557 0,7374 0,4297 -0,1653 0,9572 -0,1241 0,4333 0,3640 0,8695 0,9482 0,4793 1 -0,1366 0,3062
BRL -0,1385 0,8993 0,6138 0,2735 0,2786 0,2641 0,2577 0,8552 -0,0152 -0,5631 0,5413 0,4703 -0,1798 -0,1335 0,6432 -0,1366 1 -0,6387
RUB 0,2619 -0,6646 -0,2942 -0,1642 0,2328 -0,1431 0,3281 -0,6747 0,1843 0,8034 -0,4817 -0,2811 0,1621 0,2553 -0,4888 0,3062 -0,6387 1
Page 71
Chapter 8 G.Carlsson & R.Ericsson Appendices
64
Appendix 18 - Correlation 2010
2010 Q1 USD AUD CAD CHF CZK EUR GBP ZAR SGD PLN NOK KRW JPY CNY CPL INR BRL RUB
USD 1 -0,6473 0,5928 0,9082 0,0982 0,9017 0,6476 -0,4374 0,9804 -0,2183 0,3841 0,2917 0,8805 1,0000 0,5985 0,9574 -0,5618 0,6031
AUD -0,6473 1 0,0761 -0,3710 0,3685 -0,3378 -0,0650 0,8390 -0,5227 0,2930 0,1982 0,2272 -0,6663 -0,6470 0,0941 -0,5556 0,9395 -0,1607
CAD 0,5928 0,0761 1 0,7194 0,3012 0,7161 0,7865 0,2352 0,6851 -0,0159 0,5072 0,5239 0,4624 0,5926 0,6934 0,6803 0,1936 0,5087
CHF 0,9082 -0,3710 0,7194 1 0,2921 0,9720 0,7253 -0,2403 0,9510 -0,0628 0,5054 0,3772 0,8412 0,9078 0,7039 0,9189 -0,3068 0,7449
CZK 0,0982 0,3685 0,3012 0,2921 1 0,4116 0,4907 0,4935 0,1460 0,4853 0,1556 0,2502 -0,0965 0,0978 0,3911 0,0316 0,3267 0,3951
EUR 0,9017 -0,3378 0,7161 0,9720 0,4116 1 0,7845 -0,1671 0,9355 -0,0627 0,5107 0,4060 0,7666 0,9014 0,7390 0,8937 -0,2830 0,7408
GBP 0,6476 -0,0650 0,7865 0,7253 0,4907 0,7845 1 0,1876 0,6942 -0,0088 0,2672 0,4258 0,4447 0,6466 0,6953 0,6775 0,0252 0,5218
ZAR -0,4374 0,8390 0,2352 -0,2403 0,4935 -0,1671 0,1876 1 -0,3315 0,1516 0,1473 0,3724 -0,5802 -0,4356 0,2035 -0,3831 0,8075 -0,1197
SGD 0,9804 -0,5227 0,6851 0,9510 0,1460 0,9355 0,6942 -0,3315 1 -0,1632 0,4468 0,4153 0,8870 0,9807 0,6789 0,9776 -0,4445 0,6801
PLN -0,2183 0,2930 -0,0159 -0,0628 0,4853 -0,0627 -0,0088 0,1516 -0,1632 1 -0,2601 0,1115 -0,1426 -0,2191 -0,0551 -0,1970 0,1946 0,2773
NOK 0,3841 0,1982 0,5072 0,5054 0,1556 0,5107 0,2672 0,1473 0,4468 -0,2601 1 0,2333 0,2980 0,3849 0,6642 0,3875 0,2732 0,1710
KRW 0,2917 0,2272 0,5239 0,3772 0,2502 0,4060 0,4258 0,3724 0,4153 0,1115 0,2333 1 0,1953 0,2946 0,5379 0,4086 0,1824 0,5246
JPY 0,8805 -0,6663 0,4624 0,8412 -0,0965 0,7666 0,4447 -0,5802 0,8870 -0,1426 0,2980 0,1953 1 0,8797 0,4626 0,8993 -0,5666 0,5540
CNY 1,0000 -0,6470 0,5926 0,9078 0,0978 0,9014 0,6466 -0,4356 0,9807 -0,2191 0,3849 0,2946 0,8797 1 0,5988 0,9572 -0,5625 0,6034
CPL 0,5985 0,0941 0,6934 0,7039 0,3911 0,7390 0,6953 0,2035 0,6789 -0,0551 0,6642 0,5379 0,4626 0,5988 1 0,6188 0,1673 0,4483
INR 0,9574 -0,5556 0,6803 0,9189 0,0316 0,8937 0,6775 -0,3831 0,9776 -0,1970 0,3875 0,4086 0,8993 0,9572 0,6188 1 -0,4693 0,6705
BRL -0,5618 0,9395 0,1936 -0,3068 0,3267 -0,2830 0,0252 0,8075 -0,4445 0,1946 0,2732 0,1824 -0,5666 -0,5625 0,1673 -0,4693 1 -0,2358
RUB 0,6031 -0,1607 0,5087 0,7449 0,3951 0,7408 0,5218 -0,1197 0,6801 0,2773 0,1710 0,5246 0,5540 0,6034 0,4483 0,6705 -0,2358 1
2010 Q2 USD AUD CAD CHF CZK EUR GBP ZAR SGD PLN NOK KRW JPY CNY CPL INR BRL RUB
USD 1 -0,4541 0,3671 0,8272 0,4749 0,7368 0,7124 0,1272 0,9550 -0,1432 0,1555 0,4279 0,7783 0,9999 0,5490 0,8617 -0,4584 0,6595
AUD -0,4541 1 0,4981 -0,1923 -0,4052 -0,4560 -0,3892 0,5693 -0,1919 0,4842 0,5237 0,4824 -0,0259 -0,4540 0,2874 -0,0081 0,8460 0,2218
CAD 0,3671 0,4981 1 0,3453 -0,1688 0,0070 0,1541 0,6880 0,5512 0,2905 0,3597 0,8201 0,4816 0,3678 0,5624 0,7141 0,3645 0,6550
CHF 0,8272 -0,1923 0,3453 1 0,6922 0,9045 0,8273 0,3222 0,8693 -0,0087 0,3970 0,3902 0,7544 0,8260 0,6699 0,7634 -0,1042 0,7541
CZK 0,4749 -0,4052 -0,1688 0,6922 1 0,8590 0,7979 0,0898 0,4027 0,0602 -0,0337 -0,2435 0,3442 0,4713 0,2727 0,1993 -0,0997 0,2299
EUR 0,7368 -0,4560 0,0070 0,9045 0,8590 1 0,8980 0,0513 0,6904 -0,1260 0,1850 0,0199 0,5469 0,7345 0,4487 0,5130 -0,2272 0,4890
GBP 0,7124 -0,3892 0,1541 0,8273 0,7979 0,8980 1 0,1389 0,6651 -0,0727 0,0040 0,0430 0,4865 0,7086 0,4741 0,5355 -0,1732 0,4592
ZAR 0,1272 0,5693 0,6880 0,3222 0,0898 0,0513 0,1389 1 0,3324 0,3215 0,3298 0,5786 0,3696 0,1282 0,4832 0,4172 0,5240 0,5258
SGD 0,9550 -0,1919 0,5512 0,8693 0,4027 0,6904 0,6651 0,3324 1 -0,0317 0,3489 0,6328 0,8660 0,9557 0,7049 0,9465 -0,2437 0,8140
PLN -0,1432 0,4842 0,2905 -0,0087 0,0602 -0,1260 -0,0727 0,3215 -0,0317 1 0,3276 0,2196 0,1160 -0,1440 0,3777 -0,0019 0,4733 -0,0184
NOK 0,1555 0,5237 0,3597 0,3970 -0,0337 0,1850 0,0040 0,3298 0,3489 0,3276 1 0,5860 0,4368 0,1568 0,5265 0,3774 0,4042 0,5135
KRW 0,4279 0,4824 0,8201 0,3902 -0,2435 0,0199 0,0430 0,5786 0,6328 0,2196 0,5860 1 0,6225 0,4309 0,6768 0,7624 0,2240 0,7362
JPY 0,7783 -0,0259 0,4816 0,7544 0,3442 0,5469 0,4865 0,3696 0,8660 0,1160 0,4368 0,6225 1 0,7795 0,6713 0,7964 -0,1272 0,7311
CNY 0,9999 -0,4540 0,3678 0,8260 0,4713 0,7345 0,7086 0,1282 0,9557 -0,1440 0,1568 0,4309 0,7795 1 0,5487 0,8621 -0,4604 0,6601
CPL 0,5490 0,2874 0,5624 0,6699 0,2727 0,4487 0,4741 0,4832 0,7049 0,3777 0,5265 0,6768 0,6713 0,5487 1 0,7060 0,2340 0,6906
INR 0,8617 -0,0081 0,7141 0,7634 0,1993 0,5130 0,5355 0,4172 0,9465 -0,0019 0,3774 0,7624 0,7964 0,8621 0,7060 1 -0,1290 0,8673
BRL -0,4584 0,8460 0,3645 -0,1042 -0,0997 -0,2272 -0,1732 0,5240 -0,2437 0,4733 0,4042 0,2240 -0,1272 -0,4604 0,2340 -0,1290 1 0,1146
RUB 0,6595 0,2218 0,6550 0,7541 0,2299 0,4890 0,4592 0,5258 0,8140 -0,0184 0,5135 0,7362 0,7311 0,6601 0,6906 0,8673 0,1146 1
2010 Q3 USD AUD CAD CHF CZK EUR GBP ZAR SGD PLN NOK KRW JPY CNY CPL INR BRL RUB
USD 1 0,3691 0,7693 0,5646 -0,2170 -0,1547 0,4280 0,7402 0,9333 -0,4542 -0,0124 0,5989 0,8663 0,9998 0,7038 0,8379 0,6378 0,6969
AUD 0,3691 1 0,7966 0,1153 -0,7134 -0,6251 -0,4080 0,7455 0,6515 -0,2893 0,5727 0,8999 0,4771 0,3761 0,6553 0,7849 0,7933 0,8247
CAD 0,7693 0,7966 1 0,1990 -0,6883 -0,6467 -0,1402 0,9059 0,9122 -0,5119 0,1752 0,8819 0,7163 0,7737 0,7120 0,9548 0,8645 0,8436
CHF 0,5646 0,1153 0,1990 1 0,3953 0,5241 0,7191 0,3492 0,4787 0,0663 0,3378 0,1821 0,5709 0,5666 0,5510 0,3562 0,2859 0,3956
CZK -0,2170 -0,7134 -0,6883 0,3953 1 0,9432 0,6641 -0,5215 -0,4498 0,5754 -0,1104 -0,6609 -0,3042 -0,2248 -0,2914 -0,5649 -0,6029 -0,4782
EUR -0,1547 -0,6251 -0,6467 0,5241 0,9432 1 0,7339 -0,5020 -0,3750 0,5560 0,0993 -0,5885 -0,1998 -0,1624 -0,1490 -0,4994 -0,5126 -0,4054
GBP 0,4280 -0,4080 -0,1402 0,7191 0,6641 0,7339 1 -0,0837 0,1799 0,1758 -0,0824 -0,2494 0,2356 0,4219 0,2371 0,0037 -0,1207 -0,0594
ZAR 0,7402 0,7455 0,9059 0,3492 -0,5215 -0,5020 -0,0837 1 0,8772 -0,4495 0,2220 0,8175 0,7429 0,7459 0,7083 0,8918 0,8213 0,8374
SGD 0,9333 0,6515 0,9122 0,4787 -0,4498 -0,3750 0,1799 0,8772 1 -0,5434 0,1744 0,7920 0,8853 0,9364 0,7916 0,9492 0,8395 0,8567
PLN -0,4542 -0,2893 -0,5119 0,0663 0,5754 0,5560 0,1758 -0,4495 -0,5434 1 0,1680 -0,2966 -0,5130 -0,4608 -0,1418 -0,4187 -0,6126 -0,3506
NOK -0,0124 0,5727 0,1752 0,3378 -0,1104 0,0993 -0,0824 0,2220 0,1744 0,1680 1 0,4383 0,1880 -0,0120 0,4166 0,2559 0,3308 0,4331
KRW 0,5989 0,8999 0,8819 0,1821 -0,6609 -0,5885 -0,2494 0,8175 0,7920 -0,2966 0,4383 1 0,6076 0,6035 0,7251 0,9158 0,7529 0,8805
JPY 0,8663 0,4771 0,7163 0,5709 -0,3042 -0,1998 0,2356 0,7429 0,8853 -0,5130 0,1880 0,6076 1 0,8702 0,7098 0,7674 0,6751 0,7163
CNY 0,9998 0,3761 0,7737 0,5666 -0,2248 -0,1624 0,4219 0,7459 0,9364 -0,4608 -0,0120 0,6035 0,8702 1 0,7051 0,8413 0,6443 0,7008
CPL 0,7038 0,6553 0,7120 0,5510 -0,2914 -0,1490 0,2371 0,7083 0,7916 -0,1418 0,4166 0,7251 0,7098 0,7051 1 0,7851 0,7027 0,7527
INR 0,8379 0,7849 0,9548 0,3562 -0,5649 -0,4994 0,0037 0,8918 0,9492 -0,4187 0,2559 0,9158 0,7674 0,8413 0,7851 1 0,8203 0,9099
BRL 0,6378 0,7933 0,8645 0,2859 -0,6029 -0,5126 -0,1207 0,8213 0,8395 -0,6126 0,3308 0,7529 0,6751 0,6443 0,7027 0,8203 1 0,8012
RUB 0,6969 0,8247 0,8436 0,3956 -0,4782 -0,4054 -0,0594 0,8374 0,8567 -0,3506 0,4331 0,8805 0,7163 0,7008 0,7527 0,9099 0,8012 1
2010 Q4 USD AUD CAD CHF CZK EUR GBP ZAR SGD PLN NOK KRW JPY CNY CPL INR BRL RUB
USD 1 0,5748 0,9068 0,2895 -0,5894 -0,3731 0,3289 0,7674 0,9139 -0,4950 -0,0702 0,7352 0,7450 0,9940 0,6126 0,9092 0,8064 0,7916
AUD 0,5748 1 0,7788 0,1762 -0,6766 -0,6327 -0,1035 0,7853 0,7125 -0,3409 -0,2371 0,7553 0,4072 0,5951 0,6341 0,7746 0,6375 0,5029
CAD 0,9068 0,7788 1 0,1288 -0,7155 -0,5478 0,0501 0,8556 0,8851 -0,4403 -0,1470 0,8357 0,5971 0,9069 0,5818 0,9658 0,8071 0,7920
CHF 0,2895 0,1762 0,1288 1 -0,1799 -0,2449 0,4635 0,4154 0,4639 -0,5143 -0,3969 -0,0990 0,6661 0,3414 0,4957 0,0880 0,4656 -0,0992
CZK -0,5894 -0,6766 -0,7155 -0,1799 1 0,8969 0,3188 -0,7257 -0,7422 0,6932 0,6212 -0,5157 -0,6051 -0,6439 -0,4788 -0,6657 -0,5722 -0,3241
EUR -0,3731 -0,6327 -0,5478 -0,2449 0,8969 1 0,4438 -0,7087 -0,6440 0,7183 0,8335 -0,3204 -0,5859 -0,4473 -0,4071 -0,4646 -0,4792 -0,1005
GBP 0,3289 -0,1035 0,0501 0,4635 0,3188 0,4438 1 0,0244 0,2116 -0,0183 0,4122 0,0058 0,2758 0,3006 0,3176 0,0836 0,2457 0,2403
ZAR 0,7674 0,7853 0,8556 0,4154 -0,7257 -0,7087 0,0244 1 0,9006 -0,5949 -0,4238 0,6288 0,7460 0,8025 0,6942 0,7962 0,8146 0,4892
SGD 0,9139 0,7125 0,8851 0,4639 -0,7422 -0,6440 0,2116 0,9006 1 -0,7129 -0,3792 0,6462 0,8646 0,9440 0,7199 0,8522 0,8825 0,6076
PLN -0,4950 -0,3409 -0,4403 -0,5143 0,6932 0,7183 -0,0183 -0,5949 -0,7129 1 0,7164 -0,0637 -0,7599 -0,5704 -0,3569 -0,3525 -0,6481 -0,0767
NOK -0,0702 -0,2371 -0,1470 -0,3969 0,6212 0,8335 0,4122 -0,4238 -0,3792 0,7164 1 0,1556 -0,5283 -0,1624 -0,2296 -0,0413 -0,2736 0,2810
KRW 0,7352 0,7553 0,8357 -0,0990 -0,5157 -0,3204 0,0058 0,6288 0,6462 -0,0637 0,1556 1 0,3065 0,7085 0,4954 0,9076 0,5155 0,7927
JPY 0,7450 0,4072 0,5971 0,6661 -0,6051 -0,5859 0,2758 0,7460 0,8646 -0,7599 -0,5283 0,3065 1 0,7921 0,6576 0,5456 0,6938 0,3035
CNY 0,9940 0,5951 0,9069 0,3414 -0,6439 -0,4473 0,3006 0,8025 0,9440 -0,5704 -0,1624 0,7085 0,7921 1 0,6339 0,9016 0,8247 0,7408
CPL 0,6126 0,6341 0,5818 0,4957 -0,4788 -0,4071 0,3176 0,6942 0,7199 -0,3569 -0,2296 0,4954 0,6576 0,6339 1 0,5746 0,6382 0,3296
INR 0,9092 0,7746 0,9658 0,0880 -0,6657 -0,4646 0,0836 0,7962 0,8522 -0,3525 -0,0413 0,9076 0,5456 0,9016 0,5746 1 0,7410 0,8303
BRL 0,8064 0,6375 0,8071 0,4656 -0,5722 -0,4792 0,2457 0,8146 0,8825 -0,6481 -0,2736 0,5155 0,6938 0,8247 0,6382 0,7410 1 0,5910
RUB 0,7916 0,5029 0,7920 -0,0992 -0,3241 -0,1005 0,2403 0,4892 0,6076 -0,0767 0,2810 0,7927 0,3035 0,7408 0,3296 0,8303 0,5910 1
Page 72
Chapter 8 G.Carlsson & R.Ericsson Appendices
65
Appendix 19 - Correlation 2011
2011 Q1 USD AUD CAD CHF CZK EUR GBP ZAR SGD PLN NOK KRW JPY CNY CPL INR BRL RUB
USD 1 -0,0322 0,9288 0,0435 0,0510 0,4027 0,7705 0,5160 0,7960 0,0601 0,6084 0,7843 0,4706 0,9853 0,4179 0,9247 0,8062 0,8932
AUD -0,0322 1 0,2071 0,2876 -0,5275 -0,4846 -0,1965 0,6023 0,3551 -0,3988 -0,2996 0,0893 0,1280 0,0593 0,5020 0,1421 0,2896 -0,1502
CAD 0,9288 0,2071 1 -0,0449 -0,0654 0,2671 0,6073 0,6194 0,7886 0,0424 0,5430 0,8192 0,3370 0,9204 0,4096 0,9532 0,8527 0,8693
CHF 0,0435 0,2876 -0,0449 1 -0,3749 -0,4094 0,1924 0,5145 0,4014 -0,6143 -0,4082 -0,3313 0,6478 0,1456 0,5995 -0,1256 0,3275 -0,2286
CZK 0,0510 -0,5275 -0,0654 -0,3749 1 0,7737 0,3752 -0,4966 -0,3296 0,8096 0,5745 0,2822 -0,3679 -0,0668 -0,3663 0,0502 -0,2756 0,2824
EUR 0,4027 -0,4846 0,2671 -0,4094 0,7737 1 0,5969 -0,3872 -0,1444 0,8186 0,8950 0,5858 -0,3541 0,2791 -0,2012 0,3861 -0,0492 0,6013
GBP 0,7705 -0,1965 0,6073 0,1924 0,3752 0,5969 1 0,2539 0,5488 0,1974 0,6525 0,5721 0,3660 0,7367 0,3759 0,6165 0,5260 0,6916
ZAR 0,5160 0,6023 0,6194 0,5145 -0,4966 -0,3872 0,2539 1 0,8242 -0,5273 -0,1245 0,2549 0,6434 0,6076 0,7495 0,5109 0,7895 0,2764
SGD 0,7960 0,3551 0,7886 0,4014 -0,3296 -0,1444 0,5488 0,8242 1 -0,4634 0,0816 0,4672 0,7913 0,8735 0,6854 0,7306 0,8966 0,5138
PLN 0,0601 -0,3988 0,0424 -0,6143 0,8096 0,8186 0,1974 -0,5273 -0,4634 1 0,7319 0,4535 -0,6638 -0,0889 -0,4669 0,1520 -0,3156 0,4071
NOK 0,6084 -0,2996 0,5430 -0,4082 0,5745 0,8950 0,6525 -0,1245 0,0816 0,7319 1 0,7977 -0,2860 0,4834 -0,0534 0,6303 0,2236 0,8203
KRW 0,7843 0,0893 0,8192 -0,3313 0,2822 0,5858 0,5721 0,2549 0,4672 0,4535 0,7977 1 -0,0339 0,7153 0,1498 0,9018 0,5459 0,8950
JPY 0,4706 0,1280 0,3370 0,6478 -0,3679 -0,3541 0,3660 0,6434 0,7913 -0,6638 -0,2860 -0,0339 1 0,5782 0,6006 0,2676 0,5856 0,0949
CNY 0,9853 0,0593 0,9204 0,1456 -0,0668 0,2791 0,7367 0,6076 0,8735 -0,0889 0,4834 0,7153 0,5782 1 0,4972 0,9028 0,8457 0,8158
CPL 0,4179 0,5020 0,4096 0,5995 -0,3663 -0,2012 0,3759 0,7495 0,6854 -0,4669 -0,0534 0,1498 0,6006 0,4972 1 0,3216 0,6407 0,1456
INR 0,9247 0,1421 0,9532 -0,1256 0,0502 0,3861 0,6165 0,5109 0,7306 0,1520 0,6303 0,9018 0,2676 0,9028 0,3216 1 0,7752 0,8958
BRL 0,8062 0,2896 0,8527 0,3275 -0,2756 -0,0492 0,5260 0,7895 0,8966 -0,3156 0,2236 0,5459 0,5856 0,8457 0,6407 0,7752 1 0,6317
RUB 0,8932 -0,1502 0,8693 -0,2286 0,2824 0,6013 0,6916 0,2764 0,5138 0,4071 0,8203 0,8950 0,0949 0,8158 0,1456 0,8958 0,6317 1
2011 Q2 USD AUD CAD CHF CZK EUR GBP ZAR SGD PLN NOK KRW JPY CNY CPL INR BRL RUB
USD 1 0,3565 0,9633 0,1786 0,4593 0,8521 0,9453 0,8041 0,9586 0,5290 0,8690 0,8914 0,7129 0,9944 0,7631 0,9619 0,9672 0,9052
AUD 0,3565 1 0,4198 0,2049 0,0523 0,3040 0,3191 0,6604 0,4480 0,3794 0,3332 0,5209 0,2546 0,3695 0,6115 0,4683 0,4376 0,1817
CAD 0,9633 0,4198 1 0,0642 0,3826 0,8172 0,8823 0,7666 0,9106 0,5437 0,9049 0,9148 0,5606 0,9573 0,6852 0,9564 0,9384 0,9306
CHF 0,1786 0,2049 0,0642 1 -0,1239 -0,0365 0,2458 0,4345 0,3155 -0,2277 -0,0854 -0,0585 0,6256 0,2186 0,4374 0,0613 0,2925 -0,0328
CZK 0,4593 0,0523 0,3826 -0,1239 1 0,7781 0,5671 0,3660 0,3475 0,8276 0,5583 0,5374 0,2812 0,3993 0,2413 0,5160 0,3859 0,4649
EUR 0,8521 0,3040 0,8172 -0,0365 0,7781 1 0,8420 0,6887 0,7336 0,8072 0,8890 0,8753 0,4737 0,8108 0,5604 0,9091 0,7808 0,8320
GBP 0,9453 0,3191 0,8823 0,2458 0,5671 0,8420 1 0,7812 0,9123 0,5614 0,8115 0,8193 0,7439 0,9323 0,7548 0,8900 0,9204 0,8354
ZAR 0,8041 0,6604 0,7666 0,4345 0,3660 0,6887 0,7812 1 0,8376 0,4978 0,6723 0,7350 0,7287 0,8052 0,8508 0,8148 0,8498 0,6037
SGD 0,9586 0,4480 0,9106 0,3155 0,3475 0,7336 0,9123 0,8376 1 0,3886 0,7461 0,8195 0,8262 0,9749 0,8296 0,8959 0,9546 0,7906
PLN 0,5290 0,3794 0,5437 -0,2277 0,8276 0,8072 0,5614 0,4978 0,3886 1 0,7173 0,7374 0,1086 0,4627 0,3267 0,6605 0,4918 0,5708
NOK 0,8690 0,3332 0,9049 -0,0854 0,5583 0,8890 0,8115 0,6723 0,7461 0,7173 1 0,9244 0,3604 0,8285 0,5283 0,9215 0,8193 0,9457
KRW 0,8914 0,5209 0,9148 -0,0585 0,5374 0,8753 0,8193 0,7350 0,8195 0,7374 0,9244 1 0,4406 0,8660 0,6365 0,9577 0,8606 0,8757
JPY 0,7129 0,2546 0,5606 0,6256 0,2812 0,4737 0,7439 0,7287 0,8262 0,1086 0,3604 0,4406 1 0,7451 0,7672 0,5802 0,7304 0,4279
CNY 0,9944 0,3695 0,9573 0,2186 0,3993 0,8108 0,9323 0,8052 0,9749 0,4627 0,8285 0,8660 0,7451 1 0,7743 0,9440 0,9659 0,8785
CPL 0,7631 0,6115 0,6852 0,4374 0,2413 0,5604 0,7548 0,8508 0,8296 0,3267 0,5283 0,6365 0,7672 0,7743 1 0,7214 0,7969 0,5210
INR 0,9619 0,4683 0,9564 0,0613 0,5160 0,9091 0,8900 0,8148 0,8959 0,6605 0,9215 0,9577 0,5802 0,9440 0,7214 1 0,9314 0,8952
BRL 0,9672 0,4376 0,9384 0,2925 0,3859 0,7808 0,9204 0,8498 0,9546 0,4918 0,8193 0,8606 0,7304 0,9659 0,7969 0,9314 1 0,8486
RUB 0,9052 0,1817 0,9306 -0,0328 0,4649 0,8320 0,8354 0,6037 0,7906 0,5708 0,9457 0,8757 0,4279 0,8785 0,5210 0,8952 0,8486 1
2011 Q3 USD AUD CAD CHF CZK EUR GBP ZAR SGD PLN NOK KRW JPY CNY CPL INR BRL RUB
USD 1 0,0973 0,9589 0,0129 0,4137 0,7881 0,9737 0,8271 0,9474 0,6342 0,6775 0,9245 0,9360 0,9926 0,8239 0,9725 0,8957 0,7563
AUD 0,0973 1 0,1802 0,4980 0,0312 0,1265 0,0778 0,4536 0,3470 0,3014 0,1404 0,3562 0,2276 0,1659 0,4599 0,1788 0,2999 -0,0847
CAD 0,9589 0,1802 1 0,0477 0,3309 0,7157 0,9333 0,8210 0,9358 0,5613 0,7050 0,9057 0,8621 0,9659 0,7773 0,9227 0,9035 0,7886
CHF 0,0129 0,4980 0,0477 1 0,1872 0,1847 -0,0133 0,1326 0,2484 0,1110 0,4271 0,1656 0,1412 0,0951 0,1324 -0,0153 0,3342 0,2922
CZK 0,4137 0,0312 0,3309 0,1872 1 0,8104 0,5163 0,3530 0,4444 0,8312 0,6070 0,5326 0,4638 0,3996 0,2606 0,4480 0,4484 0,4411
EUR 0,7881 0,1265 0,7157 0,1847 0,8104 1 0,8227 0,7022 0,7755 0,8333 0,7757 0,8103 0,7743 0,7802 0,6053 0,8195 0,7693 0,6768
GBP 0,9737 0,0778 0,9333 -0,0133 0,5163 0,8227 1 0,7895 0,9261 0,6984 0,7088 0,9166 0,9116 0,9609 0,7991 0,9452 0,8582 0,7644
ZAR 0,8271 0,4536 0,8210 0,1326 0,3530 0,7022 0,7895 1 0,8500 0,6557 0,6174 0,8645 0,8399 0,8266 0,8601 0,8899 0,8182 0,4934
SGD 0,9474 0,3470 0,9358 0,2484 0,4444 0,7755 0,9261 0,8500 1 0,6782 0,7073 0,9636 0,9436 0,9696 0,8592 0,9255 0,9331 0,7379
PLN 0,6342 0,3014 0,5613 0,1110 0,8312 0,8333 0,6984 0,6557 0,6782 1 0,6116 0,7830 0,6892 0,6228 0,5684 0,6933 0,6342 0,4261
NOK 0,6775 0,1404 0,7050 0,4271 0,6070 0,7757 0,7088 0,6174 0,7073 0,6116 1 0,7061 0,6043 0,6861 0,4778 0,6427 0,8000 0,8559
KRW 0,9245 0,3562 0,9057 0,1656 0,5326 0,8103 0,9166 0,8645 0,9636 0,7830 0,7061 1 0,9159 0,9369 0,8299 0,9349 0,9160 0,6746
JPY 0,9360 0,2276 0,8621 0,1412 0,4638 0,7743 0,9116 0,8399 0,9436 0,6892 0,6043 0,9159 1 0,9364 0,8539 0,9363 0,8401 0,6365
CNY 0,9926 0,1659 0,9659 0,0951 0,3996 0,7802 0,9609 0,8266 0,9696 0,6228 0,6861 0,9369 0,9364 1 0,8273 0,9618 0,9160 0,7662
CPL 0,8239 0,4599 0,7773 0,1324 0,2606 0,6053 0,7991 0,8601 0,8592 0,5684 0,4778 0,8299 0,8539 0,8273 1 0,8465 0,7826 0,4648
INR 0,9725 0,1788 0,9227 -0,0153 0,4480 0,8195 0,9452 0,8899 0,9255 0,6933 0,6427 0,9349 0,9363 0,9618 0,8465 1 0,8734 0,6478
BRL 0,8957 0,2999 0,9035 0,3342 0,4484 0,7693 0,8582 0,8182 0,9331 0,6342 0,8000 0,9160 0,8401 0,9160 0,7826 0,8734 1 0,7845
RUB 0,7563 -0,0847 0,7886 0,2922 0,4411 0,6768 0,7644 0,4934 0,7379 0,4261 0,8559 0,6746 0,6365 0,7662 0,4648 0,6478 0,7845 1
2011 Q4 USD AUD CAD CHF CZK EUR GBP ZAR SGD PLN NOK KRW JPY CNY CPL INR BRL RUB
USD 1 0,3539 0,8267 -0,1167 0,0329 0,4699 0,9140 0,5676 0,6478 0,1597 -0,0060 0,6521 0,7245 0,9173 0,7617 0,8266 0,2981 -0,1872
AUD 0,3539 1 0,6115 0,5570 0,2694 0,4645 0,3449 0,3395 0,7888 0,0597 0,6598 0,7642 0,5289 0,5349 0,6337 0,2953 0,6135 0,3443
CAD 0,8267 0,6115 1 0,0433 -0,0184 0,3453 0,7580 0,6438 0,7085 0,1783 0,1537 0,7587 0,5755 0,7940 0,7887 0,7572 0,5483 0,2005
CHF -0,1167 0,5570 0,0433 1 0,4757 0,3809 -0,0265 -0,2537 0,6070 -0,2733 0,8286 0,3931 0,4492 0,2081 0,1316 -0,2317 0,3583 0,2888
CZK 0,0329 0,2694 -0,0184 0,4757 1 0,8179 0,2232 -0,0474 0,3721 0,3171 0,5270 0,4060 0,3427 0,1522 0,0419 0,0783 0,2637 0,0972
EUR 0,4699 0,4645 0,3453 0,3809 0,8179 1 0,5810 0,2920 0,6026 0,3349 0,5075 0,6212 0,6123 0,5299 0,4418 0,4662 0,3850 0,0054
GBP 0,9140 0,3449 0,7580 -0,0265 0,2232 0,5810 1 0,5317 0,6634 0,2839 0,0182 0,6855 0,6865 0,8330 0,7524 0,8133 0,3608 -0,1361
ZAR 0,5676 0,3395 0,6438 -0,2537 -0,0474 0,2920 0,5317 1 0,2628 0,6741 -0,1435 0,5357 0,0843 0,3240 0,6790 0,8703 0,6710 0,3155
SGD 0,6478 0,7888 0,7085 0,6070 0,3721 0,6026 0,6634 0,2628 1 -0,0654 0,6304 0,8758 0,8614 0,8367 0,7181 0,4477 0,5427 0,1001
PLN 0,1597 0,0597 0,1783 -0,2733 0,3171 0,3349 0,2839 0,6741 -0,0654 1 -0,2924 0,3091 -0,2444 -0,1065 0,2677 0,6007 0,5397 0,3506
NOK -0,0060 0,6598 0,1537 0,8286 0,5270 0,5075 0,0182 -0,1435 0,6304 -0,2924 1 0,4676 0,5042 0,3128 0,1709 -0,1546 0,3089 0,1826
KRW 0,6521 0,7642 0,7587 0,3931 0,4060 0,6212 0,6855 0,5357 0,8758 0,3091 0,4676 1 0,6543 0,7110 0,7768 0,6657 0,7454 0,2560
JPY 0,7245 0,5289 0,5755 0,4492 0,3427 0,6123 0,6865 0,0843 0,8614 -0,2444 0,5042 0,6543 1 0,8989 0,5481 0,3799 0,1591 -0,2528
CNY 0,9173 0,5349 0,7940 0,2081 0,1522 0,5299 0,8330 0,3240 0,8367 -0,1065 0,3128 0,7110 0,8989 1 0,7075 0,6006 0,2665 -0,1834
CPL 0,7617 0,6337 0,7887 0,1316 0,0419 0,4418 0,7524 0,6790 0,7181 0,2677 0,1709 0,7768 0,5481 0,7075 1 0,7849 0,6521 0,1673
INR 0,8266 0,2953 0,7572 -0,2317 0,0783 0,4662 0,8133 0,8703 0,4477 0,6007 -0,1546 0,6657 0,3799 0,6006 0,7849 1 0,5815 0,1079
BRL 0,2981 0,6135 0,5483 0,3583 0,2637 0,3850 0,3608 0,6710 0,5427 0,5397 0,3089 0,7454 0,1591 0,2665 0,6521 0,5815 1 0,6120
RUB -0,1872 0,3443 0,2005 0,2888 0,0972 0,0054 -0,1361 0,3155 0,1001 0,3506 0,1826 0,2560 -0,2528 -0,1834 0,1673 0,1079 0,6120 1
Page 73
Chapter 8 G.Carlsson & R.Ericsson Appendices
66
Appendix 20 - Correlation 2012
2012 Q1 USD AUD CAD CHF CZK EUR GBP ZAR SGD PLN NOK KRW JPY CNY CPL INR BRL RUB
USD 1 0,4908 0,7044 0,1606 -0,4226 0,3315 0,9228 -0,4798 0,7087 -0,6758 0,3558 0,5270 0,8713 0,9602 0,0233 -0,2630 -0,3938 -0,3986
AUD 0,4908 1 0,5806 0,5804 -0,0103 0,5794 0,5053 -0,2433 0,7853 -0,3872 0,7265 0,7714 0,6299 0,6172 0,3275 -0,2753 0,0899 0,0366
CAD 0,7044 0,5806 1 0,2062 -0,1252 0,2546 0,6816 0,1294 0,6857 -0,1664 0,2847 0,7567 0,5042 0,6061 0,5003 0,2561 0,1914 0,1792
CHF 0,1606 0,5804 0,2062 1 0,5375 0,8032 0,3143 -0,1006 0,7318 -0,1102 0,7809 0,5956 0,4865 0,3202 0,4387 -0,0048 0,3378 0,1370
CZK -0,4226 -0,0103 -0,1252 0,5375 1 0,5029 -0,3225 0,4594 0,1199 0,5685 0,3178 0,1297 -0,2173 -0,3701 0,4157 0,5137 0,6338 0,4016
EUR 0,3315 0,5794 0,2546 0,8032 0,5029 1 0,3818 -0,2469 0,6787 -0,2398 0,8490 0,5098 0,5881 0,4784 0,1602 -0,1403 0,1236 0,0276
GBP 0,9228 0,5053 0,6816 0,3143 -0,3225 0,3818 1 -0,4388 0,7562 -0,5941 0,3775 0,6050 0,8412 0,9002 0,1516 -0,2080 -0,2551 -0,2747
ZAR -0,4798 -0,2433 0,1294 -0,1006 0,4594 -0,2469 -0,4388 1 -0,2436 0,8826 -0,3221 0,0841 -0,6618 -0,6263 0,5162 0,8815 0,8021 0,7329
SGD 0,7087 0,7853 0,6857 0,7318 0,1199 0,6787 0,7562 -0,2436 1 -0,4264 0,7425 0,8515 0,8269 0,7787 0,4838 -0,0658 0,1042 -0,0781
PLN -0,6758 -0,3872 -0,1664 -0,1102 0,5685 -0,2398 -0,5941 0,8826 -0,4264 1 -0,4138 -0,1102 -0,7957 -0,7904 0,3762 0,8025 0,7789 0,7144
NOK 0,3558 0,7265 0,2847 0,7809 0,3178 0,8490 0,3775 -0,3221 0,7425 -0,4138 1 0,5679 0,6507 0,5352 0,2066 -0,2642 0,0580 -0,1161
KRW 0,5270 0,7714 0,7567 0,5956 0,1297 0,5098 0,6050 0,0841 0,8515 -0,1102 0,5679 1 0,5201 0,5412 0,6681 0,1749 0,4197 0,2858
JPY 0,8713 0,6299 0,5042 0,4865 -0,2173 0,5881 0,8412 -0,6618 0,8269 -0,7957 0,6507 0,5201 1 0,9567 -0,0002 -0,4641 -0,4237 -0,4901
CNY 0,9602 0,6172 0,6061 0,3202 -0,3701 0,4784 0,9002 -0,6263 0,7787 -0,7904 0,5352 0,5412 0,9567 1 -0,0235 -0,4408 -0,4456 -0,4656
CPL 0,0233 0,3275 0,5003 0,4387 0,4157 0,1602 0,1516 0,5162 0,4838 0,3762 0,2066 0,6681 -0,0002 -0,0235 1 0,6241 0,7160 0,5449
INR -0,2630 -0,2753 0,2561 -0,0048 0,5137 -0,1403 -0,2080 0,8815 -0,0658 0,8025 -0,2642 0,1749 -0,4641 -0,4408 0,6241 1 0,7631 0,6071
BRL -0,3938 0,0899 0,1914 0,3378 0,6338 0,1236 -0,2551 0,8021 0,1042 0,7789 0,0580 0,4197 -0,4237 -0,4456 0,7160 0,7631 1 0,7755
RUB -0,3986 0,0366 0,1792 0,1370 0,4016 0,0276 -0,2747 0,7329 -0,0781 0,7144 -0,1161 0,2858 -0,4901 -0,4656 0,5449 0,6071 0,7755 1
Page 74
Chapter 8 G.Carlsson & R.Ericsson Appendices
67
8.3 Appendix 21-22 – Improvements, 2011 Q4
Appendix 21 – Improvements, 2011 Q4
Weight (w
n )Annual volatility (σ
n )w
n σn
USD
AUD
GBP
SGD
NO
KCPL
INR
BRLRU
B
USD
53%17%
9%U
SD1
0,35390,9140
0,6478-0,0060
0,76170,8266
0,2981-0,1872
AUD
28%13%
4%AU
D0,3539
10,3449
0,78880,6598
0,63370,2953
0,61350,3443
GBP
9%13%
1%G
BP0,9140
0,34491
0,66340,0182
0,75240,8133
0,3608-0,1361
SGD
-11%12%
-1%SG
D0,6478
0,78880,6634
10,6304
0,71810,4477
0,54270,1001
NO
K-6%
8%0%
NO
K-0,0060
0,65980,0182
0,63041
0,1709-0,1546
0,30890,1826
CPL14%
16%2%
CPL0,7617
0,63370,7524
0,71810,1709
10,7849
0,65210,1673
INR
-7%15%
-1%IN
R0,8266
0,29530,8133
0,4477-0,1546
0,78491
0,58150,1079
BRL8%
14%1%
BRL0,2981
0,61350,3608
0,54270,3089
0,65210,5815
10,6120
RUB
11%13%
2%RU
B-0,1872
0,3443-0,1361
0,10010,1826
0,16730,1079
0,61201
100%16%
Portfolio Variance2%
Std. Portfolio12%
USD
53%211971350,6
AUD
28%111868351,1
Black&Scholes
GBP
9%37046908,32
Strike Price396298806
D10,334758031
Call23173171,3
SGD
-11%-45204402,52
Spot Price396298806
D20,236247623
Put12182547,49
NO
K-6%
-22352734,92
volatility0,124606905
CPL14%
55519242,06
Rf0,045
INR
-7%-28571627,24
Time
0,625BRL
8%30708225,75
N(D1)
0,6255RU
B11%
45313492,9
N(D2)
0,5832100%
396298806
If calculated as 4 smaller baskets w
ith different T's
Black&Scholes
3 months
7 400 192,56
Strike Price396298806
D10,423439137
Call28568846,44
6 months
10 076 577,06
Spot Price396298806
D20,298832232
Put11130701,03
9 months
11 299 095,93
volatility0,124606905
12 months
11 130 701,03
Rf0,045
TOTAL
39 906 566,58
Time
1
N(D1)
0,6628Total exposed
1585195224
N(D2)
0,6179Prem
ium %
0,025174544
Page 75
Chapter 8 G.Carlsson & R.Ericsson Appendices
68
Appendix 22 – Improvements, 2011 Q4
Weight (w
n )Annual volatility (σ
n )w
n σn
CADCHF
CZKEU
RZAR
PLNKRW
JPYCN
Y
CAD4%
17%1%
CAD1
0,0433-0,0184
0,34530,6438
0,17830,7587
0,57550,7940
CHF-62%
13%-8%
CHF0,0433
10,4757
0,3809-0,2537
-0,27330,3931
0,44920,2081
CZK6%
13%1%
CZK-0,0184
0,47571
0,8179-0,0474
0,31710,4060
0,34270,1522
EUR
5%12%
1%EU
R0,3453
0,38090,8179
10,2920
0,33490,6212
0,61230,5299
ZAR38%
8%3%
ZAR0,6438
-0,2537-0,0474
0,29201
0,67410,5357
0,08430,3240
PLN8%
16%1%
PLN0,1783
-0,27330,3171
0,33490,6741
10,3091
-0,2444-0,1065
KRW12%
15%2%
KRW0,7587
0,39310,4060
0,62120,5357
0,30911
0,65430,7110
JPY15%
14%2%
JPY0,5755
0,44920,3427
0,61230,0843
-0,24440,6543
10,8989
CNY
75%13%
10%CN
Y0,7940
0,20810,1522
0,52990,3240
-0,10650,7110
0,89891
100%12%
Portfolio Variance3%
Std. Portfolio16%
CAD4%
10998030,2
CHF-62%
-175772419
Black&Scholes
CZK6%
16061011,41
Strike Price281347179,4
D10,283973277
Call16451491,36
EUR
5%13073394,5
Spot Price281347179,4
D20,156175613
Put8648841,034
ZAR38%
105560751,6
volatility0,161652679
PLN8%
23416407,06
Rf0,045
KRW12%
34373732,44
Time
0,625JPY
15%43561444,84
N(D1)
0,6255CN
Y75%
210074826,3
N(D2)
0,5832100%
281347179,4
If calculated as 4 smaller baskets w
ith different T's
Black&Scholes
3 months
7 442 128,95
Strike Price281347179,4
D10,35920094
Call24418307,04
6 months
9 316 776,59
Spot Price281347179,4
D20,197548261
Put12038322,67
9 months
11 210 756,47
volatility0,161652679
12 months
12 038 322,67
Rf0,045
TOTAL
40 007 984,68
Time
1
N(D1)
0,6406Total exposed
1,13E+09
N(D2)
0,5793Prem
ium %
0,03555