1 Developing a Risk Analysis and Decision Making Strategy for an Offshore Wind Farm Iraklis Lazakis 1 , Maria A Kougioumtzoglou 2 Abstract The renewables sector and particularly offshore wind energy is a fast developing industry over the last few years. Especially activities related to the Installation, Operation and Maintenance (O&M) of offshore wind turbines becomes a challenging task with inherent risks. This paper assesses the risks related to the above stages of a wind farm lifecycle using the FMECA (Failure Mode, Effects and Criticality Analysis) and HAZID (Hazard Identification) methods. All works, from installation to O&M are considered together with the wind turbine main components. An integrated risk analysis methodology is presented addressing personnel Safety (S), Environmental impact (E), Asset integrity (A) and Operation (O). The above is supplemented by a cost analysis with the aid of BBN (Bayesian Belief Networks) method in order to assist the decision making process related to installation and O&M tasks. All major risks and critical wind turbine components are identified as well as measures are suggested in order to prevent or mitigate them. Moreover, inspection and maintenance plans are elaborated in general for the mentioned activities. Keywords Risk analysis (O&M); Offshore wind farm; FMECA; HAZID; BBN Introduction Wind power is known to humans since ancient times. It is a form of energy that not only has no time or place restrictions but it also contributes in reducing greenhouse gases emission and boosting the economy of countries that depend on oil and gas imports for the energy coverage [1]. These characteristics makes it appealing to industry that tries to exploit it by developing more and more onshore or offshore wind farms [2]. The rapidly expanding number of wind farms makes quantifying and managing the different elements of risk that are present in each of the installation, operation and maintenance stages of a wind turbine necessary. In this respect, risk analysis and decision making can be a key that will enable fast growth, investments, further technological development and reasonable cost of energy. This paper presents the study regarding the investigation and assessment of the risk and reliability features of offshore wind turbines at different stages of its lifetime and identification of the critical components in terms of their operation in order to increase their availability and operability characteristics. A lot of risk analysis methods formerly or currently used in the offshore renewables and oil and gas sectors is examined as shown in section 2. The description of wind turbine and the demobilization of its components is demonstrated comprehensively in section 3, as well as the overall risk analysis methodology, including the HAZID and FMECA approaches, which are complemented with risk matrices for various consequence categories. Also, the cost benefit analysis with BBNs is presented in the same section. In Section 4 the outcomes of the analyses and the simulations are submitted highlighting the possibe high-risk areas and the most costly components. Finally, conclusions and recommendations for future research on the current study are shown in section 5. 1 Iraklis Lazakis, Department of Naval Architecture, Ocean and Marine Engineering, University of Strathclyde, 100 Montrose Street, Glasgow G4 0LZ, Scotland 2 Maria A. Kougioumtzoglou, Hellenic Tankers, Kifisias 349, Kifisia, Athens, Greece, 14561 Corresponding author: Maria A. Kougioumtzoglou, Hellenic Tankers, Kifisias 349, Kifisia, Athens, Greece, 14561, Email: [email protected]
Transcript
1
Developing a Risk Analysis and Decision Making Strategy for an Offshore Wind Farm
Iraklis Lazakis 1, Maria A Kougioumtzoglou 2
Abstract
The renewables sector and particularly offshore wind energy is a fast developing industry over the last few years. Especially activities related to the Installation, Operation and Maintenance (O&M) of offshore wind turbines becomes a challenging task with inherent risks. This paper assesses the risks related to the above stages of a wind farm lifecycle using the FMECA (Failure Mode, Effects and Criticality Analysis) and HAZID (Hazard Identification) methods. All works, from installation to O&M are considered together with the wind turbine main components. An integrated risk analysis methodology is presented addressing personnel Safety (S), Environmental impact (E), Asset integrity (A) and Operation (O). The above is supplemented by a cost analysis with the aid of BBN (Bayesian Belief Networks) method in order to assist the decision making process related to installation and O&M tasks. All major risks and critical wind turbine components are identified as well as measures are suggested in order to prevent or mitigate them. Moreover, inspection and maintenance plans are elaborated in general for the mentioned activities.
Wind power is known to humans since ancient times. It is a form of energy that not only has no time or place restrictions but it also contributes in reducing greenhouse gases emission and boosting the economy of countries that depend on oil and gas imports for the energy coverage [1]. These characteristics makes it appealing to industry that tries to exploit it by developing more and more onshore or offshore wind farms [2].
The rapidly expanding number of wind farms makes quantifying and managing the different elements of risk that are present in each of the installation, operation and maintenance stages of a wind turbine necessary. In this respect, risk analysis and decision making can be a key that will enable fast growth, investments, further technological development and reasonable cost of energy.
This paper presents the study regarding the investigation and assessment of the risk and reliability features of offshore wind turbines at different stages of its lifetime and identification of the critical components in terms of their operation in order to increase their availability and operability characteristics. A lot of risk analysis methods formerly or currently used in the offshore renewables and oil and gas sectors is examined as shown in section 2. The description of wind turbine and the demobilization of its components is demonstrated comprehensively in section 3, as well as the overall risk analysis methodology, including the HAZID and FMECA approaches, which are complemented with risk matrices for various consequence categories. Also, the cost benefit analysis with BBNs is presented in the same section. In Section 4 the outcomes of the analyses and the simulations are submitted highlighting the possibe high-risk areas and the most costly components. Finally, conclusions and recommendations for future research on the current study are shown in section 5.
1Iraklis Lazakis, Department of Naval Architecture, Ocean and Marine Engineering, University of Strathclyde, 100 Montrose Street, Glasgow G4 0LZ, Scotland
Maria A. Kougioumtzoglou, Hellenic Tankers, Kifisias 349, Kifisia, Athens, Greece, 14561, Email: [email protected]
2
Literature review
Risk is defined in a different way by each one of us so there is not a universal definition of “risk”. Generally it includes a combination of probabilities of occurrence and consequences of an unwanted outcome [3, 4, 5, 6, 7, 8]. Consequences can be loss of life, injuries, environmental, social and economic impacts [8, 9, 10, 11, 12]. Other views focus on both positive and negative aspects of risk[7, 8,13,14] and argue that one should not eliminate the other.
Hazard, is associated with risk but they are not the same. According to WHO [5] hazard is the “Inherent property of an agent or situation having the potential to cause adverse effects when an organism, system, or (sub) population is exposed to that agent”. Similarly, [8, 11, 12, 15, 16, 17] describe hazard as situation likely to cause harm, injuries and damage. So while “hazard is any source of potential damage, harm or adverse health effects on something or someone under certain conditions”, “risk is the chance or probability that something or someone will experience an adverse effect if exposed to a hazard” [18].
A probability is the way we have to express quantitatively the likelihood of an event or consequence to happen. According to past papers [6 , 7, 8, 11] probability can be either a subjective measure of uncertainty if it comes from expert’s judgment, or a classical statistical approach. Determination of a probability and decision making in each case involves a certain degree of uncertainty that derives from our lack of important information [8, 10, 18, 19]. Decision makers face uncertainty when either the probabilities or the consequences are unknown or there are multiple outcomes for each alternative and that is the difference with risk, since risk exists when we know all the consequences but not which will definitely occur [8, 10, 19, 20, 21, 22].
The subject of risk analysis, risk assessment and risk management in general is a relatively new but extensively explored area with various studies contributing to its thorough examination. Effective risk mitigation is desirable by all individuals and companies, and risk management is or should be applied to all stages of a project lifetime [67]. Especially in the maritime and offshore industry the aim is to reduce the risks from major hazards that could jeopardize the integrity of the offshore structure and the health and safety of the workforce and ensure the protection of the environment [23, 68]. The correct identification of the hazards and their consequences is a key issue in providing information to aid decision making and increase the level of a project success. Thus there are many tools, processes, techniques and methodologies developed nowadays to cover this need.
Some of the main standards for risk management are those: Australian Standards/New Zealand Standards: 4360 2004, Association for Project Management [16], Project Risk Analysis & Management (PRAM) Guide 2nd edition [57], Project Management Institute [61], Guide to the Project Management Body of Knowledge (PMBoK): Chapter 11 [61], ISO/ IEC 31010:2009 [63] Standards and many more.
More specifically for offshore oil and gas industry, HSE introduced the Safety Case approach in 1992 [24], in which guidelines are given to operators of each offshore installation field for “reducing the risks from major accident hazards to the health and safety of the workforce employed on offshore installations or in connected activities”. After that, many standards and codes have been established the last years as guidelines for this purpose. Although they refer mainly to oil industry they can have a good application on wind industry. The most important of them are from ISO [15], HSE [24], DNV [25, 26], IMO [27], ABS [28], OREDA [29] and Norsok [30].
Apart from standards there are various software tools for risk analysis valuable for the industry based on a quantitative approach of risk assessment. These are RBM (Risk Based Management) II released from the Dutch Government, PHAST and Synergi Life Risk Management from DNV GL, SHEPHERD a software property of Shell Global Solutions, RISKCURVES that is an integrated QRA software from TNO, EFFECTS that is a consequence analysis and damage calculation software from TNO, HAMSAGARS which is a QRA software from HAMS-GPS, RISKAN and many more [62].
The most known techniques of hazard identification are Expert Judgment, Check Lists and the structured techniques HAZID (Hazard Identification), PHA (Process Hazard Analysis), What-IF Method, FTA (Fault Tree Analysis), ETA (Event Tree Analysis), FMEA/FMECA (Failure Mode, Effects and Criticality Analysis), HAZOP (Hazard and Operability), Monte Carlo Simulation and Risk Ranking Matrix [31]. All of them can be applied in our area of interest;
3
offshore installations and more specifically offshore wind farms, with FMECA and HAZID, the two methods that are used in this study, being two of the most popular.
After all the necessary information about possible risks is gathered, risk evaluation is executed. The most well-known method of risk evaluation is ALARP (As Low As Reasonably Practical). The idea in this method is that the risk should be minimized to a point where it is acceptable but without expending grossly disproportionate cost, time and effort [32]. Regarding decision making, in the frame of risk mitigation and ALARP, one of the strongest tools that decision makers have to deal with the problems raised is Bayesian Belief Networks (BBNs) a tool for modeling under uncertainty by using conditional probabilistic calculations and graphical representation of the logical relationships between variables.
Risk management process in general, includes setting up the context, assessing the risk (hazard identification, risk analysis, and risk weighing), handling the risks, monitoring, communication and consultation, as well as the connection between these procedures. The efficiency of Risk management depends on the selection of the risk method. The suitability of each method depends on its strengths and weaknesses and on the needs of the project. Usually, two or more methods are combined in order to cover all stages or needs of a project’s lifecycle and each other’s weaknesses and flaws. This procedure has also been followed here. HAZID cannot support much detail and it is usually used for operational procedures. FMECA’s complexity and the ever-increasing list of possible failure modes of the components make it difficult to be widely applied. A spherical and general overview though of both mechanical and operational aspects of an offshore wind turbine can be obtained when combining these two methods. Additionally, a financial perspective on the cost of critical components and their failure probabilities can be assessed through BBN analysis.
FMEA/FMECA-HAZID
FMEA is one of the first systematic techniques used to identify problem that may originate from system malfunctions. The concept of FMEA is reviewing all the components of a system and the causes or the ways in which a system can fail (Failure Mode) and then the consequence of these failures. The consequences can be categorized in terms of safety, reliability and environmental effect [8, 11, 17, 33, 34]. FMECA (Failure Modes, Effects. and Criticality Analysis) is the extended model of FMEA, so that criticality is taken into account. It is mainly used to rank the failure mode based on the severity of their consequences. FMEA/ FMECA are usually qualitative or semi-quantitative, and can be applied at any phase of project life cycle preferably at the early stages of a project since the designers can have the ability to change the probabilities of the critical failures [8, 33]. FMECA was originally part of risk management techniques developed for defense and nuclear industries in the 1940’s. It was formally developed and applied by NASA in the 1960’s to guarantee reliability of space program hardware and was quickly adopted by aerospace, petroleum, chemical and automotive industries [35].
FMEA and FMECA typically consist of several stages. Definition of the system components is the first step of the analysis. Then, identification of each component’s failure mode as well as their effects is the next crucial level to the FMEA/FMECA approach. Next important step is analyzing the criticality of each failure and also estimating their rate. Ranking of failure modes and determination of critical items is another important stage of the procedure that due to the subjectivity of the applier a lot of attention and thorough review of the parameters need to be implemented. Design process then absorbs the method’s results and helps identifying means of future reviewing and suggesting improvements in design.
Depending on the analysis we want to conduct a proper FMECA worksheet has to be formed. A representative worksheet is presented below where the name, function and operational mode of each element is mentioned and also all potential failure modes for each function and operational mode. Also, the failure mechanisms (corrosion, erosion, fatigue etc.) for each failure mode have to be listed and their acceptance criteria have to be chosen. Before the final decision of the criteria categories, a lot of reviews and papers were taken into consideration. Main references were IMO and ISO sources on the development of risk matrices, FSA applications and nuclear projects, where number of cases is small and technology may be obsolete but due to catastrophic consequences their outcomes must be taken into serious consideration. After thorough review we finalized our matrices as below [15, 23, 27, 36]:
The likelihood of their detection was evaluated with a ranking that is usually divided into five categories: 1 (almost impossible), 2 (low), 3 (moderate), 4 (high), 5 (almost certain). The effects that a failure may have on the subsystem itself
4
or on other components as well as failure rates should also be listed and classified most commonly to a five-level ranking: 1 (higly unlikely), 2 (remote), 3 (occasional), 4 (probable) and 5 (very frequent). The severity of the failure modes regarding the global effects has to be evaluated and ranked into five categories that in most cases, for computational reasons, are represented from numbers 1 to 5 representing: 1 (minor), 2 (marginal), 3 (major), 4 (critical) and 5 (catastrophic). It can be assumed here that categories are related with 1 fatality to equal 10 major injuries and 100 minor ones. Finally, mitigation measures that could prevent failure should be mentioned.
The risks linked to failure modes is a function of frequency of the failure mode and consequences of the outcomes and can be presented in the form of a risk ranking matrix to prioritize those that need immediate management.
An alternative to risk ranking matrix is the risk priority number (RPN) which is defined as:
RPN=S ∙ O ∙ D (1)
Where
S is the rank of severity of the failure mode taken from the severity matrix
O is the rank of occurrence of the failure mode taken from the occurrence matrix
D is the rank of detection of the failure mode taken from the detection matrix
The RPN is not a measure of risk, but of risk priority. The smaller the RPN is the better since you can deal with this hazard later. Based on these two tools the responsible team should decide whether the system is acceptable or not and propose improvements that will reduce the likelihood of occurrence of failure, reduce the consequences of failure or increase the failure detection probability. After the improvements the FMECA worksheets and RPN have to be revised and updated [37].
The main drawbacks of FMECA method is the limitation in examination of human and other external factors, as well as focusing on a single initiating event and on the mode of operation. Furthermore, analysis is mainly based on team experience on evaluating the failure modes of the components inducting subjectivity in the procedure [38].
HAZID is one of the most common and frequent used techniques for hazard identification being carried out at the first stages of a project where not much detail is required [8, 11]. In HAZID the process is divided into nodes and with the aid of pre-defined guidewords for hazard identification, all undesirable consequences associated with the defined node are identified. Consequences are divided into broad categories such as human impacts, environmental impacts, and economic impacts that are then divided in subcategories based on the type of consequence. Checklists from previous similar HAZID can be used to assist the procedures. The same methodology as the FMECA is followed and risk matrices are constructed as well. Its application is wide: from marine and offshore industries to nuclear sector.
Since HAZID is applied to all aspects and operations and a complete evaluation of all hazards is performed, an extended
list of potential hazards and recommendations for avoidance is produced. To this respect a well-defined system or activity is required in order to minimize time needed for the analysis [38, 39].
HAZID’s in depth and time consuming analysis can counterbalance any omissions that can come of analysts’ lack of experience as in the case of FMECA. Also, since FMECA covers mainly equipment failure modes and effects, HAZID comes to fill the gap in safety related studies.
BBN
Reasoning with uncertainty is common in all aspects of everyday life, so dealing with it has forced scientists even from sixteenth century to develop several approaches such as the frequentist or the subjective Bayesian that was widely adopted in more recent years. Bayesian Belief Networks (also known as Belief Networks, Causal Probabilistic Networks, Causal Nets, Graphical Probability Networks and Probabilistic Cause-Effect Models) were first developed in 1980s and they are based in statistics and artificial intelligence and they provide a simple way of building a "picture" of a decision
5
problem. They make a framework for decision support that takes into consideration variables with unknown state and influence on outcomes. So it is basically a tool for modeling under uncertainty by using conditional probabilistic calculations and graphical representation of the logical relationships between variables. This method is a more flexible tool than other methods (FTA, DFTA ETA etc.) as it can combine objective and subjective data like expert judgment and can resolve some disadvantages that more traditional methods have as intrinsic limitations such as system and component interconnectivities in multiple layers so that they simulate real state conditions, fault detection and system degradation. [40, 41, 42].
The approach is based on conceptualizing a model domain of interest as a graph of connected nodes and linkages. In the graph, nodes represent variables (X X ,… , X ,… , X ) and arcs represent direct connections between them (X → X ).
Probabilistic relations rather than deterministic are used to describe the dependency relations [42].
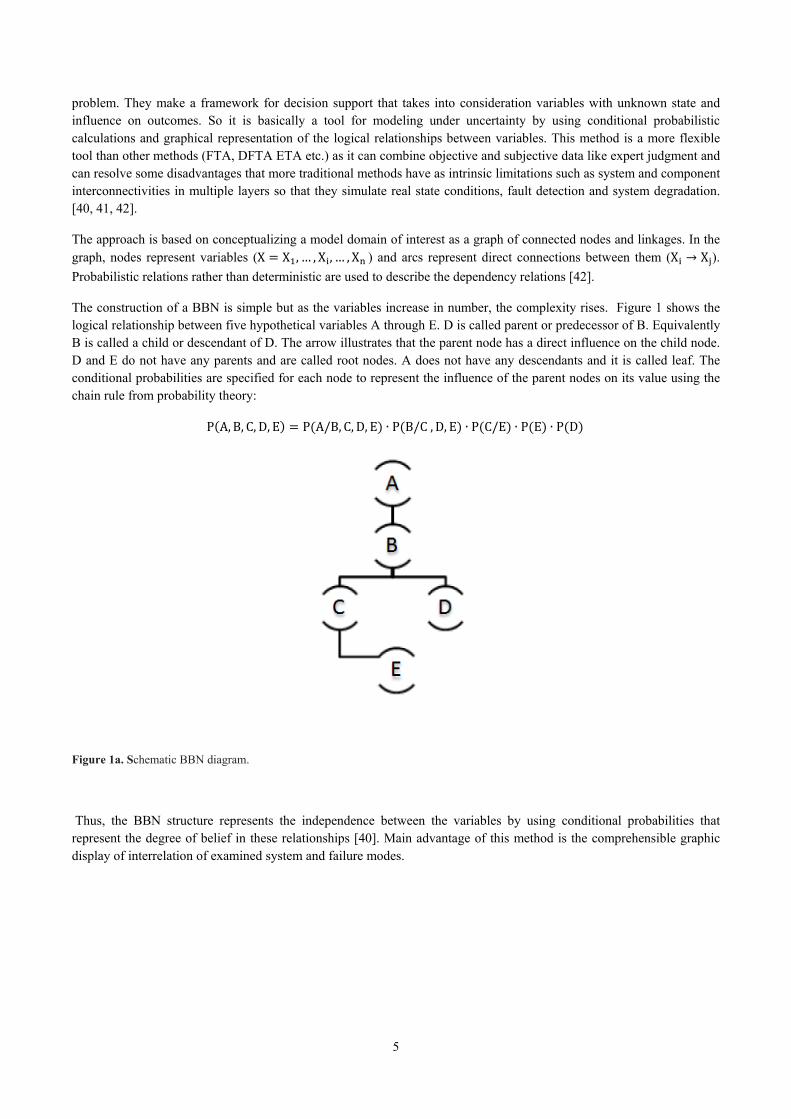
The construction of a BBN is simple but as the variables increase in number, the complexity rises. Figure 1 shows the logical relationship between five hypothetical variables A through E. D is called parent or predecessor of B. Equivalently B is called a child or descendant of D. The arrow illustrates that the parent node has a direct influence on the child node. D and E do not have any parents and are called root nodes. A does not have any descendants and it is called leaf. The conditional probabilities are specified for each node to represent the influence of the parent nodes on its value using the chain rule from probability theory:
P A, B, C, D, E P A/B, C, D, E ∙ P B/C, D, E ∙ P C/E ∙ P E ∙ P D
Figure 1a. Schematic BBN diagram.
Thus, the BBN structure represents the independence between the variables by using conditional probabilities that represent the degree of belief in these relationships [40]. Main advantage of this method is the comprehensible graphic display of interrelation of examined system and failure modes.
6
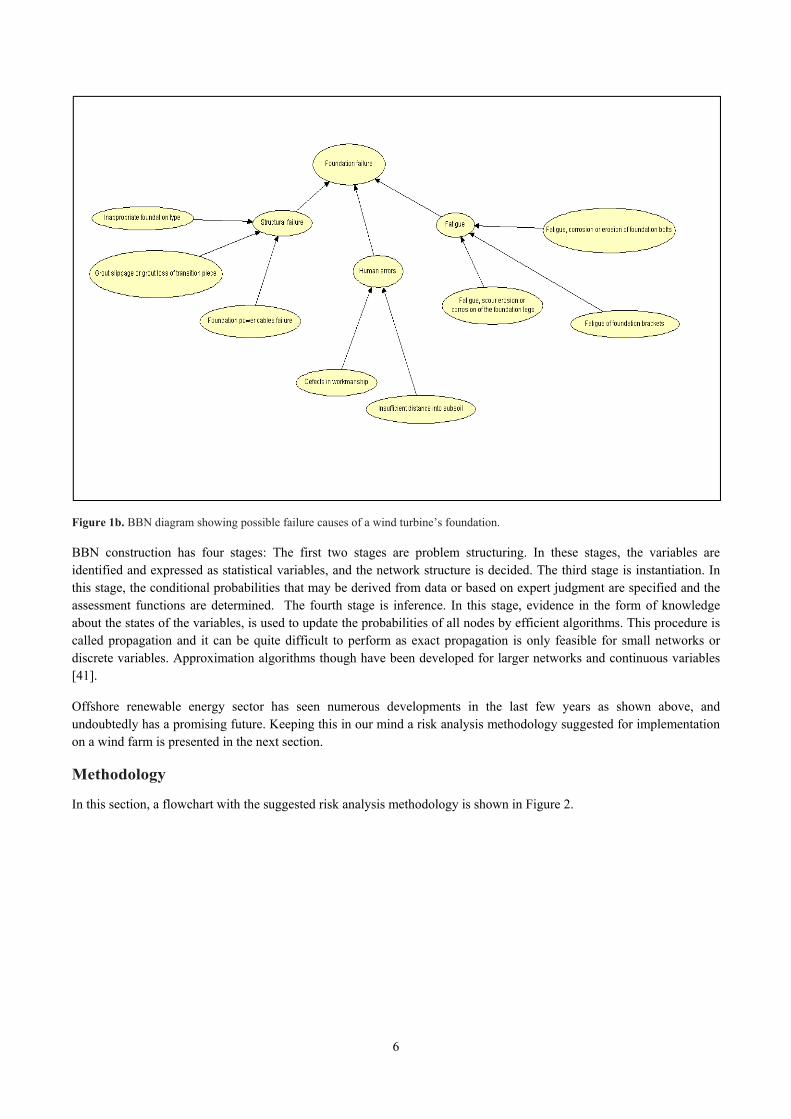
Figure 1b. BBN diagram showing possible failure causes of a wind turbine’s foundation.
BBN construction has four stages: The first two stages are problem structuring. In these stages, the variables are identified and expressed as statistical variables, and the network structure is decided. The third stage is instantiation. In this stage, the conditional probabilities that may be derived from data or based on expert judgment are specified and the assessment functions are determined. The fourth stage is inference. In this stage, evidence in the form of knowledge about the states of the variables, is used to update the probabilities of all nodes by efficient algorithms. This procedure is called propagation and it can be quite difficult to perform as exact propagation is only feasible for small networks or discrete variables. Approximation algorithms though have been developed for larger networks and continuous variables [41].
Offshore renewable energy sector has seen numerous developments in the last few years as shown above, and undoubtedly has a promising future. Keeping this in our mind a risk analysis methodology suggested for implementation on a wind farm is presented in the next section.
Methodology
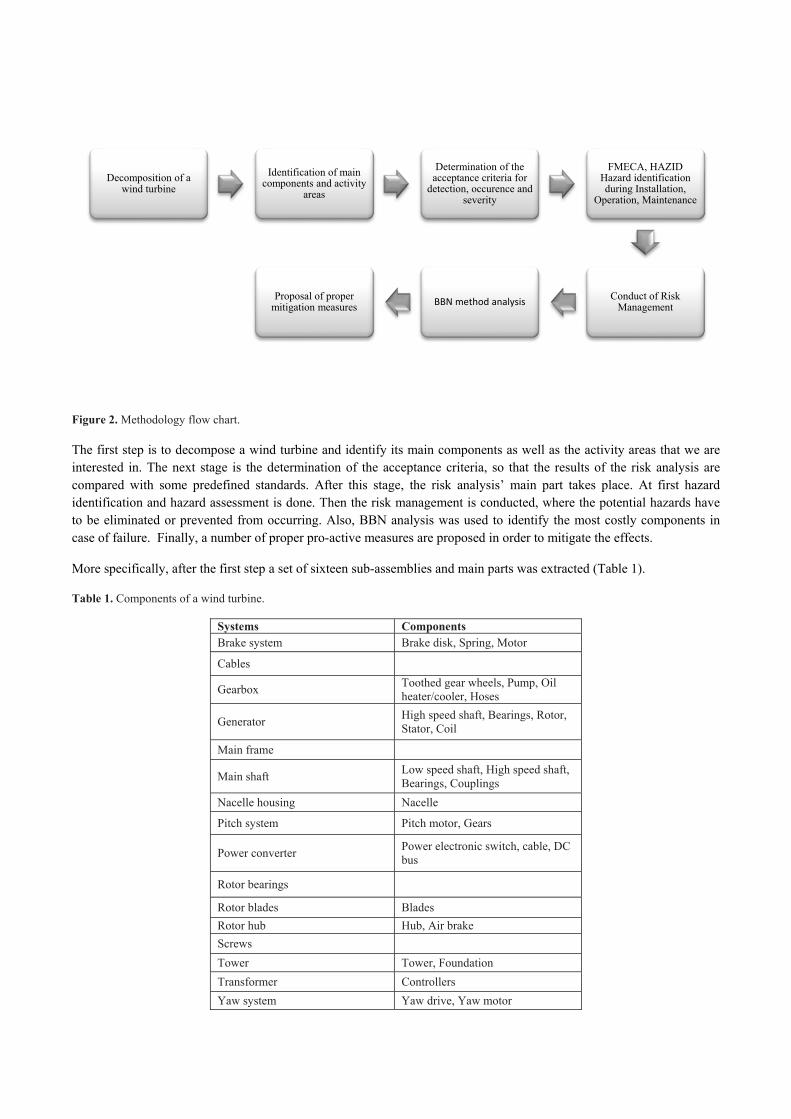
In this section, a flowchart with the suggested risk analysis methodology is shown in Figure 2.
Figure 2. Methodology flow chart.
The first step is to decompose a wind turbine and identify its main components as well as the activity areas that we are interested in. The next stage is the determination of the acceptance criteria, so that the results of the risk analysis are compared with some predefined standards. After this stage, the risk analysis’ main part takes place. At first hazard identification and hazard assessment is done. Then the risk management is conducted, where the potential hazards have to be eliminated or prevented from occurring. Also, BBN analysis was used to identify the most costly components in case of failure. Finally, a number of proper pro-active measures are proposed in order to mitigate the effects.
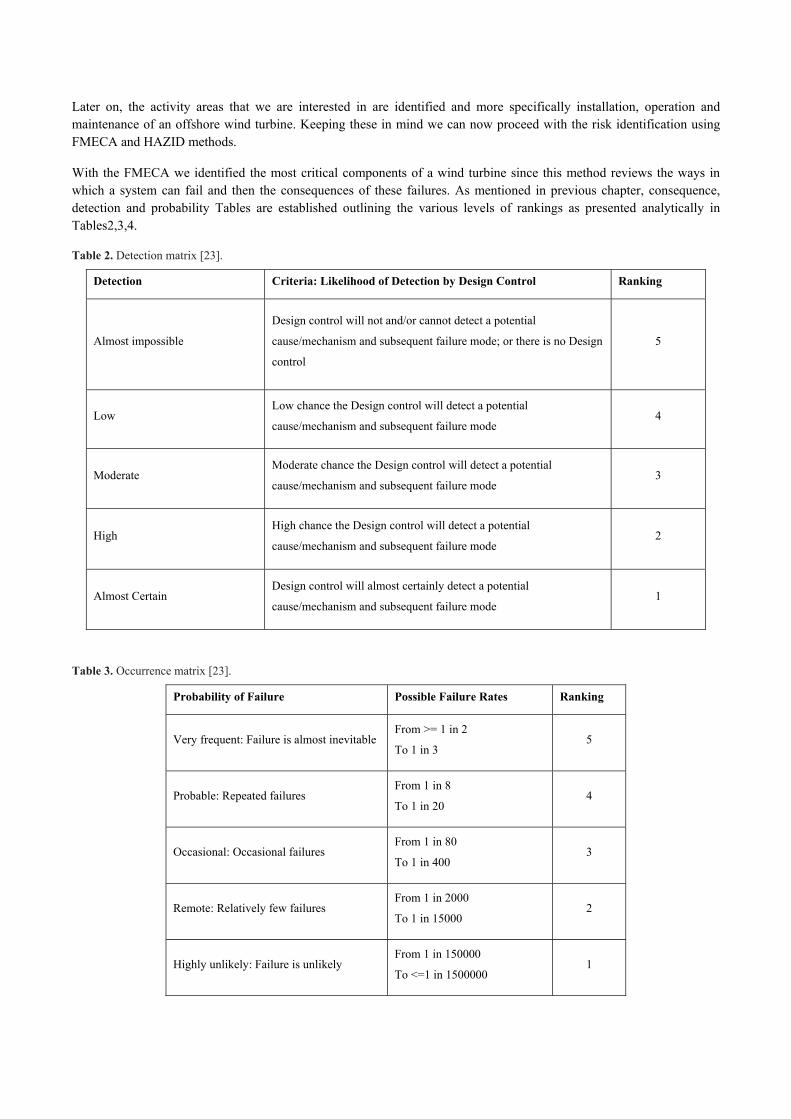
More specifically, after the first step a set of sixteen sub-assemblies and main parts was extracted (Table 1).
Table 1. Components of a wind turbine.
Systems Components Brake system Brake disk, Spring, Motor
Generator High speed shaft, Bearings, Rotor, Stator, Coil
Main frame
Main shaft Low speed shaft, High speed shaft, Bearings, Couplings
Nacelle housing Nacelle
Pitch system Pitch motor, Gears
Power converter Power electronic switch, cable, DC bus
Rotor bearings
Rotor blades Blades
Rotor hub Hub, Air brake
Screws
Tower Tower, Foundation
Transformer Controllers
Yaw system Yaw drive, Yaw motor
Decomposition of a wind turbine
Identification of main components and activity
areas
Determination of the acceptance criteria for
detection, occurence and severity
FMECA, HAZID Hazard identification during Installation,
Operation, Maintenance
Conduct of Risk ManagementBBN method analysis
Proposal of proper mitigation measures
Later on, the activity areas that we are interested in are identified and more specifically installation, operation and maintenance of an offshore wind turbine. Keeping these in mind we can now proceed with the risk identification using FMECA and HAZID methods.
With the FMECA we identified the most critical components of a wind turbine since this method reviews the ways in which a system can fail and then the consequences of these failures. As mentioned in previous chapter, consequence, detection and probability Tables are established outlining the various levels of rankings as presented analytically in Tables2,3,4.
Table 2. Detection matrix [23].
Detection Criteria: Likelihood of Detection by Design Control Ranking
Almost impossible
Design control will not and/or cannot detect a potential
cause/mechanism and subsequent failure mode; or there is no Design
control
5
Low Low chance the Design control will detect a potential
cause/mechanism and subsequent failure mode 4
Moderate Moderate chance the Design control will detect a potential
cause/mechanism and subsequent failure mode 3
High High chance the Design control will detect a potential
cause/mechanism and subsequent failure mode 2
Almost Certain Design control will almost certainly detect a potential
cause/mechanism and subsequent failure mode 1
Table 3. Occurrence matrix [23].
Probability of Failure Possible Failure Rates Ranking
Very frequent: Failure is almost inevitable From >= 1 in 2
To 1 in 3 5
Probable: Repeated failures From 1 in 8
To 1 in 20 4
Occasional: Occasional failures From 1 in 80
To 1 in 400 3
Remote: Relatively few failures From 1 in 2000
To 1 in 15000 2
Highly unlikely: Failure is unlikely From 1 in 150000
To <=1 in 1500000 1
9
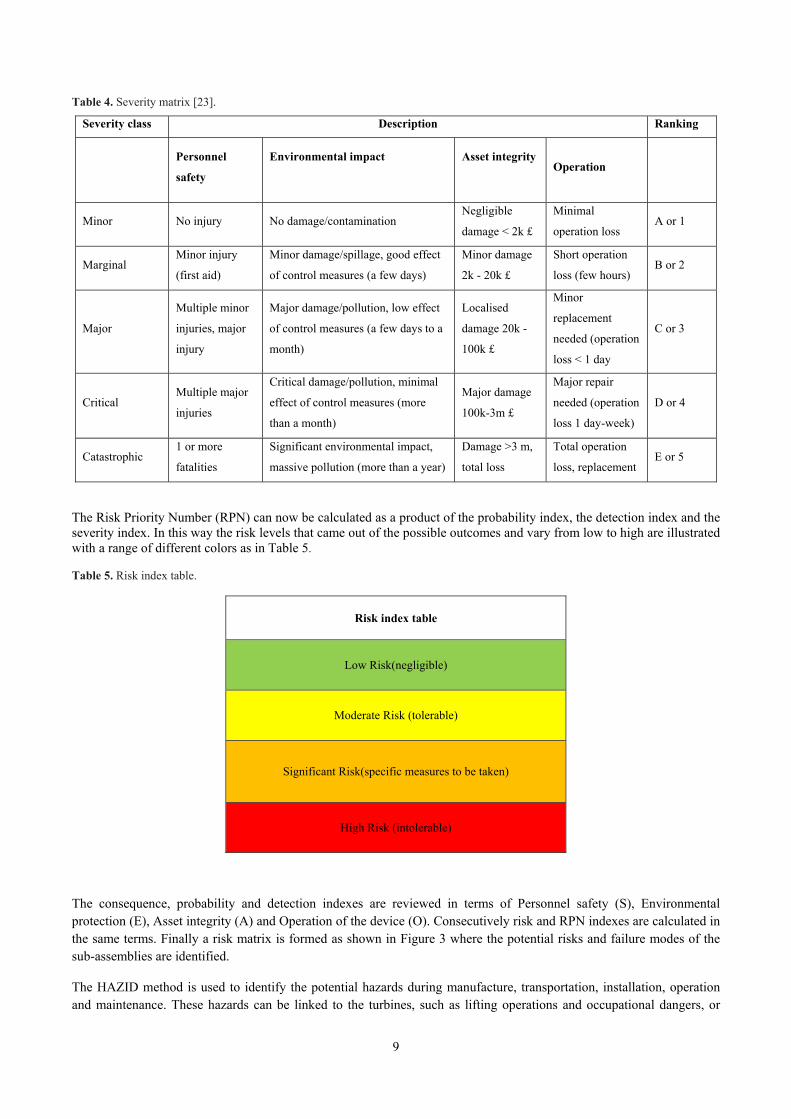
Table 4. Severity matrix [23].
Severity class Description Ranking
Personnel
safety
Environmental impact
Asset integrity
Operation
Minor No injury No damage/contamination Negligible
damage < 2k £
Minimal
operation loss A or 1
Marginal Minor injury
(first aid)
Minor damage/spillage, good effect
of control measures (a few days)
Minor damage
2k - 20k £
Short operation
loss (few hours) B or 2
Major
Multiple minor
injuries, major
injury
Major damage/pollution, low effect
of control measures (a few days to a
month)
Localised
damage 20k -
100k £
Minor
replacement
needed (operation
loss < 1 day
C or 3
Critical Multiple major
injuries
Critical damage/pollution, minimal
effect of control measures (more
than a month)
Major damage
100k-3m £
Major repair
needed (operation
loss 1 day-week)
D or 4
Catastrophic 1 or more
fatalities
Significant environmental impact,
massive pollution (more than a year)
Damage >3 m,
total loss
Total operation
loss, replacement E or 5
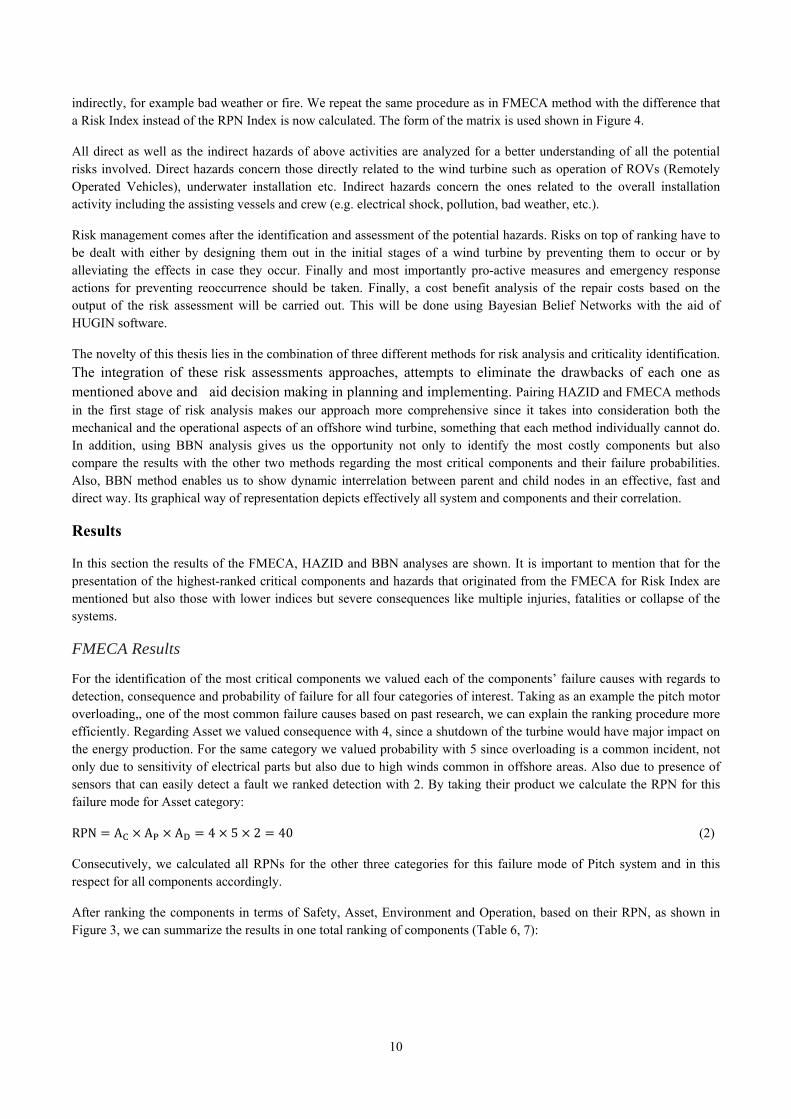
The Risk Priority Number (RPN) can now be calculated as a product of the probability index, the detection index and the severity index. In this way the risk levels that came out of the possible outcomes and vary from low to high are illustrated with a range of different colors as in Table 5.
Table 5. Risk index table.
Risk index table
Low Risk(negligible)
Moderate Risk (tolerable)
Significant Risk(specific measures to be taken)
High Risk (intolerable)
The consequence, probability and detection indexes are reviewed in terms of Personnel safety (S), Environmental protection (E), Asset integrity (A) and Operation of the device (O). Consecutively risk and RPN indexes are calculated in the same terms. Finally a risk matrix is formed as shown in Figure 3 where the potential risks and failure modes of the sub-assemblies are identified.
The HAZID method is used to identify the potential hazards during manufacture, transportation, installation, operation and maintenance. These hazards can be linked to the turbines, such as lifting operations and occupational dangers, or
10
indirectly, for example bad weather or fire. We repeat the same procedure as in FMECA method with the difference that a Risk Index instead of the RPN Index is now calculated. The form of the matrix is used shown in Figure 4.
All direct as well as the indirect hazards of above activities are analyzed for a better understanding of all the potential risks involved. Direct hazards concern those directly related to the wind turbine such as operation of ROVs (Remotely Operated Vehicles), underwater installation etc. Indirect hazards concern the ones related to the overall installation activity including the assisting vessels and crew (e.g. electrical shock, pollution, bad weather, etc.).
Risk management comes after the identification and assessment of the potential hazards. Risks on top of ranking have to be dealt with either by designing them out in the initial stages of a wind turbine by preventing them to occur or by alleviating the effects in case they occur. Finally and most importantly pro-active measures and emergency response actions for preventing reoccurrence should be taken. Finally, a cost benefit analysis of the repair costs based on the output of the risk assessment will be carried out. This will be done using Bayesian Belief Networks with the aid of HUGIN software.
The novelty of this thesis lies in the combination of three different methods for risk analysis and criticality identification.
The integration of these risk assessments approaches, attempts to eliminate the drawbacks of each one as mentioned above and aid decision making in planning and implementing. Pairing HAZID and FMECA methods in the first stage of risk analysis makes our approach more comprehensive since it takes into consideration both the mechanical and the operational aspects of an offshore wind turbine, something that each method individually cannot do. In addition, using BBN analysis gives us the opportunity not only to identify the most costly components but also compare the results with the other two methods regarding the most critical components and their failure probabilities. Also, BBN method enables us to show dynamic interrelation between parent and child nodes in an effective, fast and direct way. Its graphical way of representation depicts effectively all system and components and their correlation.
Results
In this section the results of the FMECA, HAZID and BBN analyses are shown. It is important to mention that for the presentation of the highest-ranked critical components and hazards that originated from the FMECA for Risk Index are mentioned but also those with lower indices but severe consequences like multiple injuries, fatalities or collapse of the systems.
FMECA Results
For the identification of the most critical components we valued each of the components’ failure causes with regards to detection, consequence and probability of failure for all four categories of interest. Taking as an example the pitch motor overloading,, one of the most common failure causes based on past research, we can explain the ranking procedure more efficiently. Regarding Asset we valued consequence with 4, since a shutdown of the turbine would have major impact on the energy production. For the same category we valued probability with 5 since overloading is a common incident, not only due to sensitivity of electrical parts but also due to high winds common in offshore areas. Also due to presence of sensors that can easily detect a fault we ranked detection with 2. By taking their product we calculate the RPN for this failure mode for Asset category:
RPN A A A 4 5 2 40 (2)
Consecutively, we calculated all RPNs for the other three categories for this failure mode of Pitch system and in this respect for all components accordingly.
After ranking the components in terms of Safety, Asset, Environment and Operation, based on their RPN, as shown in Figure 3, we can summarize the results in one total ranking of components (Table 6, 7):
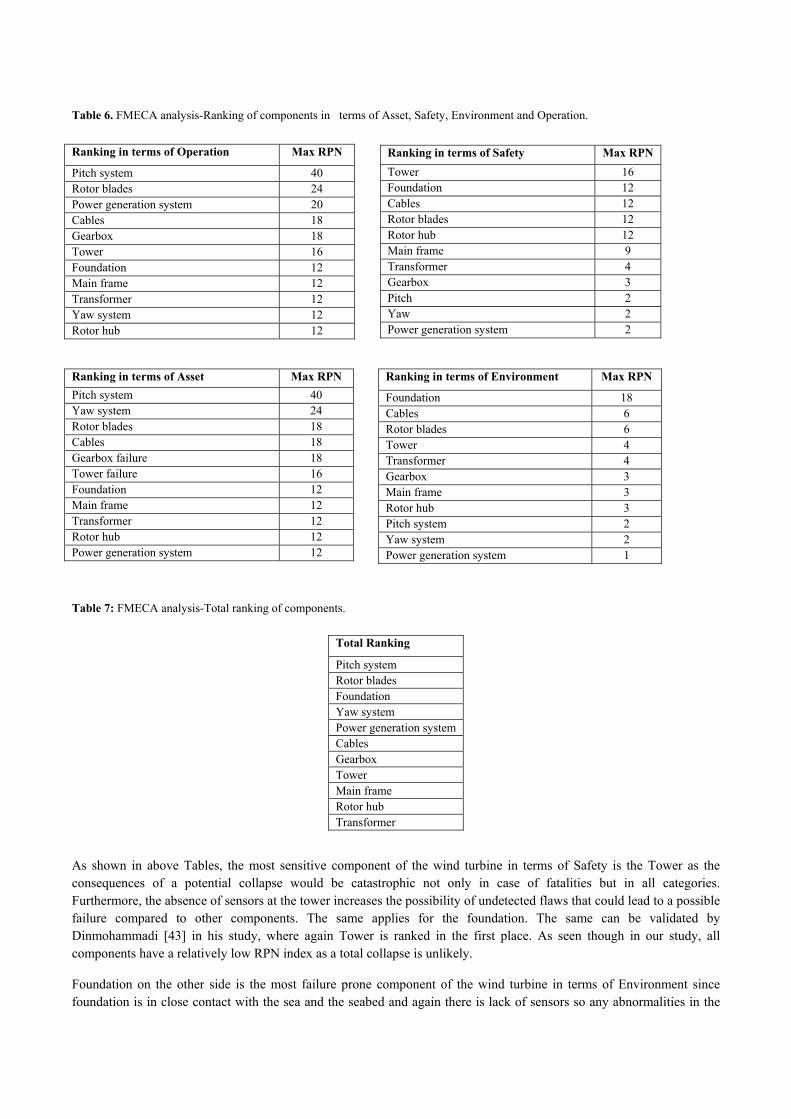
Table 6. FMECA analysis-Ranking of components in terms of Asset, Safety, Environment and Operation.
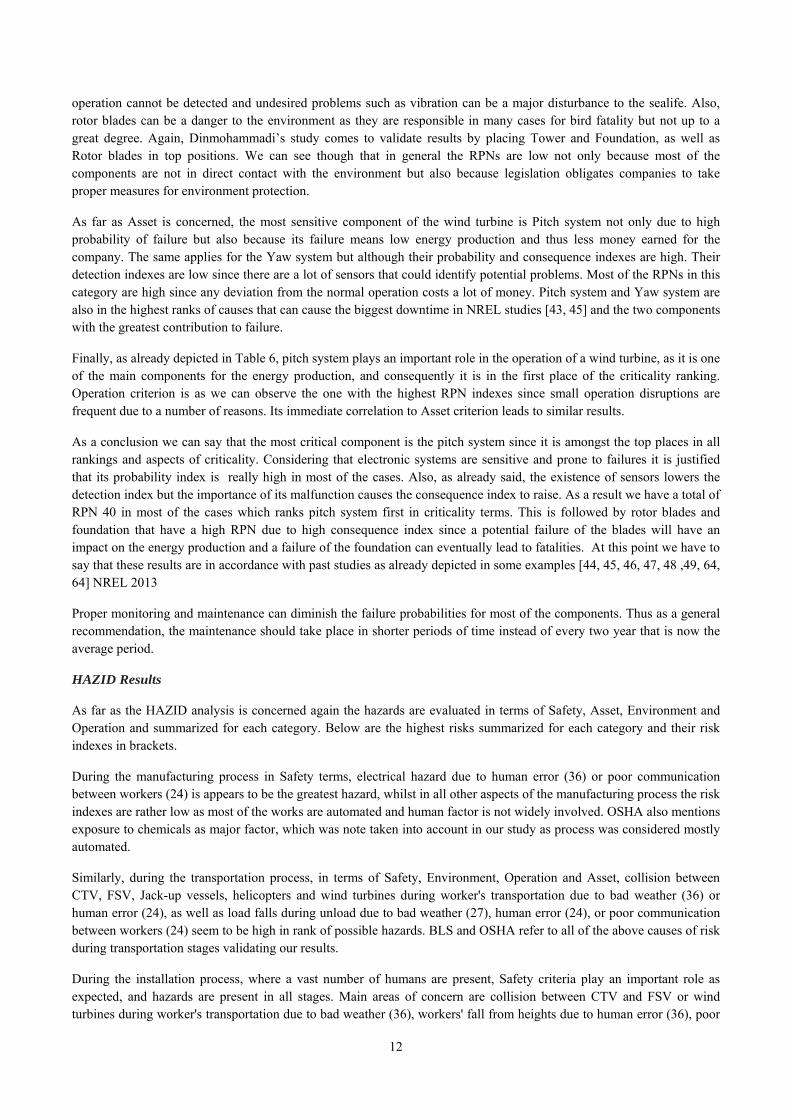
Table 7: FMECA analysis-Total ranking of components.
Total Ranking
Pitch system Rotor blades Foundation Yaw system Power generation system Cables Gearbox Tower Main frame Rotor hub Transformer
As shown in above Tables, the most sensitive component of the wind turbine in terms of Safety is the Tower as the consequences of a potential collapse would be catastrophic not only in case of fatalities but in all categories. Furthermore, the absence of sensors at the tower increases the possibility of undetected flaws that could lead to a possible failure compared to other components. The same applies for the foundation. The same can be validated by Dinmohammadi [43] in his study, where again Tower is ranked in the first place. As seen though in our study, all components have a relatively low RPN index as a total collapse is unlikely.
Foundation on the other side is the most failure prone component of the wind turbine in terms of Environment since foundation is in close contact with the sea and the seabed and again there is lack of sensors so any abnormalities in the
Ranking in terms of Safety Max RPN
Tower 16 Foundation 12 Cables 12 Rotor blades 12 Rotor hub 12 Main frame 9 Transformer 4 Gearbox 3 Pitch 2 Yaw 2 Power generation system 2
Ranking in terms of Operation Max RPN
Pitch system 40 Rotor blades 24 Power generation system 20 Cables 18 Gearbox 18 Tower 16 Foundation 12 Main frame 12 Transformer 12 Yaw system 12 Rotor hub 12
Ranking in terms of Asset Max RPN
Pitch system 40 Yaw system 24 Rotor blades 18 Cables 18 Gearbox failure 18 Tower failure 16 Foundation 12 Main frame 12 Transformer 12 Rotor hub 12 Power generation system 12
Ranking in terms of Environment Max RPN
Foundation 18 Cables 6 Rotor blades 6 Tower 4 Transformer 4 Gearbox 3 Main frame 3 Rotor hub 3 Pitch system 2 Yaw system 2 Power generation system 1
12
operation cannot be detected and undesired problems such as vibration can be a major disturbance to the sealife. Also, rotor blades can be a danger to the environment as they are responsible in many cases for bird fatality but not up to a great degree. Again, Dinmohammadi’s study comes to validate results by placing Tower and Foundation, as well as Rotor blades in top positions. We can see though that in general the RPNs are low not only because most of the components are not in direct contact with the environment but also because legislation obligates companies to take proper measures for environment protection.
As far as Asset is concerned, the most sensitive component of the wind turbine is Pitch system not only due to high probability of failure but also because its failure means low energy production and thus less money earned for the company. The same applies for the Yaw system but although their probability and consequence indexes are high. Their detection indexes are low since there are a lot of sensors that could identify potential problems. Most of the RPNs in this category are high since any deviation from the normal operation costs a lot of money. Pitch system and Yaw system are also in the highest ranks of causes that can cause the biggest downtime in NREL studies [43, 45] and the two components with the greatest contribution to failure.
Finally, as already depicted in Table 6, pitch system plays an important role in the operation of a wind turbine, as it is one of the main components for the energy production, and consequently it is in the first place of the criticality ranking. Operation criterion is as we can observe the one with the highest RPN indexes since small operation disruptions are frequent due to a number of reasons. Its immediate correlation to Asset criterion leads to similar results.
As a conclusion we can say that the most critical component is the pitch system since it is amongst the top places in all rankings and aspects of criticality. Considering that electronic systems are sensitive and prone to failures it is justified that its probability index is really high in most of the cases. Also, as already said, the existence of sensors lowers the detection index but the importance of its malfunction causes the consequence index to raise. As a result we have a total of RPN 40 in most of the cases which ranks pitch system first in criticality terms. This is followed by rotor blades and foundation that have a high RPN due to high consequence index since a potential failure of the blades will have an impact on the energy production and a failure of the foundation can eventually lead to fatalities. At this point we have to say that these results are in accordance with past studies as already depicted in some examples [44, 45, 46, 47, 48 ,49, 64, 64] NREL 2013
Proper monitoring and maintenance can diminish the failure probabilities for most of the components. Thus as a general recommendation, the maintenance should take place in shorter periods of time instead of every two year that is now the average period.
HAZID Results
As far as the HAZID analysis is concerned again the hazards are evaluated in terms of Safety, Asset, Environment and Operation and summarized for each category. Below are the highest risks summarized for each category and their risk indexes in brackets.
During the manufacturing process in Safety terms, electrical hazard due to human error (36) or poor communication between workers (24) is appears to be the greatest hazard, whilst in all other aspects of the manufacturing process the risk indexes are rather low as most of the works are automated and human factor is not widely involved. OSHA also mentions exposure to chemicals as major factor, which was note taken into account in our study as process was considered mostly automated.
Similarly, during the transportation process, in terms of Safety, Environment, Operation and Asset, collision between CTV, FSV, Jack-up vessels, helicopters and wind turbines during worker's transportation due to bad weather (36) or human error (24), as well as load falls during unload due to bad weather (27), human error (24), or poor communication between workers (24) seem to be high in rank of possible hazards. BLS and OSHA refer to all of the above causes of risk during transportation stages validating our results.
During the installation process, where a vast number of humans are present, Safety criteria play an important role as expected, and hazards are present in all stages. Main areas of concern are collision between CTV and FSV or wind turbines during worker's transportation due to bad weather (36), workers' fall from heights due to human error (36), poor
13
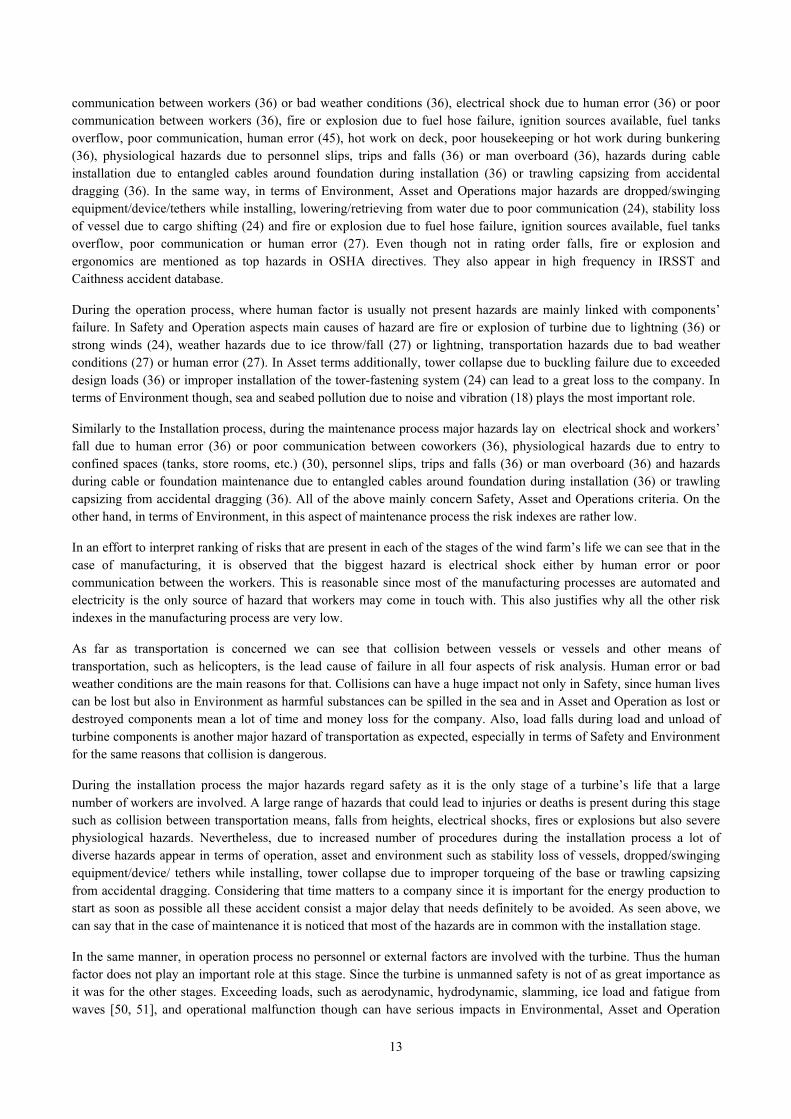
communication between workers (36) or bad weather conditions (36), electrical shock due to human error (36) or poor communication between workers (36), fire or explosion due to fuel hose failure, ignition sources available, fuel tanks overflow, poor communication, human error (45), hot work on deck, poor housekeeping or hot work during bunkering (36), physiological hazards due to personnel slips, trips and falls (36) or man overboard (36), hazards during cable installation due to entangled cables around foundation during installation (36) or trawling capsizing from accidental dragging (36). In the same way, in terms of Environment, Asset and Operations major hazards are dropped/swinging equipment/device/tethers while installing, lowering/retrieving from water due to poor communication (24), stability loss of vessel due to cargo shifting (24) and fire or explosion due to fuel hose failure, ignition sources available, fuel tanks overflow, poor communication or human error (27). Even though not in rating order falls, fire or explosion and ergonomics are mentioned as top hazards in OSHA directives. They also appear in high frequency in IRSST and Caithness accident database.
During the operation process, where human factor is usually not present hazards are mainly linked with components’ failure. In Safety and Operation aspects main causes of hazard are fire or explosion of turbine due to lightning (36) or strong winds (24), weather hazards due to ice throw/fall (27) or lightning, transportation hazards due to bad weather conditions (27) or human error (27). In Asset terms additionally, tower collapse due to buckling failure due to exceeded design loads (36) or improper installation of the tower-fastening system (24) can lead to a great loss to the company. In terms of Environment though, sea and seabed pollution due to noise and vibration (18) plays the most important role.
Similarly to the Installation process, during the maintenance process major hazards lay on electrical shock and workers’ fall due to human error (36) or poor communication between coworkers (36), physiological hazards due to entry to confined spaces (tanks, store rooms, etc.) (30), personnel slips, trips and falls (36) or man overboard (36) and hazards during cable or foundation maintenance due to entangled cables around foundation during installation (36) or trawling capsizing from accidental dragging (36). All of the above mainly concern Safety, Asset and Operations criteria. On the other hand, in terms of Environment, in this aspect of maintenance process the risk indexes are rather low.
In an effort to interpret ranking of risks that are present in each of the stages of the wind farm’s life we can see that in the case of manufacturing, it is observed that the biggest hazard is electrical shock either by human error or poor communication between the workers. This is reasonable since most of the manufacturing processes are automated and electricity is the only source of hazard that workers may come in touch with. This also justifies why all the other risk indexes in the manufacturing process are very low.
As far as transportation is concerned we can see that collision between vessels or vessels and other means of transportation, such as helicopters, is the lead cause of failure in all four aspects of risk analysis. Human error or bad weather conditions are the main reasons for that. Collisions can have a huge impact not only in Safety, since human lives can be lost but also in Environment as harmful substances can be spilled in the sea and in Asset and Operation as lost or destroyed components mean a lot of time and money loss for the company. Also, load falls during load and unload of turbine components is another major hazard of transportation as expected, especially in terms of Safety and Environment for the same reasons that collision is dangerous.
During the installation process the major hazards regard safety as it is the only stage of a turbine’s life that a large number of workers are involved. A large range of hazards that could lead to injuries or deaths is present during this stage such as collision between transportation means, falls from heights, electrical shocks, fires or explosions but also severe physiological hazards. Nevertheless, due to increased number of procedures during the installation process a lot of diverse hazards appear in terms of operation, asset and environment such as stability loss of vessels, dropped/swinging equipment/device/ tethers while installing, tower collapse due to improper torqueing of the base or trawling capsizing from accidental dragging. Considering that time matters to a company since it is important for the energy production to start as soon as possible all these accident consist a major delay that needs definitely to be avoided. As seen above, we can say that in the case of maintenance it is noticed that most of the hazards are in common with the installation stage.
In the same manner, in operation process no personnel or external factors are involved with the turbine. Thus the human factor does not play an important role at this stage. Since the turbine is unmanned safety is not of as great importance as it was for the other stages. Exceeding loads, such as aerodynamic, hydrodynamic, slamming, ice load and fatigue from waves [50, 51], and operational malfunction though can have serious impacts in Environmental, Asset and Operation
14
terms. Weather conditions, are the main failure causes during the operation process. Weather is a considerable risk factor as all assembly techniques can only be done in calm sea. Work becomes extremely difficult or dangerous in rough sea and project delays may occur. These temporary interruptions of work mean huge increases in the construction cost of offshore wind farms.
We can say as a conclusion that Safety is the top area of importance during all stages of a wind turbine’s life cycle since there is interference with human lives, and that can be seen from the high risk indexes in the risk matrix. Additionally, capital loss may be of great interest to the company and that is obvious since Asset and Operation also have high risk indexes in most of the failure causes along the risk matrix.
European Agency for Safety and Health at Work [60], Caithness database, IRSST [59] and UA department of Labor [58] validate at a great point the frequency and severity of hazards where the human factor is involved as described in above sections.
15
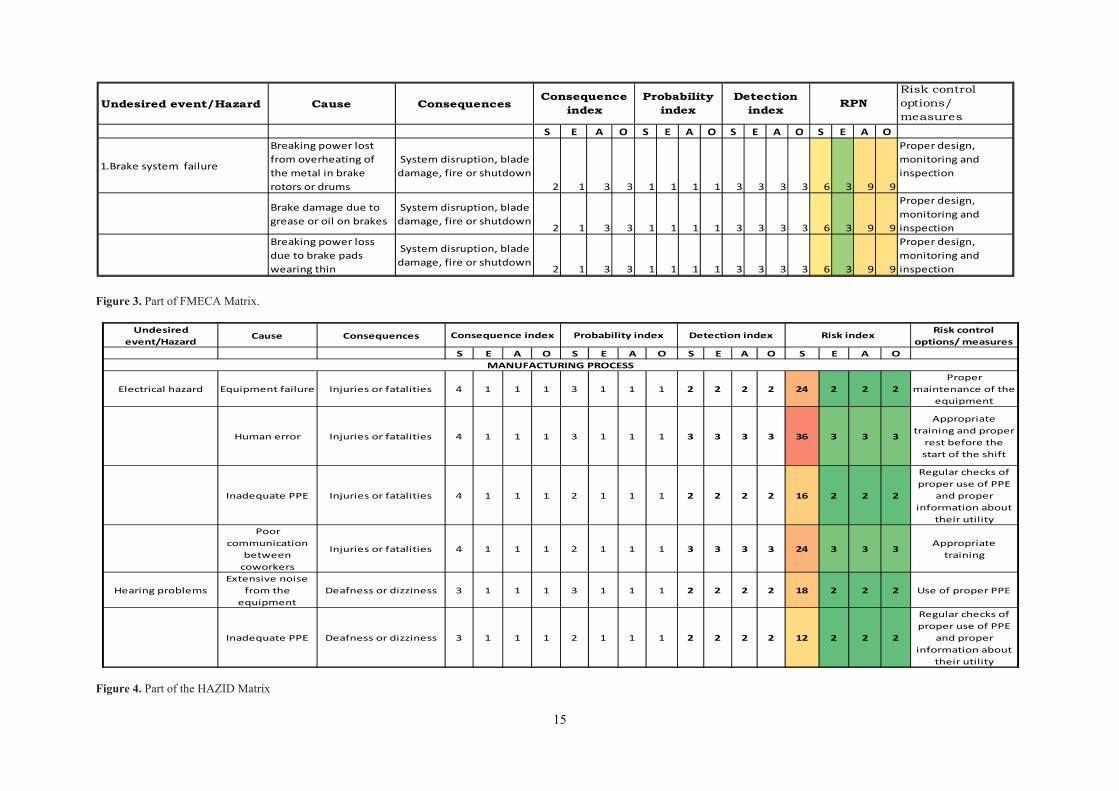
Figure 3. Part of FMECA Matrix.
Figure 4. Part of the HAZID Matrix
Undesired event/Hazard Cause ConsequencesRisk control options/ measures
S E A O S E A O S E A O S E A O
1.Brake system failure
Breaking power lost
from overheating of
the metal in brake
rotors or drums
System disruption, blade
damage, fire or shutdown
2 1 3 3 1 1 1 1 3 3 3 3 6 3 9 9
Proper design,
monitoring and
inspection
Brake damage due to
grease or oil on brakes
System disruption, blade
damage, fire or shutdown2 1 3 3 1 1 1 1 3 3 3 3 6 3 9 9
Proper design,
monitoring and
inspection
Breaking power loss
due to brake pads
wearing thin
System disruption, blade
damage, fire or shutdown2 1 3 3 1 1 1 1 3 3 3 3 6 3 9 9
Consequence index Probability index Detection index Risk index
MANUFACTURING PROCESS
16
BBN Results
BBN method complements the previous analysis conducted using HAZID and FMECA and can confirm or refute the results not only by identifying the most costly components but also compare the results with the other two methods regarding the most critical components and their failure probabilities. The key feature of BBNs is their ability to model and reason about uncertainty and their graphical, articulate appearance.
BBN can be quite complex and it may be necessary to break it down to subcategories. In this case, we avoid computational intensive and time consuming process. In our approach we divided the main system into 11 subsystems. When necessary, in complicated systems, a further division was made to simplify the calculations into categories such as electrical failure, structural failure, human error and external parameters as in below Figures 5,6,7,8.
More specifically, the 11 subsystems were: Cables, Foundation, Yaw, Transformer, Tower, Rotor blades, Pitch, Main frame, Power generation, Rotor hub and Gearbox. Due to plethora and diversity of failure modes, Cables subsystem was further divided into electrical failure, structural failure and external parameters. For the same reasons, Foundation was divided into structural failure, fatigue and human errors. In a similar way, Pitch system’s subcategories were structural failure, electrical failure, overloading and other causes (structures as shown on other studies [47, 48, 52].
After implementing the data for each subcategory, as for example shown in Table 8 for Pitch system, we identified and ranked the most critical components and their probability of failure (Table 9). In the final stages of our approach we incorporated the annual cost estimate for each component in order to get an approximation of the total annual cost in case of failure.
Figure 5. BBN diagram showing possible failure causes of a wind turbine’s pitch system.
17
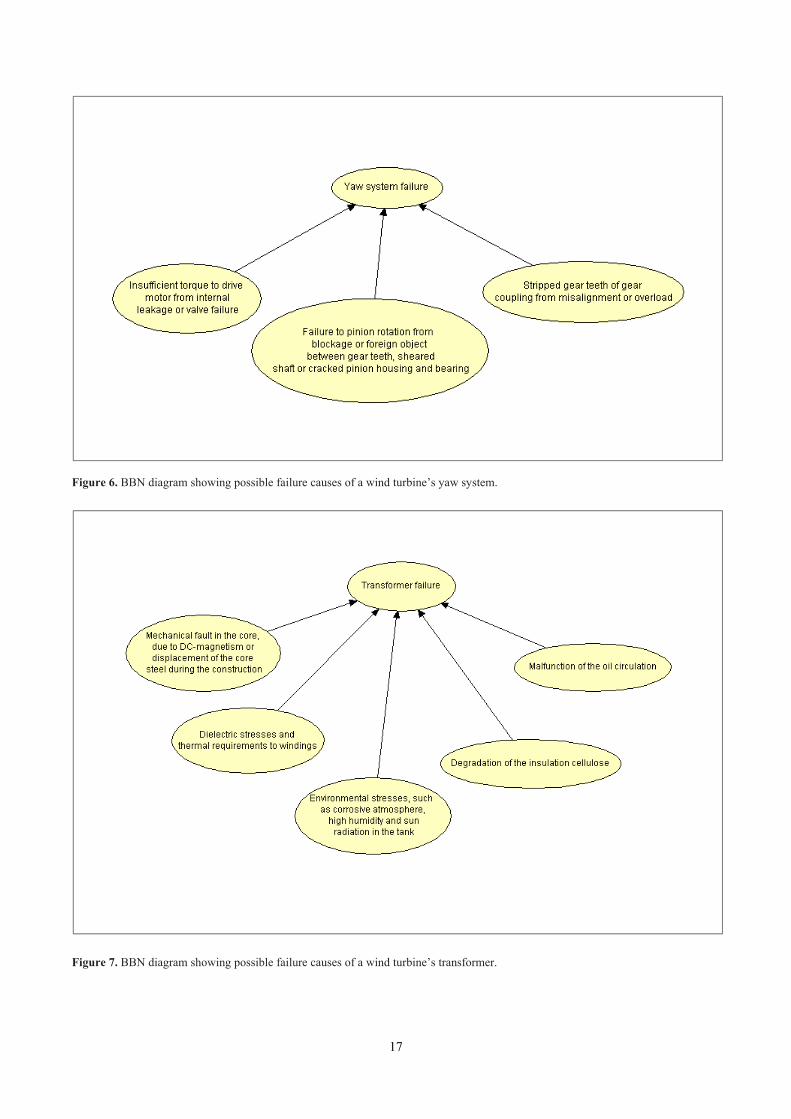
Figure 6. BBN diagram showing possible failure causes of a wind turbine’s yaw system.
Figure 7. BBN diagram showing possible failure causes of a wind turbine’s transformer.
18
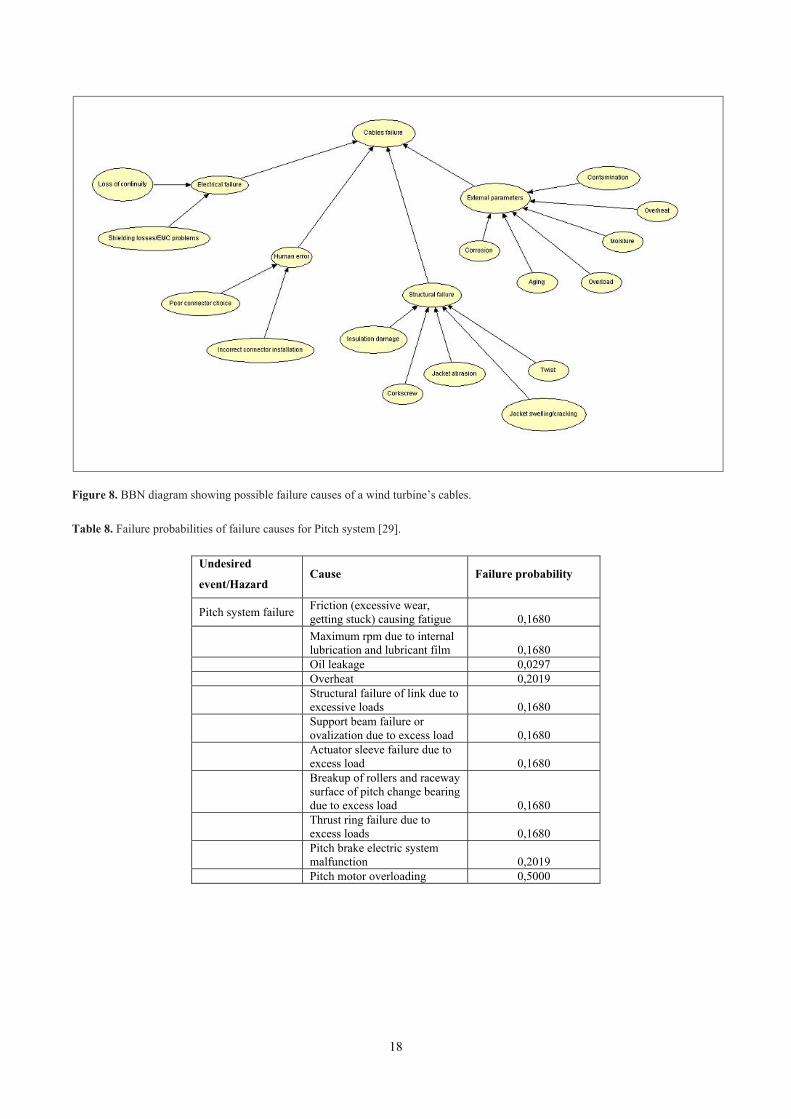
Figure 8. BBN diagram showing possible failure causes of a wind turbine’s cables.
Table 8. Failure probabilities of failure causes for Pitch system [29].
Maximum rpm due to internal lubrication and lubricant film 0,1680
Oil leakage 0,0297 Overheat 0,2019
Structural failure of link due to excessive loads 0,1680
Support beam failure or ovalization due to excess load 0,1680
Actuator sleeve failure due to excess load 0,1680
Breakup of rollers and raceway surface of pitch change bearing due to excess load 0,1680
Thrust ring failure due to excess loads 0,1680
Pitch brake electric system malfunction 0,2019
Pitch motor overloading 0,5000
19
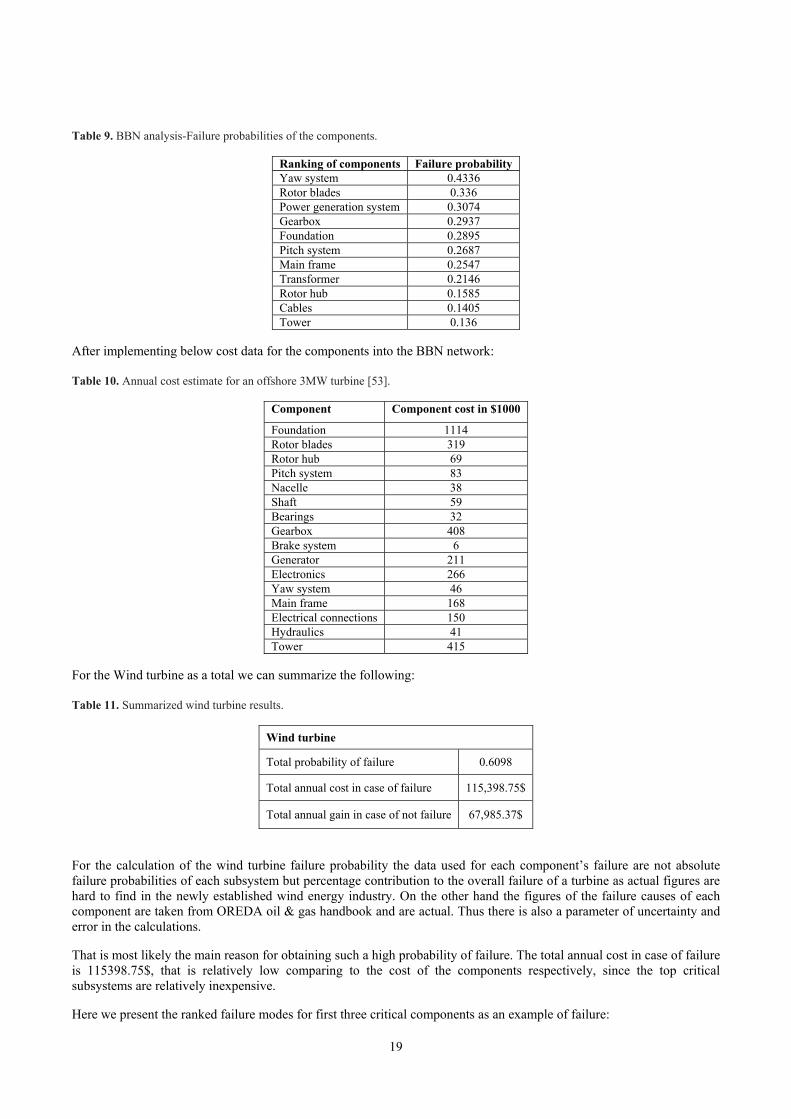
Table 9. BBN analysis-Failure probabilities of the components.
Ranking of components Failure probability Yaw system 0.4336 Rotor blades 0.336 Power generation system 0.3074 Gearbox 0.2937 Foundation 0.2895 Pitch system 0.2687 Main frame 0.2547 Transformer 0.2146 Rotor hub 0.1585 Cables 0.1405 Tower 0.136
After implementing below cost data for the components into the BBN network:
Table 10. Annual cost estimate for an offshore 3MW turbine [53].
Component Component cost in $1000
Foundation 1114 Rotor blades 319 Rotor hub 69 Pitch system 83 Nacelle 38 Shaft 59 Bearings 32 Gearbox 408 Brake system 6 Generator 211 Electronics 266 Yaw system 46 Main frame 168 Electrical connections 150 Hydraulics 41 Tower 415
For the Wind turbine as a total we can summarize the following:
Table 11. Summarized wind turbine results.
Wind turbine
Total probability of failure 0.6098
Total annual cost in case of failure 115,398.75$
Total annual gain in case of not failure 67,985.37$
For the calculation of the wind turbine failure probability the data used for each component’s failure are not absolute failure probabilities of each subsystem but percentage contribution to the overall failure of a turbine as actual figures are hard to find in the newly established wind energy industry. On the other hand the figures of the failure causes of each component are taken from OREDA oil & gas handbook and are actual. Thus there is also a parameter of uncertainty and error in the calculations.
That is most likely the main reason for obtaining such a high probability of failure. The total annual cost in case of failure is 115398.75$, that is relatively low comparing to the cost of the components respectively, since the top critical subsystems are relatively inexpensive.
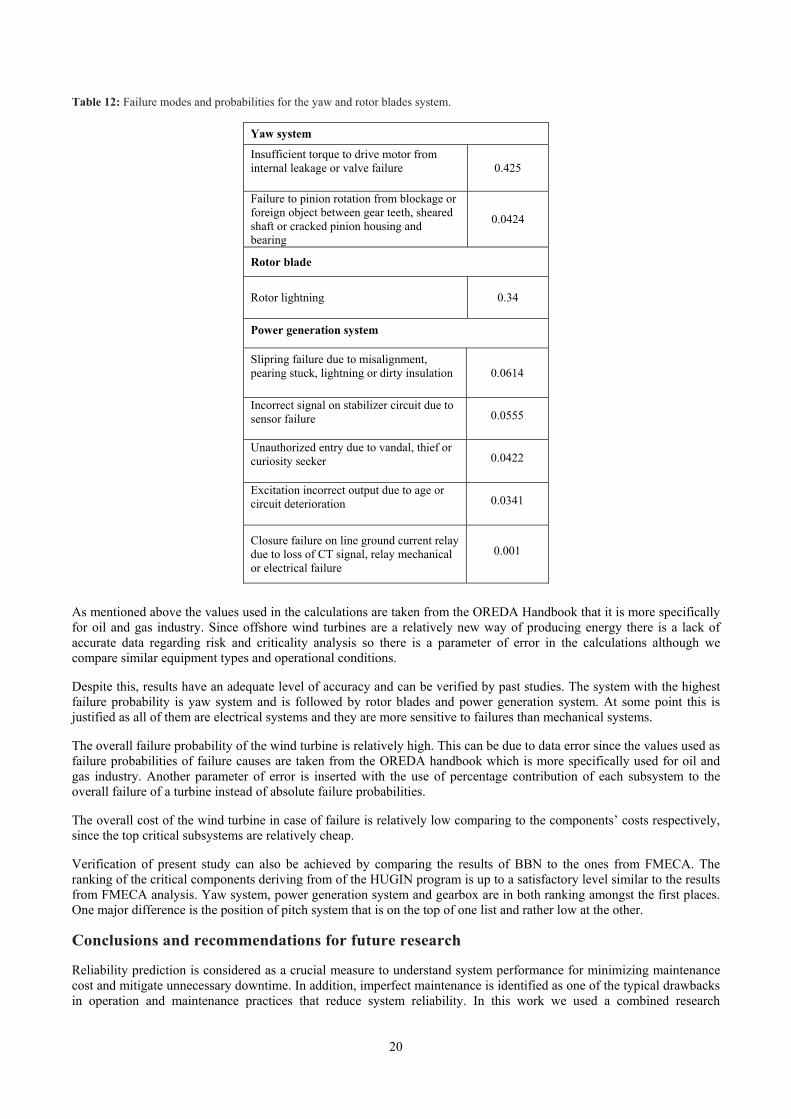
Here we present the ranked failure modes for first three critical components as an example of failure:
20
Table 12: Failure modes and probabilities for the yaw and rotor blades system.
Yaw system
Insufficient torque to drive motor from internal leakage or valve failure
0.425
Failure to pinion rotation from blockage or foreign object between gear teeth, sheared shaft or cracked pinion housing and bearing
0.0424
Rotor blade
Rotor lightning
0.34
Power generation system
Slipring failure due to misalignment, pearing stuck, lightning or dirty insulation
0.0614
Incorrect signal on stabilizer circuit due to sensor failure
0.0555
Unauthorized entry due to vandal, thief or curiosity seeker
0.0422
Excitation incorrect output due to age or circuit deterioration
0.0341
Closure failure on line ground current relay due to loss of CT signal, relay mechanical or electrical failure
0.001
As mentioned above the values used in the calculations are taken from the OREDA Handbook that it is more specifically for oil and gas industry. Since offshore wind turbines are a relatively new way of producing energy there is a lack of accurate data regarding risk and criticality analysis so there is a parameter of error in the calculations although we compare similar equipment types and operational conditions.
Despite this, results have an adequate level of accuracy and can be verified by past studies. The system with the highest failure probability is yaw system and is followed by rotor blades and power generation system. At some point this is justified as all of them are electrical systems and they are more sensitive to failures than mechanical systems.
The overall failure probability of the wind turbine is relatively high. This can be due to data error since the values used as failure probabilities of failure causes are taken from the OREDA handbook which is more specifically used for oil and gas industry. Another parameter of error is inserted with the use of percentage contribution of each subsystem to the overall failure of a turbine instead of absolute failure probabilities.
The overall cost of the wind turbine in case of failure is relatively low comparing to the components’ costs respectively, since the top critical subsystems are relatively cheap.
Verification of present study can also be achieved by comparing the results of BBN to the ones from FMECA. The ranking of the critical components deriving from of the HUGIN program is up to a satisfactory level similar to the results from FMECA analysis. Yaw system, power generation system and gearbox are in both ranking amongst the first places. One major difference is the position of pitch system that is on the top of one list and rather low at the other.
Conclusions and recommendations for future research
Reliability prediction is considered as a crucial measure to understand system performance for minimizing maintenance cost and mitigate unnecessary downtime. In addition, imperfect maintenance is identified as one of the typical drawbacks in operation and maintenance practices that reduce system reliability. In this work we used a combined research
21
methodology for the risk analysis and the prediction of the long-term reliability of an offshore wind turbine’s sub-systems. The key elements presented in this report are as follows:
• Review of risk analysis and risk assessment methods in renewables, maritime and oil & gas sector, as well as their tools and softwares.
• Presentation of a risk analysis and decision making methodology for implementation of the offshore wind turbine sector
• A novel technique for predicting system reliability is provided through this approach by combining HAZID, FMECA and BBN analysis.
• Development of a detailed risk matrix to be used for all activities of the wind turbine as well as for the critical components.
• Identification of the hazards in all activities in the lifetime of the turbine. • Identification of the high-ranked hazardous areas in all activities in the lifetime of the turbine and its components. • Identification of the most costly components of a wind turbine.
Additionally, the research study conducted here provides a tread for expanding into further research in risk analysis. The main recommendation that may enhance the proposed methodology is a further investigation in order to gather more accurate information about the offshore industry since implementation of the onshore data can lead to significant errors. Furthermore, more maintenance details could be implemented in the BBN networks so that more informative and proper decisions can be made on behalf of the decision makers about the maintenance strategy. In order to obtain more realistic reliability result it is also suggested that the different kinds of maintenance strategy (i.e. planned, preventive, corrective, breakdown) is taken into consideration. A sensitivity study on the conditional probability tables could also be a part of future research for accurate verification of the results.
Also, BBN analysis could be implemented for the HAZID analysis as well, so that the costs, in case the most critical operations occur, could be calculated. Finally, Future research could include a more elaborate, sophisticated risk based analysis considering the explicit formulation of a numerical optimization problem to be solved for the global minimum (optimal solution). Further, the time dependent character of the problem would be explicitly considered by modeling the involved dynamics via non- stationary stochastic processes[54, 55, 56].
The above recommendations can improve reliability and criticality analysis that are beneficial for obtaining optimum maintenance strategy and prevent risks and hazards of an offshore wind turbine.
References
[1] Fthenakis V, Kim H C. (2009), "Land use and electricity generation: A life-cycle analysis". Renewable and Sustainable Energy Reviews 13 (6–7): 1465.
[2] WINDUSTRY (2014), “Why wind energy”, (accessed May 15, 2014)
[3] Sherif YS. (1989), “On Risk and Risk Analysis. Reliability Engineering and System Safety”, 31, (1991), pp. 155-178.
[4] Renn O. (1998), “The Role of Risk Perception for Risk Management. Reliability Engineering and System Safety”, Vol. 59, (1998), pp. 49-62.
[5] WHO (World Health Organization Geneva), (2004), “IPCS Risk Assessment Methodology”, World Health Organization Geneva
[6] Kristensen V, Aven T, Ford D (2006), “A new perspective on Renn and Klinke's approach to risk evaluation and management. Reliability Engineering and system safety”, Vol. 91 (2006), pp. 421-432
[7] Aven T. (2010), “On how to define, understand and describe risk”, Reliability Engineering and System Safety, Vol. 95 (2010), pp. 623–631
[8] Bitaraf S. (2011), “Risk Assessment and Decision Support: Applicable to Oil Field Development Plants”, Master of Science Thesis in the Master’s Programme, International Project Management, Department of Product and Production Development, Division of Production System, Chalmers University Of Technology, Göteborg, Sweden 2011
[9] Gough JD. (1997), "Environmental Decision Making and Risk Management for Groundwater Systems", Journal of the Risk Assessment and Policy Association 8 (155).
22
[10] Willows R, Connell R. (2003), “Climate adaptation: Risk, Uncertainty and Decision Making”, UKCIP (UK Climate Impacts Program) Technical Report, May 2003
[11] Sutton I. (2010), “Process Risk and Reliability Management - Operational Integrity Management”, Elsevier Science Ltd, 1st edition.
[12] Filipsson M. (2011), “Uncertainty, Variability and Environmental Risk Analysis (Doctoral Dissertation)”, Linnaeus University Press
[13] Chapman C. Ward S. (2003), “Project Risk Management: Processes, Techniques and Insights”, Second edition. Chichester: Wiley, cop. 2003
[14] PMI (Project Management Institute), (2009), “Practice Standard for Project Risk Management”, 4th edition. Project Management Institute.
[15] BS/ISO (2002), “Petroleum and natural gases industries-Offshore production installations-Guidelines on tools and techniques for hazard identification and risk assessment”, BS/ISO standard 17776, Brussels, 2002
[16] AS/NZS: 4360, (2004), “The Australian and New Zealand Standard on Risk Management”, 3rd edition. Australian and New Zealand Standard
[21] Migilinskas D, Ustinovičius L. (2008), “Methodology of risk and uncertainty management in construction’s technological and economical problems”, The 25th International Symposium on Automation and Robotics in Construction (ISARC 2008), June 26-29, 2008 Vilnius, Lithuania, p. 789-794
[23] Lazakis I, Turan O, & Rosendahl T (2012), “Risk assessment for the installation and maintenance activities of a low-speed tidal energy converter”, In Marine & Offshore Renewable Energy 2012, Royal Institution of Naval Architects)
[24] HSE (2006), “Assessment principles for offshore Safety Case”, HSE publications, London
[25] DNV (2001), “Marine risk assessment”, Offshore technology report prepared for the UK HSE, London
[26] DNV (2003), “Risk management in marine and subsea operations”, RP-H101, Hovik, Norway
[27] IMO (2007), “Formal Safety Assessment (FSA): Consolidated text of the guidelines for Formal Safety Assessment (FSA) for use in the IMO rule-making process”, MSC/Circ. 1023.
[28] ABS (2003), “Guide for risk evaluations for the classification of marine-related facilities”, Publication 117, Houston
[30] NORSOK N-004 (2013), “Design Of Steel Structures, Annex K Special Design Provisions For Jackets”.
[31] Shafiee M, Dinmohammadi F. (2014), “An FMEA-Based Risk Assessment Approach for Wind Turbine Systems: A Comparative Study of Onshore and Offshore”, Special Issue Wind Turbines.
[32] Melchers RE. (2001), “On the ALARP Approach to Risk Management, Reliability Engineering and System Safety”, Vol. 71, pp. 201-208
23
[33] Goble WM, Cheddie H. (2005), “Safety Instrumented Systems Verification: Practical Probabilistic Calculations”, Research Triangle Park, NC: ISA-The Instrumentation, Systems, and Automation Society, c2005
[34] Mannan, S. (2005), “Lees' Loss Prevention in the Process Industries”, Volumes 1-3. 3rd Edition. Elsevier
[35] Headquarters, Department Of The Army, Washington DC (2006), “Failure modes, effects and criticality analyses (fmeca) for command, control, communications, computer, intelligence, surveillance, and reconnaissance (C4ISR) facilities”.
[36] DNV (2008b), “Classification based on performance criteria determined from risk assessment methodology”, Offshore service specification DNV-OSS 121, Hovik, Norway
[37] Rausand M (2005), “Chapter 3: System Analysis Failure Modes, Effects, and Criticality Analysis”, System Reliability Theory (2nd ed), Wiley, 2004 – 1 / 46, Department of Production and Quality Engineering, Norwegian University of Science and Technology.
[38] ABS Consulting (2001), “Principles of Risk Based Decision Making”, United States. Beck, N. 2006. Proposed Risk Assessment Bulletin. Office of Management and Budget.
[39] API RECOMMENDED PRACTICE 14J First Edition September (1993), “Recommended Practice for Design and Hazards Analysis for Offshore Production Facilities”.
[40] Wooldridge S (2003), “Bayesian Belief Networks”, Australian Institute of Marine Science, CSIRO.
[41] Remco R Bouckaert.(1995), “Bayesian Belief Networks: From Construction to Inference”, Utrecht: Universiteit Utrecht.
[42] Korb K, Nicholson A (2010), “Bayesian Artificial Intelligence, Second Edition”, Computer Science and Data Analysis Series.
[43] Shuangwen (Shawn) Sheng, Mark McDade, Robert Errichello (2011), “Wind Turbine Gearbox Failure Modes – A Brief”, National Renewable Energy Laboratory.
[44] Dinmohammadi F, Shafiee M. (2013), “A Fuzzy-FMEA Risk Assessment Approach for Offshore Wind Turbines”, International Journal of Prognostics and Health Management, ISSN 2153-2648
[45] Shuangwen (Shawn) Sheng (2013), “Report on Wind Turbine Subsystem Reliability ─ A Survey of Various Databases”, National Renewable Energy Laboratory.
[46] Arabian-Hoseynabadi H, Oraee H, and Tavner P. “Failure modes and effects analysis (FMEA) for wind turbines”, International Journal of Electrical Power & Energy Systems 2010; 32: 817–824.
[47] J. Ribrant, and L.M. Bertling, “Survey of failures in wind power systems with focus on Swedish wind power plants during 1997–2005,” IEEE Trans Energy Conversion, vol. EC22, no. 1, pp. 167–173, 2007.
[48] Carroll J, McDonald A, McMillan D (2015), “Failure Rate, Repair Time and Unscheduled O&M Cost Analysis of Offshore Wind Turbines”, Accepted and in press with Wiley Wind Energy Journal. April 2015.
[49] Nivedh B.S. (2014), “Major failures in the wind turbine components and the importance of periodic inspections”, DEWI.
[50] Hirdaris, S.E., Bai, W., Dessi, D., Ergin, A., Gu, X., Hermundstad, O.A., Huijsmans, R., Iijima, K., Nielsen, U.D., Parunov, J., Fonseca, N., Papanikolaou, A., Argyriadis, K., Incecik, A. (2014), “ Loads for use in the design of ships and offshore structures”, Ocean Engineering, 78, pp. 131-174 (Review paper).
[52] Caithness windfarm information forum website “Detailed Accident List” (accessed April 28, 2016)
24
[53] Fingersh L, Hand M, Laxson A. (2006), “Wind Turbine Design Cost and Scaling Model”, Technical Report NREL/TP-500-40566
[54] Au SK, Beck JL. (2001), “First excursion probabilities for linear systems by very efficient importance sampling”, Probabilistic Engineering Mechanics 16, 193-207
[55] Kougioumtzoglou A Ioannis, Spanos D Pol (2013), “Response and First-Passage Statistics of Nonlinear”, Journal of Engineering Mechanics, ASCE / September 2013, 139:1207-1217
[56] Kougioumtzoglou A Ioannis, Spanos D Pol (2014), “Survival Probability Determination of Nonlinear Oscillators Subject to Evolutionary Stochastic Excitation”, Journal of Applied Mechanics, ASME, May 2014, Vol. 81
[57] Association for Project Management (2004), “Project Risk Analysis and Management (PRAM) Guide (2nd Edition)”, Princes Risborough, UK: Association for Project Management
[58] Green Job Hazards: Wind Energy, Occupational Safety & Health Administration, United States Department of Labor Website (accessed April 28, 2016)
[59] Chaumel J, Giraud L, Ilinca A (2015), “Occupational Health and Safety Risks and Accident Prevention Strategies”, Wind Energy Sector, IRSST, 2015
[60] European Agency for Safety and Health at Work (2013), “Occupational Safety and Health in the Wind Energy Sector, E-FACTS”.
[61] Project Management Institute (2008), “A guide to the project management body of knowledge (PMBOK Guide)”, Chapter 11.
[62] Lewis S. (2005), “An Overview of Leading Software Tools for QRA”, American Society of Safety Engineers –Middle East Chapter (161), 7th Professional Development Conference & Exhibition, March 18-22, Kingdom of Bahrain
[63] International Organization for Standardization ISO /IEC 31010:2009 (2009), “Risk management – Risk assessment techniques”, Geneva, Switzerland: International Organization for Standardization.
[64] Subin, K.K., Das, P.K., Quigley, J. and Hirdaris, S.E. (2012) Risk Analysis of Damaged Ships - A data driven Bayesian approach. Ships and Offshore Structures, 7(3), pp. 333-347.
[65] Wang J, Matellini B, Wall A, Phipps J (2011), “Risk-Based verification of large offshore systems”, Proc IMechE Proceedings of the Institution of Mexhanical Engineer, Part M.
[66] Lazakis I, Turan O, and Rosendahl T. (2013), “Modelling of vessel and equipment cost for the maintenance activities of an offshore tidal energy array”, Proceedings of the PRADS2013, 20-25 October, 2013, CECO, Changwon City, Korea.
[67] Lee Merkhoffer Consulting, “Technical Terms Used in Project Portfolio Management, http://www.prioritysystem.com/glossary2aa.html, (accessed May 20, 2014)
[68] Sormunen O, Goerlandt F, Hakkinen J, Posti A, Hanninen M, Montewka J, Stahlberg K, Kujala P (2013), “Uncertainty in maritime risk analysis: Extended case study on chemical tanker collisions”, IMechE Proceedings of the Institution of Mechanical Engineer, Part M.