LABOR SUPPLY RESPONSE TO THE EARNED INCOMETAX CREDIT*
NADA EISSA AND JEFFREY B. LIEBMAN
This paper examines the impact of the Tax Reform Act of 1986 (TRA86),which included an expansion of the earned income tax credit, on the labor forceparticipation and hours of work of single women with children. We identify theimpact of TRA86 by comparing the change in labor supply of single women withchildren to the change for single women without children. We find that between1984-1986 and 1988-1990, single women with children increased their relativelabor force participation by up to 2.8 percentage points. We observe no change inthe relative hours worked by single women with children who were already in thelabor force.
Historically, the United States has chosen to provide a safetynet for families with children. Since 1935, Aid to Families withDependent Children (AFDC) has supplied cash welfare paymentsto needy single-parent families. Families on AFDC may also re-ceive food stamps, medicaid, and housing assistance. Because themaximum level of benefits is received by families with no incomeand because benefits are reduced almost dollar for dollar withadditional earnings,' the welfare system is predicted by static la-bor supply theory to discourage the labor force participation andhours of work of single parents. Existing empirical evidencemostly confirms these theoretical predictions. 2
In a series of major expansions beginning in 1987, the earnedincome tax credit (EITC) has emerged as a popular alternativemethod for transferring income to needy families with children.The EITC is a refundable credit; therefore, any credit due in ex-cess of tax liability is refunded to the taxpayer in the form of atax refund check. In 1996 when the most recent expansion of theEITC is scheduled to be fully phased in, the maximum credit willreach $2206 for a taxpayer with one child and $3644 for a tax-
*We are grateful to Gary Chamberlain, David Cutler, Douglas Elmendorf,Daniel Feenberg, Martin Feldstein, Judith Hellerstein, James Hines, Guido Im-bens, Lawrence Katz, Brigitte Madrian, David Neumark, Marian Valliant, threeanonymous referees, and seminar participants at Harvard University, the Massa-chusetts Institute of Technology, and the University of California at Berkeley andat Santa Cruz for useful suggestions. Liebman was supported by a National Sci-ence Foundation Graduate Research Fellowship.
1. For discussions of effective marginal tax rates from the welfare and taxsystems see Fraker, Moffitt, and Wolf [1985], Dickert, Houser, and Scholz [1994],and Giannarelli and Steuerle [1994].
2. Moffitt [1992] and Danziger, Haveman, and Plotnick [1981] survey the em-pirical literature.
payer with two or more children. Advocates of the EITC arguethat the credit transfers income to a particularly deserving groupof people, the working poor, and that the redistribution occurswith much less distortion of labor supply than is caused by otherelements of the welfare system. In particular, the credit is said toencourage labor force participation.
The EITC creates a complicated and ambiguous set of laborsupply incentives. Standard labor supply theory does indeed pre-dict that the EITC will encourage labor force participation. Thisoccurs because the EITC is available only to taxpayers withearned income. But theory also predicts that the credit reducesthe number of hours worked by most eligible taxpayers already inthe labor force. While the credit initially increases with income,producing offsetting income and substitution effects on hoursworked, over 70 percent of recipients have incomes in regions inwhich the credit is constant (and therefore produces only a nega-tive income effect on labor supply) or is being phased out (produc-ing negative income and substitution effects). Moreover, since thephaseout of the credit produces a nonconvexity in the budget con-straint, taxpayers with incomes beyond the phaseout region maychoose to reduce their hours of work and take advantage of thecredit. Cumulative marginal tax rates can be quite high in thephaseout region. In 1996 some taxpayers with two children andincome between $11,610 to $28,495 will face a net marginal taxrate (on the worker's marginal revenue product) of 53 percent. 3
In this paper we examine the impact of the Tax Reform Actof 1986 (TRA86), which included an expansion of the EITC, onlabor force participation and hours of work. The expansion of thecredit affects an easily identifiable group, single women with chil-dren, but is predicted to have no effect on another group, singlewomen without children. Other features of TRA86, such as theincrease in the value of dependent exemptions and the large in-crease in the standard deduction for head of household filers, arepredicted by economic theory to have reinforced the impact of the
3. We assume that the full incidence of payroll taxes falls on the worker. Thenet marginal tax rate is the share of the worker's marginal revenue product thatis paid in taxes and lost benefits. A worker whose gross pay is $10 an hour wouldhave a marginal revenue product of $10.765, since the employer pays half of theOASDHI payroll tax. After subtracting $1.50 for federal income tax, $.60 for stateincome tax, $.765 for the employee's share of OASDHI, and $2.106 in lost EITCpayments, the taxpayer has a net of tax and benefits hourly wage of $5.029. Divid-ing the total tax and lost benefits $5.736 by $10.765 yields a marginal tax rate of53.3 percent. If some of employee compensation is in untaxed benefits, then thisis an overstatement of marginal tax rates.
at London School of econom
ics on January 13, 2013http://qje.oxfordjournals.org/
EITC on the relative labor supply outcomes of single women withand without children. We therefore compare the change in laborsupply of single women with children to the change in labor sup-ply of single women without children. We find that after TRA86,the labor force participation of single women with children in-creased by up to 2.8 percentage points relative to single womenwithout children (from a base of 73.0 percent). We explore a num-ber of alternative explanations for this finding, and conclude thatthe expansion of the EITC and the other provisions of TRA86 arethe most likely explanation. We find no effect of the EITC expan-sion on the hours of work of single women with children who werealready in the labor force. 4
The remainder of the paper is divided into six sections. Sec-tion I explains the eligibility rules and structure of the EITC andoutlines the predicted impact of the EITC on participation andhours of work. Section II discusses our identification strategy andour various treatment and control groups. Section III describesthe data. Section IV presents empirical results for labor force par-ticipation. Section V presents estimates for hours and total em-ployment. Section VI concludes.
I. THE STRUCTURE OF THE EITC
The earned income tax credit began in 1975 as a modest pro-gram aimed at offsetting the social security payroll tax for low-income families with children. After major expansions in the taxacts of 1986, 1990, and 1993, the EITC has become a central partof the federal government's antipoverty strategy. By 1996 federalspending on the EITC (including both tax expenditures and out-lays) is projected to be 1.7 times as large as federal spending onAFDC.
A taxpayer currently needs to meet three requirements inorder to be eligible for the earned income tax credit. First, the
4. A number of other papers have analyzed labor supply response to theEITC. We believe, however, that our paper is the first that estimates actual behav-ioral responses to a change in the credit. Three papers have used estimates fromthe negative income tax experiments to predict the impact of the EITC on laborsupply [Hoffman and Seidman 1990; GAO 1993; Holtzblatt, McCubbin, and Gil-lette 1994]. In addition, Dickert, Houser, and Scholz [1995] estimate a joint labormarket and welfare participation model that incorporates the EITC. Using theirresults and hours of work elasticities from the labor supply literature, they simu-late the effects on labor supply of the recent expansion of the EITC. Finally, Thest[1993] and Browning [1995] present opposing views on whether the EITC is anefficient method of transferring income to low-income families.
at London School of econom
ics on January 13, 2013http://qje.oxfordjournals.org/
taxpayer must have positive earned income. Earned income is thesum of wage and salary income, business self-employment in-come, and farm self-employment income. Second, a taxpayer's ad-justed gross income and earned income must both be below aspecified amount (In 1996 the maximum income for a taxpayerwith two or more children to be eligible to receive the EITC is$28,495). Third, a taxpayer must have a qualifying child. 5 A qual-ifying child is a child, grandchild, stepchild, or foster child of thetaxpayer who is under the age of 19 (under 24 if a full-time stu-dent) or permanently disabled, and who lives with the taxpayerfor more than one-half of the tax year. Until 1991 the rules forEITC eligibility were more complicated and depended on the tax-payer's filing status. 6 The credit is refundable so that a taxpayerwith no federal tax liability, for example, would receive a tax re-fund from the government for the full amount of the credit. Tax-payers may also receive the credit throughout the year with theirpaychecks; but in 1992, the most recent year for which data areavailable, less than one-half of 1 percent of all EITC recipientsavailed themselves of this early payment option [Internal Reve-nue Service 1992].
The amount of the credit to which a taxpayer is entitled de-pends on the taxpayer's earned income, adjusted gross income,and, since 1991, the number of EITC-eligible children in thehousehold. In 1996 the credit for a family with two or more chil-dren is phased in at a 40 percent rate over the first $8890 ofearned income, resulting in a maximum credit of $3556. As in-come rises from $8890 to $11,610, the credit remains at $3556.Then the credit is phased out at a 21.06 percent rate on incomestarting from $11,610 (the maximum of AGI and earned incomegoverns the phaseout), so that by $28,495 the taxpayer is nolonger eligible for the credit.
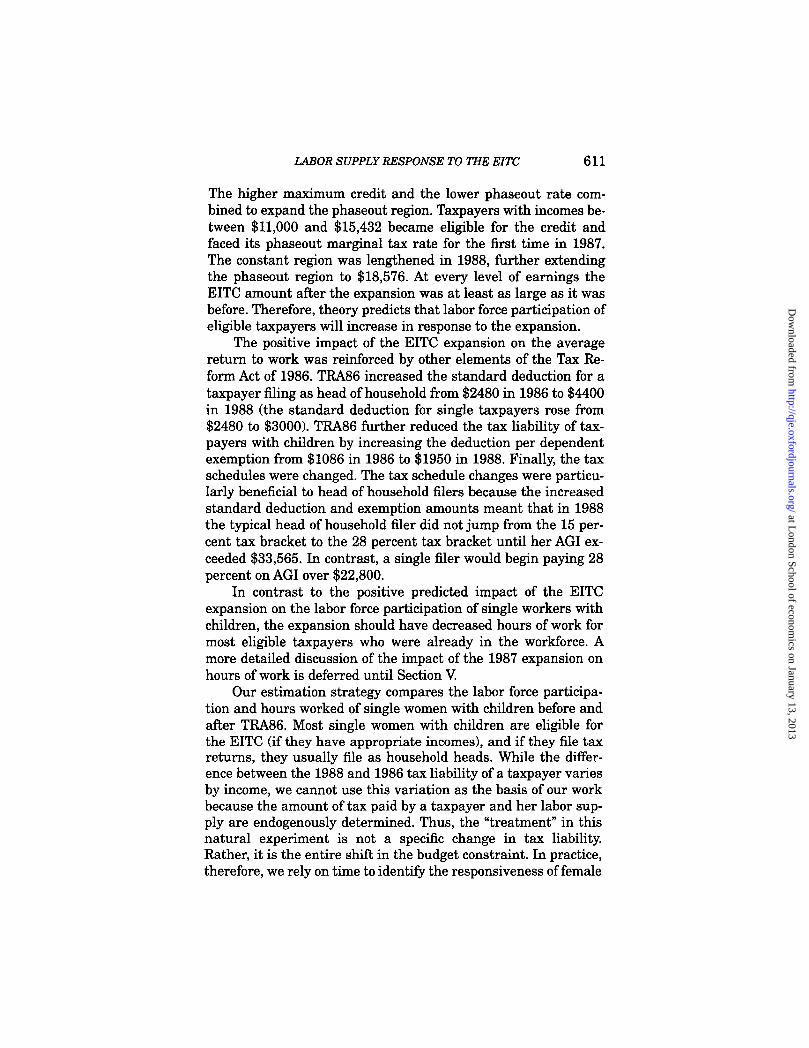
Figure I shows how the introduction of an EITC shifts the
5. Beginning in 1994, a small credit is available to low-income workers with-out children.
6. Before 1991 a taxpayer could claim the EITC only if he or she used a filingstatus of married filing jointly, head of household, or surviving spouse. A marriedtaxpayer could claim the EITC only if he or she claimed a dependent child on hisor her tax return, and the child lived with the taxpayer for more than six monthsduring the year. An unmarried taxpayer filing as head of household did not haveto claim the child as a dependent in order to be eligible for the EITC, but, in orderto file as head of household, the taxpayer must have paid more than half thecost of keeping up the home. Therefore, both married filers (through the rules forclaiming a dependent) and head of household filers were required to meet a sup-port test. AFDC payments are not considered support provided by the taxpayer.Consequently, a taxpayer with $6000 in AFDC income and $5000 in earned in-come was not eligible for the EITC under pre-1991 rules.
at London School of econom
ics on January 13, 2013http://qje.oxfordjournals.org/
budget constraint of an otherwise untaxed individual from ADEto ABCDE. Under the new budget constraint every choice ofhours (or equivalently pretax earnings) produces at least as muchafter-tax earnings (and utility) as it did before the earned incometax credit was introduced. The well-being of a taxpayer who doesnot work has not changed because no earned income tax credit isavailable to a taxpayer with zero earnings. Thus, any taxpayerwho preferred working before will still prefer working, and sometaxpayers may find that the additional after-tax income from theEITC makes it worth entering the labor force. The impact of theEITC on the labor force participation of unmarried taxpayers istherefore unambiguously positive.
The impact of introducing an EITC on the hours of work of ataxpayer already participating depends on which region of theEITC the taxpayer was in before the credit was introduced. For aworker in the phase-in, the effect on labor supply is theoreticallyambiguous: the credit subsidizes the worker's wage so that thesubstitution effect encourages additional hours while the incomeeffect causes hours to decrease. For a worker in the constant re-gion, there is only an income effect, reducing hours. In the phase-
at London School of econom
ics on January 13, 2013http://qje.oxfordjournals.org/
out region the EITC unambiguously reduces labor supply sincethere is both a negative substitution effect from the credit beingphased out and a negative income effect from the additional in-come the credit provides to the taxpayer. Beyond the credit re-gion, taxpayers may decide to reduce their hours of work andreceive the credit.
II. IDENTIFICATION STRATEGY
We study the labor supply response of single women withchildren to the 1987 expansion of the earned income tax credit,which occurred as part of the Tax Reform Act of 1986. We focuson single women with children because they are the largest groupof taxpayers eligible for the EITC, making up approximately 48percent of the EITC eligible population in the March 1992 CPS[Eissa and Liebman 1993]. In addition, they are the group mostrelevant for studying whether the EITC reduces welfare depen-dency. Finally, they are the group for which we can most plausiblyignore the joint labor supply decisions of other family members,and thus derive simple predictions from labor supply theory.? Westudy the 1987 expansion of the credit because it was the largestEITC expansion that was not phased in over a number of years.The incentives created by the 1987 expansion of the EITC werereinforced by other tax changes implemented after the Tax Re-form Act of 1986, making the relative impact on single womenwith children similar in size to the larger EITC expansions ofthe 1990s.
The 1987 expansion of the EITC increased the subsidy ratefor the phase-in of the credit from 11 percent to 14 percent andincreased the maximum income to which the subsidy rate wasapplied from $5000 to $6080. This resulted in an increase in themaximum credit from $550 to $851 ($788 in 1986 dollars). Thephaseout rate was reduced from 12.22 percent to 10 percent.
7. In a two-parent family the credit may reduce the probability of participa-tion for the secondary earner through an income effect. The overall effect on fam-ily labor supply will depend critically on the model of labor supply assumed tohold at the household level and on the distribution of earnings within the family.In 47 percent of married couples earning less than $25,000, the woman accountsfor at least 40 percent of the family's earnings (March 1993 CPS). Therefore, thecommon assumption that a family's marginal tax rate is determined by the male'searnings may not be appropriate for this population. Even for household heads,the simple model may not be sufficient. Edin and Jencks [1993] show that mostsingle mothers receiving AFDC also receive income from boyfriends and extendedfamily members, and often have unreported labor income.
at London School of econom
ics on January 13, 2013http://qje.oxfordjournals.org/
The higher maximum credit and the lower phaseout rate com-bined to expand the phaseout region. Taxpayers with incomes be-tween $11,000 and $15,432 became eligible for the credit andfaced its phaseout marginal tax rate for the first time in 1987.The constant region was lengthened in 1988, further extendingthe phaseout region to $18,576. At every level of earnings theEITC amount after the expansion was at least as large as it wasbefore. Therefore, theory predicts that labor force participation ofeligible taxpayers will increase in response to the expansion.
The positive impact of the EITC expansion on the averagereturn to work was reinforced by other elements of the Tax Re-form Act of 1986. TRA86 increased the standard deduction for ataxpayer filing as head of household from $2480 in 1986 to $4400in 1988 (the standard deduction for single taxpayers rose from$2480 to $3000). TRA86 further reduced the tax liability of tax-payers with children by increasing the deduction per dependentexemption from $1086 in 1986 to $1950 in 1988. Finally, the taxschedules were changed. The tax schedule changes were particu-larly beneficial to head of household filers because the increasedstandard deduction and exemption amounts meant that in 1988the typical head of household filer did not jump from the 15 per-cent tax bracket to the 28 percent tax bracket until her AGI ex-ceeded $33,565. In contrast, a single filer would begin paying 28percent on AGI over $22,800.
In contrast to the positive predicted impact of the EITCexpansion on the labor force participation of single workers withchildren, the expansion should have decreased hours of work formost eligible taxpayers who were already in the workforce. Amore detailed discussion of the impact of the 1987 expansion onhours of work is deferred until Section V.
Our estimation strategy compares the labor force participa-tion and hours worked of single women with children before andafter TRA86. Most single women with children are eligible forthe EITC (if they have appropriate incomes), and if they file taxreturns, they usually file as household heads. While the differ-ence between the 1988 and 1986 tax liability of a taxpayer variesby income, we cannot use this variation as the basis of our workbecause the amount of tax paid by a taxpayer and her labor sup-ply are endogenously determined. Thus, the "treatment" in thisnatural experiment is not a specific change in tax liability.Rather, it is the entire shift in the budget constraint. In practice,therefore, we rely on time to identify the responsiveness of female
at London School of econom
ics on January 13, 2013http://qje.oxfordjournals.org/
household heads to the EITC and the other aspects of TRA86.Since there may be underlying trends in participation or hours ofwork and there may be other policy or economic shocks that affectlabor market outcomes, we use control groups to allow us to iso-late the impact of TRA86 from other factors. A good control groupis similar in its characteristics to the treatment group andtherefore likely to respond similarly to the underlying trends orcontemporaneous shocks but does not receive the treatment.
As we explained earlier, eligibility for the EITC depends onthe presence of a child in the tax unit and on income being abovezero and below the level at which the credit is completely phasedout. The expansion of the EITC may, however, affect taxpayerswith incomes beyond the level at which the credit is completelyphased out since they might reduce their hours (and incomes)and take advantage of the increased credit. Therefore, we use allsingle women with children as our primary treatment group. 8 Weuse all single women without children as the control group. Thedifference between the change in labor force participation ofsingle women with children and the change of single womenwithout children is our estimate of the effect of TRA86 on partici-pation. This is essentially the difference-in-differences approach.It controls for any contemporaneous shocks to the labor forceparticipation of single women with children through the changein participation for the control group. The two identifying as-sumptions that we make are (1) there are no contemporaneousshocks (other than the tax changes) to the relative labor marketoutcomes of the treatment and the control groups over the periodof the reforms; and (2) there are no underlying trends in partici-pation or hours of work that differ between the two groups. 9
By including all single women with children in the treatment
8. We are assuming that the taxpayer's marital status and the presence ofchildren in the tax filing unit are exogenously determined. To test whether ourresults are sensitive to the assumption that fertility decisions are exogenous, wereestimated our basic model using as our treatment group only women who hada qualifying child over age five. Our results did not change.
9. Contamination of the treatment and control groups (which would bias ourresults toward zero) should not be a large problem in this application. We havechecked our allocation methodology using a CPS-IRS match described in Liebman[1995]. We find that 89 percent of women whom we allocate to the treatmentgroup and who file a tax return claim a dependent child on that tax return (80percent of treatment group filers, file as head of household). Ninety-five percentof women whom we allocate to the control group and who file a tax return, do notclaim a dependent child on that tax return (91 percent file as single). If misalloca-tion of individuals to the treatment group and control group happens at random,then these results imply that we should increase our labor-supply results by 19percent.
at London School of econom
ics on January 13, 2013http://qje.oxfordjournals.org/
group, we are including many taxpayers (those with high in-comes) who are unlikely to be affected by the EITC. It also in-creases the importance of the non-EITC aspects of TRA86, sincethose effects were larger at incomes beyond the phaseout of theEITC. In addition, the broad treatment group makes it difficultto find good control groups. To focus on the impact of the crediton low-income families, we use two alternative treatment groups.The first is single women with children and low levels of educa-tion, 1° and the second is single women with children whom wepredict (using exogenous characteristics such as age, race, state,and education) would have earned incomes making them eligiblefor the EITC. For each of these treatment groups, we use twocontrol groups: single women without children and with low lev-els of education (predicted income in the EITC range), and singlewomen with children and more than high school education (pre-dicted income above the EITC maximum income). The secondcontrol group is more similar to the treatment group on one di-mension—they have children but less similar on another: theyhave higher education levels (predicted income beyond the EITCrange).
The advantage of having multiple control groups is that ifwe find similar results, we can be more confident that we areestimating the actual effect of the tax reforms and not just theeffect of other contemporaneous changes or trend differences be-tween the control and treatment groups. Ultimately, then, thecredibility of our results lies in the consistency of our estimatesacross different treatment and control groups rather than on anyone estimate.
III. DATA
The data we use are from the 1985 to 1987 and 1989 to 1991March Current Population Surveys. The March CPS is an annualdemographic file of approximately 57,000 households. It includeslabor market and income information for the previous year, sothe data we have are for tax years 1984 to 1986 and 1988 to 1990.We exclude 1987, the first year after TRA86, to allow taxpayerstime to adjust their behavior.
The CPS contains information on households, families, and
10. We use two definitions of low education: less than twelve years of educa-tion and exactly twelve years of education.
at London School of econom
ics on January 13, 2013http://qje.oxfordjournals.org/
individuals. However, the relevant unit of analysis for this studyis the tax-filing unit. Our tax-filing units are based upon CPSfamilies. Therefore, subfamilies (both related and unrelated) areallocated to separate tax-filing units from the primary family. Weconsider any member of the tax-filing unit who is under the ageof 19 (or under 24 and a full-time student) to be a dependent childfor tax purposes. We do not impose the support test for depen-dents because the test includes factors, such as AFDC income,that are endogenous to labor supply decisions. In addition, wedo not have enough information to impose the EITC six-monthresidency test. Therefore, we assume that any taxpayer with achild under the age of 19 (or under 24 and a full-time student)meets both the dependent child and EITC child requirements.
The sample includes unmarried females (widowed, divorced,and never married) who are between 16 and 44 years old. Weexclude any female who is separated from her spouse during thereference period, or who was ill or disabled, or in school full timeduring the previous year. We also exclude any woman with nega-tive earned income (due to negative self-employment income),negative unearned income, or with positive earned income butzero hours of work. The resulting sample size, after pooling allsix years, is 67,097 observations.
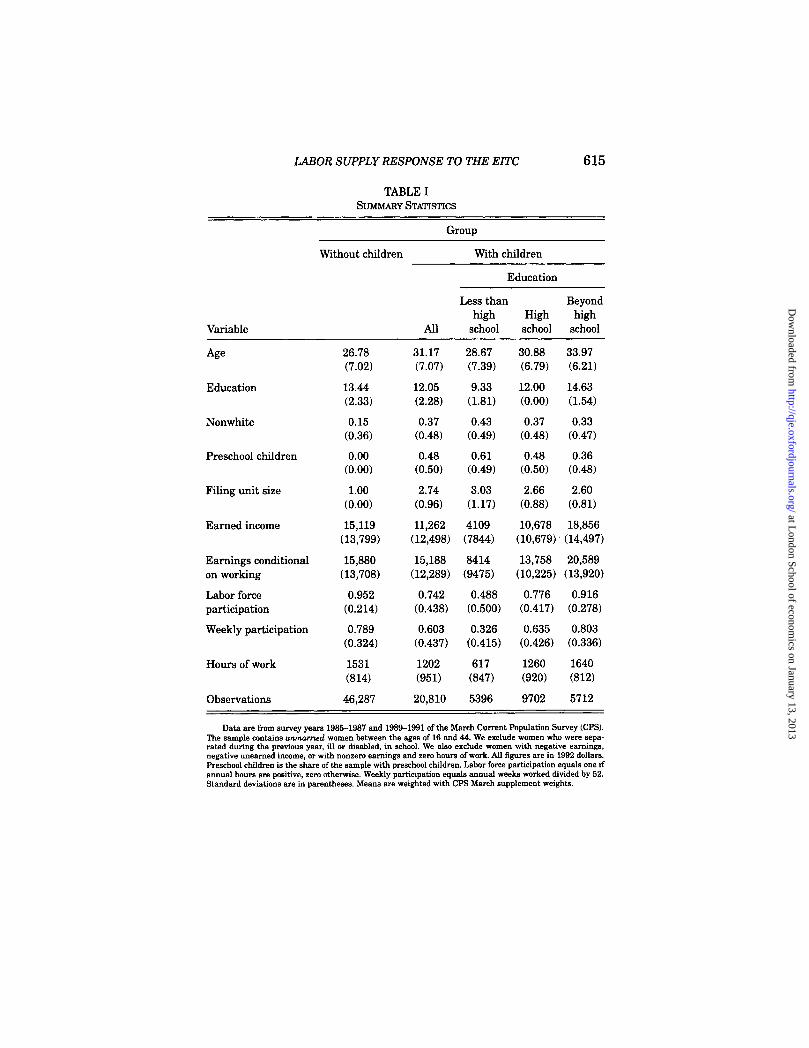
Table I presents summary statistics of the characteristics ofthe treatment and control groups. Column 1 presents the charac-teristics of all unmarried females without children (control); col-umn 2 presents characteristics of all unmarried females withchildren (treatment). There are some noticeable differences be-tween the two groups. Those who have children tend on averageto be older (31.17 versus 26.78 years), less educated (12.05 versus13.44 years of education), and less likely to have been in theworkforce at any time during the previous year (.74 versus .95probability of annual hours greater than zero). Average earningsfor women with children are less than earnings for those withoutchildren. Conditional on working, however, the two groups havesimilar mean earnings. In columns 3, 4, and 5, we present charac-teristics for women with children who have completed less thantwelve years of schooling, twelve years, and more than twelveyears, respectively. Again there appear to be systematic differ-ences between the attributes of the groups. The more educatedthe female head is, the more likely she is to be older, to have asmaller family, and to be a member of the labor force.
These summary statistics suggest that any raw differences
at London School of econom
ics on January 13, 2013http://qje.oxfordjournals.org/
Data are from survey years 1985-1987 and 1989-1991 of the March Current Population Survey (CPS).The sample contains unmarried women between the ages of 16 and 44. We exclude women who were sepa-rated during the previous year, ill or disabled, in school. We also exclude women with negative earnings,negative unearned income, or with nonzero earnings and zero hours of work. All figures are in 1992 dollars.Preschool children is the share of the sample with preschool children. Labor force participation equals one ifannual hours are positive, zero otherwise. Weekly participation equals annual weeks worked divided by 52.Standard deviations are in parentheses. Means are weighted with CPS March supplement weights.
at London School of econom
ics on January 13, 2013http://qje.oxfordjournals.org/
in labor market outcomes over time between the treatment andcontrol groups must be interpreted with caution, since the differ-ences could reflect nontax shocks that affect people with somecharacteristics differently from people with other characteristics.The methods used to control for demographic differences will becritical to our analysis. These results also confirm our earlierpoint that there is no ideal control group. Only if results are con-sistent across different specifications will we have strong evi-dence of a tax effect.
IV. EMPIRICAL RESULTS FOR LABOR FORCE PARTICIPATION
A. Basic Participation Results
Table II presents labor force participation rates for the treat-ment groups and control groups in the years before and after theTax Reform Act of 1986. We define labor force participation asworking a positive number of hours during the year. We use thisdefinition of labor force participation because it is the one forwhich the predicted impact of the EITC is unambiguous. In eachpanel the first column corresponds to the average participationrate prior to TRA86; the second column to the average afterTRA86; and the third column to the change in participation. Thedifference-in-differences estimate of the participation response isin the last column. Panel A presents the results for the first treat-ment group (all unmarried females with children) and controlgroup (all unmarried females without children). The participa-tion rate of the treatment group increased by a statistically sig-nificant 2.4 percentage points (from 72.9 percent to 75.3 percent).There was no change in labor force participation for unmarriedwomen without children. The fact that the participation rate ofthe control group did not change is important, because it suggeststhat there is not much of an aggregate effect of which to takeaccount. We would be concerned if there were substantialchanges in the participation rate for the control group, because,in that case, our difference-in-differences estimator would dependheavily on the quality of the control group. Our first estimate ofthe participation response then is 2.4 percentage points, with astandard error of 0.6.
To further examine whether it was the EITC that caused theparticipation rate of female household heads to rise, we next fo-cus on the subset of females with children who were most likely
at London School of econom
ics on January 13, 2013http://qje.oxfordjournals.org/
to be affected by an increase in the EITC: those with low educa-tion levels. Panel B presents participation rates for women withchildren and less than high school education, compared withwomen with the same level of education and no children, and alsocompared with more educated women with children. Panel C re-peats the exercise for individuals with exactly twelve years of ed-ucation. The participation rate before TRA86 was 47.9 percentfor women with children and less than a high school education,compared with 78.4 percent for women without children and lessthan a high school education, and 91.1 percent for women withchildren and more than a high school education. After TRA86there is an increase in the participation rate of 1.8 percentagepoints (from 47.9 percent to 49.7 percent) for the "less than highschool" treatment group. There is a 2.3 percentage point drop inthe participation rate of the first control group (females with lessthan high school education and no children). Taken together,these figures suggest a participation response of 4.1 percentagepoints. The second control group, females with children and morethan high school education, has a small increase in participationof 0.9 percentage points, producing a difference-in-differences es-timate that is also 0.9. Since many single women with childrenand more than high school education are eligible for the EITCand therefore are likely to be affected by its increase, it is notsurprising that the second control group produces a smaller esti-mate of the treatment effect than the first control group. For the"high school" treatment group, shown in Panel C of Table II, thecorresponding range of estimates is 1.4 to 2.5 percentage points."
These results suggest that the labor force participation of un-married heads of households increased following the Tax ReformAct of 1986. We do not observe a similar increase in the controlgroups. We observe larger percentage point responses among fe-male heads with twelve or fewer years of schooling than amongwomen with more education. This is encouraging since they arethe most likely to be affected by the EITC. 12
11. Because the level of participation for the treatment group differs fromthe level for the control group, the tax effect could be sensitive to the way inwhich we define the participation change. For example, we could find a greaterpercentage point increase in participation for the treatment group than for thecontrol group, while finding a smaller percent reduction in nonparticipation. Be-cause all of the without children control groups have either zero or negativechanges in participation, our main qualitative results are not sensitive to thespecification of the participation effect. However, our results comparing womenwith children and different levels of education are sensitive to the measurechosen.
12. Since the participation rate of the control group is so high (95 percent),a potential concern is that there is not much scope for the rate to rise after TRA86.
at London School of econom
ics on January 13, 2013http://qje.oxfordjournals.org/
Because the treatment and the control groups differ in demo-graphic characteristics, the observed differences in participationoutcomes may reflect underlying differences between the treat-ment and control groups rather than a treatment effect. Control-ling for demographic characteristics in a difference-in-differencesapproach is important if the composition of the treatment or con-trol groups changes over time and some demographic characteris-tics are correlated with the dependent variable. In addition,controlling for demographic characteristics reduces the residualvariance of the regression and produces more efficient estimates.Finally, by interacting demographic characteristics with a timedummy, we are able to reduce the chance that unknown shocksthat differentially affect people with different characteristics areproducing a false treatment effect.
We estimate the probit equation:
(1) P(lfpit = 1) = 1(a + r3Z„ + -yotreatmenti
+ Fy ipost86, + lidtreatment x post86)id,
where lfp is a dummy equal to one if a woman reported workingat least one hour during the previous year. In our basic specifica-tion, Zit is a vector that includes unearned income, number ofchildren, family size, number of preschool children, age and itssquare and cube, education and its square, and a dummy variablefor race ( =1 if nonwhite). Z it also includes year dummies for 1984,1985, 1989, and 1990. These variables control for observable dif-ferences in the characteristics of the treatment and control groupthat affect the level of labor force participation. Unobservable dif-ferences are controlled for by the variable, treatment, which isequal to one for any woman who has a child in her subfamily (andis therefore eligible for the EITC and likely to file as a householdhead). We expect -yo to be negative if women with children have
The evidence using the less than high school control group (with a participationrate of 78 percent) provides some reassurance on this point. In addition, we exam-ined two other potential control groups: low-educated married women withoutchildren and low-educated single men without children. The labor force participa-tion of the married women increased by 0.2 percent, from 83.9 to 84.1 percent,after TRA86, providing further evidence that the 2.3 percent increase observedfor single women with children is larger than that observed for other groups inthe economy. The labor force participation of single men rose from 93.5 percent of94.5 percent. We take this as evidence that our methodology would have beencapable of observing an increase in labor force participation by single womenwithout children if one had occurred, even though they started from a high levelof participation.
at London School of econom
ics on January 13, 2013http://qje.oxfordjournals.org/
lower participation rates than their counterparts without chil-dren, even after controlling for other observable demographiccharacteristics. post86 is a dummy equal to one for any tax yearafter 1986. ey, therefore reflects the average change in labor forceparticipation for both treatment and control groups between 1986and 1988, the omitted year-dummies in the regression.
A test of the impact of TRA86 is a test that eligible, unmar-ried women with children increased their participation after 1987relative to unmarried women in the control group. It is a test that
the coefficient on the interaction term between post86 andtreatment, is greater than zero. Thus, our hypothesis tests areone-tailed tests (the ninety-fifth percentile of the t-distributionis 1.64).
Table III presents results in which we use the presence ofchildren as our measure of eligibility for the EITC and the headof household filing status (kids replaces treatment in equation(1)). The sample is all unmarried women. The first column ex-cludes demographic characteristics, while the second column in-cludes them. The estimated coefficients on the four year dummies(not reported) and post86 (y) are small in magnitude and insig-nificant in both columns, suggesting that there is no overall trendin average participation for the two groups. The coefficient onkids ('yo) changes dramatically once demographic characteristicsare included: from —1.053 to —0.250. This result should not besurprising since females with children have different attributesthan women without children. The fact that iy o remains signifi-cant even after controlling for observable characteristics suggeststhat having a child reduces labor force participation even control-ling for observable demographic variables or that there are unob-servable differences across the two • groups. In spite of thesedifferences, however, the treatment effect ('y2) changes little whenwe include demographic characteristics as regressors: it risesfrom 0.069 to 0.074 (with a standard error of .030). This resultsuggests that any changes in the demographic composition of thetreatment and control groups that occurred over time are uncor-related with the treatment. The coefficients on the other demo-graphic characteristics all have the expected signs. Females withunearned income have lower probabilities of participation, as dofemales with preschool children. Older women have lower proba-bilities of participation, as a cohort effect would predict. Finally,educated women are more likely to be in the labor force than less
at London School of econom
ics on January 13, 2013http://qje.oxfordjournals.org/
educated women (the quadratic term dominates the linear termfor years of schooling of two or more).
The probit is a nonlinear model; therefore, the coefficientscannot be used directly as marginal effects. Since the treatmenteffect variable (kids x post86 interaction) is discrete, we calculatethe effect of the TRA86 by predicting two probabilities of partici-pation, one with the interaction variable set equal to one and theother with the interaction term set equal to zero. The treatmenteffect is the average (over the sample of post-1987 women withchildren) of the difference in the two probabilities of participa-tion. The last row in Table III presents estimates of the treatmenteffect. In column (2) we find that female heads had a 1.9 percent-age point higher probability of participating in the workforce asa result of the combined impact of the expansion of the earnedincome tax credit and the other TRA86 reductions in tax liabilityfor single women with children. The standard error on this esti-mate is 0.8 percentage points. 13
C. Alternative Explanations
The basic finding from both the participation means and theregressions that the relative labor force participation of singlewomen with children increased in the years after 1987 is consis-tent with TRA86 having a positive impact on labor force partici-pation. However, there are a number of alternative explanationsfor this finding that need to be examined before we conclude thatTRA86 is the most likely explanation for the increase in laborforce participation.
Labor force participation rates for all women increased from37.1 percent in 1959 to 57.4 percent in 1989. If long-run trends inlabor force participation differ between females with and withoutchildren, then we risk interpreting preexisting differences in la-bor supply patterns as treatment effects. The top panel of FigureII shows the labor force participation rate for all unmarried fe-males, aged 16 to 44, between 1981 and 1992. We present sepa-rate trends for women with and without children. The labor forceparticipation rate for women without children does not appear tobe trending either upward or downward during this period. Theparticipation rate for women with children seems to be somewhatmore sensitive to the business cycle. There also appears to be an
13. We use the delta method to calculate the standard errors.
at London School of econom
ics on January 13, 2013http://qje.oxfordjournals.org/
increase in labor force participation after 1986 for women withchildren, while the rate for women without children trends up-ward only slightly. The bottom panel of Figure II shows the sametrends for women with less than high school education. Onceagain, there is no evidence that the two groups have differentlong-run trends.
In order to rigorously check these visual impressions, we es-timated a probit regression of labor force participation on thir-teen year dummies, a dummy for children, and interactions of thechildren and year dummies. To control for changes over time inthe demographic composition of the sample, we also included allthe demographic variables from column (2) of Table III. The mar-ginal effects of the interaction variables represent annual devi-ations from the average difference in participation betweenfemales with children and females without children. These mar-ginal effects and the maximum EITC are plotted in the top panelof Figure III for all women and in the bottom panel of Figure IIIfor women with less than high school education. The two figuresshow quite clearly that the difference in participation rates be-tween females with children and females without children de-clines (the coefficients become less negative) following the 1987increase in the maximum credit. The participation rate differenceseems to track the maximum EITC quite closely with a one- ortwo-year lag. It seems safe to conclude that the response esti-mated for the 1987 expansion does not reflect differing trends inthe labor force participation of females with children and femaleswithout children. Indeed, the long-run evidence seems to confirmthe conclusion that the relative labor force participation ofwomen with children increased after 1986.
Another possible explanation for our finding that the relativelabor force participation of single women with children increasedafter 1987 is that some other change occurred in the economicenvironment which affected women with children differentlythan women without children. Likely candidates are changes instate AFDC benefits, business cycle fluctuations, or unknownshocks that affect people with different demographic characteris-tics differently. While there was little change in national averageAFDC benefits over our period of analysis, there was some cross-state variation in real benefits. For example, between 1986 and1988, the maximum monthly benefit for a woman with two chil-dren increased from $430 to $503 (1992 dollars) in New Hamp-shire, and from $505 to $577 in Massachusetts. In New York, on
at London School of econom
ics on January 13, 2013http://qje.oxfordjournals.org/
Less Than High SchoolParticipation Rate Deviations
1983 1985 1987 1989 1991
626
1992 Dollars1400
1200
1000 —
800 —
600
400
200
QUARTERLY JOURNAL OF ECONOMICS
All Unmarried Females
Maximum EITC
Participation Rate Deviations0.01
(0.04)
(0.01)
— (0.02)
— (0.03)
cl i ji III i i
1981 1983 1985 1987 1989 1991
FIGURE IIIMaximum EITC and Marginal Effects from KID x YEAR Dummies
the other hand, the maximum benefit fell from $533 to $495, andin California it fell from $638 to $606. The business cycle couldbe driving our results if there is a difference between singlewomen with and without children in the sensitivity of their labor
at London School of econom
ics on January 13, 2013http://qje.oxfordjournals.org/
force participation to macroeconomic shocks. Between 1986 and1988 the national unemployment rate for females fell by 1.8 per-centage points, from 7.1 to 5.3 percent. Since both a reduction inthe unemployment rate and an increase in the EITC should in-crease labor force participation, it is not possible to isolate theeffects of the credit from the effects of the business cycle usingthe national unemployment rate. However, research has shownthat the employment and earnings status of less educated,younger workers is closely related to state and local labor marketconditions [Bartik 1991; Freeman 1991]. Therefore, we use stateunemployment rates to purge the effects of general business cyclemovements from our treatment effects. Finally, it is possible thatthe measured EITC response is the result of unknown shocksthat are correlated with demographic characteristics that differbetween the treatment group and the control groups. For ex-ample, nonwhite women may have been induced to enter the la-bor force during this period for reasons other than TRA86. Wehave no good story for why this might have happened, perhaps ashock to tastes for work, or perhaps changes in incentives thatwe have not captured. In any case, since unmarried women withchildren are more than twice as likely to be nonwhite than areunmarried women without children (37 percent versus 15 per-cent), such shocks could explain our results. To address these con-cerns, we include interaction terms between the time dummy andage and race.
Columns (3) and (4) of Table III display results includingstate AFDC benefits, state unemployment rates, and the inter-actions between demographic characteristics and time. The un-employment rate is negatively correlated with labor forceparticipation as is the level of monthly AFDC benefits. Surpris-ingly, the interaction between the unemployment rate and kids ispositive, suggesting that women with children are less sensitiveto the business cycle. The treatment effect, kids x post86, risesafter controlling for the alternative explanations. The predictedparticipation response increases from 1.9 percentage points incolumn (2) to 2.6 percentage points in column (3). When statedummies are added in column (4), the estimated response in-creases further to 2.8 percentage points. Thus, it does not appearthat the alternative explanations we have considered here canaccount for the relative increase in participation that we observefollowing TRA86.
at London School of econom
ics on January 13, 2013http://qje.oxfordjournals.org/
Three other pieces of evidence increase the likelihood thatthe observed effect was due to the EITC and not to other parts ofTRA86 or other government policies. First, the increase in par-ticipation is mostly a response to the return to the first child inthe tax unit. In the period we study, the amount of EITC a tax-payer received depended only on having a child. No additionalbenefit accrued from having only one child. Similarly, the advan-tages of the head of household filing status come from the initialchild. In contrast, additional dependent exemptions are availablefor each additional child. Thus, if families with multiple childrenwere more likely to increase their labor force participation thanfamilies with more than one child, then this part of the responsewas due to the expansion of the dependent exemption and not tothe EITC. To disentangle the EITC and head of household effectfrom the dependent exemption effect, we estimate a regression inwhich we interact a second child dummy with the post86 dummy.Column (5) of Table III shows that after including the second-child effect, there is still a 2.2 percentage point effect attributableto the first child.
Second, the timing of the post-1987 participation increase isconsistent with the result being due to the increase in the EITC.The top panel of Figure III indicates that there was little relativeincrease in participation by women with children until 1989. Thebottom panel indicates that for women with less than high schooleducation, there was some increase in 1988, but most of the in-crease occurred in 1989. Column (6) of Table III estimates themagnitude of the individual year effects. By 1988 single womenwith children had increased their relative labor supply by only0.8 percentage points, but in 1989 and 1990 the impact reached2.9 percentage points. This timing is consistent with the responsebeing due to the increase in the EITC. Most EITC recipientswould have first become aware of the increase around April of1988 when they received their 1987 tax refund. Assuming that ittakes some time to adjust to new incentives, we would expect tohave seen a limited response in 1988, and a full response in 1989.Other aspects of TRA86 appeared in weekly paychecks during1987 and would be expected to have provoked a more rapid re-sponse. The finding that most of the increase in relative partici-pation rates occurred in 1989 is evidence that the increase wasnot caused by the Family Support Act of 1988. States were not
at London School of econom
ics on January 13, 2013http://qje.oxfordjournals.org/
required to implement many of the key provisions of the FamilySupport Act until mid-1990 [Committee on Ways and Means1994], so we would have expected it to have had a larger impactin 1990 than in 1989. 14
The third piece of evidence that the effect we observe is dueto the EITC is that it had its largest effect among people mostlikely to be eligible for the credit. Columns (1) through (3) of TableIV present results with the sample separated by years of educa-tion. The specification is the same as column (5) of Table III. Thepredicted participation response is 6.1 percentage points for theless than high school sample, 2.6 percentage points for the highschool sample, and only 0.4 percentage points for the beyond highschool sample. 15 When we separate the sample by predicted in-come region, we obtain similar results. 16 The 86 percent of thesample whom we predict to have earnings in the EITC rangehave a predicted participation response of 3.6 percentage points,while the predicted high-income individuals have a participationresponse of —0.7 percentage points.
V. THE IMPACT OF THE EITC ON HOURS WORKED
A. Basic Hours Results
The results presented in the previous section show that therelative labor force participation of single women with childrenincreased following TRA86 and suggest that the EITC could havebeen the cause of this participation increase. However, the EITCexpansion is predicted to have reduced the hours worked by manysingle women with children already in the labor force. Thus, thetotal impact of the EITC on hours worked is theoreticallyambiguous.
14. Some states expanded Medicaid access for families with small childrenduring the years studied in this paper [Yelowitz 1995]. As we explained in footnote8, restricting our sample to families with children over five years of age does notchange our results, so these Medicaid expansions cannot be the source of ourfindings.
15. A difference-in-differences regression of less than high school versusmore than high school, women with children versus women without children, andpre-1986 versus post-1986 (using the same covariates as in Table IV) generates apredicted participation response of 10.6 percentage points.
16. Since the low education groups do not correspond exactly to the EITCeligible population, we estimate an earnings equation using the sample of earnersprior to 1987. We estimated an OLS regression of earnings on family size, numberof preschool children, the state unemployment rate, and 28 age dummies, 10 edu-cation dummies, 2 year dummies, and 1 race dummy. Using the estimated coeffi-cients and individual characteristics, we predict earned income for each womanin the sample.
at London School of econom
ics on January 13, 2013http://qje.oxfordjournals.org/
Figure IV displays the 1986 and 1988 earned income taxcredits (in 1992 dollars) as functions of income. The predicted im-pact of the EITC expansion on hours of work depends on the tax-payer's income. For most workers in region A (incomes between$0 and $14,081), the EITC expansion is predicted to have an am-biguous impact on hours of work since the expansion had off-setting income and substitution effects. Workers in region B(incomes between $14,081 and $25,000) are predicted to reducetheir hours of work because they are either in the expandedphaseout region and face a 10 percent higher marginal tax rate inaddition to having their incomes increased or because they haveincomes just beyond the expanded phase-in region and might re-duce their hours of work to take advantage of the credit. Workersin region C (incomes above $25,000) are unlikely to be affected bythe increase in the credit. 17
17. The TRA86 tax rate changes reinforced the effect of the EITC on thehours of work of household heads relative to single filers. TRA86 reduced mar-ginal tax rates by between three and eight percentage points for most single tax-payers with incomes in the EITC phaseout range, while reducing marginal taxrates for household heads by only two to three percentage points. Thus, the sub-stitution effect from TRA86 should cause a larger increase in hours from singletaxpayers than from household heads. In addition, as we explained in the partici-pation section, the new TRA86 brackets, through their interaction with the in-
at London School of econom
ics on January 13, 2013http://qje.oxfordjournals.org/
To examine how the EITC expansion affected hours condi-tional on working and total hours, we estimate OLS regressionsthat are similar to the probits that we used in Section IV. Thus,we estimate
(2) Annual Hours„= a + 13Z,, + 'yokids, + fy ipost86, + 'y 2(kids X post86)„+ sit'
where Z is a vector of demographic variables (with all the vari-ables from the specification in column (5) of Table III), kids equalsone for unmarried women with children, and the key coefficientis 'y2, the coefficient on the kids x post86 interaction. When weexamine the distribution of hours conditional on hours exceedingzero, we are implicitly assuming that any EITC-caused increasein participation in the post-1987 period did not alter the hoursdistribution. We choose not to impose a selection model on thedata for two reasons. First, to identify a selection model, wewould need a policy shift that affects participation separatelyfrom hours of work. TRA86 does not provide us with such a shift.Therefore, any attempt to estimate a selection model would beheavily dependent on the specification chosen. Second, recent re-search suggests that inferences in labor supply models are ex-tremely sensitive to the model chosen [Mroz 1987; Zabel 1993].Our failure to account for new participants should bias upwardour estimates of the reduction in hours due to the EITC (i.e.,make them less negative). New participants are likely to enterthe labor force with earnings and hours below what we predictfrom their exogenous characteristics. This will occur if unob-served factors (such as a greater taste for leisure) that explaintheir nonparticipation compared with others with the same ex-ogenous characteristics also cause them to choose fewer hours ofwork.
In column (1) of Table V the coefficient on the interactionterm is 25.22 (with a standard error of 15.18), suggesting thatcontrary to the predictions of theory, women with children in-creased their relative hours conditional on working by a smallamount. In column (2) the sample is restricted to women withless than high school education. Here there is essentially nochange in relative hours for single women with children. Further
creased dependent exemptions and standard deductions, reduced tax liability bymore for head of household filers than for single filers. Thus, the tax bracket in-come effect works in the same direction as the EITC increase, and hours of workby household heads should fall relative to hours of work of single taxpayers.
at London School of econom
ics on January 13, 2013http://qje.oxfordjournals.org/
results, separating the sample into predicted income regions, findno evidence that the expansion of the phaseout region reducedhours of work for EITC eligible women [Eissa and Liebman1995].
When we include the participation effect and look at totalhours, the interaction coefficient increases from 25.22 to 37.37 forall women and from 2.98 to 83.83 for women with less than highschool education. The 81-hour increase for the less than highschool educated single women with children is consistent withour earlier finding that the participation rate for this populationincreased by 6.1 percentage points. Multiplying the increase inparticipation by average hours conditional on working for the lessthan high school population (1264) results in a total increase inhours of 77, quite close to the result from the total hours regres-sion. Results for weeks worked, presented in columns (5) and (6)convey a similar story. There was little change in the conditionaldistribution of weeks worked after TRA86, and there was a largerincrease in unconditional weeks worked.
B. Why Do We Observe a Participation Effect But No HoursEffect?
Economic theory suggests that the 1987 expansion of theEITC should have increased labor force participation and reducedthe hours worked by EITC recipients who were already working.Our finding that the expansion did indeed increase labor forceparticipation, but did not reduce hours worked is somewhatpuzzling. We offer four explanations.
First, it is common for studies of labor supply to find thatlabor force participation responds more than hours of work to achange in the net wage [Mroz 1987; Zabel 1993; Triest 1992]. Sec-ond, there is strong evidence that many EITC recipients do notknow that they receive the credit, and that even those who areaware of it do not understand how it works. 18 Taxpayers do nothave to know about or understand the EITC for it to affect theirlabor force participation, they only have to perceive that they arebetter off while working than they were on welfare. Since almost
18. Interviews we conducted during August 1993 in Cambridge, Massachu-setts, among potential recipients suggested virtually no awareness of the credit(see Eissa and Liebman [1993] for details). This observation was confirmed by theexperience of one author (Liebman) as an IRS VITA volunteer in March and April1994, which revealed that even past recipients were often unaware of the credit.More extensive interviews conducted in Chicago and described in Olson and Davis[1994] similarly found low awareness and understanding of the credit.
at London School of econom
ics on January 13, 2013http://qje.oxfordjournals.org/
all recipients of the EITC receive the credit in a single paymentas part of their annual tax refund check and not as part of theirweekly paychecks, it is possible that recipients perceive it as alump sum benefit. In this case the EITC would be predicted tohave a positive impact on labor force participation, but only asmall negative impact on hours worked via the income effect.Third, it is easier to measure participation than hours worked. Ifworkers report round numbers for hours worked, it will take alarge change in hours before the change is noticeable in the data.Fourth, since we observe both participation and hours of workincreasing for single women with children relative to singlewomen without children, it is possible that some unknown posi-tive shock can explain our findings.
VI. CONCLUSION
The 1987 expansion of the EITC and other aspects of the TaxReform Act of 1986 reduced the relative tax liabilities of EITC-eligible household heads by up to $1186 (1992 dollars). We esti-mate that this expansion increased labor force participationamong all single women with children by up to 2.8 percentagepoints, from 73.0 to 75.8 percent. Among single women with chil-dren and less than high school education, the impact was evengreater-6.1 percentage points. While there are a number of pos-sible explanations for this evidence, we find the combined impactof the 1987 expansion of the EITC and the other provisions ofTRA86 to be the most convincing explanation.
Between 1990 and 1996 the maximum earned income taxcredit increased from $1023 to $3200 (1992 dollars) for a familywith two children. Since our methodology did not allow us to esti-mate the underlying preference parameters of our sample, wecannot make precise predictions of the participation response tothe more recent expansions. Our evidence suggests, however,that the recent expansions of the EITC will increase participationby female household heads. There may be decreasing returns toEITC expansions, however, if the nonparticipating population re-maining after each increase is farther from the participation-nonparticipation margin.
When we apply our same methodology to hours of work, wefind no evidence that the expansion of the EITC decreased hoursof work for people already in the labor force. While our findingthat the 1987 expansion of the EITC did not decrease hours of
at London School of econom
ics on January 13, 2013http://qje.oxfordjournals.org/
work is encouraging, we think it will be important to reexaminethis issue as the EITC expands. Awareness of the EITC is likelyto increase as the maximum credit triples, and this could resultin a greater sensitivity to the marginal tax rate imposed by thephaseout of the credit. In addition, since the lump sum paymentof the EITC may explain the lack of hours responsiveness, itwould be unwise to apply these results to other increases in mar-ginal tax rates that operate through regular payroll deductions.
One final point is in order. A full evaluation of a transfer pro-gram like the EITC requires more than just an estimate of thedistortionary impact of the program on the labor supply of trans-fer recipients. It also requires information on the value of theadditional income received by program beneficiaries as well asthe change in the amount of leisure that they consume. This mustbe balanced against the net income lost by taxpayers and the as-sociated deadweight losses. Since both the welfare payments andthe taxes involve deadweight losses, the desirability of the pro-gram depends on the weights assigned to changes in income atdifferent income levels. A full comparison among alternative taxand transfer systems would also evaluate the technology of com-pliance and administration [Slemrod 1990]. This is particularlytrue in the case of the EITC where the tax system is performingfunctions that have traditionally been the responsibility of thewelfare system [Alstott 1995].
Ultimately, the earned income tax credit is an income trans-fer program. Compared with other elements of the welfare sys-tem, the EITC appears to produce little distortion of workincentives. Therefore, if policy-makers want to redistribute in-come to the working poor and are comfortable with the trade-offsinvolved in using the tax system rather than the welfare systemto administer transfers, the EITC seems to be a way to do so withminimal efficiency costs.
UNIVERSITY OF CALIFORNIA AT BERKELEY, AND NATIONAL BUREAU OF ECONOMICRESEARCHHARVARD UNIVERSITY
REFERENCESAlstott, Anne L., "The Earned Income Tax Credit and the Oversimplified Promise
of Tax-based Welfare Reform," Harvard Law Review, CVIII (1995), 533-92.Bartik, Timothy J., Who Benefits from State and Local Economic Development
Policies? (Kalamazoo, MI: Upjohn Institute for Employment Research, 1991).Browning, Edgar K., "Effects of the Earned Income Tax Credit on Income and
Welfare," National Tax Journal, XLVIII (1995), 23-43.
at London School of econom
ics on January 13, 2013http://qje.oxfordjournals.org/
Committee on Ways and Means, U. S. House of Representatives, Overview of En-titlement Programs (Green Book) (Washington, DC: Government Printing Of-fice, 1994).
Danziger, Sheldon, Robert Haveman, and Robert Plotnick, "How Income Trans-fers Affect Work, Savings, and the Income Distribution: A Critical Review,"Journal of Economic Literature, XIX (1981), 975-1028.
Dickert, Stacy, Scott Houser, and John Karl Scholz, "Taxes and the Poor: A Micro-simulation Study of Implicit and Explicit Taxes," National Tax Journal,XLVII (1994), 76-97.
Dickert, Stacy, Scott Houser, and John Karl Scholz, "The Earned Income TaxCredit and Transfer Programs: A Study of Labor Market and Program Partici-pation," Tax Policy and the Economy, IX (1995), 1-50.
Edin, Kathryn, and Christopher Jencks, "Reforming Welfare," in ChristopherJencks, Rethinking Social Policy: Race, Poverty and the Underclass (Cam-bridge, MA: Harvard University Press, 1993).
Eissa, Nada, and Jeffrey B. Liebman, "The End of Welfare as We Know It? Behav-ioral Responses to the Earned Income Tax Credit," Harvard University,mimeo. 1993.
Eissa, Nada, and Jeffrey B. Liebman, "Labor Supply Response to the Earned In-come Tax Credit," NBER Working Paper No. 5158,1995.
Fraker, Thomas, Robert Moffitt, and Douglas Wolf, "Effective Tax Rates andGuarantees in the AFDC Program, 1967-1982," Journal of Human Re-sources, XX (1985), 251-63.
Freeman, Richard B., "Employment and Earnings of Disadvantaged Young Menin a Labor Shortage Economy, in Christopher Jencks and Paul E. Peterson,eds., The Urban Underclass (Washington, DC: Brookings Institution, 1991).
General Accounting Office, Earned Income Tax Credit: Design and AdministrationCould Be Improved (Washington, DC: GAO, 1993).
Giannarelli, Linda, and Eugene Steuerle, "It's Not What You Make, It's What YouKeep: Tax Rates Faced by AFDC Recipients," paper presented at the Associa-tion for Public Policy Analysis and Management Annual Research Confer-ence, Chicago, October 25,1994.
Hoffman, Saul D., and Laurence Seidman, The Earned Income Tax Credit: Anti-poverty Effectiveness and Labor Market Effects (Kalamazoo, MI: Upjohn Insti-tute for Einployment Research, 1990).
Holtzblatt, Janet, Janet McCubbin, and Robert Gillette, "Promoting Workthrough the EITC," mimeo, U. S. Department of the Treasury, June 4,1994.
Internal Revenue Serivce, Statistics of Income-1992 Individual Income Tax Re-turns (Washington, DC: Department of the Treasury, 1995).
Liebman, Jeffrey B., "Who Are the Ineligible EITC Recipients?" Harvard Univer-sity, mimeo, September 1995.
Moffitt, Robert, "Incentive Effects of the U. S. Welfare System," Journal of Eco-nomic Literature, XXX (1992), 1-61.
Mroz, Thomas A., "The Sensitivity of an Empirical Model of Married Women'sHours of Work to Economic and Statistical Assumptions," Econometrica, LV(1987), 765-99.
Olson, Lynn M., and Audrey Davis, "The Earned Income Tax Credit: Views fromthe Street Level," Working Paper Series, Center for Urban Affairs and PolicyResearch, Northwestern University, March 1994.
Slemrod, Joel, "Optimal Taxation and Optimal Tax Systems," Journal of Eco-nomic Perspectives, IV (1990), 157-78.
Triest, Robert K., "The Effect of Income Taxation on Labor Supply in the UnitedStates," Journal of Human Resources, XXV (1992), 491-516. , "The Efficiency Cost of Increased Progressivity," NBER Working Paper
No. 4535,1993.Yelowitz, Aaron, "The Medicaid Notch, Labor Supply and Welfare Participation:
Evidence from Eligibility Expansions," Quarterly Journal of Economics, CX(1995), 909-40.
Zabel, Jeffrey E., "The Relationship between Hours of Work and Labor Force Par-ticipation in Four Models of Labor Supply Behavior," Journal of Labor Eco-nomics, XI (1993), 387-416.
at London School of econom
ics on January 13, 2013http://qje.oxfordjournals.org/