Page 1
Available Online through
www.ijpbs.com (or) www.ijpbsonline.com IJPBS |Volume 4| Issue 2|APR-JUN|2014|151-161
Research Article
Pharmaceutical Sciences
International Journal of Pharmacy and Biological Sciences (e-ISSN: 2230-7605)
Rajendraprasad Muppavarapu* et al Int J Pharm Bio Sci www.ijpbs.com or www.ijpbsonline.com
Pag
e15
1
LC-MS/MS METHOD FOR THE SIMULTANEOUS DETERMINATION OF
DESLORATADINE AND ITS METABOLITE 3-HYDROXY DESLORATADINE
IN HUMAN PLASMA
Rajendraprasad Muppavarapu*1,2,3, Swati Guttikar2, Kannan Kamarajan3 1Jeevan Scientific Technology Limited, Hyderabad-500033, India
2Bioanalytical Research Department, Veeda Clinical Research, Ahmedabad-380015, India
3Department of Pharmacy, Annamali University, Annamali Nagar- 608002, India
*Corresponding Author Email: [email protected]
ABSTRACT An accurate and highly sensitive LC-tandeem mass spectrometric method has been developed and validated for
the quantification of desloratadine and its metabolite 3-hydroxy desloratadine according to regulatory guidelines.
Following liquid–liquid extration analytes and internal standards (ISs) were extracted from K3EDTA human plasma.
Chromatographic separation was achieved on Kromasil C18column (150mm x 4.6mm I.D, 5µm particle size) using a
mixture of Methanol: Acetonitrile (60:40V/V): 10mM Ammonium formate, (70:30V/V) as the mobile phase at an
isocratic flow rate of 1.0 mL/min. The precursor and product ion transitions monitored in multiple reaction
monitoring (MRM) mode via turbo ion spray source operating at positive mode. The mass transitions of
desloratadine, 3-hydroxy desloratadine and their internal standards desloratadine-D4, 3-Hydroxy desloratadine-D4
were m/z 311.10 →259.20, 327.10→275.10, 315.20→263.20, 331.10→279.10 respectively. The method was linear
over the concentration range of 50.0pg/mL to 10000pg/mL with correlation coefficients a lower limit of
quantification (LLOQ QC) of 50.0pg/mL. The intra and inter day precisions and accuracy were < 5.71, < 5.47, <
5.10, < 6.68 and -6.67 to 5.00, -7.80 to 2.60, -4.00 to 3.75, -6.00 to -0.25 respectively. The proposed method was
successfully applicable in vast majority of pharmacokinetic study of drugs.
KEY WORDS Desloratadine, 3-hydroxy desloratadine, Plasma, LC-MS/MS
INTRODUCTION
Desloratadine (DES) is active metabolite of loratadine,
the advantage of the second generation H1
antihistamines is their non-sedating effect on the
central nervous system which is observed with first
generation H1 antihistamines because of crossing the
blood brain barrier due to their high lipophilicity. Its
chemical name is 8-Chloro-6, 11-dihydro-11-(4-
piperidinyidene)-5Hbenzo [5,6]cyclohepta [1,2,b]
pyridine and has a structure as below (Figure1).
Desloratadine has a long-lasting effect and does not
cause drowsiness because it does not readily enter
the central nervous system. Unlike other
antihistamines, desloratadine is also effective in
relieving nasal congestion, particularly in patients
with allergic rhinitis. The molecular formula of
desloratadine is C19H19ClN2 with a molecular weight
310.82 gms/mole. Desloratadine (a major metabolite
of loratadine) is extensively metabolized to 3-hydroxy
desloratadine (3-OH DES) (8-Chloro-6,11-dihydro-11-
(4-piperidinylidene)-5H-benzo[5,6]cyclohepta[1,2-
β]pyridin-3-ol), an active metabolite, which is
subsequently glucuronidated. Approximately 87% of a
14C-desloratadine dose was equally recovered in
urine and feces.
Several methods have been reported for
quantification of desloratadine in human plasma with
LC-MS1, Zhang YF et al
5 developed a LLE method over
Page 2
Available Online through
www.ijpbs.com (or) www.ijpbsonline.com IJPBS |Volume 4| Issue 2 |APR-JUN|2014|151-161
International Journal of Pharmacy and Biological Sciences (e-ISSN: 2230-7605)
Rajendraprasad Muppavarapu* et al Int J Pharm Bio Sci www.ijpbs.com or www.ijpbsonline.com
Pag
e15
2
a concentration range of 0.1-20ng/mL. Among all
researchers, L. Yang et al12
and Shen J X et
al13
achieved the best results with high sensitivity at a
linearity range with SPE extraction. Xu et al13
reported
the simultaneous determination of desloratadine and
its metabolite, 3- hydroxyl desloratadine in human
plasma by LC-MS/MS.
The objective of proposed method is to extract
desloratadine in human K3EDTA plasma by LLE
method high sensitivity and selectivity along with its
metabolite appreciably compared with the
deuterated internal standards (ISs), which is most
appropriate in terms of matrix effect, recovery and
reproducibility. The developed method could be
applicable for conducting BABE studies to various
regulatory bodies.
MATERIALS AND METHODS
Chemicals and materials
Desloratadine, 3- hydroxy desloratadine and
desloratadine-D4, 3-hydroxy desloratadine-D4
[Internal Standards (ISs)] were purchased from Samex
Overseas, Surat-1, India and Toronto Research
Chemicals Inc., Canada respectively. HPLC grade
acetonitrile, methanol were procured from Thermo
Fisher Scientific India Private Limited (Sion East,
Mumbai, India), Blank (drug-free) human plasma in
K3EDTA was obtained from Supratech voluntary blood
bank, Thaltej, Ahmedabad. Water was purified by a
Milli-Q system for the preparation of samples and
buffer solution. Formic acid AR grade, sodium
hydroxide (pellets) GR grade, dichloromethane HPLC
grade, ammonium formate GR grade, diethyl ether AR
grade were produced from Merck (Worli, Mumbai,
India).
Solutions
10 mM ammonium formate was prepared
appropriately. Organic mixture was prepared by the
addition of acetonitrile, methanol in the ratio of 40:60
V/V, to this mixture added 10 mM ammonium
formate in the ratio of 70:30(V/V) to compose mobile
phase. Diluent solution was prepared with 0.1%
formic acid and methanol in the ratio of 50:50 (V/V).
Sodium hydroxide solution was prepared
appropriately in water. Diethyl ether and
dichloromethane for extraction purpose in 70:30
(V/V) ratio.
Stock solutions
Stock solutions of desloratadine and 3-hydroxy
desloratadine were prepared in the diluent solution
that gives 100µg/mL concentration separately. These
stock solutions were used for preparation of spiking
solutions required. A mixed intermediate solution
2.5µg/mL concentration contains desloratadine and
3- hydroxyl desloratadine was prepared. Prepared
mixed intermediate solution used to spike calibration
standards (CC) and quality control standards (QC) of
desloratadine and 3 hydroxy desloratadine. The CC
and QC standards were used to evaluate accuracy and
precision. It was also used for the determination of
lower limit of quantification (LLOQ). Stock solutions of
desloratadine-D4, 3-Hydroxy desloratadine-D4 having
100µg/mL was used as IS working solution.
Instrument and LC-MS/MS conditions
The HPLC system (Shimadzu, Kyoto, Japan) equipped
with LC-20AD Series pumps used for solvent delivery,
DGU-20 A3 degasser, CTO-AS vp column oven and a
high throughput SIL HTc auto sampler system was
used for analysis. The analytical column was Kromasil
C18 column (150mm x 4.6mm I.D, 5µm). Mobile phase
composed with organic mixture (acetonitrile:
methanol, 40:60 V/V): 10mM ammonium formate
70:30 (V/V). Separation was achieved under isocratic
elution condition at flow rate was 1.0 mL/min, 75%
flow splitting. In-order to found the tuning
parameters for analytes and internal standards
100ng/mL concentration solution were prepared in
mobile phase system, infused separately at a flow
rate of 10µL using Hamilton syringe pump and
scanned parent, product ion masses in full scan mode
recorded in the range of 50 to 400 amu. Nitrogen was
used as nebulizer gas 50.00 L/h, zero air as sheath gas
and the resolution was set at unit mass. Mass
spectrometric detection was performed using an API
4000 triple quadrupole instrument (MDS-SCIEX,
Toronto, Canada) and on multiple reaction monitoring
(MRM). A turbo ion spray interfaced in positive ion
mode with unit resolution was used. The MRM
transitions monitored were 311.10 (m/z) →259.20
(m/z), 315.20 (m/z) →263.20 (m/z) for desloratadine,
desloratadine-D4 respectively. Similarly 327.10 (m/z)
→275.10 (m/z), 331.10 (m/z) →279.10 (m/z) for 3-
Page 3
Available Online through
www.ijpbs.com (or) www.ijpbsonline.com IJPBS |Volume 4| Issue 2 |APR-JUN|2014|151-161
International Journal of Pharmacy and Biological Sciences (e-ISSN: 2230-7605)
Rajendraprasad Muppavarapu* et al Int J Pharm Bio Sci www.ijpbs.com or www.ijpbsonline.com
Pag
e15
3
hydroxy desloratadine, 3-hydroxy desloratadine-D4
respectively with a dwell time set to 200 ms for each
selected ion transitions. Analyst software version
1.4.1 and Watson LIMS version 7.3 were employed for
data acquisition and processing.
Sample preparation for LC- MS/MS analysis
To evaluate the strategy and mimic the types of
samples one would analyse with this approach, a set
of a drug and metabolites were spiked into plasma an
aliquot of 500 µL plasma, 50 µL of internal standard
mix (25 ng/mL Desloratadine-D4 & 3-hydroxy
desloratadine-D4), and 50µL of 0.1 Normal/L sodium
hydroxide solution were added. The samples were
vortex-mixed then centrifuged and extracted with 2.5
mL of diethyl ether-dichloromethane (70:30 V/V) at
4000 rpm/ 2min, 10±2°C. The organic layer was
separated and evaporated to dryness at 40 5°C
under a gentle stream of nitrogen. The residue was
dissolved in 100µL of mobile phase [Organic Mixture:
10mM ammonium formate, (70:30 V/V)] and vortex
mixed. A 10µL aliquot of the solution was injected
into the LC-MS/MS system.
Method validation
The method was validated and applicable to current
regulatory guidelines. The selectivity of the method
was evaluated by analysing 10 different types of
plasma, which included 7 K3EDTA and one each of
lipidemic, heparinised and haemolysed plasma.
Interference of commonly used medications by
human volunteers was checked in six different
batches of plasma having K3EDTA as anticoagulant.
Their stock solutions were prepared appropriately in
methanol, spiked in plasma and analzyed under the
same conditions at LQC and HQC levels in six
replicates. These sets were processed along with
freshly prepared calibration standards and QC
standard samples in duplicate.
The linearity of the method was ascertained by
measuring the peak area ratio response (analyte/IS)
for eight non-zero concentrations. Each of them was
analysed by using least square weighted (1/x2) linear
regression.
The extraction recovery for analytes and ISs was
calculated by comparing the mean area response of
extracted samples with that of un-extracted samples
at HQC, MQC and LQC levels. Matrix effect was
assessed by comparing the mean area response of un-
extracted samples with mean area of standard
solutions at three QC levels. Percentage recovery for
drug and analyte were represented in Table1 (a) &
(b). Matrix ion suppression was conducted by post
column infusion of analytes (MQC level) at 10µL/min
through a ‘T’ connector.
Stability was determined by measuring the area ratio
response (analyte/IS) of stability samples against
freshly prepared comparison standards at LQC and
HQC levels. Stock and working solutions of analytes
and ISs solutions were checked for short term stability
at room temperature and long term stability.
Autosampler stability (wet extract). Bench top (room
temperature) stability and freeze-thaw stability were
determined at LQC and HQC levels using six replicates
for each level. Long term stability of spiked samples
was also examined for both QC levels.
Ruggedness of the method was evaluated on
precision and accuracy batches. The first batch was
analyzed by different analyst and second batch was
on two different equipment and column. Dilution
integrity was determined by diluting the stock
solutions two fold and tenfold for desloratadine and
3-hydroxy desloratadine in screened plasma. The
accuracy and precision for dilution integrity standards
at HQC and LQC were performed the sample analysis
against freshly prepared calibration standards.
Matrix effect is the suppression or and enhancement
of ionization of analytes by the presence of matrix in
the biological samples and quantitative measure of
the matrix effect termed as matrix factor. Evaluated
by spiking the analytes and ISs at QC levels of higher
and lower into analyte free plasma from six different
batches of respective matrix and in duplicate along
with six replicates of aqueous samples at higher and
lower QC levels the same. The matrix factor was
measured as coefficient of variation less than 15%.
RESULT AND DISCUSSION
For development of liquid chromatography method,
solubility of desloratadine and its metabolite 3-
hydroxy desloratadine was studied in order to
determine the proper ratio of solvents used as mobile
phase to the drug substance for analysis. Referring to
chemical structure, the compound is a base and is
able to accept proton(s), therefore polarity of the
Page 4
Available Online through
www.ijpbs.com (or) www.ijpbsonline.com IJPBS |Volume 4| Issue 2 |APR-JUN|2014|151-161
International Journal of Pharmacy and Biological Sciences (e-ISSN: 2230-7605)
Rajendraprasad Muppavarapu* et al Int J Pharm Bio Sci www.ijpbs.com or www.ijpbsonline.com
Pag
e15
4
dissolved solvent will affect the solubility. The
feasibility of several mixtures of solvent such as
acetonitrile and methanol using different buffers such
as ammonium acetate, ammonium formate, acetic
acid and formic acid with variable PH range 3–6 was
tested for complete chromatographic resolution. To
optimize the chromatographic conditions, different
combinations of methanol–water (90:10,70:30, 50:50,
40:60, 30:70 V/V), methanol-acetonitrile (80:20,
60:40, 50:50, 40:60 V/V), and acetonitrile–ammonium
formate buffer (90:10, 80:20, 60:40, 50:50, 30:70
V/V) were tested. The effect of mobile phase strength
on chromatography of the analytes was evaluated by
changing the organic solvent to aqueous buffer ratio.
The mobile phase composition resulted in good
response and peak shape was selected as the mobile
phase. Acetonitrile and methanol with ammonium
formate buffer (PH 3.5) was preferred because it
resulted in a greater response to desloratadine and its
metabolite 3-hydroxy desloratadine after several
preliminary investigatory runs compared with the
other mobile phases. Poor resolution of desloratadine
and its metabolite were observed using ammonium
formate-methanol (60:40 V/V) but better results were
achieved with (40:60 V/V) of ammonium formate–
organic mixture (made of binary mixture containing
Acetonitrile and methanol). In terms of buffer
concentration, 5 mM and 10 mM ammonium formate
buffers were investigated. On comparing the peak
areas (response) for desloratadine and 3-hydroxy
desloratadine using these two buffers, it was
concluded that the 10 mM ammonium formate buffer
solution proved considerably better for the peak
shape and area of the drug
Method development
Method development is initiated with the scanning
for parent and product ions using 100ng/mL solution
analytes and with internal standards of both in the
positive and negative polarity modes between m/z 50
and 400 range. However, it was difficult to get the
deprotonated precursor ions for analyte and its
metabolite in negative mode and hence positive
ionization mode was selected. Apart this the intensity
found was much higher in the positive ion mode for
desloratadine and 3-hydroxy desloratadine and the
internal standards as they have similar sites for de-
protonation. Mass scanning was done in the range of
50 to 400 amu. Analytes of interest have high
sensitivity in electrospray ionization7 mass
spectrometric analysis compared to non-polar and
un-ionisable organic compounds, due to their polar
nature and presence of highly ionisable functional
groups such as amine or carboxylic acid in their
structures. Further, the use of 10mM ammonium
formate in the mobile phase enhanced the response
of de-protonation precursor [M+H] +
ions. Turbo ion
spray interface7 (TIS) operated in positive ionization
mode was used for the detection. A highly stable and
intense precursor ion was formed at MRM transitions
monitored were m/z 311.10 (m/z), 315.20 (m/z),
327.10 (m/z) and 331.10 (m/z) in the Q1 MS full scan
spectra for desloratadine, desloratadine-D4, 3-hydroxy
desloratadine, 3-hydroxy desloratadine-D4. Similarly
the most abundant product ions at m/z 259.20 (m/z),
263.20 (m/z), 275.10 (m/z) and 279.10 (m/z) in the Q1
MS full scan spectra for Desloratadine, Desloratadine-
D4, 3-hydroxy desloratadine, 3-hydroxy desloratadine-
D4 were found by optimizing collision energy with a
dwell time of 200 ms per transition and the
quadruples 1 and 3 were set at unit resolution. The
MRM state file parameters like nebulizer gas, CAD
gas, ion spray voltage and temperature were suitably
optimized to obtain a consistent and adequate
response for the analytes and internal standards.
Optimised parameters for both ion source and
compound dependent parameters were represented
in Table 3(a) & (b).
Optimization of chromatographic conditions
LC conditions for analytes and ISTDs were set under
isocratic mode and gradient analysis was deliberately
avoided without compromise in the run time and
chromatography. Acidic mobile phase has improved
the protonation of all compounds and addition of
buffers even at 10mM concentration has shown a
positive impact on signal intensities. Highly significant
response variation was observed between acetonitrile
and methanol in the mobile phase, however
consistent and reproducible results were obtained
with binary mixture of acetonitrile and methanol.
During the optimization of stationary phase several
columns were checked and better chromatography
with good improved peak responses was observed on
Kromasil-C18 basic column. A flow rate of 0.8mL/min
was used to minimize the run time and a post column
Page 5
Available Online through
www.ijpbs.com (or) www.ijpbsonline.com IJPBS |Volume 4| Issue 2 |APR-JUN|2014|151-161
International Journal of Pharmacy and Biological Sciences (e-ISSN: 2230-7605)
Rajendraprasad Muppavarapu* et al Int J Pharm Bio Sci www.ijpbs.com or www.ijpbsonline.com
Pag
e15
5
with splitness of 25:75 was used without compromise
in the signal intensity.
Choice of Stationary Phase
Three analytical columns and various mobile phase
compositions were tried in order to reach an
acceptable separation as well as a reasonable
chromatographic run time. For organic semi-polar
molecules, sample retention decreases with
increasing length of the bonded phase. Desloratadine
and its metabolite 3-hydroxy desloratadine are basic
polar compounds and freely soluble in water and
acetonitrile mixture, were eluted rapidly from the C18
column. The cyano (CN, Phenomenex, 250 mm × 4.6
mm I.D, 5-μm particle size) chromatographic column
is used for polar basic compounds in both reverse and
normal-phase modes. A cyano-column was highly
retentive for the analytes, and thus resulted in late
eluting peaks especially for desloratadine (Retention
time >20 min). Retention of desloratadine and its
metabolite 3-hydroxy desloratadine on cyano (CN)
was greater than on the other columns (C18), with
good chromatographic response and optimum
separation, but peak shape was not optimum. On the
basis of these findings, the C18 analytical column was
selected as most appropriate for analysis of
desloratadine. And different columns were used
including a Kromasil C18 column (250mm×4.6mm I.D,
5 µm particle size; and a Diamonsil C18 column
(250mm×4.6mm I.D, 5 µm particle size). Finally,
Kromasil C18 has selected for its excellent system
suitability parameters and symmetrical peaks and
with good resolution between the two analytes.
Selection of Internal standard
The internal standard was selected on the basis of
chemical structure, polarity and solubility
characteristics. Compounds with close pKa and log P
values were selected as ISTDs, to nullify the variations
in sample preparation step, as it is the most
susceptible area for variations. According to the
internal standard selection guidelines, the internal
standard should ideally mirror the analytes in as many
ways as possible. It should preferably belong to the
same class, with same physicochemical and spectral
properties to significantly improve the method
ruggedness9. Different drugs like imipramine and
mefenamic acid were tested as potential candidates
for internal standard and finally, deuterated internal
standard superseded all other candidates in terms of
consistency and reproducibility. There was no
significant effect of internal standards on analytes
recovery, sensitivity or ion suppression. Moreover,
there was no matrix effect of internal standards on
desloratadine and 3-hydroxy desloratadine. Also, the
validation results obtained from this LC-MS/MS
method encouraged its selection as internal standards
for the present study.
Optimization of extraction procedure
Initially, the extraction of desloratadine and 3-
hydroxy desloratadine was carried out by protein
precipitation with common solvents like acetonitrile,
methanol and the obtained results were not
satisfactory with respect to the sample clean-up as
the solvents usable for the protein precipitation are
not strong enough to clean up the sample fully and
this may lead to column clogging, source
contamination and finally contamination to the mass
detector. Phospholipids are major components that
stay in the extracts and elute late in the columns. It
may not affect polar compounds as much as they do
for late eluting analytes. However, the lipids require
high organic composition in the LC gradient to clean
them out of the LC column, otherwise it will
accumulate inside the column and cause poor peak
shape or retention shifts. Liquid-liquid extraction
technique was also tested to isolate the drugs from
plasma using diethyl ether, dichloromethane, methyl
tertiary butyl ether, ethyl acetate and
dichloromethane (alone and in combination) as
extracting solvents. With LLE, the majority of
phospholipids stay in the aqueous layer when using
MTBE as an extraction solvent regardless if the
plasma PH is adjusted or not. By switching to a more
polar organic extraction solvent, such as
dichloromethane, more lipids will participate into the
organic layer. Diethyl ether: Dichloromethane,
70:30V/V in ratio as an extraction solvent mix gives
best results over the other solvents mix. The
phospholipids response increases ~ 10 fold in the
organic layer compared to using only MTBE. This
suggests using Diethyl ether: Dichloromethane,
70:30V/V in ratio as an extraction solvent in the
application of analyzing the aqueous layer in LLE.
Page 6
Available Online through
www.ijpbs.com (or) www.ijpbsonline.com IJPBS |Volume 4| Issue 2 |APR-JUN|2014|151-161
International Journal of Pharmacy and Biological Sciences (e-ISSN: 2230-7605)
Rajendraprasad Muppavarapu* et al Int J Pharm Bio Sci www.ijpbs.com or www.ijpbsonline.com
Pag
e15
6
Method Validation
Validation10,11
runs were conducted on six separate
days. Each precision and accuracy validation run
organized with a set of spiked calibration standard
samples distributed at eight concentration levels over
the dynamic range, a blank (without ISTD), a zero
sample (blank with ISTD) and QC samples (n=6 at each
of four concentration levels; LLOQ QC, low, medium
and high). Standard samples were analyzed at the
beginning of each validation run and other samples
were distributed randomly throughout the run.
Results of the QC samples from four inter &intraday
runs were used to evaluate the accuracy and
precision of the method. Sensitivity (at lower limit of
quantification), dilution integrity (two fold and
tenfold), and ruggedness of the method were also
determined.
Selectivity: Selectivity is the ability of the method to
measure and to differentiate the analyte in the
presence of endogenous components, which may be
expected to be present, typically the endogenous
components might include metabolites, impurities,
matrix components, etc. The selectivity of the method
towards endogenous plasma matrix was ascertained
in ten batches of human plasma by analyzing blanks
and spiked plasma samples at LLOQ QC
concentration. No endogenous peaks were observed
at the retention time of the analytes for any of the
batches. Method selectivity is established by proof of
the lack of response by analyzing human K3 EDTA
plasma blank matrices from ten different individual
matrix lots along with one lipemic, one heparinized
and one hemolytic plasma lots. Peak responses in
blank plasma lots were compared against the mean
response of spiked LLOQ QC samples (n=6) and no
interferences were observed in all the screened
plasma lots, at the retention time of analytes and
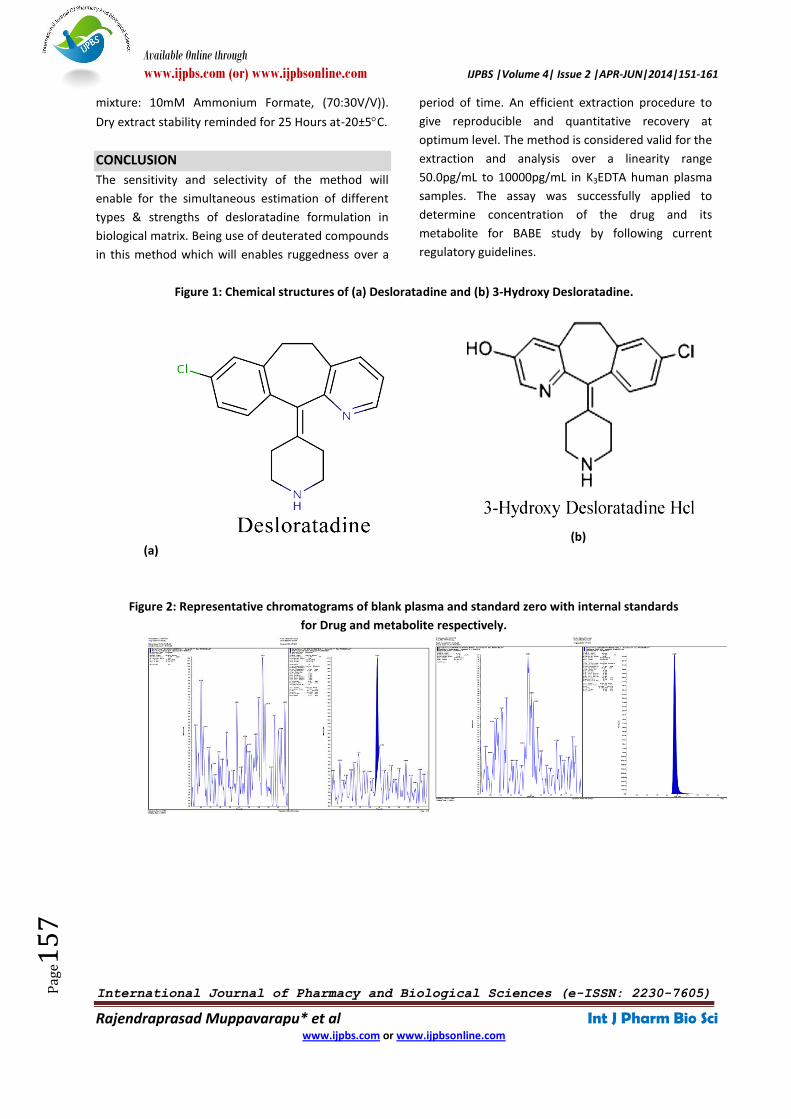
ISTDs. The selectivity of the method, with the
chromatograms of blank plasma and standard zero
with internal standards demonstrated at Figure 2
respectively. The linear regression of the peak area
ratios versus concentrations were fitted over the
concentration ranges 50.0pg/mL to 10000pg/mL of
the analytes in plasma.
Specificity sensitivity
Method sensitivity was determined in one of the
validation runs at LLOQ QC level by perform and
processing six replicates. The batch precision at LLOQ
QC level was < 5.71, <5.47, for DES, IS and< 5.10, <
6.68 for 3-OH DES and IS and while accuracy -6.67 to
5.00 for DES -7.80 to 2.60for DES-D4, -4.00 to 3.75 for
3-OH DES, -6.00 to -0.25 for 3-OH DES-D4 respectively.
Precision and accuracy for the proposed method was
represented in Table 2. No endogenous compounds
were found to interference at the retention time of
analytes and ISs. The representative chromatogram of
a calibration standard at the LLOQ QC level is shown
in Figure 3.
The precision (%CV) for system suitability test was in
the range of < 1.65 & < 1.75 for the retention time
and for the area ratios of both analytes and ISs. The
signal to noise ratio for system performance was ≥5.5,
≥22.0 respectively. Analyte, metabolite and Internal
standards carry over were ≤3.92, ≤15.31, ≤0.10 &
≤0.07 respectively. Auto sampler carry over test was
performed to ensure that no significant affect the
precision and accuracy over the proposed method.
Very negligible % carry over (≤7.00 for DES, ≤0.41 for
DES-D4 and ≤12.02 for 3-0H DES ≤0.65 for 3-OH DES-
D4) during batch run observed in extracted blank
plasma after subsequent injection of highest
calibration standard at the retention time of analytes.
Stability
Short term stability of stock solutions reminded for 09
hours at ambient temperature for drug and ISs with
100µg/mL concentration at ULOQ and LLOQ QC level
in methanol. Working solutions short term stable for
09 hours ambient temperature for both IS with
25ng/mL concentration in diluent. Long term stock
solution stability of drug and metabolite stable for a
minimum of167 hours at 5±3°C for 100µg/mL
concentration in Methanol. Whereas long term
stability of spiking solutions at ULOQ and LLOQ QC
level were stable for 167 Hours at 5±3°C in diluent
(Formic Acid in Methanol (0.1% V/V): Water,
50:50V/V). Drug stability at the LQC and HQC
concentrations was measured after 05 freeze thaw
cycles at -20±5C and -78±8°C. An auto sampler Re-
injection and Reproducibility at LQC and HQC
concentrations for 76 Hours at 5±3C in (Organic
mixture: 10mM Ammonium Formate, (70:30V/V)) was
measured and compared with freshly prepared
samples. Wet extract stability for drug and metabolite
were stabled for 55 Hours at 5±3°C in (Organic
Page 7
Available Online through
www.ijpbs.com (or) www.ijpbsonline.com IJPBS |Volume 4| Issue 2 |APR-JUN|2014|151-161
International Journal of Pharmacy and Biological Sciences (e-ISSN: 2230-7605)
Rajendraprasad Muppavarapu* et al Int J Pharm Bio Sci www.ijpbs.com or www.ijpbsonline.com
Pag
e15
7
mixture: 10mM Ammonium Formate, (70:30V/V)).
Dry extract stability reminded for 25 Hours at-20±5C.
CONCLUSION
The sensitivity and selectivity of the method will
enable for the simultaneous estimation of different
types & strengths of desloratadine formulation in
biological matrix. Being use of deuterated compounds
in this method which will enables ruggedness over a
period of time. An efficient extraction procedure to
give reproducible and quantitative recovery at
optimum level. The method is considered valid for the
extraction and analysis over a linearity range
50.0pg/mL to 10000pg/mL in K3EDTA human plasma
samples. The assay was successfully applied to
determine concentration of the drug and its
metabolite for BABE study by following current
regulatory guidelines.
Figure 1: Chemical structures of (a) Desloratadine and (b) 3-Hydroxy Desloratadine.
(a)
(b)
Figure 2: Representative chromatograms of blank plasma and standard zero with internal standards
for Drug and metabolite respectively.
Page 8
Available Online through
www.ijpbs.com (or) www.ijpbsonline.com IJPBS |Volume 4| Issue 2 |APR-JUN|2014|151-161
International Journal of Pharmacy and Biological Sciences (e-ISSN: 2230-7605)
Rajendraprasad Muppavarapu* et al Int J Pharm Bio Sci www.ijpbs.com or www.ijpbsonline.com
Pag
e15
8
Figure 3: The representative chromatograms of a calibration standard at the LLOQ QC level.
Table 1(a): Recovery percentage of Desloratadine.
Replicate No.
HQC MQC LQC
Extracted
Peak Area
Ratio
Un-extracted
Peak Area
Ratio
Extracted
Peak Area
Ratio
Un-extracted
Peak Area
Ratio
Extracted
Peak Area
Ratio
Un-extracted
Peak Area
Ratio
1 2.975 4.585 1.527 2.325 0.052 0.083
2 2.996 4.452 1.500 2.280 0.052 0.081
3 2.998 4.508 1.516 2.310 0.051 0.081
4 2.987 4.590 1.473 2.348 0.050 0.081
5 3.001 4.603 1.479 2.306 0.050 0.082
Mean 2.9914 4.5476 1.4990 2.3138 0.0510 0.0816
SD 0.01055 0.06514 0.02318 0.02506 0.00100 0.00089
% CV 0.35 1.43 1.55 1.08 1.96 1.10
% Mean Recovery 82.2 81.0 78.1
% Overall Recovery 80.44
% Overall CV 2.61
Table 1(b): Recovery percentage of 3- Hydroxy Desloratadine.
Replicate No.
HQC MQC LQC
Extracted
Peak Area
Ratio
Un-extracted
Peak Area
Ratio
Extracted
Peak Area
Ratio
Un-extracted
Peak Area
Ratio
Extracted Peak
Area Ratio
Un-extracted
Peak Area
Ratio
1 2.730 5.485 1.373 2.836 0.050 0.105
2 2.780 5.512 1.344 2.761 0.050 0.101
3 2.749 5.491 1.345 2.831 0.050 0.098
4 2.668 5.512 1.339 2.773 0.051 0.102
Page 9
Available Online through
www.ijpbs.com (or) www.ijpbsonline.com IJPBS |Volume 4| Issue 2 |APR-JUN|2014|151-161
International Journal of Pharmacy and Biological Sciences (e-ISSN: 2230-7605)
Rajendraprasad Muppavarapu* et al Int J Pharm Bio Sci www.ijpbs.com or www.ijpbsonline.com
Pag
e15
9
5 2.666 5.486 1.353 2.767 0.050 0.105
Mean 2.7186 5.4972 1.3508 2.7936 0.0502 0.1022
SD 0.05038 0.01370 0.01339 0.03671 0.00045 0.00295
% CV 1.85 0.25 0.99 1.31 0.89 2.89
% Mean Recovery 61.8 60.4
61.4
% Overall Recovery 61.22
% Overall CV 1.15
Table 2: Accuracy and Precision Batch runs for Desloratadine & 3-Hydroxy Desloratadine.
Run Day No. Curve
Number
LLOQ QC
(50.0 pg/mL) % Bias
LQC
(150 pg/mL) % Bias
MQC
(4000 pg/mL) % Bias
HQC
(8000 pg/mL) % Bias
Day 1
1 48.5 -3.00 145 -3.33 4040 1.00 8130 1.63
51.2 2.40 139 -7.33 4030 0.75 8180 2.25
47.0 -6.00 142 -5.33 4070 1.75 8240 3.00
49.6 -0.80 134 -10.67 4140 3.50 8220 2.75
47.4 -5.20 142 -5.33 4050 1.25 8220 2.75
Intra run Mean
48.7
140
4070
8200
Intra run SD
1.71
4.16
43.9
43.8
Intra run % CV
3.51
2.97
1.08
0.53
Intra run % Bias
-2.60
-6.67
1.75
2.50
n
5
5
5
5
Day 2
4 47.2 -5.60 148 -1.33 4220 5.50 8210 2.63
48.6 -2.80 140 -6.67 4220 5.50 8540 6.75
47.4 -5.20 144 -4.00 4200 5.00 8280 3.50
45.2 -9.60 145 -3.33 4150 3.75 8440 5.50
47.8 -4.40 141 -6.00 4110 2.75 8520 6.50
Intra run Mean
47.2
144
4180
8400
Intra run SD
1.26
3.21
48.5
147
Intra run % CV
2.67
2.23
1.16
1.75
Intra run % Bias
-5.60
-4.00
4.50
5.00
n
5
5
5
5
Day 3
12 50.9 1.80 151 0.67 4030 0.75 8130 1.63
49.8 -0.40 148 -1.33 4210 5.25 8370 4.63
48.2 -3.60 147 -2.00 4150 3.75 8150 1.88
50.2 0.40 148 -1.33 4120 3.00 8410 5.13
55.9 11.80 140 -6.67 4070 1.75 8450 5.63
Intra run Mean
51.0
147
4120
8300
Intra run SD
2.91
4.09
69.9
151
Intra run % CV
5.71
2.78
1.70
1.82
Intra run % Bias
2.00
-2.00
3.00
3.75
n
5
5
5
5
Mean
Concentration
Found (pg/mL)
49.0
144
4120
8300
Inter-run SD
2.50
4.47
70.4
143
Inter-run % CV
5.10
3.10
1.71
1.72
Inter-run % Bias
-2.00
-4.00
3.00
3.75
n
15
15
15
15
Page 10
Available Online through
www.ijpbs.com (or) www.ijpbsonline.com IJPBS |Volume 4| Issue 2 |APR-JUN|2014|151-161
International Journal of Pharmacy and Biological Sciences (e-ISSN: 2230-7605)
Rajendraprasad Muppavarapu* et al Int J Pharm Bio Sci www.ijpbs.com or www.ijpbsonline.com
Pag
e16
0
Table 3(a): Ion source parameters
Table 3(b): Compound dependent parameters
Parameters Desloratadine 3- Hydroxy
Desloratadine Desloratadine D4
3- Hydroxy
Desloratadi
ne D4
Declustering potential (DP) 100.00 86.00 100.00 86.00
Entrance potential (EP) 10.00 10.00 10.00 10.00
Collision energy (CE) 33.00 30.00 33.00 30.00
Collision cell exit potential (CXP) 15.00 8.00 15.00 8.00
Dwell time (milli seconds) 200 200 200 200
REFERENCES
1. V. Praveen kumar, A novel chromatographic separation
technique using UPLC-MS/MS for Determination of
desloratadine and 3-hydroxy desloratadine in human
Plasma and its application, J Pharm PharmSci, 5 (4),
685-688.
2. Mara M, The Possibility of Simultaneous voltammetry
Determination of Desloratadine and 3-Hydroxy
desloratadine: ActaChim. Slov, 57:686–692, (2010).
3. K. Hussain Raviteja, UV Spectrophotometric Method
for the Simultaneous Determination of Desloratadine
and Pseudoephedrine HCl in Combined Dosage Form.
British Journal of Pharmaceutical Research, 4(4): 418-
428, (2014).
4. M. Saquib Hasnain, Development and validation of an
improved LC‑MS/MS method for the quantification of
desloratadine and its metabolite in human plasma
using deuterated desloratadine as internal standard.
Journal of Pharmacy and BioAllied Sciences January,
5(1), (2013).
5. Zhang Y F et al, Pharmacokinetics of loratadine and its
active metabolite descarboethoxy loratadine in healthy
Chinese subjects, ActaPharmacol Sin, 24 (7): 715-718,
(2003).
6. Bhavin N. Patel, LC–MS-ESI for the Determination of
Loratadine and Descarboethoxy loratadine in Human
Plasma. Journal of Chromatographic Science, 48:
(2010).
7. Richard F. Venn, Principles and Practice of Bioanalysis,
2nd
Edn. Taylor & Francis publishers (2005).
8. Jim X Shen and Yan Xu et al, Simultaneous
determination of desloratadine and pseudoephedrine
in human plasma using micro solid-phase extraction
tips and aqueous normal-phase liquid
chromatography/tandem mass spectrometry. Rapid
Communications in Mass Spectrometry, 21(18):3145-
55 (2007).
9. Venkata Suresh Ponnuru, Quantification of
desloratadine in human plasma by LC-ESI-MS/MS and
application to a pharmacokinetic study. Journal of
Pharmaceutical Analysis, 2(3):180–187 (2012).
10. G Srinubabu, Development and validation of high-
throughput liquid chromatography- tandem mass
spectrometric method for simultaneous quantification
of loratadine and desloratadine in human plasma.
Journal of chromatography B, 860: 202-208, (2007)
11. Guidance for Industry, Bioanalytical Method
Validation, U.S. Department of Health and Human
Services, Food and Drug Administration, Center for
Drug Evaluation and Research (CDER), May 2001.
12. L. Yang et al, Validation of a sensitive automated 96-
well SPE LC-MS-MS method for the determination of
desloratadine and 3-hydroxy desloratadine in human
plasma, J. Chromatogr, B , 792: 229, (2003).
13. Shen JX et al, Simultaneous determination of
desloratadine and pseudoephedrine in human plasma
using micro solid phase extraction tips and aqueous
Curtain gas (CUR) 20.00
Ion spray voltage (IS) 5500.00
Temperature (TEM) 500.00
Nebulizer gas(GS1) 50.00
Heater gas(GS2) 60.00
Interface Heater(ihe) ON
Collision gas (CAD) 3.00
Page 11
Available Online through
www.ijpbs.com (or) www.ijpbsonline.com IJPBS |Volume 4| Issue 2 |APR-JUN|2014|151-161
International Journal of Pharmacy and Biological Sciences (e-ISSN: 2230-7605)
Rajendraprasad Muppavarapu* et al Int J Pharm Bio Sci www.ijpbs.com or www.ijpbsonline.com
Pag
e16
1
normal phase liquid chromatography tandem mass
spectrometry. Rapid Common Mass Spectrom, 21 (18):
3145-3155, (2007).
*Corresponding Author: Rajendraprasad Muppavarapu Bioanalytical Research department, Jeevanscintific, Hyderabad, India