New-issue leveraged loan volume $0B $10B $20B $30B $40B $50B $60B $70B Feb-19 Apr-19 Jun-19 Aug-19 Oct-19 12/1 - 12/19/19 Pro rata Institutional Source: LCD, an offering of S&P Global Market Intelligence Average institutional flow-name loan bid 95 96 97 98 99 100 101 Dec 2018 Feb 2019 Apr 2019 Jun 2019 Aug 2019 Oct 2019 Dec 2019 Source: LCD, an offering of S&P Global Market Intelligence December November October Spread (L+) 301 356 358 OID 99.6% 99.2% 99.1% Yield 5.10% 5.78% 5.93% Observations 56 50 56 Spread (L+) 199 195 199 OID 99.9% 99.8% 99.8% Yield 3.99% 3.95% 4.10% Observations 21 16 19 Spread (L+) 375 435 438 OID 99.4% 98.9% 98.8% Yield 5.91% 6.67% 6.84% Observations 30 30 33 Source: LCD, an offering of S&P Global Market Intelligence 2B Note: yield calculations are based on current LIBOR. Loan market, by the numbers All Loans 4B Average new-issue yield to maturity 3% 4% 5% 6% 7% 8% 9% Dec 2018 Feb 2019 Apr 2019 Jun 2019 Aug 2019 Oct 2019 Dec 2019 BB B Source: LCD, an offering of S&P Global Market Intelligence Highly leveraged loans Dec-19 Nov-19 Oct-19 Leverage thru first-lien 4.0x 4.7x 4.6x Leverage thru second-lien 4.4x 5.2x 4.9x Senior debt/EBITDA 5.2x 5.4x 5.5x Debt/EBITDA 5.2x 5.4x 5.6x Leverage thru first-lien 4.0x 4.7x 4.6x Leverage thru second-lien 4.4x 5.2x 4.9x Senior debt/EBITDA 5.2x 5.4x 5.6x Debt/EBITDA 5.2x 5.4x 5.7x Leverage thru first-lien 4.6x 4.9x 4.5x Leverage thru second-lien 5.5x 5.9x 4.9x Senior debt/EBITDA 6.2x 5.9x 6.1x Debt/EBITDA 6.2x 5.9x 6.3x Source: LCD, an offering of S&P Global Market Intelligence Large corporate (more than $50M of EBITDA) LBO large corporate (more than $50M of EBITDA) LCD leveraged loan credit stats December 19, 2019 LCD Weekly Wrap That’s a wrap December institutional new-issue volume is just $9.6 billion (excluding repricings), which is the lowest for any month in 2019. Repricings, on the other hand, have been busy again with $23.8 billion in volume across 18 tranches. Price flexes in December have heavily favored issuers, with downward price revisions outpacing upward revisions by 10:1 through Dec. 13, according to LCD. — Commentary, page 6 Due to the seasonal market slowdown, the next LCD Weekly Wrap will be published on Jan. 9. Happy holidays from LCD.
Transcript
New-issue leveraged loan volume
$0B
$10B
$20B
$30B
$40B
$50B
$60B
$70B
Feb-19 Apr-19 Jun-19 Aug-19 Oct-19 12/1 -12/19/19
Pro rataInstitutional
Source: LCD, an offering of S&P Global Market Intelligence
Average institutional fl ow-name loan bid
95
96
97
98
99
100
101
Dec 2018 Feb 2019 Apr 2019 Jun 2019 Aug 2019 Oct 2019 Dec 2019
Source: LCD, an offering of S&P Global Market Intelligence
Leverage thru first-lien 4.6x 4.9x 4.5xLeverage thru second-lien 5.5x 5.9x 4.9xSenior debt/EBITDA 6.2x 5.9x 6.1xDebt/EBITDA 6.2x 5.9x 6.3xSource: LCD, an offering of S&P Global Market Intelligence
Large corporate (more than $50M of EBITDA)
LBO large corporate (more than $50M of EBITDA)
LCD leveraged loan credit stats
December 19, 2019
LCD Weekly WrapThat’s a wrap
December institutional new-issue volume is just $9.6 billion (excluding repricings), which is the lowest for any month in 2019. Repricings, on the other hand, have been busy again with $23.8 billion in volume across 18 tranches. Price fl exes in December have heavily favored issuers, with downward price revisions outpacing upward revisions by 10:1 through Dec. 13, according to LCD. — Commentary, page 6
Due to the seasonal market slowdown, the next LCD Weekly Wrap will be published on Jan. 9. Happy holidays from LCD.
December 19, 2019 LCD Weekly Wrap
2
Average spread of high-yield fl ow names
L+300
L+350
L+400
L+450
L+500
L+550
L+600
L+650
Dec 2018 Feb 2019 Apr 2019 Jun 2019 Aug 2019 Oct 2019 Dec 2019
High-yield primary: Last call page 19U.S. high-yield was working toward a strong fi nish to 2019, eyeballing nearly $5.5 billion in volume, to nudge the full-year issuance total up to $272.5 billion. The fi nal prints widen the year-over-year supply gap, to a 61% increase from 2018. To quickly recap the current year, companies seeking to refi nance debt bolstered issuance, accounting for 67.2% of overall volume, up from 61.7% in 2018. The Fed’s pivot on interest rate policy early in the year spurred the refi nancing.
Middle-market leveraged loan volume (loans of up to $350 million)
$0B
$1B
$2B
$3B
$4B
Dec 2018 Mar 2019 Jun 2019 Sep 2019 Dec 2019
Pro rata
Institutional
Source: LCD, an offering of S&P Global Market Intelligence
Middle market: Direct in full effect page 14Middle market syndicated loan activity has been very quiet in December with only $230 million of issuance. There has been an uptick in direct lending activity, however, according to sources. And while direct lenders have been busy, there has been no rush to complete deals before 2019 draws to a close. Rather, the pipeline brims with transactions that will likely close in the fi rst half of 1Q 2020, sources say.
Inside this week. . .Weekly institutional loan repayments
$0B
$2B
$4B
$6B
$8B
$10B
$12B
Sep 20 Oct 11 Nov 1 Nov 22 Dec 13
Total repaymentsLTM average ($4.6B)
Source: LCD, an offering of S&P Global Market Intelligence
TechnicalsRepayments for the week ended Dec. 13 were $6.9B, up from $5.3B for the week ended Dec. 6. The trailing-52-week average is $4.64B. The forward calendar of institutional deals decreased to $26.2B on Dec. 18, from $28.5B on Dec. 11. For the week ended Dec. 13, $10.1B of performing institutional loans were taken out. The amount of performing institutional loans has increased 2.87%, to $1.17 trillion as of Dec. 13, 2019, from $1.13 trillion on Dec. 31, 2018.
Average bid of performing loans
94
95
96
97
98
99
100
101
Dec 2018 Feb 2019 Apr 2019 Jun 2019 Aug 2019 Oct 2019 Dec 2019
BB
B
Source: S&P/LSTA Leveraged Loan Index
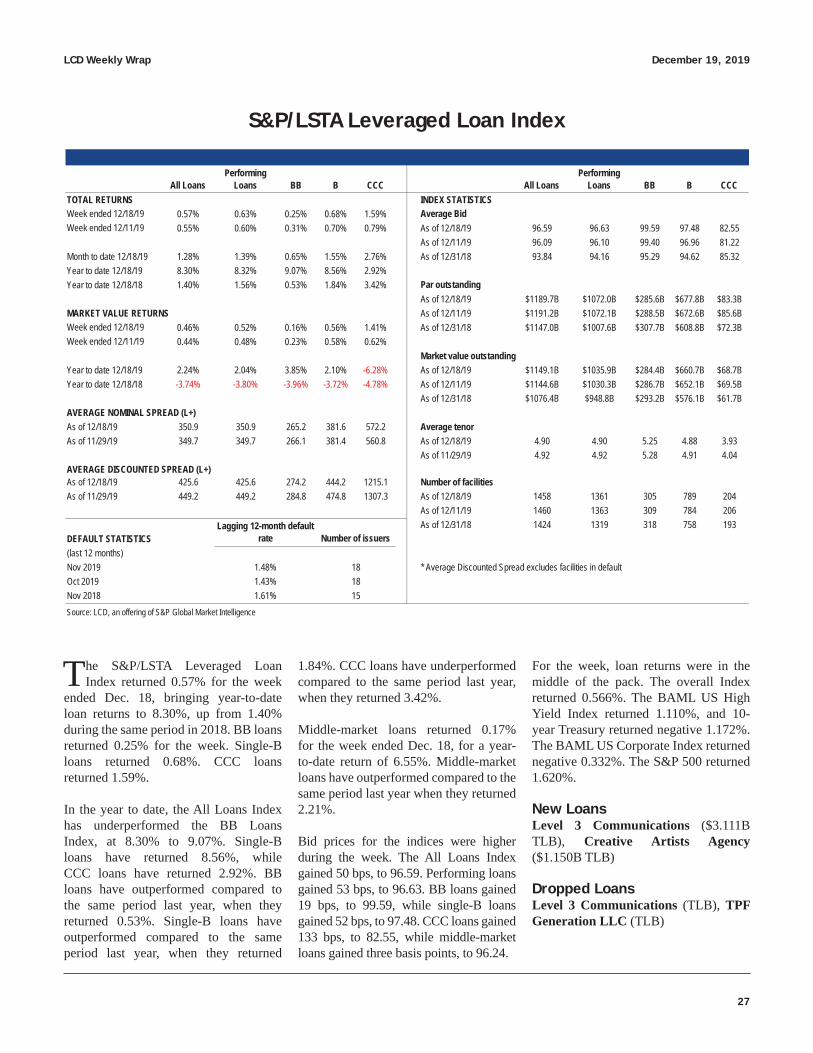
Loan secondary: Game on page 12The secondary loan market continued its December rally this week as investor sentiment improved amid a slightly better economic outlook than previously expected and the Fed’s recent signaling of steady rates for longer in 2020. The S&P/LSTA Leveraged Loan Index returned 0.57% in the week of Dec. 12–18, with CCCs leading the charge amid the renewed risk-on sentiment. The average bid of the CCC rated facilities in the Index gained 122 bps, to 82.55 on Dec. 18.
Note: vertical lines indicate dates when fl ow-name constituents were updated. Source: LCD, an offering of S&P Global Market Intelligence
LCD Weekly Wrap December 19, 2019
3
Average bid of high-yield fl ow names
9293949596979899
100101102103
Dec 2018 Feb 2019 Apr 2019 Jun 2019 Aug 2019 Oct 2019 Dec 2019
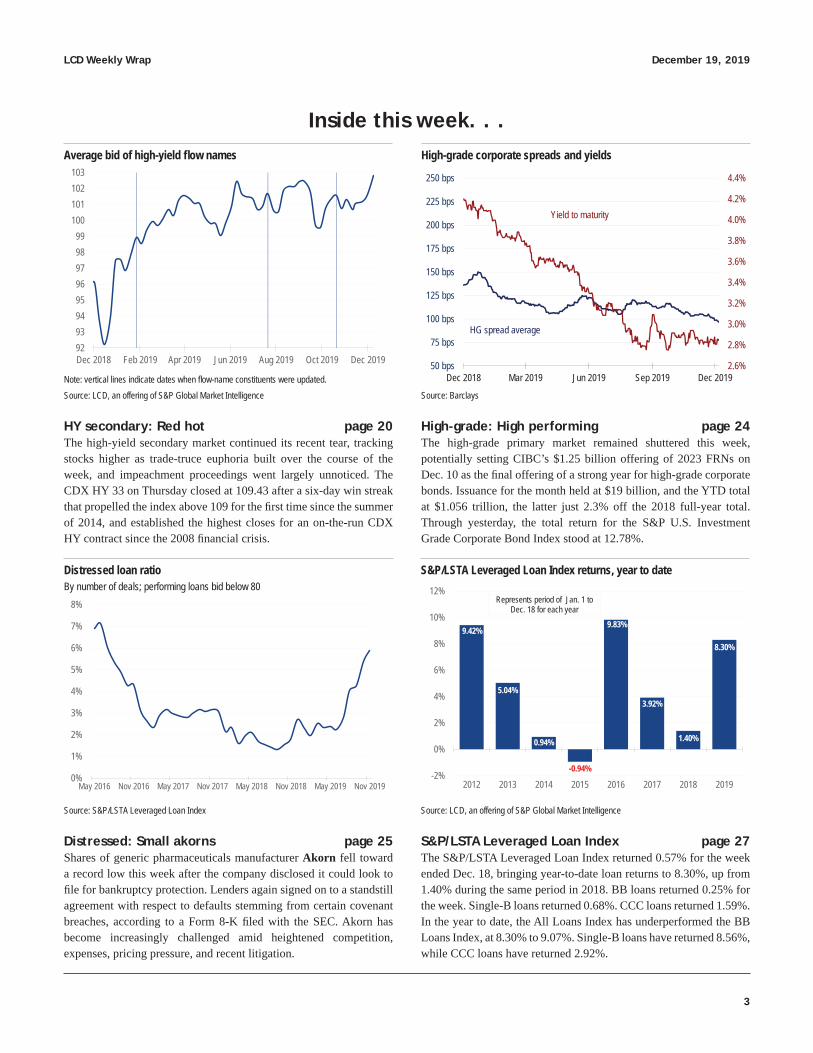
HY secondary: Red hot page 20The high-yield secondary market continued its recent tear, tracking stocks higher as trade-truce euphoria built over the course of the week, and impeachment proceedings went largely unnoticed. The CDX HY 33 on Thursday closed at 109.43 after a six-day win streak that propelled the index above 109 for the fi rst time since the summer of 2014, and established the highest closes for an on-the-run CDX HY contract since the 2008 fi nancial crisis.
Distressed loan ratioBy number of deals; performing loans bid below 80
0%
1%
2%
3%
4%
5%
6%
7%
8%
May 2016 Nov 2016 May 2017 Nov 2017 May 2018 Nov 2018 May 2019 Nov 2019
Source: S&P/LSTA Leveraged Loan Index
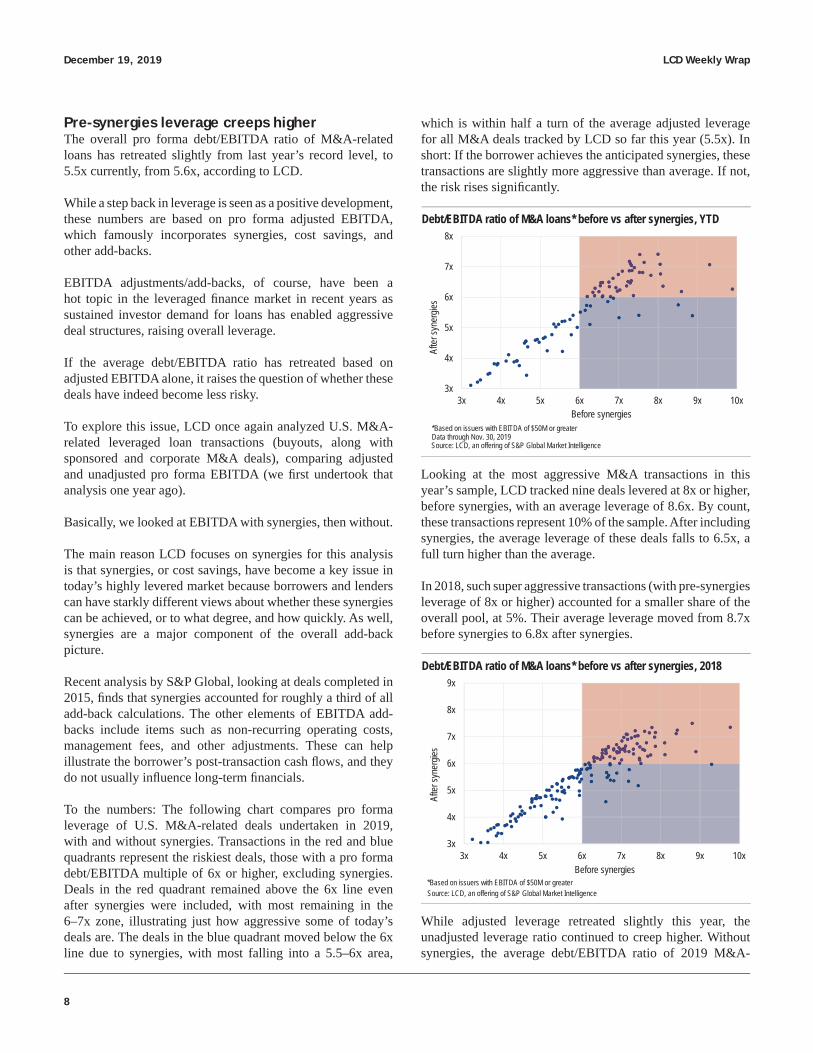
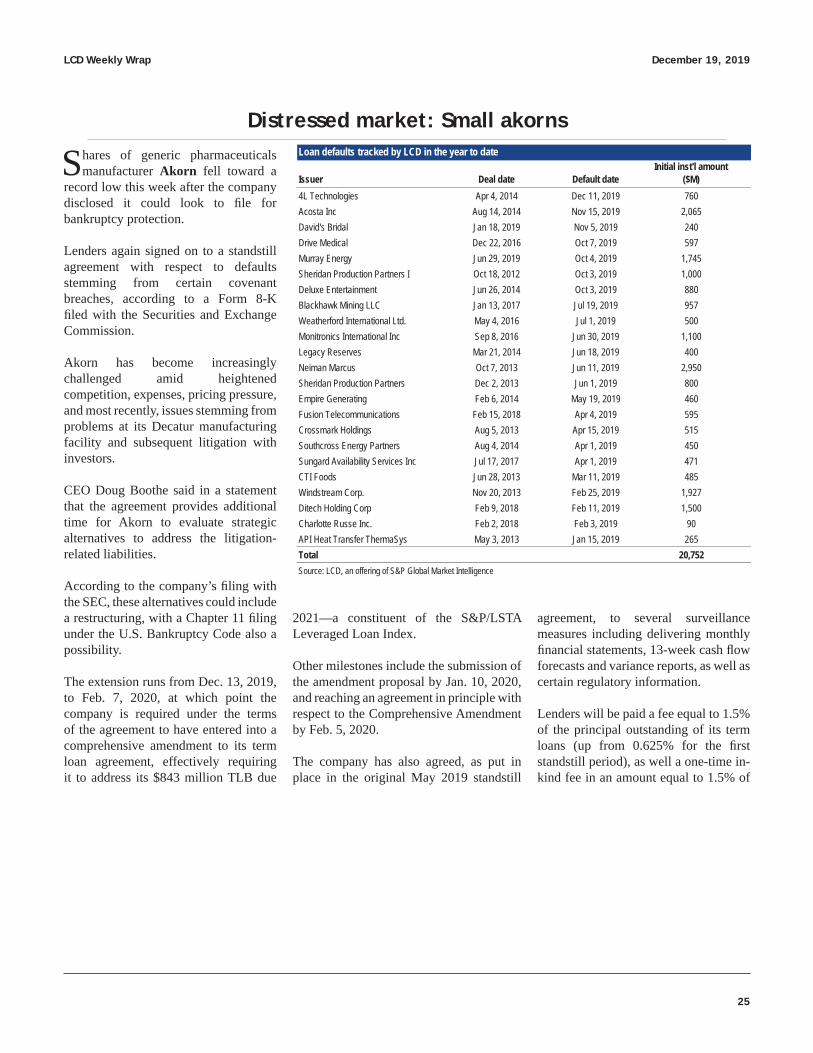
Distressed: Small akorns page 25Shares of generic pharmaceuticals manufacturer Akorn fell toward a record low this week after the company disclosed it could look to fi le for bankruptcy protection. Lenders again signed on to a standstill agreement with respect to defaults stemming from certain covenant breaches, according to a Form 8-K fi led with the SEC. Akorn has become increasingly challenged amid heightened competition, expenses, pricing pressure, and recent litigation.
Inside this week. . .High-grade corporate spreads and yields
2.6%
2.8%
3.0%
3.2%
3.4%
3.6%
3.8%
4.0%
4.2%
4.4%
50 bps
75 bps
100 bps
125 bps
150 bps
175 bps
200 bps
225 bps
250 bps
Dec 2018 Mar 2019 Jun 2019 Sep 2019 Dec 2019
Yield to maturity
HG spread average
Source: Barclays
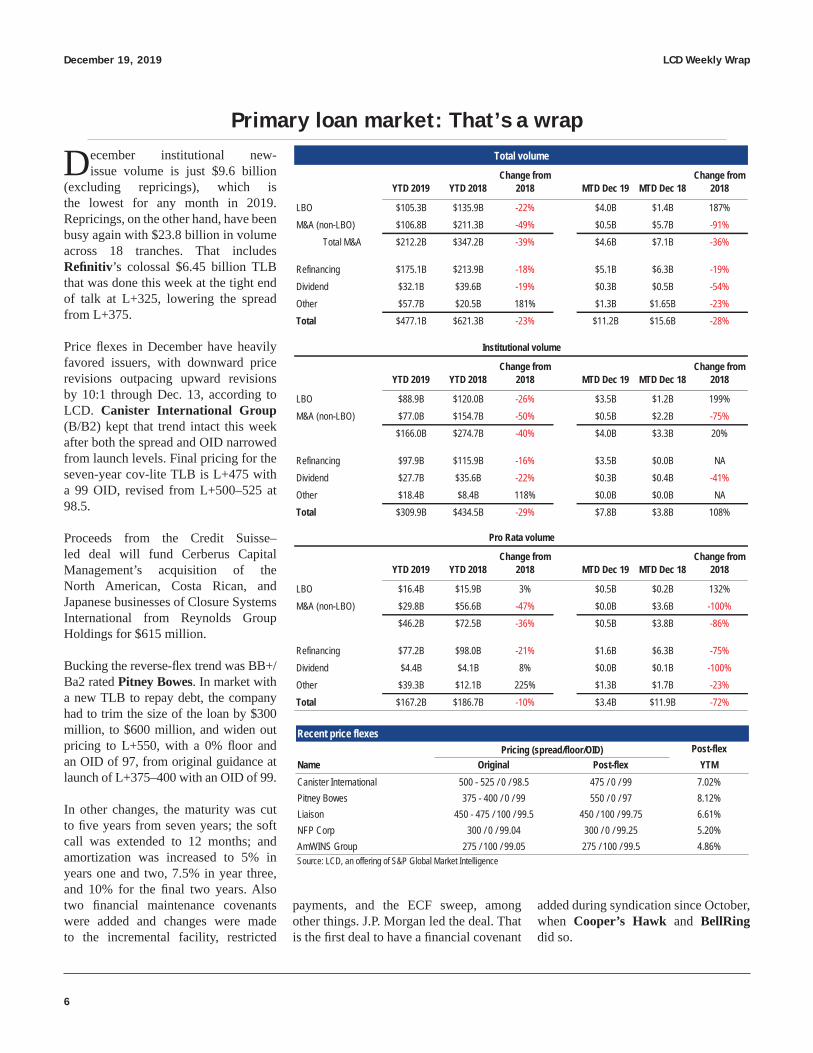
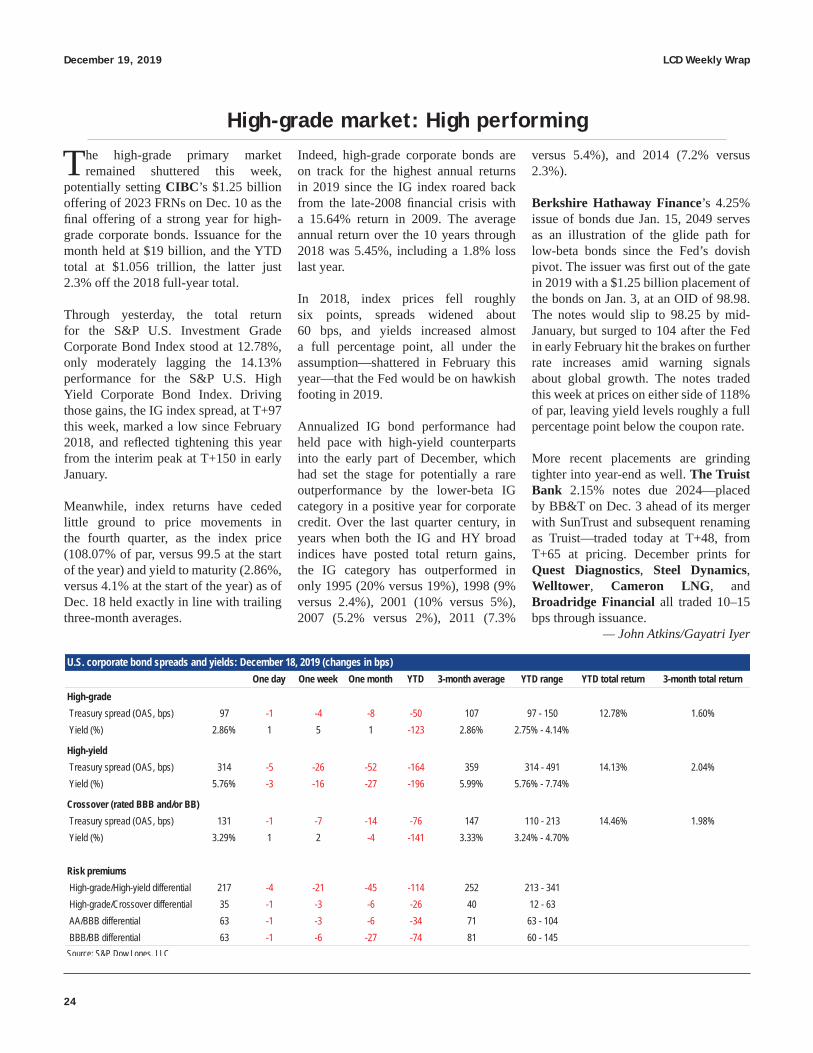
High-grade: High performing page 24The high-grade primary market remained shuttered this week, potentially setting CIBC’s $1.25 billion offering of 2023 FRNs on Dec. 10 as the fi nal offering of a strong year for high-grade corporate bonds. Issuance for the month held at $19 billion, and the YTD total at $1.056 trillion, the latter just 2.3% off the 2018 full-year total. Through yesterday, the total return for the S&P U.S. Investment Grade Corporate Bond Index stood at 12.78%.
S&P/LSTA Leveraged Loan Index returns, year to date
9.42%
5.04%
0.94%
-0.94%
9.83%
3.92%
1.40%
8.30%
-2%
0%
2%
4%
6%
8%
10%
12%
2012 2013 2014 2015 2016 2017 2018 2019
Represents period of Jan. 1 to Dec. 18 for each year
Source: LCD, an offering of S&P Global Market Intelligence
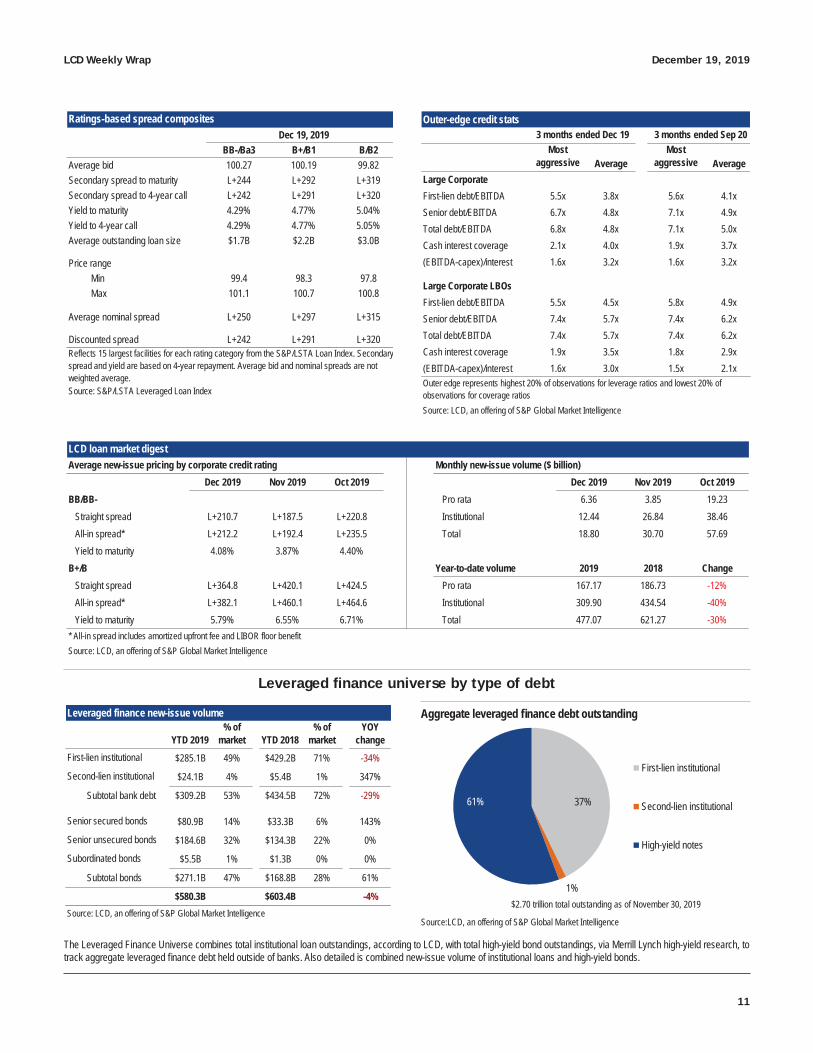
S&P/LSTA Leveraged Loan Index page 27The S&P/LSTA Leveraged Loan Index returned 0.57% for the week ended Dec. 18, bringing year-to-date loan returns to 8.30%, up from 1.40% during the same period in 2018. BB loans returned 0.25% for the week. Single-B loans returned 0.68%. CCC loans returned 1.59%. In the year to date, the All Loans Index has underperformed the BB Loans Index, at 8.30% to 9.07%. Single-B loans have returned 8.56%, while CCC loans have returned 2.92%.
Note: vertical lines indicate dates when fl ow-name constituents were updated. Source: LCD, an offering of S&P Global Market Intelligence
December 19, 2019 LCD Weekly Wrap
4
Relative value
New-issue premium: difference in primary and secondary yields
0 bps
10 bps
20 bps
30 bps
40 bps
Dec 2018 Mar 2019 Jun 2019 Sep 2019 Last 5 breaks
Source: LCD, an offering of S&P Global Market Intelligence
Gap between BB and single-B secondary institutional spreads
100 bps
140 bps
180 bps
220 bps
260 bps
Dec 2018 Mar 2019 Jun 2019 Sep 2019 Dec 2019
Source: S&P/LSTA Leveraged Loan Index
Gap between secondary spread of single-B fi rst- and second-lien loans
250 bps
300 bps
350 bps
400 bps
450 bps
500 bps
550 bps
Dec 2018 Mar 2019 Jun 2019 Sep 2019 Dec 2019
Source: S&P/LSTA Leveraged Loan Index
Gap between loan and bond fl ow-name yields
0 bps50 bps
100 bps150 bps200 bps250 bps300 bps
Dec 2018 Feb 2019 Apr 2019 Jun 2019 Aug 2019 Oct 2019 Dec 2019
Source: LCD, an offering of S&P Global Market Intelligence
Through NovInflows Nov 2019 2019 3 months 6 months 12 months 24 months 36 months
Source: LCD, an offering of S&P Global Market Intelligence; Lipper
$ billion
The charts below illustrate four relative-value trend lines: the gap between (1) the YTM for primary price and secondary break price for new-issue institutional loans, (2) BB and single-B secondary institutional spreads, (3) secondary spreads of single-B fi rst- and second-lien loans, and (4) secondary spreads of high-yield and loan fl ow names.
As of 12/19 As of 12/12 Change (bps)Primary YTM 5.83% 4.87% 96Secondary YTM 5.72% 4.82% 90Gap (bps) 11 5 6Note: Yield calculations based on current LIBOR. Avgs. reflect last 5 breaks for each time period.
This week Last week ChangeBB L+284.1 L+291.3 -7.2B L+490.8 L+508.8 -18.0Gap (bps) 207 218 -10.8
This week Last week ChangeFirst-lien L+484.8 L+503.3 -18.4Second-lien L+996.7 L+989.7 7.0Gap (bps) 512 486 25.4
This week Last week ChangeLoans 4.64% 4.62% 1.5High-yield 5.69% 5.99% -29.3Gap (bps) 106 137 -30.8
LCD Weekly Wrap December 19, 2019
5
Institutional scorecardPercent of fi rst-lien deals with LIBOR fl oors and level
78
82
86
90
94
98
102
10%
20%
30%
40%
50%
60%
70%
Dec 2018 Mar 2019 Jun 2019 Sep 2019 Dec 2019Percent Floor level
Source: LCD, an offering of S&P Global Market Intelligence
Source: LCD, an offering of S&P Global Market Intelligence
Dec Nov Oct SepBB/B or better 13 23 28 31B 63 114 123 160NR 75 63 249 63All 41 79 92 117
Average first-lien OID (bps)
Source: LCD, an offering of S&P Global Market Intelligence
All-in fi rst-lien spreadsIncludes amortized upfront fee and benefi t from LIBOR fl oors
L+100
L+200
L+300
L+400
L+500
L+600
Dec 2018 Mar 2019 Jun 2019 Sep 2019 Dec 2019
BB/BB–
B+/B
Source: LCD, an offering of S&P Global Market Intelligence
Percent of fi rst-lien deals with prepay fees
0
3
6
9
12
60%
70%
80%
90%
100%
Dec 2018 Mar 2019 Jun 2019 Sep 2019 Dec 2019Percent Months
Source: LCD, an offering of S&P Global Market Intelligence
First-lien institutional volume by industry (last 30 days)
7%
5%
7%
7%
12%
14%
23%
25%
Other
Healthcare
Industrial
Other
Services/ Retail
Oil & Gas
Media
Telecom
0% 10% 20% 30% 40%
Source: LCD, an offering of S&P Global Market Intelligence
First-lien institutional volume by rating (last 30 days)
34.6%
65.0%
0.4%
BB
B
NR
0% 10% 20% 30% 40% 50% 60% 70% 80%Source: LCD, an offering of S&P Global Market Intelligence
December 19, 2019 LCD Weekly Wrap
6
Primary loan market: That’s a wrap
December institutional new-issue volume is just $9.6 billion
(excluding repricings), which is the lowest for any month in 2019. Repricings, on the other hand, have been busy again with $23.8 billion in volume across 18 tranches. That includes Refi nitiv’s colossal $6.45 billion TLB that was done this week at the tight end of talk at L+325, lowering the spread from L+375.
Price fl exes in December have heavily favored issuers, with downward price revisions outpacing upward revisions by 10:1 through Dec. 13, according to LCD. Canister International Group (B/B2) kept that trend intact this week after both the spread and OID narrowed from launch levels. Final pricing for the seven-year cov-lite TLB is L+475 with a 99 OID, revised from L+500–525 at 98.5.
Proceeds from the Credit Suisse–led deal will fund Cerberus Capital Management’s acquisition of the North American, Costa Rican, and Japanese businesses of Closure Systems International from Reynolds Group Holdings for $615 million.
Bucking the reverse-fl ex trend was BB+/Ba2 rated Pitney Bowes. In market with a new TLB to repay debt, the company had to trim the size of the loan by $300 million, to $600 million, and widen out pricing to L+550, with a 0% fl oor and an OID of 97, from original guidance at launch of L+375–400 with an OID of 99.
In other changes, the maturity was cut to fi ve years from seven years; the soft call was extended to 12 months; and amortization was increased to 5% in years one and two, 7.5% in year three, and 10% for the fi nal two years. Also two fi nancial maintenance covenants were added and changes were made to the incremental facility, restricted
Source: LCD, an offering of S&P Global Market Intelligence
payments, and the ECF sweep, among other things. J.P. Morgan led the deal. That is the fi rst deal to have a fi nancial covenant
added during syndication since October, when Cooper’s Hawk and BellRing did so.
LCD Weekly Wrap December 19, 2019
7
A UBS-led arranger group completed the syndication of a $219 million incremental fi rst-lien term loan for TRC Companies (B/B2), which provided fi nancing for the New Mountain Capital–backed company’s acquisition of Lockheed Martin Energy’s Distributed Energy Solutions business that closed in November.
Pricing for the covenant-lite TLB due June 2024 came at talk at L+500, with a 1% fl oor and a 98.5 OID. It is not fungible with the existing $368 million tranche, where pricing remains L+350. The loan was originally launched in October as a fungible add-on, with a spread range of L+375–400 and an offer to boost the existing loan pricing to match. After that effort stalled, the loan was relaunched in its current form last week.
Tepid investor interest in single-B supply in 4Q hampered other deals as well. Pacifi c Dental Services withdrew a dividend recapitalization that would have marked the issuer’s debut in the institutional market. A refi nancing transaction for Highway Ventures Borrower never crossed the fi nish line and a deal for OneSky remained past due from its deadline in early December.
As 2019 business draws to a close, there is already some prep work being done for the new year. A Goldman Sachs–led arranger group is preparing to launch the fi rst-lien fi nancing for Sophos that will be used to back Thoma Bravo’s $3.9 billion LBO of the U.K.-based cyber security fi rm. Lender meetings are planned in New York for Tuesday, Jan. 7, and in London on Wednesday, Jan. 8.
Financing will include a $1.43 billion dollar-equivalent fi rst-lien term loan denominated in both dollars and euros, with the split to be determined. A $520 million second-lien term loan is being privately placed, and Owl Rock Capital and Ares Capital are joint lead arrangers on that tranche.
Bank of America and Royal Bank of Canada are providing $1.1 billion of committed fi nancing to support the all-stock merger of Xperi (Nasdaq: XPER) and TiVo (Nasdaq: TIVO) that is expected to close in 2Q 2020.
Proceeds from the debt fi nancing will be used to repay existing debt at both companies, which includes Xperi’s covenant-lite B term loan due 2023 (L+250, 0.75% LIBOR fl oor) that totaled $394 million as of Sept. 30. As for TiVo, the company in November closed a $715 million term loan due November 2024 with HPS Investment Partners that refi nanced its existing TLB. Pricing is subject to a grid based on total leverage and is in a range of L+525–575, with a 1% fl oor, and is subject to a total leverage covenant of 6x, with step-downs.
From U.K.-based issuer Cineworld comes new debt fi nancing of $2.28 billion that will be used for its acquisition of Canada’s Cineplex in a takeover that values the Canadian operator at $2.1 billion including debt. BofA Securities, HSBC, and Goldman Sachs are expected to lead the fi nancing, which is made up of a $1.9 billion incremental senior secured term loan and a $300 million senior unsecured term loan facility. The transaction’s post-synergy acquisition multiple is roughly 6.3x, based on expected 2019 adjusted EBITDA. Initial leverage is expected to be around 4x, but the fi rm anticipates this will be reduced toward 3x by the end of 2021.
Cineworld last year placed a $3.325 billion covenant-lite TLB due February 2025 (L+250, 0% LIBOR fl oor) as part of the fi nancing for its $3.6 billion takeover of U.S. chain Regal Entertainment, and returned in September of this year with a $650 million incremental TLB due 2026 that priced at L+250, but is subject to a leverage-based grid. The incremental refi nanced a euro-denominated TLB and repaid revolver borrowings.
S&P Global Ratings placed its BB– issuer and senior secured debt issue ratings on CreditWatch with negative implications and expects to lower them by one notch to B+ once the transaction closes.
Barclays, RBC Capital Markets, Deutsche Bank, Jefferies, and Mizuho provided the debt fi nancing commitments that support the take-private buyout of cloud-based connectivity fi rm LogMeIn by Francisco Partners and Elliott Management. The deal was struck at $86.05 per share for an aggregate equity valuation of approximately $4.3 billion. Closing is expected in mid-2020.
Also added to the forward calendar was a $300 million fungible incremental fi rst-lien term loan to fi nance the acquisition of HCT Group by Knowlton Development Corp. (KDC). UBS is left lead arranger on the fi nancing and Jefferies is joint lead arranger. The remainder of the purchase price will be funded with new equity from the sponsor, Cornell Capital, as well as reinvestment equity from the founder and existing management of HCT. The transaction will be deleveraging and the acquisition is expected to close in early 1Q 2020.
KDC (B/B2) was last in the market in July with a $105 million fungible add-on to its covenant-lite B term loan due December 2025 (L+425, 0% LIBOR fl oor) to fund an acquisition. That brought the total tranche size at the time to roughly $630 million. The loan was originally placed in December 2018 to support the buyout of the company by Cornell. Additional investors include HarbourVest Partners, CDPQ, and Investissement Québec.
December 19, 2019 LCD Weekly Wrap
8
Pre-synergies leverage creeps higherThe overall pro forma debt/EBITDA ratio of M&A-related loans has retreated slightly from last year’s record level, to 5.5x currently, from 5.6x, according to LCD.
While a step back in leverage is seen as a positive development, these numbers are based on pro forma adjusted EBITDA, which famously incorporates synergies, cost savings, and other add-backs.
EBITDA adjustments/add-backs, of course, have been a hot topic in the leveraged fi nance market in recent years as sustained investor demand for loans has enabled aggressive deal structures, raising overall leverage.
If the average debt/EBITDA ratio has retreated based on adjusted EBITDA alone, it raises the question of whether these deals have indeed become less risky.
To explore this issue, LCD once again analyzed U.S. M&A-related leveraged loan transactions (buyouts, along with sponsored and corporate M&A deals), comparing adjusted and unadjusted pro forma EBITDA (we fi rst undertook that analysis one year ago).
Basically, we looked at EBITDA with synergies, then without.
The main reason LCD focuses on synergies for this analysis is that synergies, or cost savings, have become a key issue in today’s highly levered market because borrowers and lenders can have starkly different views about whether these synergies can be achieved, or to what degree, and how quickly. As well, synergies are a major component of the overall add-back picture.
Recent analysis by S&P Global, looking at deals completed in 2015, fi nds that synergies accounted for roughly a third of all add-back calculations. The other elements of EBITDA add-backs include items such as non-recurring operating costs, management fees, and other adjustments. These can help illustrate the borrower’s post-transaction cash fl ows, and they do not usually infl uence long-term fi nancials.
To the numbers: The following chart compares pro forma leverage of U.S. M&A-related deals undertaken in 2019, with and without synergies. Transactions in the red and blue quadrants represent the riskiest deals, those with a pro forma debt/EBITDA multiple of 6x or higher, excluding synergies. Deals in the red quadrant remained above the 6x line even after synergies were included, with most remaining in the 6–7x zone, illustrating just how aggressive some of today’s deals are. The deals in the blue quadrant moved below the 6x line due to synergies, with most falling into a 5.5–6x area,
which is within half a turn of the average adjusted leverage for all M&A deals tracked by LCD so far this year (5.5x). In short: If the borrower achieves the anticipated synergies, these transactions are slightly more aggressive than average. If not, the risk rises signifi cantly.
Debt/EBITDA ratio of M&A loans* before vs after synergies, YTD
3x
4x
5x
6x
7x
8x
3x 4x 5x 6x 7x 8x 9x 10x
After
syne
rgies
Before synergies
Source: LCD, an offering of S&P Global Market IntelligenceData through Nov. 30, 2019*Based on issuers with EBITDA of $50M or greater
Looking at the most aggressive M&A transactions in this year’s sample, LCD tracked nine deals levered at 8x or higher, before synergies, with an average leverage of 8.6x. By count, these transactions represent 10% of the sample. After including synergies, the average leverage of these deals falls to 6.5x, a full turn higher than the average.
In 2018, such super aggressive transactions (with pre-synergies leverage of 8x or higher) accounted for a smaller share of the overall pool, at 5%. Their average leverage moved from 8.7x before synergies to 6.8x after synergies.
Debt/EBITDA ratio of M&A loans* before vs after synergies, 2018
3x
4x
5x
6x
7x
8x
9x
3x 4x 5x 6x 7x 8x 9x 10x
After
syne
rgies
Before synergies
Source: LCD, an offering of S&P Global Market Intelligence*Based on issuers with EBITDA of $50M or greater
While adjusted leverage retreated slightly this year, the unadjusted leverage ratio continued to creep higher. Without synergies, the average debt/EBITDA ratio of 2019 M&A-
LCD Weekly Wrap December 19, 2019
9
related deals is currently 5.9x, up slightly from 5.8x in 2018. With synergies, the average leverage declined slightly, to 5.5x, from 5.6x. As a result, the gap between the adjusted and unadjusted leverage ratio rose to 0.4x in the year to Nov. 30, from 0.3x in the prior two years and from 0.1–0.2x in 2010–2016.
Source: LCD, an offering of S&P Global Market Intelligence
*Based on issuers with EBITDA of $50M or greater
Not adjusted for synergies
Adjusted for synergies
Data through Nov. 30, 2019
Leverage through fi rst-lien term debt on M&A transactions this year is 4.5x EBITDA with synergies, and 4.7x EBITDA without synergies, unchanged from last year. In contrast, these metrics stood at 3.7x/3.8x at the peak of the last cycle, in 2007.
Pro forma fi rst-lien debt/EBITDA ratio of M&A loans*
Source: LCD, an offering of S&P Global Market Intelligence
*Based on issuers with EBITDA of $50M or greater
Not adjusted for synergies
Adjusted for synergies
Data through Nov. 30, 2019
Overall, M&A-related loan volume is currently 40% off last year’s record-setting pace, at $162 billion, versus $271 billion, and roughly on par with levels of issuance in 2015 and 2016. While activity has declined across the board, LBOs are down 28% while other M&A transactions (corporate acquisitions/mergers and sponsored tack-on acquisitions) are down 50%.
Source: LCD, an offering of S&P Global Market IntelligenceData through Nov. 30, 2019
Although volume has declined, the share of highly levered deals is at a record high. Some 44% had a pro forma debt/EBITDA ratio of 6x or higher, based on adjusted numbers, or 51% based on unadjusted EBITDA, according to LCD. Of course, the 6x leverage fi gure—fl agged by federal agencies in 2013 as concerning—remains notable, market players say, despite clarifi cation last year that the guidance is not technically a rule. In 2018, the share of deals levered at 6x or higher was 42%/49% (with/without synergies).
Source: LCD, an offering of S&P Global Market Intelligence
*Based on issuers with EBITDA of $50M or greater
Not adjusted for synergies
Adjusted for synergies
Data through Nov. 30, 2019
Moving further up the leverage spectrum, 12% of transactions had pro forma debt/EBITDA of 7x or higher this year, including synergies, a post-crisis high, up from 9% last year. While this metric has risen in recent years, it remains far below the 2007 record of 17%. Assuming, however, that the expected synergies are not achieved, the share of M&A transactions levered at 7x or higher increases to 24% this year, a new record, up from 18% in 2018 and 19% in the pre-crisis year of 2007.
December 19, 2019 LCD Weekly Wrap
10
These fi gures suggest that the number of aggressively levered borrowers using synergies in their pro forma fi nancials has risen in recent years. Indeed, LCD tracked 85 M&A transactions this year where pro forma EBITDA was adjusted for synergies and cost savings. More than half (53%) had an
Source: LCD, an offering of S&P Global Market Intelligence
*Based on issuers with EBITDA of $50M or greater
Not adjusted for synergies
Adjusted for synergies
Data through Nov. 30, 2019
unadjusted leverage multiple of 6x or higher, while 24% were in the 7x-or-higher zone. Three years ago, 40% of deals with synergies-related adjustments came from the 6x-or-higher zone, and just 7% were at 7x or higher.
M&A loans with synergies by unadjusted leverage range*
Reflects 15 largest facilities for each rating category from the S&P/LSTA Loan Index. Secondaryspread and yield are based on 4-year repayment. Average bid and nominal spreads are not weighted average.
Outer edge represents highest 20% of observations for leverage ratios and lowest 20% of observations for coverage ratiosSource: LCD, an offering of S&P Global Market Intelligence
3 months ended Dec 19 3 months ended Sep 20
Dec 2019 Nov 2019 Oct 2019 Dec 2019 Nov 2019 Oct 2019BB/BB- Pro rata 6.36 3.85 19.23
B+/B 2019 2018 ChangeStraight spread L+364.8 L+420.1 L+424.5 Pro rata 167.17 186.73 -12%All-in spread* L+382.1 L+460.1 L+464.6 Institutional 309.90 434.54 -40%Yield to maturity 5.79% 6.55% 6.71% Total 477.07 621.27 -30%
LCD loan market digest
Source: LCD, an offering of S&P Global Market Intelligence
Average new-issue pricing by corporate credit rating Monthly new-issue volume ($ billion)
Year-to-date volume
* All-in spread includes amortized upfront fee and LIBOR floor benefit
YTD 2019% of
market YTD 2018% of
marketYOY
change
$285.1B 49% $429.2B 71% -34%
$24.1B 4% $5.4B 1% 347%
Subtotal bank debt $309.2B 53% $434.5B 72% -29%
$80.9B 14% $33.3B 6% 143%
$184.6B 32% $134.3B 22% 0%
$5.5B 1% $1.3B 0% 0%
Subtotal bonds $271.1B 47% $168.8B 28% 61%
$580.3B $603.4B -4%
Leveraged finance new-issue volume
Source: LCD, an offering of S&P Global Market Intelligence
First-lien institutional
Second-lien institutional
Senior secured bonds
Senior unsecured bonds
Subordinated bonds
Aggregate leveraged fi nance debt outstanding
37%
1%
61%
First-lien institutional
Second-lien institutional
High-yield notes
$2.70 trillion total outstanding as of November 30, 2019
Source:LCD, an offering of S&P Global Market Intelligence
The Leveraged Finance Universe combines total institutional loan outstandings, according to LCD, with total high-yield bond outstandings, via Merrill Lynch high-yield research, to track aggregate leveraged fi nance debt held outside of banks. Also detailed is combined new-issue volume of institutional loans and high-yield bonds.
Leveraged fi nance universe by type of debt
December 19, 2019 LCD Weekly Wrap
12
Secondary loan market: Game on
The secondary loan market continued its December rally this week as
investor sentiment improved amid a slightly better economic outlook than previously expected and the Fed’s recent signaling of steady rates for longer in 2020.
The S&P/LSTA Leveraged Loan Index returned 0.57% in the week of Dec. 12–18, with CCCs leading the charge amid the renewed risk-on sentiment. The average bid of the CCC rated facilities in the Index gained 122 bps, to 82.55 on Dec. 18, from 81.33 on Dec. 12. Additionally, arrangers wrapped the remaining facilities on the calendar as the market prepares to break for the end of the year.
After an initial slip early last week, several healthcare loans reversed recent losses and added further gains as reports emerged that legislation surrounding surprise billing will not make it into the year-end government funding bill, pushing the issue to next year.
Envision Healthcare’s TLB due October 2025 (L+375, 0% LIBOR fl oor) is quoted back up to an 85.5/86.5
Source: LCD, an offering of S&P Global Market Intelligence
as of Dec 19, 2019
context, from roughly 79/81 at the start of last week. Team Health’s TLB due February 2024 (L+350, 1% LIBOR fl oor) was quoted up about 11 points from last week’s low to an 81.5/83.5 context, while Air Method’s TLB due April 2024 (L+350, 1% LIBOR fl oor) is now quoted up at 88/89, from 79.5/81.5 early last week.
Cineworld announced this week that it signed a defi nitive agreement to acquire Cineplex in a transaction valued at approximately $2.1 billion, including debt. Cineworld has received committed debt fi nancing of $2.28 billion to fund the transaction. Leverage is expected to be around 4x at closing, with the fi rm reducing leverage toward 3x by the end of 2021.
The issuer currently has a roughly $3.325 billion TLB due February 2025 (L+250, 0% LIBOR fl oor) that was quoted down to 99.5/100 following the announcement, from 100.25/100.75 previously.
Elsewhere, Xperi Corp.’s (Nasdaq: XPRE) TLB due December 2023 (L+250, 0.75% LIBOR fl oor) was quoted about half a point higher at 99.875/100.625 after the company announced an all-stock combination with TiVo (Nasdaq: TIVO). The company has obtained $1.1 billion of committed debt fi nancing to back the transaction and repay existing
Name (CCR) Size ($M) OID Break price New-issue yieldBreakyield
Note: yield calculations are based on current LIBOR Source: LCD, an offering of S&P Global Market Intelligence
LCD Weekly Wrap December 19, 2019
13
debt at both companies. The shares of the two companies will be converted into shares of a new parent company based on a fi xed exchange ratio of 0.455 Xperi share per existing TiVo share.
On the allocation front, arrangers wrapped up the remaining deals on the calendar for this year with strong initial performance in the secondary for the term loans amid the fi rm backdrop.
Accounts received allocations of Refi nitiv’s $6.451 billion repriced TLB due October 2025 that priced at par and lowered the spread on the facility by 50 bps, to L+325. The term loan freed to trade at 100.625/100.875.
Berry Global completed the repricing of its $4.25 billion TLY due July 2026 (L+200, 0% LIBOR fl oor) that freed to trade at 100.375/100.75 after pricing at an OID of 99.875. As part of the transaction, the issuer repaid its €1.075 billion V term loan via a new two-part bond offering.
Calpine Corp completed the repricing of its $947.6 million TLB-9 due April 2026 and its $1.532 billion TLB-5 due January 2024. Both priced at par and lowered the spreads to L+225. The TLB-9 was quoted at 100.125/100.625 on the break, while the TLB-5 was quoted at 100.375/100.625 upon entry to the secondary.
Meanwhile, Cabot Microelectronics allocated its $957 million repriced TLB due November 2025 that cleared at the tight end of guidance at an OID of par before breaking at 100.25/100.75. The spread was lowered by 25 bps via the transaction, to L+200.
LBO transactions for Cox Media Group, Liaison, WIRB-Copernicus Group, and Canister Internantional were al so completed over the past seven days.
Cox Media’s $2.025 billion fi rst-lien term loan (L+425, 0% LIBOR fl oor) backing the buyout of the company by Apollo priced tight of talk at an OID of 99.5 before breaking for trading at 99.75/100.5.
Meanwhile, WIRB-Copernicus’ $920 million TLB (L+400, 1% LIBOR fl oor) cleared at an OID of 99 before being quoted in the aftermarket at 99.625/100.25. Proceeds back the buyout of the company by Leonard Green & Partners.
Finally, offers were due on $203.4 million and $503.6 million loan OWICs and a $92.3 million loan BWIC this week. The $203.4 million OWIC consisted of 30 tranches with an average size of about $6.8 million, while the BWIC had 69 tranches averaging roughly $1.3 million in size. The larger OWIC contained 113 tranches averaging $4.5 million.
— Tyler Udland
December 19, 2019 LCD Weekly Wrap
14
Middle market: Direct in full effect
Middle market syndicated loan activity has been very quiet in December with only $230 million of issuance.
There has been an uptick in direct lending activity, however, according to sources. And while direct lenders have been busy, there has been no rush to complete deals before 2019 draws to a close. Rather, the pipeline brims with transactions that will likely close in the fi rst half of 1Q 2020, sources say. Add-on acquisition activity remains the heartbeat of the direct lending.
As for deals crossing the fi nish line of late, Walker & Dunlop on Dec. 13 completed a repricing of its $298 million B term loan due November 2025 that lowered the margin to L+200, from L+225, with a 0% LIBOR fl oor. The repriced loan was issued at par with a six-month reset of 101 soft call protection. J.P. Morgan led the transaction. Walker & Dunlop (NYSE: WD) originates, sells, and services a range of multifamily and other commercial real estate fi nancing products.
Also, investors on Dec. 13 received allocations of Liaison’s $225 million fi rst-lien term loan via lead arrangers Credit Suisse and UBS. Pricing for the seven-year covenant-lite TLB came tight to talk at L+450, with a 1% LIBOR fl oor and an OID of 99.75. Proceeds will be used to fi nance the buyout of the company by Meritage Group. Financing also includes a $15 million revolver due 2024, with a springing fi rst-lien net leverage covenant. Liaison, based in Watertown, Mass., provides admission-management software for higher education.
Pro Rata & Direct Lending• Digi International on Dec. 17 entered into a $150
million, fi ve-year pro rata credit facility that includes a $100 million A term loan and $50 million revolver in connection with its previously announced acquisition of Opengear, which has been completed. Pricing is tied to a leverage-based grid, at L+125–325, opening at L+225. BMO Capital Markets and Silicon Valley Bank acted as joint lead arrangers. BMO is administrative agent. Capital One, U.S. Bank, Citizens Bank, and Truist Bank also participated in the transaction. The facility is covered by a total leverage covenant set at 3.25x through Dec. 31, 2019; then at 3x through Dec. 31, 2020; 2.75x through Dec. 31, 2021; and at 2.5x thereafter. It’s also covered by a total
fi xed charge coverage ratio set at 1.25x. Digi International (Nasdaq: DGII) is a global provider of Internet of Things (IoT) connectivity products, software, and services. Opengear, based in Edison, N.J., is a provider of secure IT infrastructure products and software.
• CoVenture and TCM Capital provided a $205 million debt facility supporting ProducePay. The debt facility follows a $14 million Series B equity funding round led by Anterra Capital raised last year. ProducePay offers farmers cash advances throughout the growing season.
• Great American Capital Partners provided fi nancing for a $70 million senior secured term loan supporting Franchise Group’s acquisition of The Vitamin Shoppe. The total purchase price of The Vitamin Shoppe was $208 million, as per an announcement in August. Pricing for the term loan due December 2022 is L+900, with a 2% LIBOR fl oor. Financial covenants include a limit on capital expenditures, a minimum consolidated liquidity requirement, and a minimum consolidated EBITDA requirement. In addition, Tributum, an affi liate of Vintage Capital Management, and other investors provided a $31 million equity fi nancing in support of the acquisition. J.P. Morgan Chase Bank was agent on an ABL revolver, from which the company drew $70 million to back the transaction. The Vitamin Shoppe is an omni-channel, specialty retailer of nutritional products. Franchise Group (Nasdaq: FRG) is an operator and acquirer of franchised and franchisable businesses. Franchise Group owns and operates Liberty Tax Service, Buddy’s Home Furnishings, and the Sears Outlet businesses. The company has also agreed to acquire Revolution Financial, a provider of consumer loans and credit products, in a deal that is expected to close in the fi rst quarter of 2020.
• Prospect Capital Corp. (Nasdaq: PSEC) has disclosed a new $70 million senior secured second-lien term loan investment to support the recapitalization of Ahead Data Blue. Regions Capital Markets was lead arranger on a senior secured credit facility that backed the transaction and Churchill Asset Management, Varagon Capital Partners, and TD Securities were joint lead arrangers.
$350M or Less Purpose Lead agent SponsorDeal size
($M)Institutional
spreadsLIBOR
floor (bps) OIDUnison Software (Add-on 12/19) Refinancing SunTrust Bank ABRY Partners 50 L+450 100 99.25CoreCivic (12/19) Refinancing Nomura Bank Not Sponsored 250 L+450 100 95.00EMG Utica (12/19) Refinancing Credit Suisse Not Sponsored 173 L+425 100 98.50
Middle-market loan calendarInstitutional loans by deal size
Source: LCD, an offering of S&P Global Market Intelligence
LCD Weekly Wrap December 19, 2019
15
Regions Bank is administrative agent for the senior loan. The recapitalization was initially pitched in the broadly syndicated market before that deal stalled and the fi nancing was eventually taken up by the club of arrangers. Ahead and Data Blue, both portfolio companies of Court Square Capital Partners, announced in October that they would merge and at the same time acquire Sovereign Systems. Ahead Data Blue is a provider of enterprise cloud solutions.
• TPG Sixth Street Partners provided a $55 million credit facility to IntelePeer that the company will use to facilitate continued market and product expansion. San Mateo, Calif.–based IntelePeer is a privately owned provider of an omni-channel communications platform.
• Silicon Valley Bank provided a $20 million credit facility to Orchestra BioMed. Proceeds will be used for development and general corporate purposes, with an initial draw of up to $10 million available for the next 12 months and the remainder available following the completion of certain milestones. The credit facility adds to the capital resources available to Orchestra BioMed to accelerate its product pipeline development and advance partnerships following the company’s completion of a $34 million fi nancing in July 2019. Orchestra BioMed is a biomedical innovation company providing solutions for procedure-based medicine.
• Twin Brook Capital was administrative agent on a debt fi nancing supporting the buyout of Orbus Exhibit & Display Group by Tenex Capital Management. Orbus is a collection of brands positioned to target a specifi c market sector of the signage, events, tradeshow exhibit, and display industries.
Total returnsWeek ended Dec 18 0.17% Average bidWeek ended Dec 11 0.27% As of 12/18/19 96.24
As of 12/11/19 96.21Year to date 12/18/19 6.55% As of 11/29/19 96.12Year to date 12/18/18 2.21%
Par outstandingMarket-value returns As of 12/18/19 $7.0BWeek ended Dec 18 0.04% As of 12/11/19 $7.0BWeek ended Dec 11 0.14% As of 11/29/19 $7.3B
Year to date 12/18/19 -0.64% Market value outstandingYear to date 12/18/18 -4.57% As of 12/18/19 $6.8B
As of 12/11/19 $6.8BAverage nominal spread (L+) As of 11/29/19 $7.0BAs of 12/18/19 469.4As of 11/29/19 467.7 Average tenor
As of 12/18/19 4.92*Average discounted spread (L+) As of 11/29/19 4.84As of 12/18/19 566.9As of 11/29/19 570.0
Number of facilitiesAs of 12/18/19 34As of 12/11/19 34As of 11/29/19 35
Middle-market returns, data for the week ended December 18 (EBITDA of $50M or less)
Source: LCD, and offering of S&P Global Market Intelligence; S&P/LSTA Leveraged Loan Index
*Average discounted spread excludesall facilities in default
Index statistics
Deal size Spread (L+) Floor (bps) Offer price YTM Deal count$200M or less NA NA NA NA 2$201M - $350M 388 75 98.50% 6.31% 4$351M - $500M 328 35 99.30% 5.44% 5$501M+ 292 22 99.63% 5.00% 49$350M or less 404 83 98.58% 6.43% 6
Average new-issue first-lien statistics (last 30 days)
Source: LCD, an offering of S&P Global Market Intelligence
• Twin Brook Capital was administrative agent on a debt fi nancing supporting the buyout of Environmental Lights by Pfi ngsten Partners. San Diego–based Environmental Lights provides LED lighting solutions for the retail display, entertainment, trade show/exhibit, hospitality, and casino gaming industries.
• Tree Line Capital Partners supported the acquisition of Page 1 Solutions by Advice Media via an increase to Advice’s existing term loan and an incremental equity co-investment.
Advice Media provides a patient acquisition and retention platform for healthcare professionals. Page 1 provides digital marketing services for attorneys, plastic surgeons, ophthalmologists, and dentists.
• BMO Sponsor Finance provided fi nancing supporting the dividend recapitalization of Best Lighting Products by Corinthian Capital Group. This is the second announced dividend recapitalization for the fi rm.
• PNC Bank and TCW Asset Management provided debt
December 19, 2019 LCD Weekly Wrap
16
fi nancing supporting the acquisition of Clover Imaging Group by Norwest Equity Partners. The private equity fi rm will acquire the business from 4L Holdings, which operates as Clover Technologies Group. As a result of the transaction, Clover Imaging Group will operate as an independent standalone entity and will no longer be affi liated with 4L Holdings, Clover Technologies Group, or Clover Wireless. Clover Imaging produces remanufactured printer cartridges. The business spans 43 countries, with manufacturing, distribution, collections and sales locations across North America, South America, Asia and Europe.
• Prospect Capital Corp. (Nasdaq: PSEC) purchased $31 million of fi rst-lien senior secured fl oating-rate notes for the recapitalization of Collections Acquisition Company, which does business as Payliance. Payliance is a portfolio company of Serent Capital, a lower-middle market private equity fi rm. Payliance, based in Columbus, Ohio, provides payment processing solutions for Automated Clearing House (ACH), electronic check (eCheck), remotely created check (RCC), debit card, and credit card processing.
• Twin Brook Capital was administrative agent on a debt fi nancing supporting the buyout of Mattco Forge by Blue Point Capital. Mattco is a designer and manufacturer of forged metal products, primarily for the aerospace & defense industry.
• Madison Capital Funding was sole lead arranger and sole lender on a senior debt facility that fi nanced a recapitalization of High Street Insurance Partners by Huron Capital. High Street is a retail insurance brokerage platform that provides commercial property & casualty insurance, employee benefi ts, and personal lines of coverage.
• Monroe Capital was sole lead arranger and administrative agent on a senior credit facility supporting the merger of Anova and Silicon Controls. Based in New Providence, N.J., Anova, a portfolio company of FFL Partners, is a provider of remote asset monitoring solutions for the industrial gas, propane, oil & gas, and fuel & lubes industries. Silicon Controls is the provider of the Gaslog solution and a player in the global liquefi ed petroleum industry.
• Kinderhook Industries has completed a majority recapitalization of Long’s Drugs and PharMedQuest
Pharmacy Services backed by fi nancing that was provided by a syndicate led by Madison Capital Partners, Audax Private Debt, and Antares Capital. Madison Capital was administrative agent on the $380 million senior debt facility that backed the transaction. The acquired businesses provide on-site and central fi ll pharmacy services to healthcare facilities that focus on indigent and underserved populations. Based in Columbia, S.C., Long’s Drugs owns and operates more than 30 pharmacies in the Southeast U.S. under the Avita and Longs brands. PharMedQuest, headquartered in Brea, Calif., owns and operates 28 pharmacies across California.
• Varagon Capital Partners was joint lead arranger, joint bookrunner, and is administrative agent on a senior secured credit facility supporting the acquisition of Heartland Veterinary Partners by Gryphon Investors. Existing investor Tyree & D’Angelo Partners and company management will retain minority stakes in the business. Based in Chicago, Heartland is a veterinary support organization that partners with general practice veterinarians to provide an array of animal health services to companion animals.
• KeyBank provided fi nancing supporting Tower Arch Capital’s recapitalization of Creedence Energy Services. The recapitalization was completed in partnership with the company’s founders. Based in Minot, N.D., Creedence provides production chemicals, acidizing services, and other custom solutions for scale and corrosion prevention to oil and gas providers in the Bakken and Permian basins.
• TCF Middle Market Banking provided secured fi nancing to support Legacy Center. Proceeds will support growth in Legacy’s new facilities and programming. Based in Brighton, Mich., Legacy Center is a destination sports complex.
• Barclays arranged debt fi nancing supporting Gravity’s acquisition of OnPoint Oilfi eld Holdings. Gravity, backed by Clearlake Capital, is a provider of energy infrastructure services to U.S. onshore oil and natural gas exploration and production companies, providing water midstream solutions, critical power generation offerings, and other production-focused services.
• Gladstone Capital provided a debt investment supporting KarpReilly’s investment in Cafe Zupas. Utah-based Cafe Zupas is a healthy fast restaurant brand with 58 company-owned stores across eight states.
LCD Weekly Wrap December 19, 2019
17
Middle Market MiscellanyJohn Martin is joining Victory Park Capital, a Chicago-based alternative investment fi rm, as senior advisor. Martin will support VPC’s private credit strategies, leveraging roughly thirty years of experience in the investment industry.
“Victory Park Capital has built a world-class private credit business with a highly talented and dedicated group of individuals, and I have an immeasurable amount of respect for the fi rm,” said Martin. “I look forward to working closely with this accomplished team to create sustainable value for the fi rm’s clients.”
Martin previously served as managing partner and co-CEO of Antares Capital until May 2019. He helped co-found the fi rm in 1996 and remained as the fi rm was bought fi rst by GE Capital in 2005 and later by CPPIB in 2015.
“We are excited to welcome John, a distinguished industry veteran, to Victory Park Capital,” said Richard Levy, founder and CEO of Victory Park Capital. “His deep private credit expertise and extensive network are truly unrivaled and will be highly valuable in achieving our next phase of growth.”
Also, Siguler Guff plans to expand its credit platform with Michael Apfel joining the fi rm as managing director and head of credit. Apfel will lead the fi rm’s credit platform, which includes special situations, distressed credit, and opportunistic niche credit strategies. Siguler Guff’s credit platform has raised more than $6 billion of committed capital.
Prior to joining Siguler Guff, Apfel was a founding member of MidOcean Credit Partners, where he was a senior portfolio manager and the head of opportunistic credit strategies. Prior to joining MidOcean in 2009, Apfel was a managing director and senior portfolio manager at Deerfi eld Capital Management, where he managed that fi rm’s alternative credit portfolio.
And lastly, Gryphon Investors has held a fi nal close of Gryphon Mezzanine Partners II, L.P. at its cap with $300 million of aggregate commitments. The fund was oversubscribed and closed above its $225 million target. The fund will participate on a minority basis in the junior debt fi nancings of Gryphon portfolio companies, in all cases led by independent third-party lenders. This is the fi rm’s second junior debt fund. Gryphon Mezzanine Partners, L.P., closed in August 2017 at its cap of $105 million.
— Shivan Bhavnani
December 19, 2019 LCD Weekly Wrap
18
Pro rata market: Sticking the landingElsewhere, the last full week ahead of the holidays was a mixed bag of refi nancings and amendments.
Crown Holdings entered into an amendment that provided the company with a $1.1 billion add-on TLA and a €450 million add-on TLA. Proceeds from the add-on TLAs and recently inked issuance of €550 million in unsecured notes were used to refi nance the company’s TLB due 2025, its TLA due 2022, and its euro term loans. The new TLAs mature in fi ve years. The $1.1 billion dollar TLA is priced at L+150. The company also obtained a $1 billion multicurrency revolver, a $600 million dollar revolver, and $50 million Canadian dollar revolver.
In January 2018, Crown obtained the cross-border institutional term loans in connection of its acquisition of Signode.
Hess Midstream Partners obtained a fi ve-year, $1.4 billion pro rata credit facility that includes a $400 million TLA and a $1 billion revolver. Pricing is initially tied to a leverage-based grid, at L+155–250 on the TLA, opening at L+167.5, and at L+127.5–200 on the revolver, opening at L+137.5. Proceeds under the term loan are earmarked to refi nance debt and to fund a sponsor dividend. Houston-based Hess Midstream Partners (NYSE: HESM) owns, operates, develops, and acquires midstream assets and is rated BB+/Ba2/BB+
On the amendment front, Oaktree Capital Management increased the size of the company’s revolver by $150 million, to $650 million, and extended the maturity of the facility to December 2024, from March 2023. Oaktree is a privately owned hedge fund sponsor and is rated A– by S&P Global Ratings and A by Fitch Ratings.
After a dearth of M&A deals throughout much of the fourth
quarter, a trio of M&A transactions this week is helping to send off 2019 on a positive note, adding around $8.6 billion in po tential new money.
Nutrition & Biosciences, a subsidiary of DuPont de Nemours, entered a commitment letter with Morgan Stanley and Credit Suisse providing a $7.5 billion bridge loan facility in connection with its planned spin-off from DuPont and merger with International Flavors & Fragrances via a Reverse Morris Trust transaction valued at $26.2 billion. International Flavors (NYSE: IFF) in the summer of 2018 obtained a $350 million, three-year unsecured A term loan and $1 billion unsecured revolver.
Asbury Automotive, meanwhile, entered into a commitment letter with BofA Securities providing a $650 million bridge loan facility in connection with the company’s acquisition of Park Place Dealerships, which is expected to close in the fi rst quarter of 2020. The acquisition is expected to be funded through a combination of Asbury’s existing credit facilities, cash fl ow from operations, and committed fi nancing arrangements. Asbury Automotive operates as an automotive retailer and is based in Duluth, Ga. Corporate issuer ratings are BB+/Ba2.
WPX Energy entered into a commitment letter with Barclays providing an up to $450 million unsecured bridge loan facility in connection with the company’s planned $2.5 billion acquisition of Felix Energy, which is expected to close in the second quarter of 2020. WPX Energy is an independent oil and natural gas exploration and production company. Corporate issuer ratings are BB–/Ba3.
BBB+/Baa3 PNM Resources extended the maturity of a $150 million term loan the company obtained in December 2018 to June 2021, from December 2019. The amendment also provides customary LIBOR replacement language and changes the defi nition of pricing to L+95, from L+75. MUFG is administrative agent. PNM Resources, through its subsidiaries, engages in energy and energy-related business in the U.S.
Prestige Brands extended the maturity of its asset-based revolver by fi ve years and lowered pricing on the facility to L+100–150, from L+125–175, now opening at L+100. As of Sept. 30, the company had $29 million in outstanding borrowings under the facility, which was previously set to mature in January 2022, and $125 million of additional borrowing capacity. Prestige Brands (NYSE: PBH) markets and distributes brand-name consumer over-the-counter healthcare products and household-cleaning products in the U.S., Canada, and certain international markets. Corporate issuer ratings are B+/B2.
Digi International entered into a $150 million, fi ve-year pro rata credit facility that includes a $100 million TLA and $50 million revolver in connection with its previously announced acquisition of Opengear. Pricing is tied to a leverage-based grid, at L+125–325, opening at L+225. BMO Capital Markets and Silicon Valley Bank acted as joint lead arrangers.
Digi International (Nasdaq: DGII) is a global provider of Internet of Things (IoT) connectivity products, software, and services. Opengear, based in Edison, N.J., is a provider of secure IT infrastructure products and software.
— Richard Kellerhals
LCD Weekly Wrap December 19, 2019
19
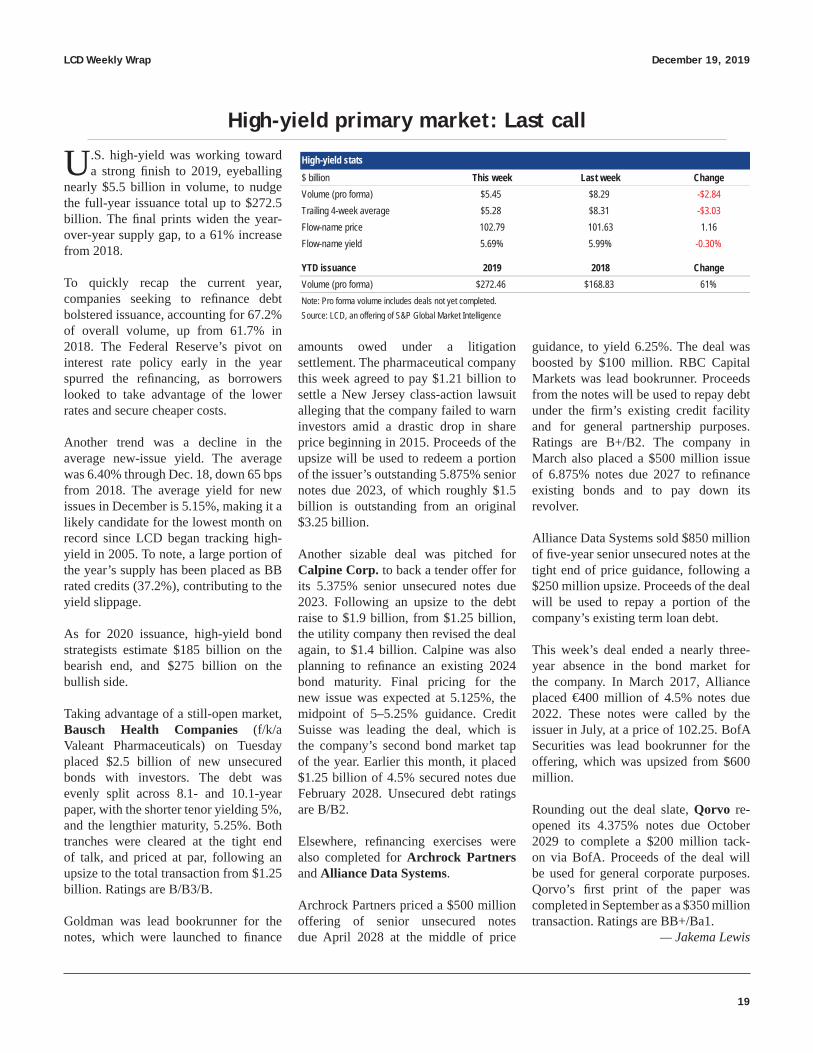
$ billion This week Last week ChangeVolume (pro forma) $5.45 $8.29 -$2.84Trailing 4-week average $5.28 $8.31 -$3.03Flow-name price 102.79 101.63 1.16Flow-name yield 5.69% 5.99% -0.30%
Source: LCD, an offering of S&P Global Market IntelligenceNote: Pro forma volume includes deals not yet completed.
High-yield primary market: Last call
U.S. high-yield was working toward a strong fi nish to 2019, eyeballing
nearly $5.5 billion in volume, to nudge the full-year issuance total up to $272.5 billion. The fi nal prints widen the year-over-year supply gap, to a 61% increase from 2018.
To quickly recap the current year, companies seeking to refi nance debt bolstered issuance, accounting for 67.2% of overall volume, up from 61.7% in 2018. The Federal Reserve’s pivot on interest rate policy early in the year spurred the refi nancing, as borrowers looked to take advantage of the lower rates and secure cheaper costs.
Another trend was a decline in the average new-issue yield. The average was 6.40% through Dec. 18, down 65 bps from 2018. The average yield for new issues in December is 5.15%, making it a likely candidate for the lowest month on record since LCD began tracking high-yield in 2005. To note, a large portion of the year’s supply has been placed as BB rated credits (37.2%), contributing to the yield slippage.
As for 2020 issuance, high-yield bond strategists estimate $185 billion on the bearish end, and $275 billion on the bullish side.
Taking advantage of a still-open market, Bausch Health Companies (f/k/a Valeant Pharmaceuticals) on Tuesday placed $2.5 billion of new unsecured bonds with investors. The debt was evenly split across 8.1- and 10.1-year paper, with the shorter tenor yielding 5%, and the lengthier maturity, 5.25%. Both tranches were cleared at the tight end of talk, and priced at par, following an upsize to the total transaction from $1.25 billion. Ratings are B/B3/B.
Goldman was lead bookrunner for the notes, which were launched to fi nance
amounts owed under a litigation settlement. The pharmaceutical company this week agreed to pay $1.21 billion to settle a New Jersey class-action lawsuit alleging that the company failed to warn investors amid a drastic drop in share price beginning in 2015. Proceeds of the upsize will be used to redeem a portion of the issuer’s outstanding 5.875% senior notes due 2023, of which roughly $1.5 billion is outstanding from an original $3.25 billion.
Another sizable deal was pitched for Calpine Corp. to back a tender offer for its 5.375% senior unsecured notes due 2023. Following an upsize to the debt raise to $1.9 billion, from $1.25 billion, the utility company then revised the deal again, to $1.4 billion. Calpine was also planning to refi nance an existing 2024 bond maturity. Final pricing for the new issue was expected at 5.125%, the midpoint of 5–5.25% guidance. Credit Suisse was leading the deal, which is the company’s second bond market tap of the year. Earlier this month, it placed $1.25 billion of 4.5% secured notes due February 2028. Unsecured debt ratings are B/B2.
Elsewhere, refi nancing exercises were also completed for Archrock Partners and Alliance Data Systems.
Archrock Partners priced a $500 million offering of senior unsecured notes due April 2028 at the middle of price
guidance, to yield 6.25%. The deal was boosted by $100 million. RBC Capital Markets was lead bookrunner. Proceeds from the notes will be used to repay debt under the fi rm’s existing credit facility and for general partnership purposes. Ratings are B+/B2. The company in March also placed a $500 million issue of 6.875% notes due 2027 to refi nance existing bonds and to pay down its revolver.
Alliance Data Systems sold $850 million of fi ve-year senior unsecured notes at the tight end of price guidance, following a $250 million upsize. Proceeds of the deal will be used to repay a portion of the company’s existing term loan debt.
This week’s deal ended a nearly three-year absence in the bond market for the company. In March 2017, Alliance placed €400 million of 4.5% notes due 2022. These notes were called by the issuer in July, at a price of 102.25. BofA Securities was lead bookrunner for the offering, which was upsized from $600 million.
Rounding out the deal slate, Qorvo re-opened its 4.375% notes due October 2029 to complete a $200 million tack-on via BofA. Proceeds of the deal will be used for general corporate purposes. Qorvo’s fi rst print of the paper was completed in September as a $350 million transaction. Ratings are BB+/Ba1.
— Jakema Lewis
December 19, 2019 LCD Weekly Wrap
20
High-yield secondary market: Red hot
The high-yield secondary market continued its recent tear, tracking
stocks higher as trade-truce euphoria built over the course of the week, and impeachment proceedings went largely unnoticed. The CDX HY 33 on Thursday closed at 109.43 after a six-day win streak that propelled the index above 109 for the fi rst time since the summer of 2014, and established the highest closes for an on-the-run CDX HY contract since the 2008 fi nancial crisis.
Energy names led the rally, as crude oil futures headed for three-month highs on the latest sentiment swing and a bullish EIA report. Gulfport Energy’s 6.625% notes due 2023 were up four points on the week, at 81.25, while Transocean’s 7.25% notes due 2025 garnered 3.75 points to trade at 99. Valaris’ 7.75% bonds due 2026 were trading back above 50 for the fi rst time in a month, advancing 5.25 points on the week, to 55. The rates had recently bottomed out at 44.375.
Bonds backing Superior Energy Services (NYSE: SPN) rallied midweek after the oilfi eld services concern announced plans to reduce its outstanding 2021 bonds by $500 million via a debt exchange and extension. The targeted $800 million of 7.125% unsecured notes due 2021 and $500 million issue of 7.75% notes due 2024 both ended the week around 7.5 points higher, at 86 and 68.75, respectively. Meanwhile, a share buyback and ratings downgrade by Moody’s put a crimp in the rally for Antero Resources. The company’s 5% notes due 2025 headed into the weekend almost three points lower, at 75.625.
Healthcare names traded at volume all week amid efforts to revitalize legislation to lower healthcare costs, including surprise billing. In the end, the federal government’s year-end funding bill moved forward without the inclusion of any such language. Envision Healthcare’s 8.75% notes due 2026
gained six points on the week, to trade at 63. The bonds traded at an all-time low of 49.875 on Nov. 25 after legislation stalled earlier in the month. MultiPlan (Polaris Intermediate) 8.5% senior unsecured notes due 2022 traded up at 93.375, from 81 in the middle of November and August lows of 74.25. Team Health 6.375% senior unsecured notes on Monday were up almost 10 points, week on week, at 65.625, and off November lows of 54.75. The bonds headed into Thursday’s close at a weighted average of 67.
Credit-specifi c news generated some outsized moves. Bonds backing Vivint subsidiary APX Group rallied across the deck today following news of an amendment to Vivint’s proposed merger with special purpose acquisition company (SPAC) Mosaic Acquisition Corp. (NYSE: MOSC). The Wednesday regulatory fi ling revealed an additional $100 million investment, which would enable Vivint to retire more debt and lower pro forma net leverage. The APX 7.625% notes due 2023 were the biggest gainers, rising 8.5 points on the news, to trade at 95, after trading in the high 80s since the end of September. Rite Aid’s 6.125% notes due April 2023 gained 4.25
points on Thursday, to trade actively at 88.75, after the pharmacy retailer swung to a profi t and reported better-than-expected results for the third quarter. The bonds have not traded above par since August 2018 following the demise of a proposed merger with Albertsons Companies, and recently tested lows of 81.5.
On the new-issue front, Bausch Health’s new two-part offering of unsecured notes dominated midweek trading volume, booking gains. The $1.25 billion of 5% notes due January 2028 (B/B3/B) were straddling 102 at Thursday’s close, while the same-sized tranche of 5.25% notes due January 2030 traded on either side of 103, from 102.25 on the break. Monday’s solitary new print from Archrock Partners also traded actively at a weighted average of 102. The notes priced mid-guidance at par to yield 6.25%, and broke to a 101.5 context.
Alliance Data Systems proved a less popular trade. The upsized $850 million issue of 4.75% senior unsecured notes due 2024 failed to gain traction above its par issue price.
— Mairin Burns
Issuer Coupon Maturity Rating PriceΔ from last
weekTransdigm 6.25% Mar 2026 B+/B1 108.88 0.75Netflix 5.88% Nov 2028 B+/Ba3 111.25 0.88Bombardier 7.50% Mar 2025 B+/B1 103.25 1.63Tenet Healthcare 6.75% Jun 2023 CCC+/B3 110.00 0.25Chesapeake Energy 8.00% Jan 2025 CCC/Caa2 60.88 3.38Charter/COO Holdings 5.38% Jun 2029 BB/B1 108.00 0.75Valeant Pharmaceuticals 6.13% Apr 2025 B/B1 103.63 -0.38Tesla 5.30% Aug 2025 B-/B3 97.38 0.50Uber Technologies 7.50% Sep 2027 CCC+/B3 102.50 2.75Berry Global 4.88% Jul 2026 BB+/Ba3 106.38 1.63Hilton 4.88% Jan 2030 BB+/Ba1 106.88 0.75Post Holdings 5.50% Dec 2029 B+/B1 106.75 1.50Sirius XM Radio 5.00% Aug 2027 BB/Ba3 105.75 0.50Sprint Corp. 7.88% Sep 2023 B/B3 110.13 1.63Teva Pharmaceutical 6.00% Apr 2024 BB/Ba2 100.25 0.88Average 6.19% 102.79 1.16
as of Dec 19, 2019LCD bond flow names
Source: LCD, an offering of S&P Global Market Intelligence
LCD Weekly Wrap December 19, 2019
21
Fridson: Trade deal rally hints 2019’s laggards now best plays Synopsis: Sector gains in the Dec. 12–13 high-yield rally point to a change in investor risk attitudes. Sectors, and by inference issues, that lagged up until last week now promise to outperform going forward.
High-yield bonds rose along with last Thursday’s stock rally, which was attributed to reports of a U.S.-China trade deal in principle (see note 1). The S&P 500 was only nominally higher on Friday, but the ICE BofAML US High Yield Index tacked a +0.20% price gain onto Thursday’s +0.25% advance. Friday’s high-yield gain rode the coattails of a short-run rebound in Treasuries, which posted price changes of –0.66% on Thursday and +0.59% on Friday. (Note that this piece focuses throughout on price change, rather than total return.)
To put the ICE BofAML US High Yield Index’s Dec. 12 and 13 gains in perspective, they were, respectively, the 18th and 28th biggest one-day gains recorded in 2019’s 262 trading days through last week. Those top-decile (or nearly so) rankings somewhat understate the case. Seven of 2019’s 17 one-day gains that exceeded Thursday’s +0.25% occurred in January. That month encompassed a huge rebound from three consecutive months of declines that had combined for a –6.22% price return on the index. The index’s January advance of +4.03% more than doubled the +1.92% gain in 2019’s second-ranked month, June.
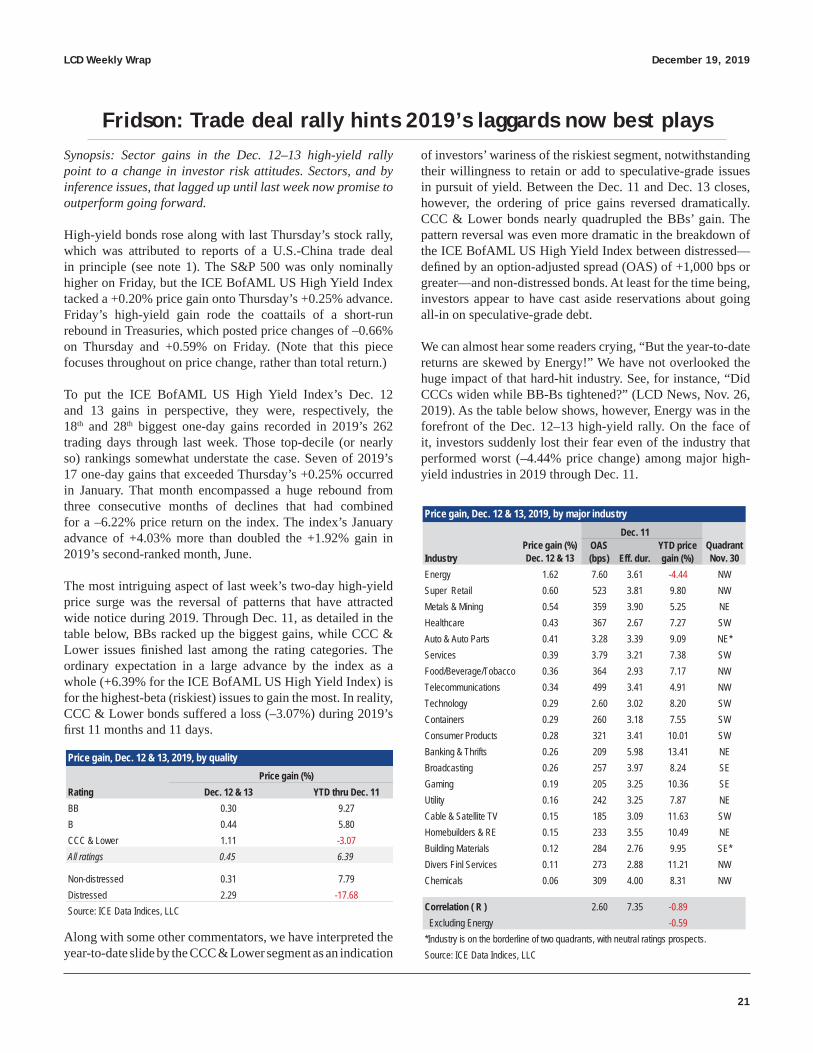
The most intriguing aspect of last week’s two-day high-yield price surge was the reversal of patterns that have attracted wide notice during 2019. Through Dec. 11, as detailed in the table below, BBs racked up the biggest gains, while CCC & Lower issues fi nished last among the rating categories. The ordinary expectation in a large advance by the index as a whole (+6.39% for the ICE BofAML US High Yield Index) is for the highest-beta (riskiest) issues to gain the most. In reality, CCC & Lower bonds suffered a loss (–3.07%) during 2019’s fi rst 11 months and 11 days.
of investors’ wariness of the riskiest segment, notwithstanding their willingness to retain or add to speculative-grade issues in pursuit of yield. Between the Dec. 11 and Dec. 13 closes, however, the ordering of price gains reversed dramatically. CCC & Lower bonds nearly quadrupled the BBs’ gain. The pattern reversal was even more dramatic in the breakdown of the ICE BofAML US High Yield Index between distressed—defi ned by an option-adjusted spread (OAS) of +1,000 bps or greater—and non-distressed bonds. At least for the time being, investors appear to have cast aside reservations about going all-in on speculative-grade debt.
We can almost hear some readers crying, “But the year-to-date returns are skewed by Energy!” We have not overlooked the huge impact of that hard-hit industry. See, for instance, “Did CCCs widen while BB-Bs tightened?” (LCD News, Nov. 26, 2019). As the table below shows, however, Energy was in the forefront of the Dec. 12–13 high-yield rally. On the face of it, investors suddenly lost their fear even of the industry that performed worst (–4.44% price change) among major high-yield industries in 2019 through Dec. 11.
Correlation ( R ) 2.60 7.35 -0.89 Excluding Energy -0.59
Source: ICE Data Indices, LLC
Price gain, Dec. 12 & 13, 2019, by major industry
*Industry is on the borderline of two quadrants, with neutral ratings prospects.
Price gain (%) Dec. 12 & 13
Quadrant Nov. 30
Along with some other commentators, we have interpreted the year-to-date slide by the CCC & Lower segment as an indication
December 19, 2019 LCD Weekly Wrap
22
Granted, Energy’s +1.62% two-day gain occurred in conjunction with a +1.40% rise in the Generic 1st Crude Oil, West Texas Intermediate (WTI) contract. One might argue that because oil is not a conspicuous benefi ciary of de-escalation in U.S.-China trade tensions, it was only coincidental that Energy and the rest of the high-yield market both rallied sharply last Thursday and Friday.
We reject that argument on two grounds. First, from its recent low on Oct. 15, the WTI price rose by +11.3% through Dec. 11, yet over that same interval the ICE BofAML US High Yield Energy Index’s price fell (–1.05%) while the non-Energy component of the ICE BofAML US High Yield Index gained +0.30%, by our calculation. If rising crude prices failed to rally Energy over the preceding two months, why would they do so over the next two days? Our second refutation of the conjecture that Energy’s two-day rally was independent of the price surge in the rest of the high-yield universe is that the ICE BofAML US High Yield Energy Index advanced on both Dec. 12 (+0.82%) and Dec. 13 (+0.79%), even though WTI’s net two-day +1.40% gain broke down into moves of –0.80% on Thursday and +2.23% on Friday. (These calculations are affected by rounding.)
In short, the evidence upholds the thesis that beginning on Dec. 12 high-yield investors became more risk-tolerant across a broad front. That would be consistent with the view that consequential progress on the trade negotiation eliminated at least some of the uncertainty that had been making corporations cautious about capital spending. By extension, the progress indicated by agreement on a “phase one” trade deal reduced near-term recession risk.
Which high-yield assets will benefi t most?For high-yield managers who are willing to bet that the trend in credit risk tolerance turned a corner last week, CCC & Lower bonds now look more attractive than a short while ago. Note that on a separate track, our valuation-driven analysis upgraded the CCC & Lower segment from Neutral to Overweight on Dec. 3. That recommendation worked out pretty well through Dec. 13. The ICE BofAML CCC & Lower US High Yield Index gained +3.07%, versus “only” +0.97% for the ICE BofAML BB-B US High Yield Index.
How about industry selection? Should portfolio managers be stepping up their exposure to cyclicals, to the cheapest industries, or something else? A rational basis for deciding emerges from the preceding table, which ranks the 20 largest high-yield industries by Dec. 12–13 price gain.
A key assumption is that the adjustments to the new conditions were not entirely implemented in the space of two trading
days. If the realignment that began on Thursday and Friday continues for a while, then the kind of industry, and arguably issue, that did particularly well on those two days should continue to excel for some time. What, then, defi nes winners in the current environment, keeping in mind that the same traits might well apply at the individual security level?
The table above examines four characteristics that might explain the Dec. 12–13 comparative industry price returns:
1. Option-adjusted spread as of Dec. 11. Given that the lowest agency-rated issues racked up the biggest two-day gain, the best industry performers might be those with the worst “market ratings” (spreads).
2. Effective duration as of Dec. 11. Interest rates would be expected to increase in a strengthening economy. Perhaps, then, the biggest winners going forward will be the industries best equipped to withstand the headwinds of rising Treasury yields, i.e., those with the shortest durations.
3. Year-to-date price gain through Dec. 11. Investors might be going after the industries that most severely lagged the market through last Wednesday, reasoning that it was primarily the risk of all-out trade war that held them back until Dec. 12.
4. Industry relative value (“Quadrant”) at the end of November. This relative value analysis methodology was introduced in “New industry analysis shows defensives too tight” (LCD News, June 5, 2013). It measures how rich or cheap each major high-yield industry is, on a rating-for-rating basis, versus its peers. The methodology also addresses the fact that one would expect an industry with positive ratings prospects (outlooks and watchlistings) to trade rich versus its ratings and one with negative ratings prospects to trade cheap versus its ratings. The output of this analysis is the placement of the 20 industries in quadrants:
a. Northeast (cheap to ratings despite positive ratings prospects)
b. Southeast (rich to ratings, with positive ratings prospects)
c. Southwest (rich to ratings despite negative ratings prospects)
d. Northwest (cheap to ratings, with negative ratings prospects)
LCD Weekly Wrap December 19, 2019
23
The table shows that industry price gains have correlations of just 2.60% with OAS and 7.35% with effective duration. Those fi gures are far below the threshold of 50% for a positive correlation that a basic source on statistics deems to be worth getting excited about. In short, investors should not regard either interest rate sensitivity or spread-versus-Treasuries as a criterion for industry (or by extension, individual security) selection at present.
What portfolio managers should pay attention to is year-to-date relative price performance through Dec. 11. The correlation between that factor and last week’s two-day price advance was –0.89. That is, there was a a very strong tendency for industries that performed relatively poorly up until the market took off on Dec. 12 to do especially well once the trade clouds began to part.
Admittedly, Energy was an outlier in this statistical analysis, with by far the worst pre-Dec. 12 price performance (–4.44%) and by far the best two-day price gain (+1.62%) thereafter. Therefore, we also calculated the correlation excluding Energy.
The resulting correlation, –0.59%, qualifi es as a meaningfully negative correlation. We conclude that portfolio managers are well advised to employ pre-Dec. 12 price performance as a factor in their present sector and security selection.
As for the fi nal factor in the table, our relative value analysis cannot be summarized with a correlation statistic, but the distribution of the quadrant locations provides at least a bit of useful guidance. The SE designations are concentrated in the bottom half of the price-gain rankings. This suggests that at present, high-yield portfolio managers should avoid industries
(or issues) that are expensive versus like-rated peers because the market and the rating agencies agree that they have positive credit trends. This factor can be used as a secondary selection factor, to narrow down the initial list of purchase candidates chosen by pre-Dec. 12 price performance.
Marty Fridson, Chief Investment Offi cer of Lehmann Livian Fridson Advisors LLC, is a contributing analyst to S&P Global Market Intelligence. His weekly leveraged fi nance commentary appears exclusively on LCD, an offering of S&P Global Market Intelligence. Marty can be reached at [email protected].
Research assistance by Xiangyu Meng and Zohaib Moonis.
Notes1. Lewis Krauskopf “Wall Street hits records on news of U.S.-China trade deal,” Reuters (Dec. 12, 2019), reported, “Stocks were boosted in the morning when President Donald Trump tweeted that the United States was close to a deal ahead of Sunday, when a new round of tariffs on Chinese goods has been set to go into effect. Later in the day, reports emerged that the two countries had reached a deal in principle.”
December 19, 2019 LCD Weekly Wrap
24
High-grade market: High performing
One day One week One month YTD 3-month average YTD range YTD total return 3-month total returnHigh-grade Treasury spread (OAS, bps) 97 -1 -4 -8 -50 107 97 - 150 12.78% 1.60% Yield (%) 2.86% 1 5 1 -123 2.86% 2.75% - 4.14%
U.S. corporate bond spreads and yields: December 18, 2019 (changes in bps)
The high-grade primary market remained shuttered this week,
potentially setting CIBC’s $1.25 billion offering of 2023 FRNs on Dec. 10 as the fi nal offering of a strong year for high-grade corporate bonds. Issuance for the month held at $19 billion, and the YTD total at $1.056 trillion, the latter just 2.3% off the 2018 full-year total.
Through yesterday, the total return for the S&P U.S. Investment Grade Corporate Bond Index stood at 12.78%, only moderately lagging the 14.13% performance for the S&P U.S. High Yield Corporate Bond Index. Driving those gains, the IG index spread, at T+97 this week, marked a low since February 2018, and refl ected tightening this year from the interim peak at T+150 in early January.
Meanwhile, index returns have ceded little ground to price movements in the fourth quarter, as the index price (108.07% of par, versus 99.5 at the start of the year) and yield to maturity (2.86%, versus 4.1% at the start of the year) as of Dec. 18 held exactly in line with trailing three-month averages.
Indeed, high-grade corporate bonds are on track for the highest annual returns in 2019 since the IG index roared back from the late-2008 fi nancial crisis with a 15.64% return in 2009. The average annual return over the 10 years through 2018 was 5.45%, including a 1.8% loss last year.
In 2018, index prices fell roughly six points, spreads widened about 60 bps, and yields increased almost a full percentage point, all under the assumption—shattered in February this year—that the Fed would be on hawkish footing in 2019.
Annualized IG bond performance had held pace with high-yield counterparts into the early part of December, which had set the stage for potentially a rare outperformance by the lower-beta IG category in a positive year for corporate credit. Over the last quarter century, in years when both the IG and HY broad indices have posted total return gains, the IG category has outperformed in only 1995 (20% versus 19%), 1998 (9% versus 2.4%), 2001 (10% versus 5%), 2007 (5.2% versus 2%), 2011 (7.3%
versus 5.4%), and 2014 (7.2% versus 2.3%).
Berkshire Hathaway Finance’s 4.25% issue of bonds due Jan. 15, 2049 serves as an illustration of the glide path for low-beta bonds since the Fed’s dovish pivot. The issuer was fi rst out of the gate in 2019 with a $1.25 billion placement of the bonds on Jan. 3, at an OID of 98.98. The notes would slip to 98.25 by mid-January, but surged to 104 after the Fed in early February hit the brakes on further rate increases amid warning signals about global growth. The notes traded this week at prices on either side of 118% of par, leaving yield levels roughly a full percentage point below the coupon rate.
More recent placements are grinding tighter into year-end as well. The Truist Bank 2.15% notes due 2024—placed by BB&T on Dec. 3 ahead of its merger with SunTrust and subsequent renaming as Truist—traded today at T+48, from T+65 at pricing. December prints for Quest Diagnostics, Steel Dynamics, Welltower, Cameron LNG, and Broadridge Financial all traded 10– 15 bps through issuance.
— John Atkins/Gayatri Iyer
LCD Weekly Wrap December 19, 2019
25
Distressed market: Small akorns
Shares of generic pharmaceuticals manufacturer Akorn fell toward a
record low this week after the company disclosed it could look to fi le for bankruptcy protection.
Lenders again signed on to a standstill agreement with respect to defaults stemming from certain covenant breaches, according to a Form 8-K fi led with the Securities and Exchange Commission.
Akorn has become increasingly challenged amid heightened competition, expenses, pricing pressure, and most recently, issues stemming from problems at its Decatur manufacturing facility and subsequent litigation with investors.
CEO Doug Boothe said in a statement that the agreement provides additional time for Akorn to evaluate strategic alternatives to address the litigation-related liabilities.
According to the company’s fi ling with the SEC, these alternatives could include a restructuring, with a Chapter 11 fi ling under the U.S. Bankruptcy Code also a possibility.
The extension runs from Dec. 13, 2019, to Feb. 7, 2020, at which point the company is required under the terms of the agreement to have entered into a comprehensive amendment to its term loan agreement, effectively requiring it to address its $843 million TLB due
2021—a constituent of the S&P/LSTA Leveraged Loan Index.
Other milestones include the submission of the amendment proposal by Jan. 10, 2020, and reaching an agreement in principle with respect to the Comprehensive Amendment by Feb. 5, 2020.
The company has also agreed, as put in place in the original May 2019 standstill
Issuer Deal date Default dateInitial inst'l amount
($M)4L Technologies Apr 4, 2014 Dec 11, 2019 760Acosta Inc Aug 14, 2014 Nov 15, 2019 2,065David's Bridal Jan 18, 2019 Nov 5, 2019 240Drive Medical Dec 22, 2016 Oct 7, 2019 597Murray Energy Jun 29, 2019 Oct 4, 2019 1,745Sheridan Production Partners I Oct 18, 2012 Oct 3, 2019 1,000Deluxe Entertainment Jun 26, 2014 Oct 3, 2019 880Blackhawk Mining LLC Jan 13, 2017 Jul 19, 2019 957Weatherford International Ltd. May 4, 2016 Jul 1, 2019 500Monitronics International Inc Sep 8, 2016 Jun 30, 2019 1,100Legacy Reserves Mar 21, 2014 Jun 18, 2019 400Neiman Marcus Oct 7, 2013 Jun 11, 2019 2,950Sheridan Production Partners Dec 2, 2013 Jun 1, 2019 800Empire Generating Feb 6, 2014 May 19, 2019 460Fusion Telecommunications Feb 15, 2018 Apr 4, 2019 595Crossmark Holdings Aug 5, 2013 Apr 15, 2019 515Southcross Energy Partners Aug 4, 2014 Apr 1, 2019 450Sungard Availability Services Inc Jul 17, 2017 Apr 1, 2019 471CTI Foods Jun 28, 2013 Mar 11, 2019 485Windstream Corp. Nov 20, 2013 Feb 25, 2019 1,927Ditech Holding Corp Feb 9, 2018 Feb 11, 2019 1,500Charlotte Russe Inc. Feb 2, 2018 Feb 3, 2019 90API Heat Transfer ThermaSys May 3, 2013 Jan 15, 2019 265Total 20,752
Loan defaults tracked by LCD in the year to date
Source: LCD, an offering of S&P Global Market Intelligence
agreement, to several surveillance measures including delivering monthly fi nancial statements, 13-week cash fl ow forecasts and variance reports, as well as certain regulatory information.
Lenders will be paid a fee equal to 1.5% of the principal outstanding of its term loans (up from 0.625% for the fi rst standstill period), as well a one-time in-kind fee in an amount equal to 1.5% of
December 19, 2019 LCD Weekly Wrap
26
the aggregate principal amount of the loans of the standstill lender.
Finally, the interest rate on its outstanding loan is increased further, by 3%, with a 75 bps increase payable in cash, and the remainder payable in kind.
The company’s originally $831 million B term loan due 2021 (L+520, 1% LIBOR fl oor) was allocated in 2013 to back the company’s acquisition of Hi-Tech Pharmacal. The company later priced a $445 million add-on acquisition of VPI Holdings, the parent company of VersaPharm. J.P. Morgan is admin agent on the loans.
Akorn stock, which trades on the Nasdaq under the ticker AKRX, fell 29% from the time of the fi ling, to $2.19 at Wednesday’s close.
FELP needs helpThermal coal producer Foresight Energy, meanwhile, has commenced a solicitation for consent to a proposed amendment that would extend the grace period on the company’s missed Oct. 1 interest payment on its 11.50% second-lien notes due 2023 to 150 days, from the previously extended 90 days, and 30 days originally.
According to a Form 8-K fi led with the Securities and Exchange Commission, the consent solicitation, scheduled to expire at 5 p.m. EST on Dec. 19, also eliminates the requirement that the issuer hold a publicly accessible conference call to discuss its fi nancial situation.
The company on Oct. 1 deferred a $24.4 million interest payment on the $425 million bond issue, triggering a standard 30-day grace period.
Foresight in 2016 completed an out-of-court restructuring after a Delaware court ruled that the company’s “partnership” deal implemented by now-bankrupt principal equity holder Murray Energy demonstrated a “de facto” change in control, putting Foresight on the hook to repay a $600 million bond issue at 101%.
The company placed the second-lien bonds in 2017.
Proceeds of that offering, alongside an $825 million, fi ve-year fi rst-lien term loan and $78 million of balance-sheet cash and an equity investment from Murray Energy, were used to repay existing debt.
Foresight operates four mining complexes in the Illinois Basin.
— Rachelle Kakouris
LCD Weekly Wrap December 19, 2019
27
S&P/LSTA Leveraged Loan Index
All LoansPerforming
Loans BB B CCC All LoansPerforming
Loans BB B CCCTOTAL RETURNS INDEX STATISTICSWeek ended 12/18/19 0.57% 0.63% 0.25% 0.68% 1.59% Average BidWeek ended 12/11/19 0.55% 0.60% 0.31% 0.70% 0.79% As of 12/18/19 96.59 96.63 99.59 97.48 82.55
As of 12/11/19 96.09 96.10 99.40 96.96 81.22Month to date 12/18/19 1.28% 1.39% 0.65% 1.55% 2.76% As of 12/31/18 93.84 94.16 95.29 94.62 85.32Year to date 12/18/19 8.30% 8.32% 9.07% 8.56% 2.92%Year to date 12/18/18 1.40% 1.56% 0.53% 1.84% 3.42% Par outstanding
As of 12/18/19 $1189.7B $1072.0B $285.6B $677.8B $83.3BMARKET VALUE RETURNS As of 12/11/19 $1191.2B $1072.1B $288.5B $672.6B $85.6BWeek ended 12/18/19 0.46% 0.52% 0.16% 0.56% 1.41% As of 12/31/18 $1147.0B $1007.6B $307.7B $608.8B $72.3BWeek ended 12/11/19 0.44% 0.48% 0.23% 0.58% 0.62%
Market value outstandingYear to date 12/18/19 2.24% 2.04% 3.85% 2.10% -6.28% As of 12/18/19 $1149.1B $1035.9B $284.4B $660.7B $68.7BYear to date 12/18/18 -3.74% -3.80% -3.96% -3.72% -4.78% As of 12/11/19 $1144.6B $1030.3B $286.7B $652.1B $69.5B
As of 12/31/18 $1076.4B $948.8B $293.2B $576.1B $61.7BAVERAGE NOMINAL SPREAD (L+)As of 12/18/19 350.9 350.9 265.2 381.6 572.2 Average tenorAs of 11/29/19 349.7 349.7 266.1 381.4 560.8 As of 12/18/19 4.90 4.90 5.25 4.88 3.93
As of 11/29/19 4.92 4.92 5.28 4.91 4.04AVERAGE DISCOUNTED SPREAD (L+)As of 12/18/19 425.6 425.6 274.2 444.2 1215.1 Number of facilitiesAs of 11/29/19 449.2 449.2 284.8 474.8 1307.3 As of 12/18/19 1458 1361 305 789 204
As of 12/11/19 1460 1363 309 784 206As of 12/31/18 1424 1319 318 758 193
DEFAULT STATISTICS (last 12 months)Nov 2019 * Average Discounted Spread excludes facilities in defaultOct 2019Nov 2018
1.43%
Number of issuersLagging 12-month default
rate
Source: LCD, an offering of S&P Global Market Intelligence
1818151.61%
1.48%
The S&P/LSTA Leveraged Loan Index returned 0.57% for the week
ended Dec. 18, bringing year-to-date loan returns to 8.30%, up from 1.40% during the same period in 2018. BB loans returned 0.25% for the week. Single-B loans returned 0.68%. CCC loans returned 1.59%.
In the year to date, the All Loans Index has underperformed the BB Loans Index, at 8.30% to 9.07%. Single-B loans have returned 8.56%, while CCC loans have returned 2.92%. BB loans have outperformed compared to the same period last year, when they returned 0.53%. Single-B loans have outperformed compared to the same period last year, when they returned
1.84%. CCC loans have underperformed compared to the same period last year, when they returned 3.42%.
Middle-market loans returned 0.17% for the week ended Dec. 18, for a year-to-date return of 6.55%. Middle-market loans have outperformed compared to the same period last year when they returned 2.21%.
Bid prices for the indices were higher during the week. The All Loans Index gained 50 bps, to 96.59. Performing loans gained 53 bps, to 96.63. BB loans gained 19 bps, to 99.59, while single-B loans gained 52 bps, to 97.48. CCC loans gained 133 bps, to 82.55, while middle-market loans gained three basis points, to 96.24.
For the week, loan returns were in the middle of the pack. The overall Index returned 0.566%. The BAML US High Yield Index returned 1.110%, and 10-year Treasury returned negative 1.172%. The BAML US Corporate Index returned negative 0.332%. The S&P 500 returned 1.620%.
No content (including ratings, credit-related analyses and data, valuations, model, software or other application or output therefrom) or any part thereof (Content) may be modifi ed, reverse engineered, reproduced or distributed in any form by any means, or stored in a database or retrieval system, without the prior written permission of S&P Global Market Intelligence or its affi liates (collectively, S&P). The Content shall not be used for any unlawful or unauthorized purposes. S&P and any third-party providers, as well as their directors, offi cers, shareholders, employees or agents (collectively S&P Parties) do not guarantee the accuracy, completeness, timeliness or availability of the Content. S&P Parties are not responsible for any errors or omissions (negligent or otherwise), regardless of the cause, for the results obtained from the use of the Content, or for the security or maintenance of any data input by the user. The Content is provided on an “as is” basis. S&P PARTIES DISCLAIM ANY AND ALL EXPRESS OR IMPLIED WARRANTIES, INCLUDING, BUT NOT LIMITED TO, ANY WARRANTIES OF MERCHANTABILITY OR FITNESS FOR A PARTICULAR PURPOSE OR USE, FREEDOM FROM BUGS, SOFTWARE ERRORS OR DEFECTS, THAT THE CONTENT’S FUNCTIONING WILL BE UNINTERRUPTED OR THAT THE CONTENT WILL OPERATE WITH ANY SOFTWARE OR HARDWARE CONFIGURATION. In no event shall S&P Parties be liable to any party for any direct, indirect, incidental, exemplary, compensatory, punitive, special or consequential damages, costs, expenses, legal fees, or losses (including, without limitation, lost income or lost profi ts and opportunity costs or losses caused by negligence) in connection with any use of the Content even if advised of the possibility of such damages.
Credit-related and other analyses, including ratings, and statements in the Content are statements of opinion as of the date they are expressed and not statements of fact. S&P Global Market Intelligence’s opinions, analyses and rating acknowledgment decisions (described below) are not recommendations to purchase, hold, or sell any securities or to make any investment decisions, and do not address the suitability of any security. S&P Global Market Intelligence assumes no obligation to update the Content following publication in any form or format. The Content should not be relied on and is not a substitute for the skill, judgment and experience of the user, its management, em-ployees, advisors and/or clients when making investment and other business decisions. S&P Global Market Intelligence does not act as a fi duciary or an investment advisor except where registered as such. While S&P Global Market Intelligence has obtained information from sources it believes to be reliable, S&P Global Market Intelligence does not perform an audit and undertakes no duty of due diligence or independent verifi cation of any information it receives.
S&P keeps certain activities of its business units separate from each other in order to preserve the independence and objectivity of their respective activities. As a result, certain business units of S&P may have information that is not available to other S&P business units. S&P has established policies and procedures to maintain the confi dentiality of certain non-public information received in connection with each analytical process.
S&P may receive compensation for its ratings and certain analyses, normally from issuers or underwriters of securities or from obligors. S&P reserves the right to disseminate its opinions and analyses. S&P’s public ratings and analyses are made available on its Web sites, www.standardandpoors.com (free of charge), and www.ratingsdirect.com and www.globalcreditportal.com (subscription), and may be distributed through other means, including via S&P publications and third-party redistributors. Additional information about our ratings fees is available at www.standardandpoors.com/usratingsfees.
Merrill Lynch, Pierce, Fenner & Smith Incorporated and its affi liates (“BofAML”) indices and related information, the name “Bank of America Merrill Lynch”, and related trademarks, are intellectual property licensed from BofAML, and may not be copied, used, or distributed without BofAML’s prior written approval. The licensee’s products have not been passed on as to their legality or suitability, and are not regulated, issued, endorsed, sold, or promoted by BofAML. BOFAML MAKE NO WARRANTIES AND BEAR NO LIABILITY WITH RESPECT TO THE INDICES, INDEX DATA, ANY RELATED DATA, ITS TRADEMARKS, OR THE PRODUCT(S) (INCLUDING WITHOUT LIMITATION, THEIR QUALITY, ACCURACY, SUITABILITY AND/OR COMPLETENESS).