28
Antti Salonen KPP227 KPP227 1 Antti Salonen

Antti Salonen
KPP227
KPP227 1 Antti Salonen
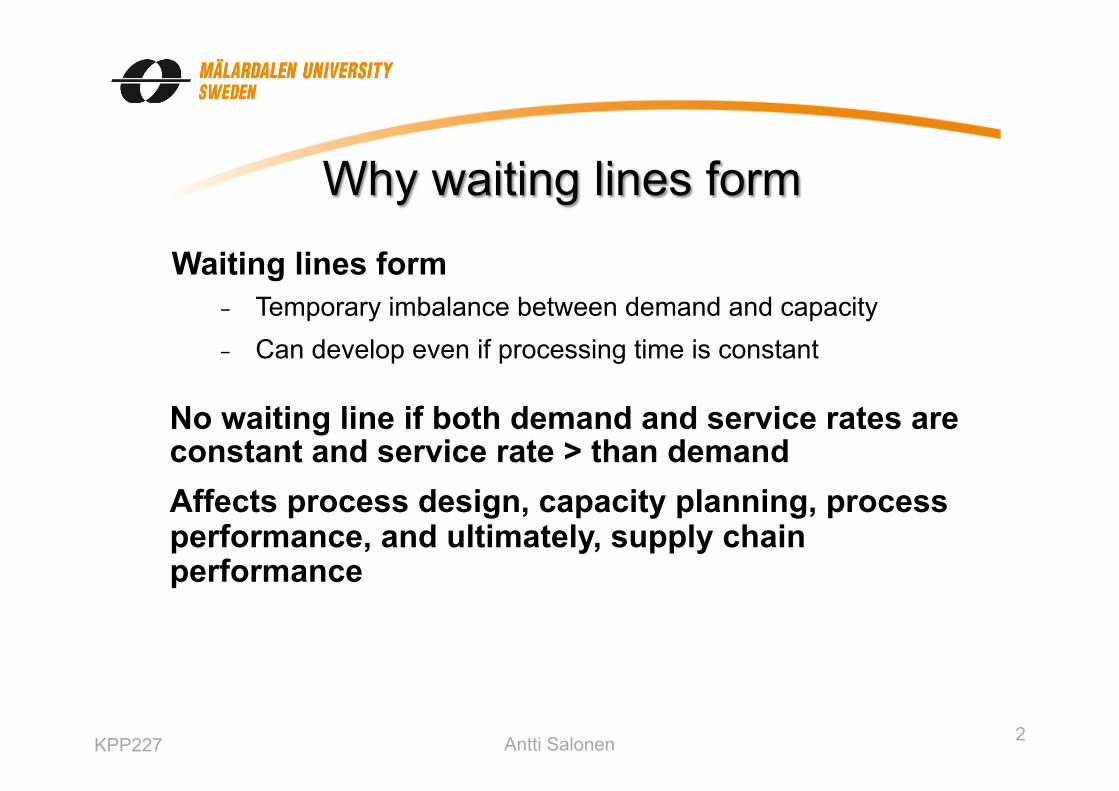
Why waiting lines form Waiting lines form
- Temporary imbalance between demand and capacity - Can develop even if processing time is constant
No waiting line if both demand and service rates are constant and service rate > than demand Affects process design, capacity planning, process performance, and ultimately, supply chain performance
KPP227 2 Antti Salonen

Use of waiting-line theory Applies to many service or manufacturing situations
– Relating arrival and service-system processing characteristics to output
Service is the act of processing a customer - Hair cutting in a hair salon - Satisfying customer complaints - Processing production orders - Theatergoers waiting to purchase tickets - Trucks waiting to be unloaded at a warehouse - Patients waiting to be examined by a physician
KPP227 3 Antti Salonen
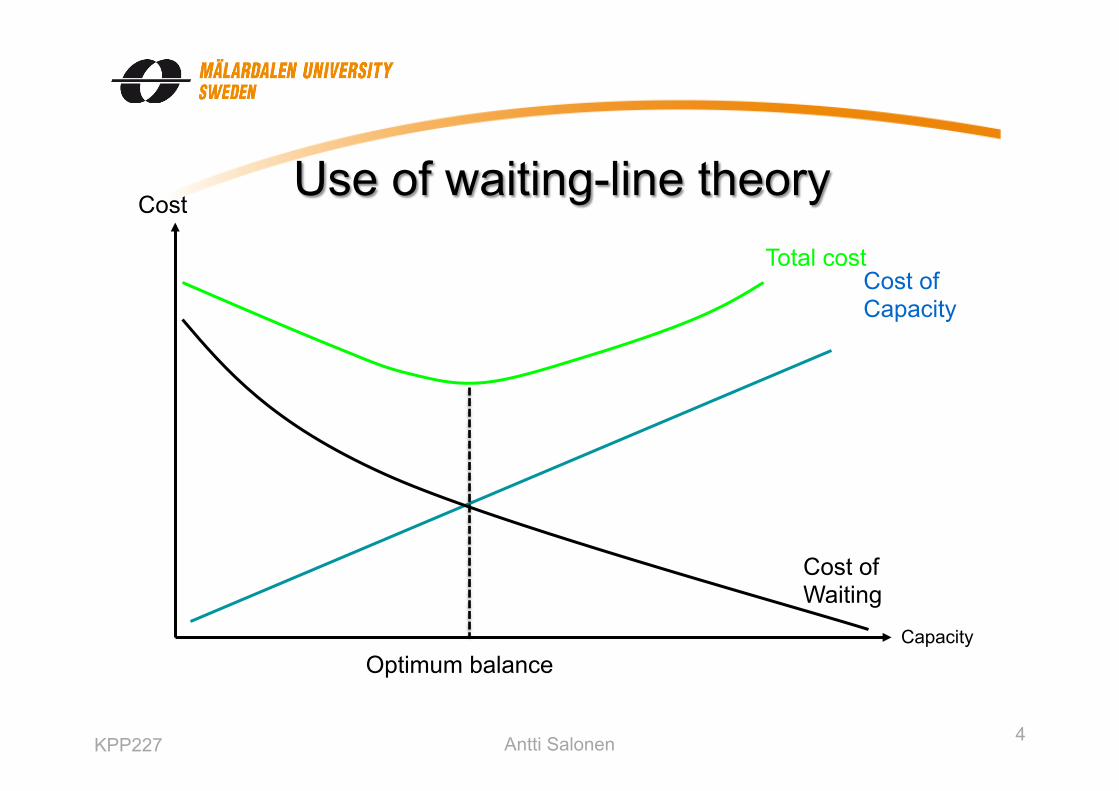
Use of waiting-line theory Cost
Capacity
Cost of Capacity
Cost of Waiting
Total cost
Optimum balance
KPP227 4 Antti Salonen

Use of waiting-line theory
Operating characteristics – Line length – Number of customers in system – Waiting time in line – Total time in system – Service facility utilization
KPP227 5 Antti Salonen

Structure of waiting-line problems Customer population
Service system
Waiting line
Priority rule
Service facilities
Served customers
KPP227 6 Antti Salonen
Customer population The source of input
Customers are patient or impatient - Patient customers wait until served - Impatient customer either balk or join the line and renege
Finite or infinite source - Customers from a finite source reduce the chance of new
arrivals - Customers from an infinite source do not affect the
probability of another arrival
KPP227 7 Antti Salonen
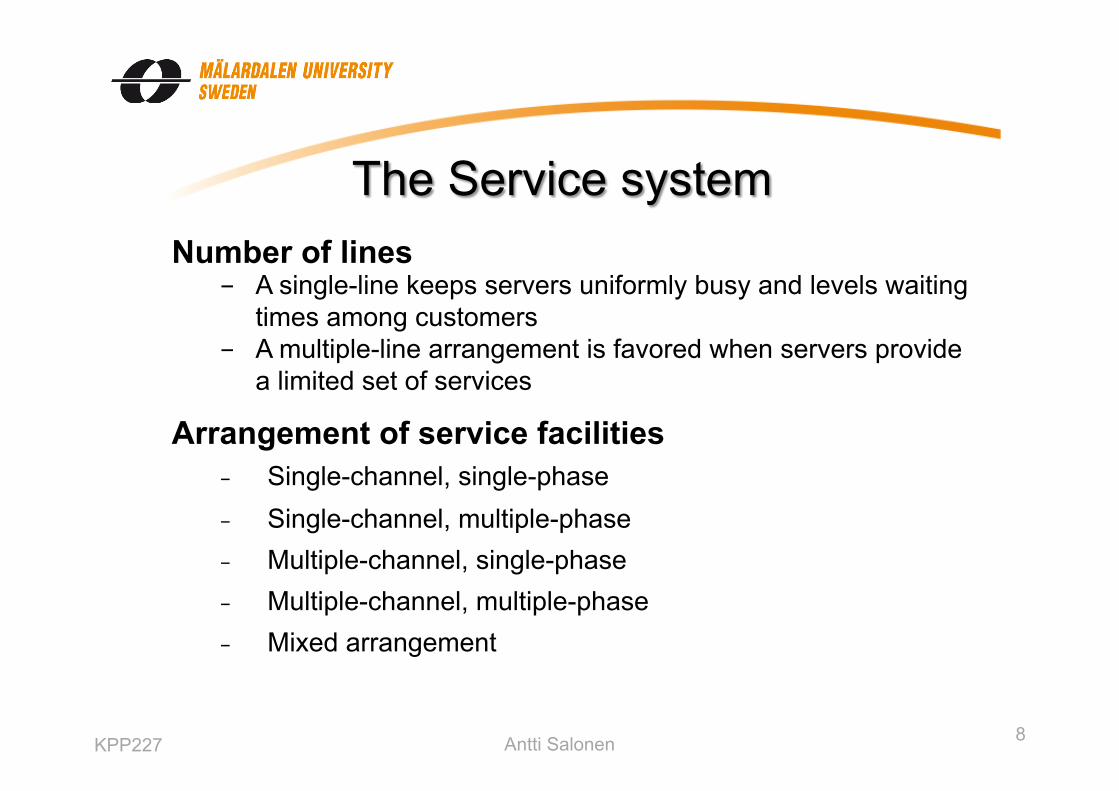
The Service system
Arrangement of service facilities - Single-channel, single-phase - Single-channel, multiple-phase - Multiple-channel, single-phase - Multiple-channel, multiple-phase - Mixed arrangement
Number of lines - A single-line keeps servers uniformly busy and levels waiting
times among customers - A multiple-line arrangement is favored when servers provide
a limited set of services
KPP227 8 Antti Salonen

The Service system
Service facilities
(a) Single line
Service facilities
(b) Multiple lines
KPP227 9 Antti Salonen
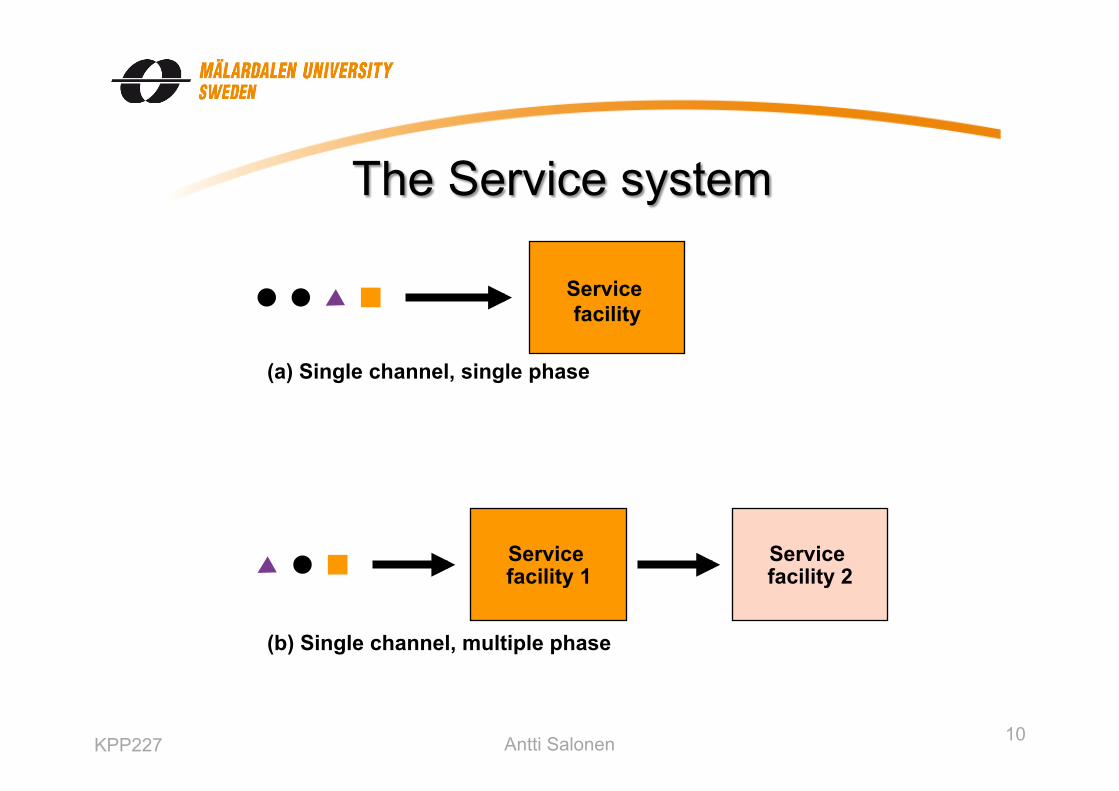
The Service system
Service facility
(a) Single channel, single phase
(b) Single channel, multiple phase
Service facility 1
Service facility 2
KPP227 10 Antti Salonen

The Service system
(c) Multiple channel, single phase
Service facility 1
Service facility 2
Service facility 3
Service facility 4
Service facility 1
Service facility 2
(d) Multiple channel, multiple phase
KPP227 11 Antti Salonen

The Service system Routing for : 1–2–4 Routing for : 2–4–3 Routing for : 3–2–1–4
(e) Mixed arrangement
Service facility 1
Service facility 4
Service facility 3
Service facility 2
KPP227 12 Antti Salonen
Priority rules First-come, first-served (FCFS)—used by most service systems (Also known as FIFO: first-in, first-out)
Other rules, e.g. - Last in, first out (LIFO) - Earliest due date (EDD) - Shortest processing time (SPT)
KPP227 13 Antti Salonen
Probability distributions The sources of variation in waiting-line problems come from the random arrivals of customers and the variation of service times
Arrival distribution - Customer arrivals can often be described by the
Poisson distribution with mean = λT and variance also = λT
- Arrival distribution is the probability of n arrivals in T time periods
- Interarrival times are the average time between arrivals
KPP227 14 Antti Salonen
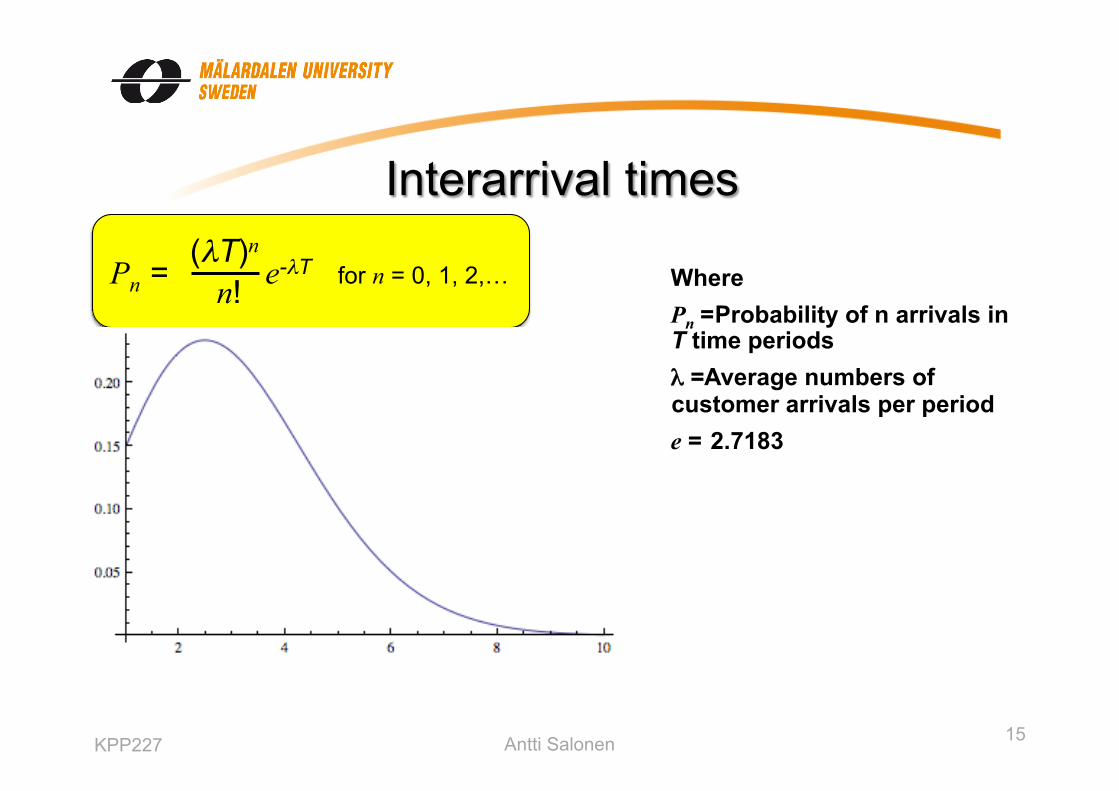
Interarrival times
Pn = e-λT for n = 0, 1, 2,… (λT)n
n! Where Pn = Probability of n arrivals in T time periods λ = Average numbers of customer arrivals per period e = 2.7183
15 Antti Salonen KPP227
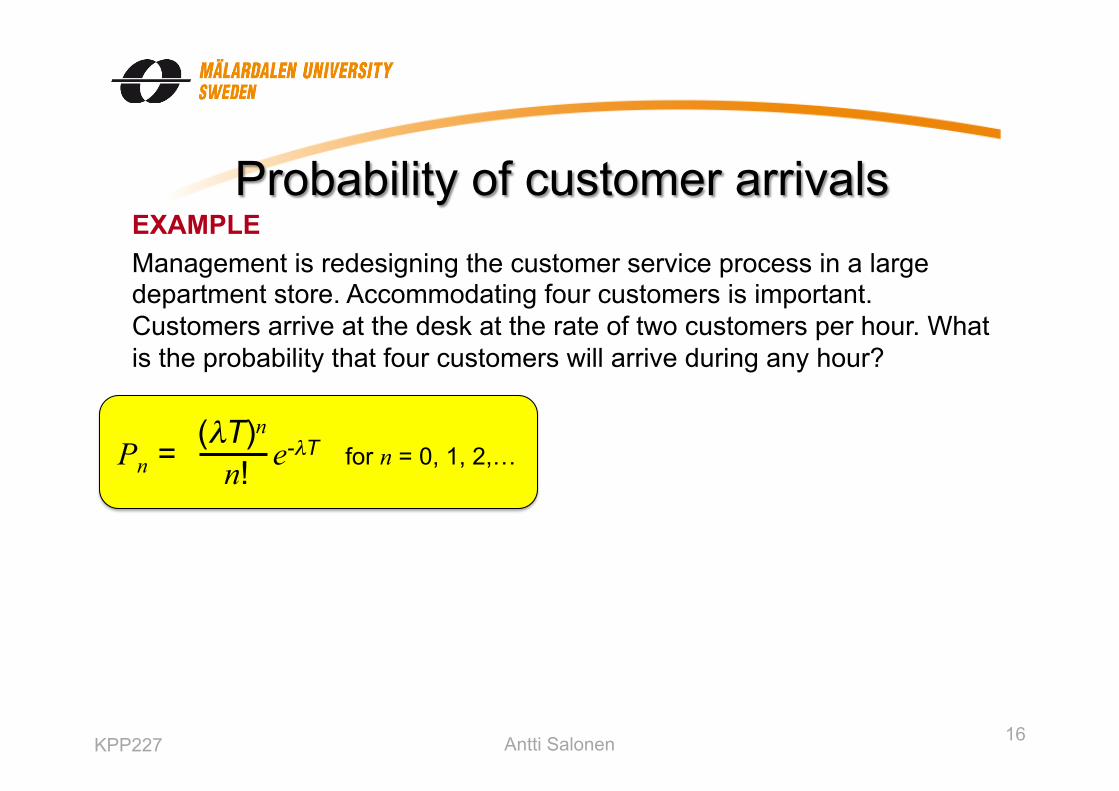
Probability of customer arrivals EXAMPLE Management is redesigning the customer service process in a large department store. Accommodating four customers is important. Customers arrive at the desk at the rate of two customers per hour. What is the probability that four customers will arrive during any hour?
Pn = e-λT for n = 0, 1, 2,… (λT)n
n!
KPP227 16 Antti Salonen
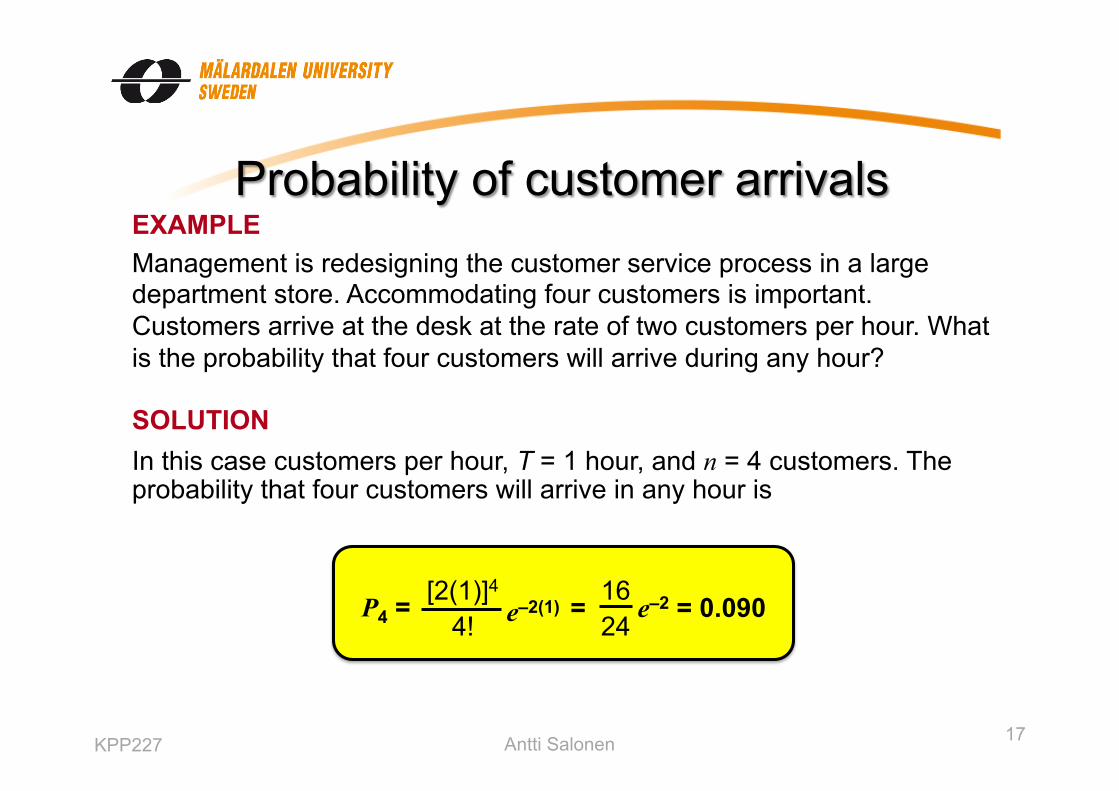
Probability of customer arrivals EXAMPLE Management is redesigning the customer service process in a large department store. Accommodating four customers is important. Customers arrive at the desk at the rate of two customers per hour. What is the probability that four customers will arrive during any hour?
SOLUTION In this case customers per hour, T = 1 hour, and n = 4 customers. The probability that four customers will arrive in any hour is
P4 = = e–2 = 0.090 16 24
[2(1)]4
4! e–2(1)
KPP227 17 Antti Salonen

Service time
P(t ≤ T) = 1 – e-µT where
µ = average number of customers completing service per period
t = service time of the customer T = target service time
Service time distribution can be described by an exponential distribution with mean = 1/µ and variance = (1/µ )2
Service time distribution: The probability that the service time will be no more than T time periods can be described by the exponential distribution
KPP227 18 Antti Salonen

Service time probability EXAMPLE The management of the large department store in Example C.1 must determine whether more training is needed for the customer service clerk. The clerk at the customer service desk can serve an average of three customers per hour. What is the probability that a customer will require less than 10 minutes of service?
P(t ≤ T) = 1 – e-µT
KPP227 19 Antti Salonen

Service time probability EXAMPLE The management of the large department store in Example C.1 must determine whether more training is needed for the customer service clerk. The clerk at the customer service desk can serve an average of three customers per hour. What is the probability that a customer will require less than 10 minutes of service?
SOLUTION We must have all the data in the same time units. Because µ = 3 customers per hour, we convert minutes of time to hours, or T = 10 minutes = 10/60 hour = 0.167 hour. Then
P(t ≤ T) = 1 – e–µT
P(t ≤ 0.167 hour) = 1 – e–3(0.167) = 1 – 0.61 = 0.39
KPP227 20 Antti Salonen
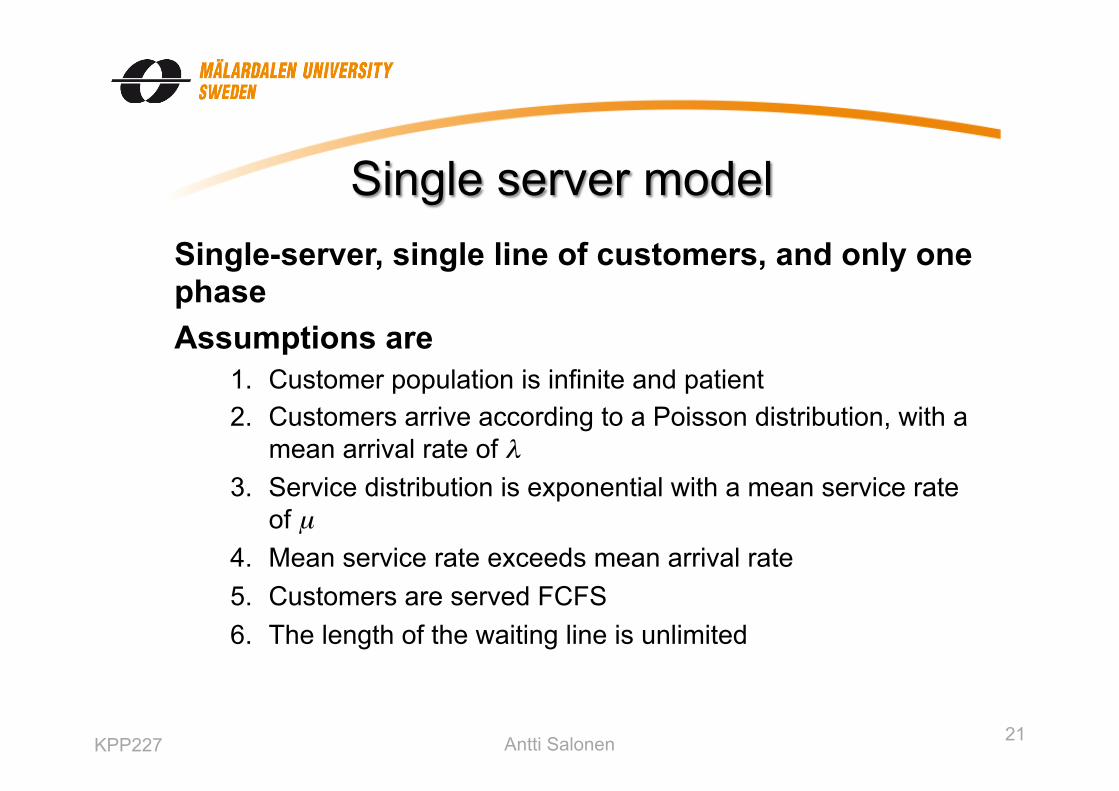
Single server model Single-server, single line of customers, and only one phase Assumptions are
1. Customer population is infinite and patient 2. Customers arrive according to a Poisson distribution, with a
mean arrival rate of λ 3. Service distribution is exponential with a mean service rate
of µ 4. Mean service rate exceeds mean arrival rate 5. Customers are served FCFS 6. The length of the waiting line is unlimited
KPP227 21 Antti Salonen
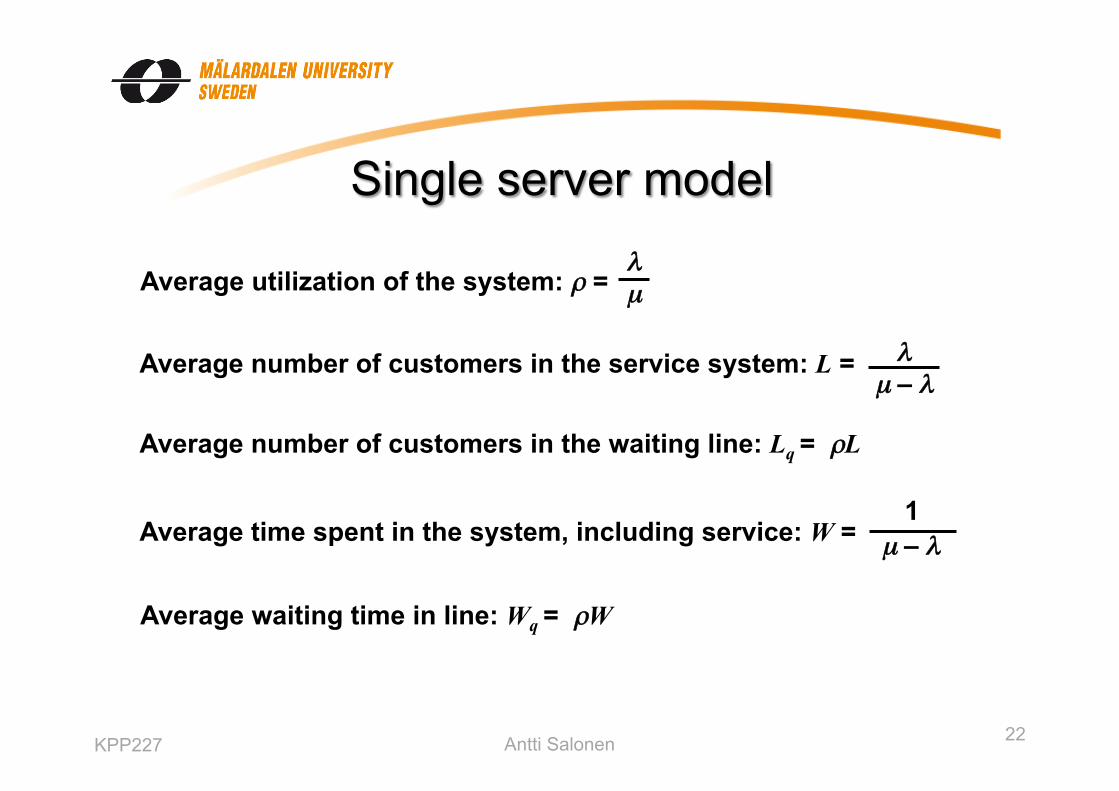
Single server model
Average utilization of the system: ρ = λ µ
Average number of customers in the service system: L = λ µ – λ
Average number of customers in the waiting line: Lq = ρL
Average time spent in the system, including service: W =
1 µ – λ
Average waiting time in line: Wq = ρW
KPP227 22 Antti Salonen
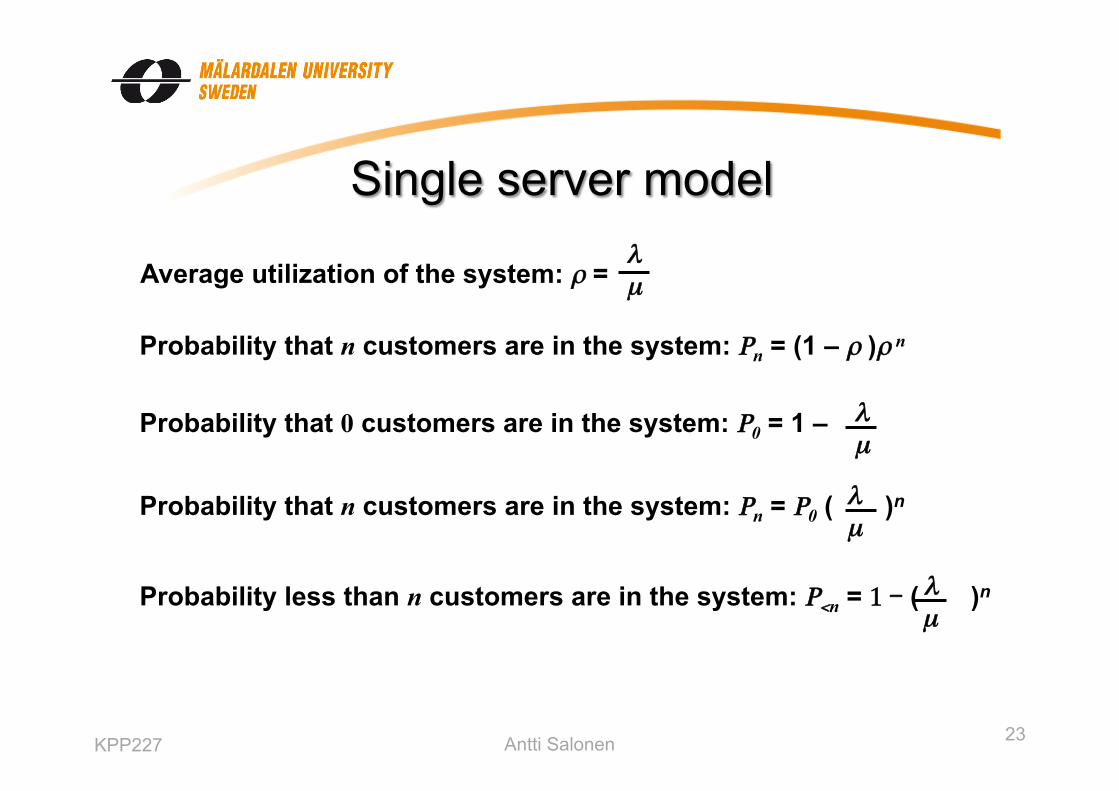
Single server model
Average utilization of the system: ρ = λ µ
Probability that n customers are in the system: Ρn = (1 – ρ )ρ n
Probability that 0 customers are in the system: Ρ0 = 1 – λ µ
Probability that n customers are in the system: Ρn = Ρ0 ( )n λ µ
Probability less than n customers are in the system: Ρ<n = 1 - ( )n λ µ
KPP227 23 Antti Salonen

Application EXAMPLE: Customers arrive at a checkout counter at an average 20 per hour, according to a Poisson distribution. They are served at an average rate of 25 per hour, with exponential service times. Use the single-server model to estimate the operating characteristics of this system. λ = 20 customer arrival rate per hour µ = 25 customer service rate per hour Calculate: 1. Average utilization of system 2. Average number of customers in the system 3. Average number of customers in the waiting line 4. Average time spent in the system 5. Average waiting time in line 6. The probability of 0 customers in the system 7. The probability of more than 0, 1, 2, 3, 4, and 5 customers in the system
KPP227 24 Antti Salonen
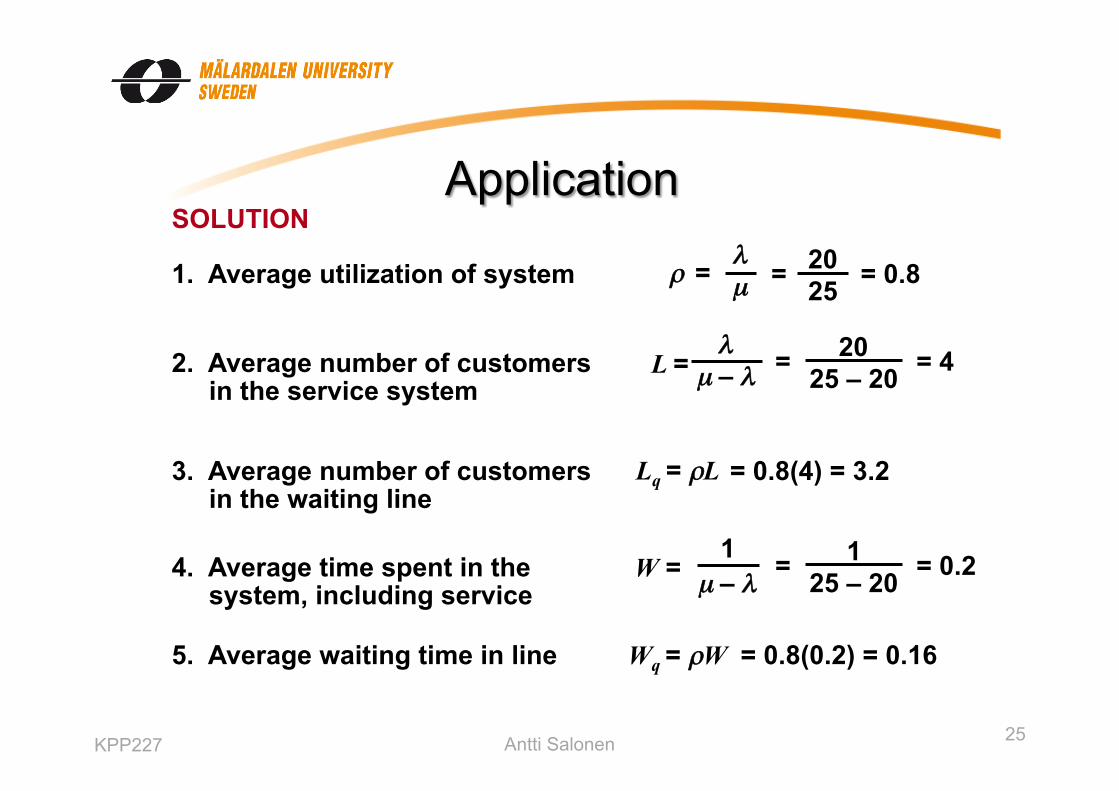
Application SOLUTION
1. Average utilization of system ρ = λ µ = = 0.8 20
25
Wq = ρW 5. Average waiting time in line = 0.8(0.2) = 0.16
W = 1
µ – λ 4. Average time spent in the
system, including service = = 0.2 1
25 – 20
Lq = ρL 3. Average number of customers in the waiting line
= 0.8(4) = 3.2
2. Average number of customers in the service system
= = 4 20 25 – 20 L =
λ µ – λ
KPP227 25 Antti Salonen

Application SOLUTION
6. Probability of 0 customers in the system λ µ = 0.2 20
25 Ρ0 = 1 – = 1 –
7. Probability of more than 0, 1, 2, 3, 4, and 5 customers in the system Probability of more than k customers in the system:
Ρn>k = ( )k+1 = ( )k+1 λ µ
20 25
Ρn>0 = 0.8 Ρn>1 = 0.64 Ρn>2 = 0.51 Ρn>3 = 0.41 Ρn>4 = 0.33 Ρn>5 = 0.26
KPP227 26 Antti Salonen
Relevant book chapters
KPP227
• Supplement B: “Waiting line models”
27 Antti Salonen