The MED-HIMS Phase 1 project is an initiative supported by the MEDSTAT III programme funded by the European Commission The programme of regionally coordinated Household International Migration Surveys in the Mediterranean Countries MED-HIMS PROGRAMME M ANUAL 7 LEAGUE OF ARAB STATES Preliminary version December 2013 GUIDELINES FOR MAIN COUNTRY R EPORT T ABULATION P LAN P ART 1
Transcript
The MED-HIMS Phase 1 project is an initiative supported by the MEDSTAT III programme funded by the European Commission
The programme of regionally coordinated
Household International Migration Surveys in the Mediterranean Countries
MED-HIMS PROGRAMME
M A N U A L 7
LEAGUE OF ARAB STATES
P r e l i m i n a r y v e r s i o n
D e c e m b e r 2 0 1 3
GUIDELINES FOR MAIN COUNTRY REPORT
TABULATION PLAN PART 1
This document has been developed within the framework of the Euro-Mediterranean statistical cooperation project Medstat III, funded by the European Union. The contents of this publication are the sole responsibility of Medstat III and can in no way be taken to reflect the views of the European Union.
MED-HIMS Mediterranean Household International Migration Survey
Manual 7 – Part 1 Tabulation plan
Preliminary Version
December 2013
Foreword
The ‘Mediterranean Household International Migration Survey’ (MED-HIMS) is a regional, coordinated programme of household surveys developed for the countries of the Southern and Eastern Mediterranean region. The programme is designed to overcome the lack of data on international migration for the region by collecting reliable and representative multi-topic, multi-level, retrospective and comparative data on the characteristics and behaviour of migrants and on the determinants and consequences of international migration and mobility. The programme has its origin in the European Commission’s MEDSTAT Programme, and since its initial inception in 2009, it has gone through a wide preparatory and consultation process with support from the European Commission, the World Bank, the UNHCR and the UNFPA. The main objectives of the MED-HIMS Programme are:
(i) to study the recent trends, causes, determinants, dynamics and consequences of international migration and mobility, and the inter- linkages between migration and development; and (ii) to explore scenarios for a closer cooperation in the area of migration and development between the sending countries in the Southern Mediterranean region and receiving countries, particularly the European Union.
The objectives and design of the MED-HIMS are guided by the vision of the 2004 Marrakech Action Plan for Statistics (MAPS), the 2009 Dakar Declaration on the Development of Statistics (DDDS), the 2011 EC Communication on the Global Approach to Migration and Mobility (GAMM), and the various strategies and recommendations of the United Nations Global Forum on Migration and Development (GFMD). The MED-HIMS methodology is designed to deal with the various dimensions of international migration and mobility by carrying out specialized national household surveys in the sending countries that aim to capture current and recent developments in the Southern Mediterranean region. In order to maximise the quality, utility and comparability of the data collected through the MED-HIMS surveys, a set of Model Questionnaires has been developed by the international organisations together with the countries of the region. These questionnaires are designed to collect representative data on out-migration, return migration, forced migration, intention to migrate, circular migration, migration of highly-skilled persons, irregular migration, type and use of remittances, behaviours, attitudes, perceptions and cultural values of people with regard to international migration and mobility, and the inter-linkages between migration and development, as well as relevant information on the individuals, households and local communities involved.
Manual 7 - Part 1 - Tabulation plan
Page 1
In addition to the Model Questionnaires, a series of manuals, guidelines and computer systems, covering the different phases of the survey from the initial organisation to tabulations, data analysis and reporting results, has been conceived and already partially developed to provide countries with guidance on the design and implementation at national level of the MED-HIMS survey or equivalent operations, whether under internationally coordinated programmes or national stand-alone programmes, within or outside the Southern and Eastern Mediterranean region. The set of manuals and guidelines is composed by the following:
Manual 1: MED-HIMS Model Questionnaires;
Manual 2: Survey Design and Organization;
Manual 3: Instructions to Supervisors;
Manual 4: Instructions to Interviewers;
Manual 5: Guidelines for Sample Design;
Manual 6: Data Dictionary and Recode Specifications;
Manual 7: Statistical Tabulations and Guidelines for Country Report.
This document presents the first part of ‘Manual 7: Statistical Tabulations’ which describes the pro-forma tables, in sets derived from the Model Questionnaires, which MED-HIMS recommends each participating country to produce. The proposed list of tables presented here is preliminary in the sense that not all topics covered by the Model Questionnaires are included in this tabulation plan. The present partial list is an input of MEDSTAT III to the work and discussions that would take place in the Euro-Mediterranean Working Group on Migration Statistics, established in the context of the ‘Post-MEDSTAT’ period. Work will continue on developing the complete tabulation plan and the Guidelines for the Country Principal Report. Like other MED-HIMS manuals, this is a “model” manual based on the MED-HIMS methodology and it is hoped that participating countries will follow it as closely as possible, allowing for minor modifications which may be required to meet local circumstances.
Manual 7 - Part 1 - Tabulation plan
Page 2
Acknowledgements
This Manual has been developed by Samir Farid (MED-HIMS Chief Technical Adviser and main author), in consultation with Tarek Abou-Chabake (UNHCR), Richard Bilsborrow (University of North Carolina), Giambattista Cantisani (MEDSTAT III), Ingrid Ivins (the World Bank) and Abdallah Zoubi (UNFPA). The work was undertaken with the support of a panel of experts (the “Manual Panel”) and a group of coordination, which in addition to the above, included Christophe Ingels and Rima Joujou (EuropeAid), Rosemary Montgomery and Veneta Boneva (Eurostat), and José L. Cervera (MEDSTAT III). The development of the MED-HIMS Manuals has benefited from the useful input and comments of the experts of the National Statistical Offices of Mediterranean countries, and in particular those who participated on behalf of these institutions in the regional workshops specifically organised for MEDHIMS since 2009: Omar Benbella, Amal Lakehal, Nachida Milat and Hassiba Akniouene (ONS - Office National des Statistiques, Algeria); Madiha Saleh, Abdallah Abdel El Razek and Ahmed Morsy (CAPMAS - Central Agency for Public Mobilization and Statistics, Egypt); Kamal Saleh, Mohammad Al Assaf and Batoul Obaid (DoS - Department of Statistics Jordan); Najwa Yaacoub and Lara Badre (CAS – Central Administration of Statistics, Lebanon); Abderrahim Ben Cheikh, Bouchra Bouziani, Sabry El Hassania and Mohamed Mghari (HCP - Haut Commissariat au Plan, Morocco); Mohammed Duraidi, Hana Albukhari and Hatem Qrareya (PCBS - Palestinian Central Bureau of Statistics, Palestine); Fadel Al Chikh, Ali Rustom and Talal Boufah (CBS - Central Bureau of Statistics, Syria), and Habib Fourati, Nadia Touhiri and Hayet Jouini (INS - Institut National de la Statistique, Tunisia). The desktop publishing of the MED-HIMS Manuals was done by Florian Lebourdais and Beata Suszterova of the MEDSTAT III Team. The development of the MED-HIMS Manuals published under MEDSTAT III was made possible through the coordinated financial and management efforts of the European Commission, the World Bank, UNFPA and UNHCR. All contributions are gratefully acknowledged.
MED-HIMS Model Questionnaires (MQs) ...............................................................................................17 MQ-1. Household Questionnaire..................................................................................................................17
Table 1.1 Survey households and population Distribution of the households and population enumerated in the expanded household survey according to residence
Table 1.2 Household population Percent distribution of the de jure population enumerated in the expanded household survey, by age, gender and type of place of residence
Table 1.3 Household population by region of residence Percent distribution of the de jure population enumerated in the expanded household survey, by age, gender and region of residence
Table 1.4 Household headship and composition by residence Percent distribution of households enumerated in the expanded household survey, by sex of head of household and household size, according to residence
Table 1.5 Household population and citizenship Among the de jure population enumerated in the expanded household survey, the percentage of citizens, and, among citizens, the percentage of citizens with dual nationality, according to age and gender
Table 1.6 Households by migration status Distribution of households selected for the migration survey by migration status
Table 1.7 Marital status Percent distribution of the de jure population enumerated in the expanded household survey by marital status, according to age and gender
Table 1.8 Educational status of household population Percent distribution of the de jure population enumerated in households selected for the migration survey by level of education, according to age, residence and gender
Table 1.9 Unemployment among household population Among the de jure population enumerated in households selected for the migration survey, the percentage reported as unemployed during the week preceding the survey, according to selected background characteristics
Manual 7 - Part 1 - Tabulation plan
Page 4
Table 1.10 Work status of household population Percent distribution of the de jure population enumerated in households selected for the migration survey who were reported as employed in the week preceding the survey, by status in employment, according to selected background characteristics age
Table 1.11 Chronic conditions Among the de jure population enumerated in households selected for the migration survey, the percentage reported to have ever had specific chronic conditions diagnosed by a doctor, according to age and gender
Table 1.12 Medication for chronic conditions Among the de jure population enumerated in households selected for the migration survey, and who were reported to have ever had specific chronic conditions, the percentage reported to be taking any treatment for the condition, have ever had specific chronic conditions diagnosed by a doctor, according to age and gender
Table 1.13 Prevalence of asthma and medication Among the de jure population enumerated in households selected for the migration survey, the percentage reported to have ever had asthma, according to age, gender and residence
Table 1.14 Prevalence of cancer and treatment Among the de jure population enumerated in households selected for the migration survey, the percentage reported to have any type of cancer, and the percent distribution of cancer patients by type of treatment ever taken, according to age and gender
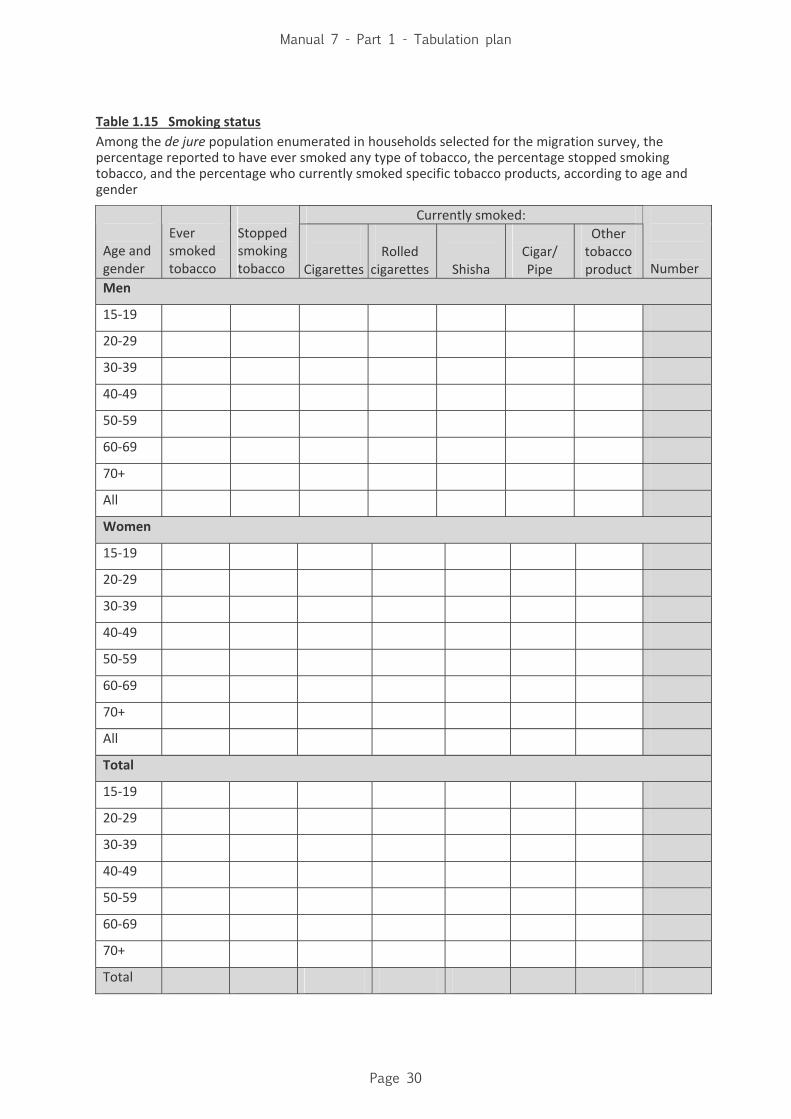
Table 1.15 Smoking status Among the de jure population enumerated in households selected for the migration survey, the percentage reported to have ever smoked any type of tobacco, the percentage stopped smoking tobacco, and the percentage who currently smoked specific tobacco products, according to age and gender
MQ-2 Individual Questionnaire for Out Migrant ...........................................................................33
Table 2.1 Selected Characteristics of all out migrants Percent distribution of all out migrants according to selected background characteristics
Table 2.2 Destination of out migrants Distribution of all out migrants by first and current destinations and gender
Table 2.3 Year of migration of out migrants Distribution of all out migrants by: (a) year of first migration, and (b) year of arrival in country of current residence
Manual 7 - Part 1 - Tabulation plan
Page 5
Table 2.4 Out migrants and number of destination countries Percent distribution of all out migrants by the number of all destination countries lived in for 3 or more months, according to gender and country of current residence
Table 2.5 First versus current destinations of out migrants Percent distribution of all out migrants by country of current residence according to country of first destination
Table 2.6 Age-sex distribution of out migrants Percent distribution of all out migrants by age, according to sex and selected characteristics
Table 2.7 Relative age distribution of out migrants Relative distribution of all out migrants according to current age within categories of socio-economic characteristics
Table 2.8 Length of residence in current destination Percent distribution of all out migrants by length of residence since arrival in current country of residence, according to gender and selected characteristics
Table 2.9 Who migrates where Percent distribution of all out migrants by country of current destination according to residence in country of origin and current educational status
Table 2.10 Age at first migration of out migrants Median age at first migration of all out migrants, according to selected background characteristics
Table 2.11 Headship and composition of out migrants’ origin households Among households with one or more out migrants, the percent distribution by sex of head of household and household size, according to residence
Table 2.12 Level of education of all out migrants before and after migration Percent distribution of all out migrants by: (a) level of education before first migration, and (b) current level of education at country of current residence
Table 2.13 Share of female migrants by level of education Female out migrants as a share of total out migrants by level of current education according to current destination
Table 2.14 Country awarding higher degrees of highly skilled out migrants Distribution of tertiary-educated out migrants by country awarding higher degree
Table 2.15 Highly skilled out migrants and length of residence at current destination Among all out migrants, the percentage of tertiary-educated migrants, according to length of residence in country of current residence and place of current residence
Manual 7 - Part 1 - Tabulation plan
Page 6
Table 2.16 Marital status of out migrants Percent distribution of all out migrants by age according to current marital status and gender
Table 2.17 Out migrants and citizenship of spouse Percent distribution of all out migrants by citizenship of spouse, according to gender and number of times married
Table 2.18 Employment status before migration Percent distribution of out migrants who moved to (FIRST DESTINATION SINCE START DATE OF REFERENCE PERIOD) by employment status before migration, according to selected characteristics
Table 2.19 Pre-migration contact with recruiter Percent distribution of out migrants who moved to (FIRST DESTINATION SINCE START DATE OF REFERENCE PERIOD) by whether they had contact with a recruiter to work abroad
Table 2.20 Pre-migration type of recruiter Among out migrants who moved to (FIRST DESTINATION SINCE START DATE OF REFERENCE PERIOD) and who had pre-migration contact with a recruiter, the percent distribution by type of recruiter
Table 2.21 Pre-migration means of contacting recruiter Among out migrants who moved to (FIRST DESTINATION SINCE START DATE OF REFERENCE PERIOD) and who had pre-migration contact with a recruiter, the percent distribution by means of contacting recruiter
Table 2.22 Pre-migration provision of written contract Among out migrants who moved to (FIRST DESTINATION SINCE START DATE OF REFERENCE PERIOD) and who had pre-migration contact with a recruiter, the percent distribution by whether recruiter provided written contract or terms of employment
Table 2.23 Compliance of employer at destination with pre-migration contract Among out migrants who moved to (FIRST DESTINATION SINCE START DATE OF REFERENCE PERIOD) and who had pre-migration contract provided by a recruiter, the percent distribution by whether employer at destination complied with written contract
Table 2.24 Ways in which employment situation at destination differed from terms of pre-migration contract Among out migrants who moved to (FIRST DESTINATION SINCE START DATE OF REFERENCE PERIOD) and who had pre-migration contract and found employment situation at destination different from agreed terms of contract, the percentage of the way(s) in which employment situation at destination differed from terms of contract
Manual 7 - Part 1 - Tabulation plan
Page 7
Table 2.25 Pre-migration payment to obtain work contract abroad Among out migrants who moved to (FIRST DESTINATION SINCE START DATE OF REFERENCE PERIOD), the percent distribution by whether payment was made to get a work contract or to facilitate the move to first destination
Table 2.26 Motive for first migration by out migrants according to residence Reason for first migration by out migrants who moved to (FIRST DESTINATION SINCE START DATE OF REFERENCE PERIOD), according to type of place of residence of origin household and gender
Table 2.27 Motive for first migration by level of education before first migration Reason for first migration by out migrants who moved to (FIRST DESTINATION SINCE START DATE OF REFERENCE PERIOD), according to level of education before migration and gender
Table 2.28 Most important motive for first migration by out migrants according to residence Percent distribution of out migrants who moved to (FIRST DESTINATION SINCE START DATE OF REFERENCE PERIOD) by the most important motive for first migration, according to type of place of residence of origin household and gender
Table 2.29 Most important motive for first migration by out migrants according to level of education Percent distribution of out migrants who moved to (FIRST DESTINATION SINCE START DATE OF REFERENCE PERIOD) by the most important motive for first migration, according to level of education before migration and gender
Table 2.30 Who made the decision for out migrant to migrate by residence and education before first migration Percent distribution of out migrants who moved to (FIRST DESTINATION SINCE START DATE OF REFERENCE PERIOD) by the person making the decision for out migrant to migrate, according type of place of residence of origin household, and level of education before migration, and gender
Table 2.31 Admission documents and compliance with regulations by out migrants, according to residence and education Percent distribution of out migrants who moved to (COUNTRY OF CURRENT DESTINATION SINCE START DATE OF REFERENCE PERIOD) by type of admission document, according to type of place of residence of origin household, education before migration, and gender
Table 2.32 Admission documents and compliance with regulations by current destination Percent distribution of out migrants who moved to (COUNTRY OF CURRENT DESTINATION SINCE START DATE OF REFERENCE PERIOD) by type of admission document, according to region of current destination
Table 2.33 Family arrangements typology at current destination Percent distribution of out migrants by family arrangements typology at country of current residence
Manual 7 - Part 1 - Tabulation plan
Page 8
Table 2.34 Proficiency in the language of country of current destination Percent distribution of out migrants who moved to (COUNTRY OF CURRENT DESTINATION SINCE START DATE OF REFERENCE PERIOD) by proficiency in the host country language, according to: (a) level of education before last migration, and (b) current level of education
MQ3 Individual Questionnaire for Return Migrant.......................................................................70
Table 3.1 Selected Characteristics of return migrants Percent distribution of all return migrants according to selected background characteristics
Table 3.2 Last destination of return migrants Distribution of all return migrants by last destination and gender
Table 3.3 Year of return of migrants Distribution of all return migrants by year of return from last destination, according to year of migration to last destination and gender
Table 3.4 Return migrants and number of destination countries Percent distribution of all return migrants by the number of all destination countries lived in for 3 or more months, according to selected background characteristics
Table 3.5 First versus last destinations of return migrants Percent distribution of all return migrants by region of last destination, according to region of first destination
Table 3.6 Age-sex distribution of return migrants Percent distribution of all return migrants by age, according to sex and selected characteristics
Table 3.7 Relative age distribution of return migrants Relative distribution of all return migrants according to current age within categories of socio-economic characteristics
Table 3.8 Headship and composition of return migrants’ households Among households with one or more return migrants, the percent distribution by sex of head of household and household size, according to residence
Table 3.10 Age at first migration of return migrants Median age at first migration of all return migrants, according to selected background characteristics
Table 3.11 Employment status before migration Percent distribution of return migrants who moved to (FIRST DESTINATION SINCE START DATE OF REFERENCE PERIOD) by employment status before migration, according to selected characteristics
Manual 7 - Part 1 - Tabulation plan
Page 9
Table 3.12 Pre-migration contact with recruiter among return migrants Percent distribution of return migrants who moved to (FIRST DESTINATION SINCE START DATE OF REFERENCE PERIOD) by whether they had contact with a recruiter to work abroad
Table 3.13 Reason of first migration by return migrants according to residence and level of education before migration Reason for first migration among return migrants who moved to (FIRST DESTINATION SINCE START DATE OF REFERENCE PERIOD), according to type of place of residence of origin household, level of education before migration, and gender
Table 3.14 Most important motive for first migration by return migrants according to residence and level of education before migration Percent distribution of return migrants who moved to (FIRST DESTINATION SINCE START DATE OF REFERENCE PERIOD) by the most important motive for first migration, according to type of place of residence of origin household, level of education before migration, and gender
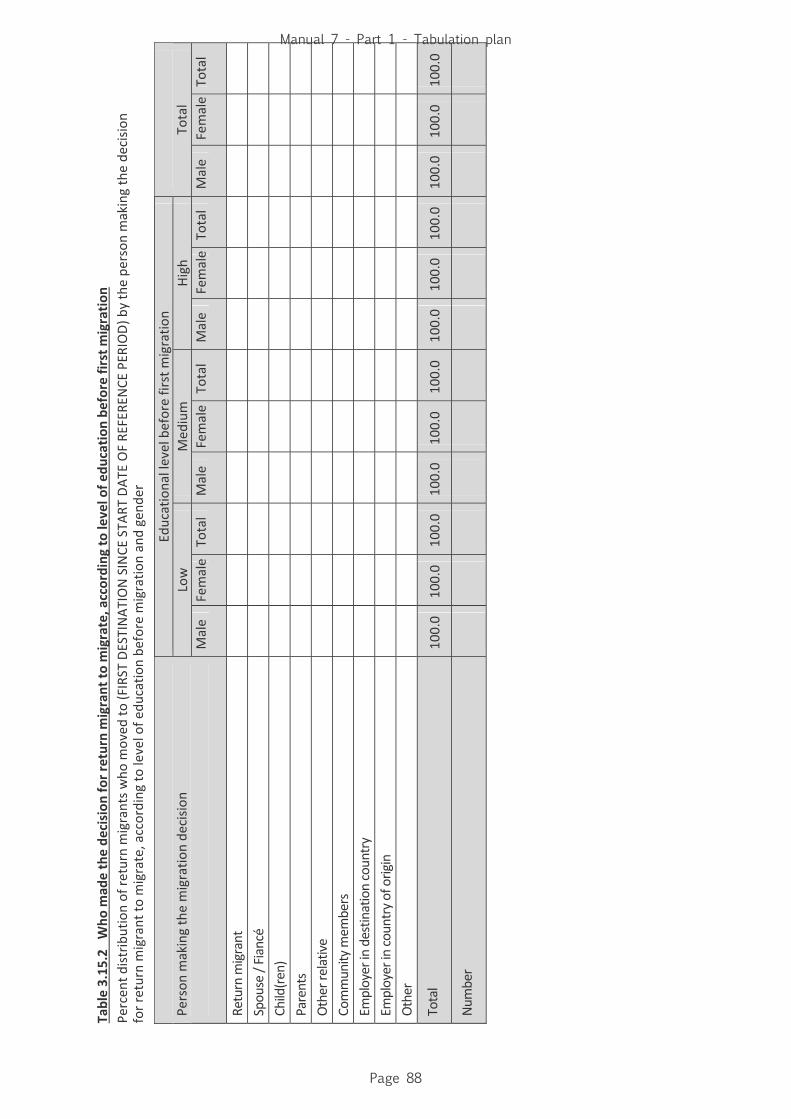
Table 3.15 Who made the decision for return migrant to migrate, according to residence and level of education before migration Percent distribution of return migrants who moved to (FIRST DESTINATION SINCE START DATE OF REFERENCE PERIOD) by the person making the decision for return migrant to migrate, according type of place of residence of origin household, level of education before migration, and gender
Table 3.16 Admission documents and compliance with regulations by return migrants, according to residence and level of education before migration Percent distribution of return migrants who moved to (FIRST DESTINATION SINCE START DATE OF REFERENCE) by type of admission document, according to type of place of residence of origin household, level of education before migration and gender
Table 3.17 Admission documents and compliance with regulations by return migrants, according to first destination Percent distribution of out migrants who moved to (FIRST DESTINATION SINCE START DATE OF REFERENCE PERIOD) by type of admission document, according to first destination
Table 3.18 Length of residence in last destination before returning Percent distribution of all return migrants by length of residence in country of last destination, according to gender and selected characteristics
Table 3.19 Family arrangements typology before returning from last destination Percent distribution of return migrants by living arrangements typology before returning from last destination
Table 3.20 Who returned from where Percent distribution of all return migrants by country of last destination, according to current residence and current educational status
Manual 7 - Part 1 - Tabulation plan
Page 10
Table 3.21 Return migrants and citizenship of spouse Percent distribution of return migrants by citizenship of spouse, according to gender and number of times married
Table 3.22 Level of education of return migrants before first migration and after returning Percent distribution of all return migrants by: (a) level of education before first migration, and (b) current level of education
Table 3.23 Share of female return migrants by educational level Female return migrants as a share of total return migrants by level of current education according to last destination
Table 3.24 Country awarding higher degrees of highly skilled return migrants Distribution of tertiary-educated return migrants by country awarding higher degree
Table 3.25 Highly skilled return migrants and length of residence at last destination Among all return migrants, the percentage of tertiary-educated return migrants, according to length of residence in last destination
MQ-4 Individual Questionnaire for Non Migrant .......................................................................100
Table 4.1 Selected Characteristics of non migrants Percent distribution of all non migrants according by selected background characteristics, according to migration status of household
Table 4.2 Age-sex distribution of non migrants Percent distribution of all non migrants by age, according to sex and selected characteristics
Table 4.3 Relative age distribution of non migrants Relative distribution of all non migrants according to current age within categories of socio-economic characteristics
Table 4.4 Headship and composition of non migrants’ households Among households with one or more non migrants, the percent distribution by sex of head of household and household size, according to residence Table 4.5 Marital status of non migrants Percent distribution of all non migrants by current marital status, according to age and gender
Table 4.6 Who intend to migrate and to where Percent distribution of potential migrants by intended destination, according to current residence and educational status
Table 4.7 Time of intended migration Among non migrants who intend to migrate, the percent distribution by the time of intended migration, according to selected background characteristics
Manual 7 - Part 1 - Tabulation plan
Page 11
Table 4.8 Intended destination Among non migrants who intend to migrate, the percent distribution by intended destination, according to selected background characteristics
Table 4.9 Reason of intended migration by residence and education Distribution of potential migrants by reason of thinking of moving abroad, according to type of place of residence, education and gender
Table 4.10 Most important reason of intended migration according residence, level of education and gender Percent distribution of potential migrants by the most important reason of intended migration, according to level of education and gender
Table 4.11 Employment status of potential migrants Percent distribution of potential migrants by current employment status, according to selected characteristics Table 4.12 Contact with recruiter among potential migrants Percent distribution of potential migrants by whether they had contact with a recruiter to work abroad
Table 4.13 Who would make the decision to migrate, according to residence Percent distribution of potential migrants by the person making the decision for potential migrant to migrate, according type of place of residence and gender
Table 4.14 Share of female potential migrants by educational level Female potential migrants as a share of total potential migrants by current level of education according to intended destination
Table 4.15 Country awarding higher degrees of highly skilled potential migrants Distribution of tertiary-educated potential migrants by country awarding higher degree
MQ-5 Individual Questionnaire for Forced Migrant .................................................................120
Table 5.1 Selected Characteristics of forced migrants Percent distribution of all forced migrants by selected background characteristics, according to household members’ blood relation
Table 5.2 Demographic composition of forced migrants Percent distribution of forced migrants by age group and the percentage female per age group
Table 5.3 Why forced migrants choose to come to this country? Percent distribution of forced migrants by the main reason for coming to this country According to main country of origin
Table 5.4 Asylum applications Percentage of forced migrants who applied for asylum according to country of origin, and percent distribution of applicants for asylum by source of assistance
Manual 7 - Part 1 - Tabulation plan
Page 12
Table 5.5 Refugee status determination Percent distribution of refugee status determination by country of origin
Table 5.6 Current status of forced migrants Percent distribution of forced migrants by current status according to country of origin
Table 5.7 Identity documents Percent distribution of forced migrants by type of identity documents they have in host country
Table 5.8 Employment status Percent distribution of forced migrants aged 15 years or more by status in employment, according to country of origin
Table 5.9 Future plans Percent distribution of forced migrants aged 15 years or more by plans for the future, according to country of origin
Table 5.10 Health care Percent distribution of forced migrant by type of health care received in past month, according to age and gender
Table 6.1 Dwelling characteristics by household residence and migration status Percent distribution of households selected for the migration survey by type and tenure of dwelling, availability of electricity, type of flooring, walls material and windows material, according to household residence and migration status, and percentage of de jure population by dwelling characteristics
Table 6.2 Crowding by residence and household migration status Percent distribution of households selected for the migration survey by number of rooms and number of bedrooms, according to household residence and migration status, and percent distribution of the de jure population by number of rooms
Table 6.3 Household drinking water access by residence and migration status Percent distribution of households selected for the migration survey by source of drinking water, time to collect water (if not within residence or plot), and person fetching the water, according to household residence and migration status, and percent distribution of the de jure population by household drinking water arrangements
Manual 7 - Part 1 - Tabulation plan
Page 13
Table 6.4 Household drinking water storage practices by residence and migration status Percent distribution of households selected for the migration survey by storage of drinking water and, among households in which water is stored, percent distribution by presence of covers on the containers in which water is stored, and type of container in which water is stored, according to household residence and migration status, and percent distribution of de jure population by water storage practices
Table 6.5 Household drinking water treatment by residence and migration status Among households selected for the migration survey, the percentage using various modes for treating drinking water, according to household residence and migration status, and percent distribution of de jure population by mode of water treatment
Table 6.6 Sanitation facilities by household residence and migration status Percent distribution of households selected for the migration survey by type of toilet facility, location of toilet facility, and type of sanitation facilities, according to household residence and migration status, and percent distribution of de jure population by sanitation facilities
Table 6.7 Cooking facilities by household residence and migration status Percent distribution of households selected for the migration survey by cooking facilities, according to household residence and migration status, and percent distribution of de jure population by waste disposal
Table 6.8 Waste disposal by household residence and migration status Percent distribution of households selected for the migration survey by method of disposal of waste, according to household residence and migration status, and percent distribution of de jure population by waste disposal
Table 6.9 Type of road and drainage by household residence and migration status Percent distribution of households selected for the migration survey by method of disposal of waste, according to household residence and migration status, and percent distribution of de jure population by waste disposal
Table 6.10 Household possessions of objects by household residence and migration status Among households selected for the migration survey, the percentage possessing various household objects, according to household residence and migration status, and percent age of de jure population by household possessions
Table 6.11 Household assets by household residence and migration status Among households selected for the migration survey, the percentage possessing variousassets, according to household residence and migration status, and percent age of de jure population by household assets
Manual 7 - Part 1 - Tabulation plan
Page 14
MQ-1 The Household Questionnaire
Manual 7 - Part 1 - Tabulation plan
Page 15
Table 1.1 Survey households and population
Distribution of the households and population enumerated in the expanded household survey according to residence
Households Population Residence
Number Percent Number Percent
Average household
size
Type of place
Urban Rural Region of residence Region 1 (e.g. Capital) Region 2 (e.g. North) Region 3 (e.g. South) Region 4 (e.g. East) Region 5 (e.g. West)
Total 100.0 100.0
Table 1.2 Household population
Percent distribution of the de jure population enumerated in the expanded household survey, by age, gender and type of place of residence
Total 100.0 100.0 100.0 100.0 100.0 100.0 100.0 100.0 100.0
Number
Manual 7 - Part 1 - Tabulation plan
Page 16
Tab
le 1.3 Household population by region of residence
Percent distribution of the de jure population enumerated
in the expanded
household survey, by age, gender and region of residen
ce
Males
Females
Total
Age
Region 1
Region 2 Region 3
Region 4
Region 5 Region 1
Region 2
Region 3 Region 4
Region 5 Region 1
Region 2
Region 3
Region 4 Region 5
0‐4
5‐9
10‐14
15‐19
20‐24
25‐29
30‐34
35‐39
40‐44
45‐49
50‐54
55‐59
60‐64
65‐69
70‐74
75‐79
80+
Total
100.0
100.0
100.0
100.0
100.0
100.0
100.0
100.0
100.0
100.0
100.0
100.0
100.0
100.0
100.0
Number
Manual 7 - Part 1 - Tabulation plan
Page 17
Table 1.4 Household headship and composition by residence
Percent distribution of households enumerated in the expanded household survey, by sex of head of household and household size, according to residence
Type of place of residence
Region of residence
Characteristic Urban Rural Region 1 Region 2 Region 3 Region 4 Region 5
Total
Household headship
Male
Female
Total 100.0 100.0 100.0 100.0 100.0 100.0 100.0 100.0
Number of usual residence
1
2
3
4
5
6
7
8
9+
Total 100.0 100.0 100.0 100.0 100.0 100.0 100.0 100.0
Number of households
Mean size
Manual 7 - Part 1 - Tabulation plan
Page 18
Table 1.5 Household population and citizenship
Among the de jure population enumerated in the expanded household survey, the percentage of citizens, and, among citizens, the percentage of citizens with dual nationality, according to age and gender
Distribution of households selected for the migration survey by migration status
Migration status Number of households
Percent
1. Households with one or more out migrants
2. Households with one or more return migrants
3. Households with both out migrant and return migrant
4. Households with one or more non migrants: total
4.1 Households with non migrant and out migrant
4.2 Households with non migrant and return migrant
4.3 Households with non migrants only
5. Households with forced migrants
Total 100.0
Manual 7 - Part 1 - Tabulation plan
Page 19
Table 1.7 Marital status
Percent distribution of the de jure population enumerated in the expanded household survey by marital status, according to age and gender
Age
Single
Married
Divorced/
Separated
Widowed
Not stated
Total
Number
A. Males
15‐19 100.0
20‐24 100.0
25‐29 100.0
30‐34 100.0
35‐39 100.0
40‐44 100.0
45‐49 100.0
50‐54 100.0
55‐59 100.0
60‐64 100.0
65‐69 100.0
70‐74 100.0
75‐79 100.0
80+ 100.0
B. Females
15‐19 100.0
20‐24 100.0
25‐29 100.0
30‐34 100.0
35‐39 100.0
40‐44 100.0
45‐49 100.0
50‐54 100.0
55‐59 100.0
60‐64 100.0
65‐69 100.0
70‐74 100.0
75‐79 100.0
80+ 100.0
Manual 7 - Part 1 - Tabulation plan
Page 20
Table 1.8 Educational status of household population
Percent distribution of the de jure population enumerated in households selected for the migration survey by level of education, according to age, residence and gender
Table 1.8.1 Males
Background
characteristic
No education
Some primary
Primary complete
Preparatory complete
Secondary complete
Higher complete
Total Number
Age
5‐9 100.0
10‐14 100.0
15‐19 100.0
20‐24 100.0
25‐29 100.0
30‐34 100.0
35‐39 100.0
40‐44 100.0
45‐49 100.0
50‐54 100.0
55‐59 100.0
60‐64 100.0
65‐69 100.0
70‐74 100.0
75‐79 100.0
80+ 100.0
Type of place of residence
Urban 100.0
Rural 100.0
Region of residence
Region 1 100.0
Region 2 100.0
Region 3 100.0
Region 4 100.0
Region 5 100.0
Total 100.0
Manual 7 - Part 1 - Tabulation plan
Page 21
Table 1.8 Educational status of household population, continued
Percent distribution of the de jure population enumerated in households selected for the migration survey by level of education, according to age, residence and gender
Table 1.8.2 Females
Background
characteristic
No education
Some primary
Primary complete
Preparatory complete
Secondary complete
Higher complete
Total Number
Age
5‐9 100.0
10‐14 100.0
15‐19 100.0
20‐24 100.0
25‐29 100.0
30‐34 100.0
35‐39 100.0
40‐44 100.0
45‐49 100.0
50‐54 100.0
55‐59 100.0
60‐64 100.0
65‐69 100.0
70‐74 100.0
75‐79 100.0
80+ 100.0
Type of place of residence
Urban 100.0
Rural 100.0
Region of residence
Region 1 100.0
Region 2 100.0
Region 3 100.0
Region 4 100.0
Region 5 100.0
Total 100.0
Manual 7 - Part 1 - Tabulation plan
Page 22
Table 1.9 Unemploym
ent am
ong household population
Among the de jure population enumerated
in households selected
for the migration survey, the percentage rep
orted
as unemployed during the week
preceding the survey, according to selected background characteristics
Unemployed : previously worked
Seeking work for the first tim
e To
tal
Age
Age
Age
Characteristic
15‐29
30‐49
50‐64
15‐64
15‐29
30‐49
50‐64
15‐64
15‐29
30‐49
50‐64
15‐64
Gender
Males
Females
Type of place of residence
Urban
Rural
Region of residence
Region 1
Region 2
Region 3
Region 4
Region 5
Education
No education
Some primary
Primary complete
Preparatory complete
Secondary complete
Higher complete
Total
Number
Manual 7 - Part 1 - Tabulation plan
Page 23
Table 1.10 Work status of household population
Percent distribution of the de jure population enumerated
in households selected
for the migration survey who were reported
as employed in
the week
preceding the survey, by status in employm
ent , according to selected background characteristics age
Table 1.10.1 Males
Characteristic
Own‐account
worker
Employer
Salaried
em
ployee
Casual
employee in
agriculture
Casual
employee not
in agriculture
Unpaid fam
ily
worker
Unpaid worker
Total
Age
15‐29
100.0
30‐49
100.0
50‐64
100.0
65+
100.0
Type of place of residence
Urban
100.0
Rural
100.0
Region of residence
Region 1
100.0
Region 2
100.0
Region 3
100.0
Region 4
100.0
Region 5
100.0
Education
No education
100.0
Some primary
100.0
Primary complete
100.0
Preparatory complete
100.0
Secondary complete
100.0
Higher complete
100.0
Total
100.0
Number
Manual 7 - Part 1 - Tabulation plan
Page 24
Table 1.10 Work status of household population, continued
Percent distribution of the de jure population enumerated
in households selected
for the migration survey who were reported
as employed in
the week
preceding the survey, by status in employm
ent , according to selected background characteristics age
Table 1.10.2 Females
Characteristic
Own‐account
worker
Employer
Salaried
em
ployee
Casual
employee in
agriculture
Casual
employee not
in agriculture
Unpaid fam
ily
worker
Unpaid worker
Total
Age
15‐29
100.0
30‐49
100.0
50‐64
100.0
65+
100.0
Type of place of residence
Urban
100.0
Rural
100.0
Region of residence
Region 1
100.0
Region 2
100.0
Region 3
100.0
Region 4
100.0
Region 5
100.0
Education
No education
100.0
Some primary
100.0
Primary complete
100.0
Preparatory complete
100.0
Secondary complete
100.0
Higher complete
100.0
Total
100.0
Number
Manual 7 - Part 1 - Tabulation plan
Page 25
Table 1.10 Work status of household population, continued
Percent distribution of the de jure population enumerated
in households selected
for the migration survey who were reported
as employed in
the week
preceding the survey, by status in employm
ent , according to selected background characteristics age
Table 1.10.3 To
tal
Characteristic
Own‐account
worker
Employer
Salaried
em
ployee
Casual
employee in
agriculture
Casual
employee not
in agriculture
Unpaid fam
ily
worker
Unpaid worker
Total
Age
15‐29
100.0
30‐49
100.0
50‐64
100.0
65+
100.0
Type of place of residence
Urban
100.0
Rural
100.0
Region of residence
Region 1
100.0
Region 2
100.0
Region 3
100.0
Region 4
100.0
Region 5
100.0
Education
No education
100.0
Some primary
100.0
Primary complete
100.0
Preparatory complete
100.0
Secondary complete
100.0
Higher complete
100.0
Total
100.0
Number
Manual 7 - Part 1 - Tabulation plan
Page 26
Table 1.11 Chronic conditions
Among the de jure population enumerated in households selected for the migration survey, the percentage reported to have ever had specific chronic conditions diagnosed by a doctor, according to age and gender
Age Condition
Gender 15‐19 20‐29 30‐39 40‐49 50‐59 60‐69 70+
Total
Men
Women
High blood pressure
All
Men
Women
Diabetes
All
Men
Women
Heart disease All
Men
Women
Total
All
Men
Women
Number
All
Table 1.12 Medication for chronic conditions
Among the de jure population enumerated in households selected for the migration survey, and who were reported to have ever had specific chronic conditions, the percentage reported to be taking any treatment for the condition, have ever had specific chronic conditions diagnosed by a doctor, according to age and gender
Age Condition
Gender 15‐19 20‐29 30‐39 40‐49 50‐59 60‐69 70+
Total
Men
Women
High blood pressure
All
Men
Women
Diabetes
All
Men
Women
Heart disease All
Men
Women
Total
All
Men
Women
Number
All
Manual 7 - Part 1 - Tabulation plan
Page 27
Table 1.13 Prevalence of asthma and medication
Among the de jure population enumerated in households selected for the migration survey, the percentage reported to have ever had asthma, according to age, gender and residence
Prevalence of respiratory diseases
Among those having respiratory disease, the percentage taking
medication
Age
Males Females All Males Females All
Under 5
5‐9
10‐19
20‐29
30‐39
40‐49
50‐59
60‐69
70+
Total
Manual 7 - Part 1 - Tabulation plan
Page 28
Table 1.14 Prevalence of cancer and treatment
Among the de jure population enumerated in households selected for the migration survey, the percentage reported to have any type of cancer, and the percent distribution of cancer patients by type of treatment ever taken, according to age and gender
Percentage taking or have taken treatment among those diagnosed with cancer
Age and gender
Percentage diagnosed with cancer
Drugs Surgical Radiation Chemical No treatment
Don’t know
Number
Males
Under 5
5‐9
10‐19
20‐29
30‐39
40‐49
50‐59
60‐69
70+
Total
Females
Under 5
5‐9
10‐19
20‐29
30‐39
40‐49
50‐59
60‐69
70+
Total
Total
Under 5
5‐9
10‐19
20‐29
30‐39
40‐49
50‐59
60‐69
70+
Total
Manual 7 - Part 1 - Tabulation plan
Page 29
Table 1.15 Smoking status
Among the de jure population enumerated in households selected for the migration survey, the percentage reported to have ever smoked any type of tobacco, the percentage stopped smoking tobacco, and the percentage who currently smoked specific tobacco products, according to age and gender
Currently smoked: Age and gender
Ever smoked tobacco
Stopped smoking tobacco
Cigarettes
Rolled
cigarettes
Shisha
Cigar/ Pipe
Other tobacco product
Number
Men
15‐19
20‐29
30‐39
40‐49
50‐59
60‐69
70+
All
Women
15‐19
20‐29
30‐39
40‐49
50‐59
60‐69
70+
All
Total
15‐19
20‐29
30‐39
40‐49
50‐59
60‐69
70+
Total
Manual 7 - Part 1 - Tabulation plan
Page 30
MQ-2 Out Migrant
Manual 7 - Part 1 - Tabulation plan
Page 31
Table 2.1 Selected Characteristics of all out migrants Percent distribution of all out migrants according to selected background characteristics
Characteristic Percent Characteristic Percent
Gender Destination at first migration
Male Arab region
Female Europe
North America
Childhood type of residence Other
Urban
Rural Number of countries lived in abroad
1
Type of place of residence of origin household 2
Urban 3
Rural 4+
Region of residence of origin household Current destination
Region 1 Arab region
Region 2 Europe
Region 3 North America
Region 4 Other
Region 5
Motive for first migration since 2000
Current Educational status Work
No education Study
Some primary Study & work
Primary complete /some preparatory Follow a family member abroad
Preparatory complete /some secondary Other
Secondary complete/ some post‐secondary
Higher complete
Length of residence since arrival in current destination (years)
Marital status at first migration 0‐4
Single 5‐9
Married 10‐14
Separated 15+
Divorced
Widowed Employment status
Currently working
Current marital status Currently not working & seeking work
Single Currently not working & not seeking work
Married
Separated Migration intentions
Divorced Remain in country of current residence
Widowed Return to country of origin
Move to another country
Manual 7 - Part 1 - Tabulation plan
Page 32
Table 2.2 Destination of out migrants
Distribution of all out migrants by first and current destinations and gender
First destination Current destination
Males Females Total Males Females Total Country of destination
Number % Number % Number % Number % Number % Number %
Other*
Total 100 100 100 100 100 100 *Includes countries with fewer than one percent of all out migrants
Manual 7 - Part 1 - Tabulation plan
Page 33
Table 2.3 Year of migration of out migrants
Distribution of all out migrants by: (a) year of first migration, and (b) year of arrival in country of current residence
First destination Current destination
Males Females Total Males Females Total Country of destination
Number % Number % Number % Number % Number % Number %
Before 1990
1991
1992
1993
1994
1995
1996
1997
1998
1999
2000
2001
2002
2003
2004
2005
2006
2007
2008
2009
2010
2011
2012
2013
¦
Year of survey
Total 100 100 100 100 100 100
Manual 7 - Part 1 - Tabulation plan
Page 34
Table 2.4 Out migrants and number of destination countries
Percent distribution of all out migrants by the number of all destination countries lived in for 3 or more months, according to gender and country of current residence
Number of all destination countries* Country of current residence
1 2 3 4+ Total Number
Males 100.0 Arab region 100.0 Europe 100.0 North America 100.0 Other 100.0
Females 100.0 Arab region 100.0 Europe 100.0 North America 100.0 Other 100.0
Total 100.0 Arab region 100.0 Europe 100.0 North America 100.0 Other 100.0 *Includes country of current residence
Table 2.5 First versus current destinations of out migrants
Percent distribution of all current migrants by country of current residence according to country of first destination
Country of current residence Country of first destination Arab region Europe North America Other
Total
Males 100.0 Arab region 100.0 Europe 100.0 North America 100.0 Other 100.0
Females 100.0 Arab region 100.0 Europe 100.0 North America 100.0 Other 100.0
Total 100.0 Arab region 100.0 Europe 100.0 North America 100.0 Other 100.0
Manual 7 - Part 1 - Tabulation plan
Page 35
Table 2.6 Age
‐sex distribution of out migrants
Percent distribution of all curren
t migrants by age, according to sex and selected characteristics
Table 2.6A: Males
Curren
t age of migrant
Characteristic
15‐19
20‐24
25‐29
30‐34
35‐39
40‐44
45‐49
50‐54
55‐59
60‐64
65+
Total
Number
Current destination
Arab region
100.0
Europe
100.0
North America
100.0
Other
100.0
Type of place of residence of origin household
Urban
100.0
Rural
100.0
Region of residence of origin household
Region 1
100.0
Region 2
100.0
Region 3
100.0
Region 4
100.0
Region 5
100.0
Current Ed
ucational status
No education
100.0
Some primary
100.0
Primary complete /some preparatory
100.0
Preparatory complete /some secondary
100.0
Secondary complete/ some post‐
secondary
100.0
Higher complete
100.0
Total
100.0
Manual 7 - Part 1 - Tabulation plan
Page 36
Table 2.6 Age
‐sex distribution of current migrants, continued
Percent distribution of all curren
t migrants by age, according to sex and selected background characteristics
Table 2.6B: Females
Curren
t age of migrant
Characteristic
15‐19
20‐24
25‐29
30‐34
35‐39
40‐44
45‐49
50‐54
55‐59
60‐64
65+
Total
Number
Current destination
Arab region
100.0
Eu
rope
100.0
North America
100.0
Other
100.0
Type of place of residence of origin household
Urban
100.0
Rural
100.0
Region of residence of origin household
Region 1
100.0
Region 2
100.0
Region 3
100.0
Region 4
100.0
Region 5
100.0
Current Ed
ucational status
No education
100.0
Some primary
100.0
Primary complete /some preparatory
100.0
Preparatory complete /some secondary
100.0
Secondary complete/ some post‐secondary
100.0
Higher complete
100.0
Total
100.0
Manual 7 - Part 1 - Tabulation plan
Page 37
Table 2.6 Age
‐sex distribution of current migrants, continued
Percent distribution of all curren
t migrants by age, according to gender and selected background characteristics
Table 2.6C: Total
Curren
t age of migrant
Characteristic
15‐19
20‐24
25‐29
30‐34
35‐39
40‐44
45‐49
50‐54
55‐59
60‐64
65+
Total
Number
Current destination
Arab region
100.0
Eu
rope
100.0
North America
100.0
Other
100.0
Type of place of residence of origin household
Urban
100.0
Rural
100.0
Region of residence of origin household
Region 1
100.0
Region 2
100.0
Region 3
100.0
Region 4
100.0
Region 5
100.0
Current Ed
ucational status
No education
100.0
Some primary
100.0
Primary complete /some preparatory
100.0
Preparatory complete /some secondary
100.0
Secondary complete/ some post‐secondary
100.0
Higher complete
100.0
Total
100.0
Manual 7 - Part 1 - Tabulation plan
Page 38
Table 2.7 Relative age distribution of out migrants
Relative distribution of all current migrants according to current age within categories of socio‐economic characteristics
Current age of migrant Characteristic
15‐19 20‐29 30‐39 40‐49 50‐59 60+
Percent distribution of current migrants
Sex Male Female Type of place of residence of origin household Urban Rural Region of residence of origin household Region 1 Region 2 Region 3 Region 4 Region 5 Childhood type of residence Urban Rural Current Educational status No education Some primary Primary complete /some preparatory Preparatory complete /some secondary Secondary complete/ some post‐secondary Higher complete Current destination Arab region Europe North America Other Employment status Currently working Not currently working & seeking work Not currently working & not seeking work
Manual 7 - Part 1 - Tabulation plan
Page 39
Table 2.8 Length of residence in
current destination
Percent distribution of all curren
t migrants by length of residen
ce since arrival in
curren
t country of residen
ce, according to gen
der and selected characteristics
Length of residen
ce since arrival in
country of curren
t residen
ce (years)
Males
Females
Total
Characteristic
0‐4
5‐9 10‐1415‐19
20+
Total
N
0‐4
5‐9 10‐14 15‐19
20+
Total
N
0‐4
5‐9 10‐1415‐19
20+
Total
N
Current destination
Arab region
100.0
100.0
100.0
Eu
rope
100.0
100.0
100.0
North America
100.0
100.0
100.0
Other
100.0
100.0
100.0
Type of place of residen
ce of origin household
Urban
100.0
100.0
100.0
Rural
100.0
100.0
100.0
Region of residence of origin household
Region 1
100.0
100.0
100.0
Region 2
100.0
100.0
100.0
Region 3
100.0
100.0
100.0
Region 4
100.0
100.0
100.0
Region 5
100.0
100.0
100.0
Current Ed
ucational status
No education
100.0
100.0
100.0
Some primary
100.0
100.0
100.0
Primary complete
100.0
100.0
100.0
Preparatory complete
100.0
100.0
100.0
Secondary complete
100.0
100.0
100.0
Higher complete
100.0
100.0
100.0
Total
100.0
100.0
100.0
Manual 7 - Part 1 - Tabulation plan
Page 40
Table 2.9 Who migrates where
Percent distribution of all out migrants by country of current destination according to residence in country of origin and current educational status
Type of place of residence of
origin household
Region of residence of origin household Current educational
status Country of current residence Urban Rural Region
1 Region
2 Region
3 Region
4 Region
5 Low Medium High
Total
Arab region Europe North America Other
Total 100 100 100 100 100 100 100 100 100 100 100
Table 2.10 Age at first migration of out migrants
Median age at first migration of all out migrants, according to selected background characteristics
Males Females Total
Year of first migration
Background characteristic
Before 2000
Since 2000
Before 2000
Since 2000
Before 2000
Since 2000
Current type of residence of origin household Urban Rural Current region of residence of origin household Region 1 Region 2 Region 3 Region 4 Region 5 Current level of education of migrant No education Some primary Primary complete /some preparatory Preparatory complete /some secondary Secondary complete/ some post‐secondary Higher complete Destination at first migration Arab region Europe North America Other
Total
Source: MQ‐2, Q101, Q103, Q108, Q109
Manual 7 - Part 1 - Tabulation plan
Page 41
Table 2.11 Headship and composition of out migrants’ origin households
Among households with one or more out migrants, the percent distribution by sex of head of household and household size, according to residence
Type of place of residence
Region of residence
Characteristic Urban Rural Region 1 Region 2 Region 3 Region 4 Region 5
Total
Household headship
Male
Female
Total 100.0 100.0 100.0 100.0 100.0 100.0 100.0 100.0
Number of usual residence
1
2
3
4
5
6
7
8
9+
Total 100.0 100.0 100.0 100.0 100.0 100.0 100.0 100.0
Number of households
Mean size
Manual 7 - Part 1 - Tabulation plan
Page 42
Table 2.12 Level of education of all out migrants before and after migration
Percent distribution of all out migrants by: (a) level of education before first migration, and (b) current level of education at country of current residence
Before first migration Current level Level of education
Male Female Total Male Female Total
No education
Some primary
Primary complete /some preparatory
Preparatory complete /some secondary
Secondary complete/ some post‐secondary
Higher complete
Total 100.0 100.0 100.0 100.0 100.0 100.0
Number of all out migrants
Table 2.13 Share of female migrants by level of education
Female out migrants as a share of total out migrants by level of current education according to current destination
Current destination region
No education
Some primary
Primary complete /some
preparatory
Preparatory complete /some
secondary
Secondary complete/ some post‐secondary
Higher complete
Total
Arab region
Europe
North America
Other
Total
Manual 7 - Part 1 - Tabulation plan
Page 43
Table 2.14 Country aw
arding higher degrees of highly skilled out migrants
Distribution of tertiary‐educated out migrants by country aw
arding higher degree
Degree
Bachelor
Higher diploma / Master
Doctorate
Country aw
arding degree
Country aw
arding degree
Country aw
arding degree
Characteristic
Country
of origin
Arab
country Europe
North
America
Other
Total
Country
of origin
Arab
countryEu
rope
North
America
Other
Total
Country
of origin
Arab
country
Europe North
America
Other
Total
Current destination region
Arab region
100
100
100
Europe
100
100
100
North
America
100
100
100
Other
100
100
100
Current type of residence of origin household
Urban
100
100
100
Rural
100
100
100
Current region of residen
ce of origin household
Region 1
100
100
100
Region 2
100
100
100
Region 3
100
100
100
Region 4
100
100
100
Region 5
100
100
100
Total
100
100
100
Manual 7 - Part 1 - Tabulation plan
Page 44
Table 2.15 Highly skilled out migrants and length of residence at current destination
Among all out migrants, the percentage of tertiary‐educated migrants, according to length of residence in country of current residence and place of current residence
Length of residence at country of current residence (years)
and gender
0‐4 5‐9 10‐14 15+
Total Region of current residence
M F T M F T M F T M F T M F T
Arab region %
N
Europe %
N
North America %
N
Other %
N
Total %
N
Source: MQ‐2, Q101, Q117, Q203
Manual 7 - Part 1 - Tabulation plan
Page 45
Table 2.16 Marital status of out migrants
Percent distribution of all out migrants by age according to current marital status and gender
Marital status Age
Single Married Separated Divorced Widowed Total Number
Males 15‐19 100
20‐24 100
25‐29 100
30‐34 100
35‐39 100
40‐44 100
45‐49 100
50‐54 100
55‐59 100
60‐64 100
65+ 100
Total 100
Females 15‐19 100
20‐24 100
25‐29 100
30‐34 100
35‐39 100
40‐44 100
45‐49 100
50‐54 100
55‐59 100
60‐64 100
65+ 100
Total 100
Total 15‐19 100
20‐24 100
25‐29 100
30‐34 100
35‐39 100
40‐44 100
45‐49 100
50‐54 100
55‐59 100
60‐64 100
65+ 100
Total 100
Manual 7 - Part 1 - Tabulation plan
Page 46
Table 2.17 Out migrants and citizenship of spouse
Percent distribution of all out migrants by citizenship of spouse, according to gender and number of times married
Gender of out migrant Nationality of spouse at marriage by number of times married
Male Female Total
A) Married once only
Country of origin of migrant
Country of any migration*
Other nationality
B) Married more than once
B‐1) First spouse
Country of origin of migrant
Country of any migration*
Other nationality
B‐2) Current / Last spouse
Country of origin of migrant
Country of any migration*
Other nationality
Total 100 100 100
Number ever‐married
*Includes any country resided in by out migrant for more than 3 months.
Manual 7 - Part 1 - Tabulation plan
Page 47
Table 2.18 Employment status before migration
Percent distribution of out migrants who moved to (FIRST DESTINATION SINCE START DATE OF REFERENCE PERIOD) by employment status before migration, according to selected characteristics
Employment status
in the 3 months preceding migration
Did not work and Characteristic Worked
Was seeking work
Was not seeking work
Don’t know
Total Number
First destination region
Arab region 100
Europe 100
North America 100
Other 100
Age at migration
15‐29 30‐44 45‐59 60+
Current type of residence of origin household
Urban 100 Rural 100
Current region of residence of origin household
Region 1 100 Region 2 100 Region 3 100 Region 4 100 Region 5 100
Level of education of migrant before migration
No education 100 Some primary 100 Primary complete 100 Preparatory complete 100 Secondary complete 100 Higher complete 100
Total 100
Manual 7 - Part 1 - Tabulation plan
Page 48
Table 2.19 Pre‐migration contact with recruiter
Percent distribution of out migrants who moved to (FIRST DESTINATION SINCE START DATE OF REFERENCE PERIOD) by whether they had contact with a recruiter to work abroad
Characteristic
Yes:
Had contact No:
Didn’t have contact
Don’t
Know Total Number
First destination region
Arab region 100 Europe 100 North America 100 Other 100
Age at migration
15‐29 100 30‐44 100 45‐59 100 60+ 100
Current type of residence of origin household
Urban 100 Rural 100
Current region of residence of origin household
Region 1 100 Region 2 100 Region 3 100 Region 4 100 Region 5 100
Level of education before migration
No education 100 Some primary 100 Primary complete 100 Preparatory complete 100 Secondary complete 100 Higher complete 100
Total 100
Manual 7 - Part 1 - Tabulation plan
Page 49
Table 2.20 Pre‐m
igration type of recruiter
Among out migrants who m
oved to (FIRST DESTINATION SINCE START DATE
OF REFER
ENCE PER
IOD) and who had
pre‐m
igration contact with a recruiter,
the percent distribution by type of recruiter
Type of recruiter
Characteristic
Private
employm
ent
agen
cy in
(COUNTR
Y OF
ORIGIN)
Private labour
recruiter from
(COUNTR
Y OF
DESTINATION)
operating in
(COUNTR
Y OF
ORIGIN)
Private recruiter
from (COUNTR
Y OF
ORIGIN) recruiting
for em
ployer in
(COUNTR
Y OF
DESTINATION)
Agent of
governmen
t of
(COUNTR
Y OF
DESTINATION)
recruiting in
(COUNTR
Y OF
ORIGIN)
Other
Don’t know
Total
Number
First destination
A
rab region
100
Europe
100
N
orth America
100
Other
100
Age
at first migration
15‐29
100
30‐44
100
45‐59
100
60+
100
Current type of residence of origin household
U
rban
100
Rural
100
Current region of residen
ce of origin household
Region 1
100
Region 2
100
Region 3
100
Region 4
100
Region 5
100
Level of ed
ucation before first m
igration
No education
100
Some primary
100
Primary complete
100
Preparatory complete
100
Secondary complete
100
Higher complete
100
Total
100
Manual 7 - Part 1 - Tabulation plan
Page 50
Table 2.21 Pre‐m
igration m
ean
s of contacting recruiter
Among out migrants who m
oved to (FIRST DESTINATION SINCE START DATE
OF REFER
ENCE PER
IOD) and who had
pre‐m
igration contact with a recruiter,
the percent distribution by means of contacting recruiter
Means of contacting recruiter
Characteristic
OUT
MIGRANT
initiated
contact
Recruiter
initiated
contact
Relatives/
Friends in
(COUNTR
Y OF
ORIGIN)
Relatives/
Friends in
(FIRST
COUNTR
Y ABROAD)
Internet
New
s‐
papers/
Magazines
Radio/TV
Other
Don’t
know
Total
Number
First destination
A
rab region
100
Europe
100
N
orth America
100
Other
100
Age
at first migration
15‐29
100
30‐44
100
45‐59
100
60+
100
Current type of residence of origin household
U
rban
100
Rural
100
Current region of residen
ce of origin household
Region 1
100
Region 2
100
Region 3
100
Region 4
100
Region 5
100
Level of ed
ucation before first m
igration
No education
100
Some primary
100
Primary complete
100
Preparatory
complete
100
Secondary complete
100
Higher complete
100
Total
100
Manual 7 - Part 1 - Tabulation plan
Page 51
Table 2.22 Pre‐migration provision of written contract
Among out migrants who moved to (FIRST DESTINATION SINCE START DATE OF REFERENCE PERIOD) and who had pre‐migration contact with a recruiter, the percent distribution by whether recruiter provided written contract or terms of employment
Pre‐migration provision of contract or terms of employment
Characteristic
Yes No Don’t know
Total Number
First destination
Arab region 100
Europe 100
North America 100
Other 100
Age at first migration
15‐29 100
30‐44 100
45‐59 100
60+ 100
Current type of residence of origin household
Urban 100
Rural 100
Current region of residence of origin household
Region 1 100
Region 2 100
Region 3 100
Region 4 100
Region 5 100
Level of education before first migration
No education 100
Some primary 100
Primary complete 100
Preparatory complete 100
Secondary complete 100
Higher complete 100
Total 100
Manual 7 - Part 1 - Tabulation plan
Page 52
Table 2.23 Compliance of employer at destination with pre‐migration contract
Among out migrants who moved to (FIRST DESTINATION SINCE START DATE OF REFERENCE PERIOD) and who had pre‐migration contract provided by a recruiter, the percent distribution by whether employer at destination complied with written contract
Whether employer at destination complied with pre‐migration
contract or terms of employment
Characteristic
Yes No Don’t know
Total Number
First destination
Arab region 100
Europe 100
North America 100
Other 100
Age at first migration
15‐29 100
30‐44 100
45‐59 100
60+ 100
Current type of residence of origin household
Urban 100
Rural 100
Current region of residence of origin household
Region 1 100
Region 2 100
Region 3 100
Region 4 100
Region 5 100
Level of education before first migration
No education 100
Some primary 100
Primary complete 100
Preparatory complete 100
Secondary complete 100
Higher complete 100
Total 100
Manual 7 - Part 1 - Tabulation plan
Page 53
Table 2.24 Ways in which employm
ent situation at destination differed from term
s of pre‐m
igration contract
Among out migrants who m
oved to (FIRST DESTINATION SINCE START DATE
OF REFER
ENCE PER
IOD) and who had
pre‐m
igration contract and found
employm
ent situation at destination different from agreed terms of contract, the percentage of the way(s) in which employm
ent situation at destination
differed from terms of contract
Percentage of the way in
which employm
ent situation at destination
differed from terms of contract *
First destination
Level of ed
ucation
before first m
igration
Way(s) in which employm
ent situation at destination
differed from terms of contract
(Multiple response)
Arab
region
Europe
North
America
Other
Low
Med
ium
High
Total
Number
There was no job after all
Did not receive the rate of pay expected
Work was different from what m
igrant expected
Paymen
t of salary was not made on tim
e
Did not receive housing ben
efits anticipated
Did not receive food ben
efits anticipated
Did not receive health ben
efits
Did not receive other ben
efits stated
in contract
Could not bring family as anticipated
Other difference
Don’t know
*
Manual 7 - Part 1 - Tabulation plan
Page 54
Table 2.25 Pre‐migration payment to obtain work contract abroad
Among out migrants who moved to (FIRST DESTINATION SINCE START DATE OF REFERENCE PERIOD), the percent distribution by whether payment was made to get a work contract or to facilitate the move to first destination
Whether payment was made to get work contract
Characteristic
Yes No Don’t know
Total Number
First destination
Arab region 100
Europe 100
North America 100
Other 100
Age at first migration
15‐29 100
30‐44 100
45‐59 100
60+ 100
Current type of residence of origin household
Urban 100
Rural 100
Current region of residence of origin household
Region 1 100
Region 2 100
Region 3 100
Region 4 100
Region 5 100
Level of education before first migration
No education 100
Some primary 100
Primary complete 100
Preparatory complete 100
Secondary complete 100
Higher complete 100
Total 100
Manual 7 - Part 1 - Tabulation plan
Page 55
Table 2.26 Motive
for first migration by out migrants according to residence
Reason for first migration by out migrants who m
oved to (FIRST DESTINATION SINCE START DATE
OF REFER
ENCE PER
IOD), according to type of place of
residen
ce of origin household and gen
der
Type of place of residen
ce of origin household
Urban
Rural
Total
Reason(s) for moving to first destination
(Multiple response)
Male
Female
Total
Male
Female
Total
Male
Female
Total
Country of origin factors
Unemployed and
seeking work / Lack of jobs here
Income insufficient here
Transferred by employer
Work benefits here unsatisfactory
Personal problem
s with em
ployer or others at work
To get away from family problem
s
Lack of security in this country
Environm
ental disaster
Country of destination factors
Higher wages there
Good business opportunities there
To obtain more education for self
To obtain better education for children
Better social and
health services there
To reunite with family
To get married / spouse waiting for him/her there
Easier to access/gain entry
Could obtain asylum in there
Country of origin compared
with country of destination factors
To im
prove living standard
Other
Don’t know
Num
ber
Manual 7 - Part 1 - Tabulation plan
Page 56
Table 2.27 Motive
for first migration by level of education before first m
igration
Reason for first migration by out migrants who m
oved to (FIRST DESTINATION SINCE START DATE
OF REFER
ENCE PER
IOD), according to level of education
before m
igration and gender
Educational level before first m
igration
Total
Low
Med
ium
High
Reason(s) for moving to first destination
(Multiple response)
Male
Female
Total
Male
Female
Total
Male
Fem
ale
Total
Male
Female
Total
Country of origin factors
Unemployed and
seeking work / Lack of jobs here
Income insufficient here
Transferred by employer
Work benefits here unsatisfactory
Personal problem
s with em
ployer or others at work
To get away from family problem
s
Lack of security in this country
Environm
ental disaster
Country of destination factors
Higher wages there
Good business opportunities there
To obtain more education for self
To obtain better education for children
Better social and
health services there
To reunite with family
To get married / spouse waiting for him/her there
Easier to access/gain entry
Could obtain asylum in there
Country of origin compared
with country of destination factors
To im
prove living standard
Other
Don’t know
Num
ber
Manual 7 - Part 1 - Tabulation plan
Page 57
Table 2.28 Most im
portan
t motive
for first migration by out migrants according to residence
Percent distribution of out migrants who m
oved to (FIRST DESTINATION SINCE START DATE
OF REFER
ENCE PER
IOD) by the most im
portant motive for first
migration, according to type of place of residen
ce of origin household and gen
der
Type of place of residen
ce of origin household
Urban
Rural
To
tal
Most im
portant reason for moving to first destination by
out migrants
Male
Female
Total
Male
Female
Total
Male
Female
Total
Country of origin factors
Unemployed and
seeking work / Lack of jobs here
Income insufficient here
Transferred by employer
Work benefits here unsatisfactory
Personal problem
s with em
ployer or others at work
To get away from family problem
s
Lack of security in this country
Environm
ental disaster
Country of destination factors
Higher wages there
Good business opportunities there
To obtain more education for self
To obtain better education for children
Better social and
health services there
To reunite with family
To get married / spouse waiting for him/her there
Easier to access/gain entry
Could obtain asylum in there
Country of origin compared
with country of destination factors
To im
prove living standard
Other
Don’t know
Total
100.0
100.0
100.0
100.0
100.0
100.0
100.0
100.0
100.0
Num
ber
Manual 7 - Part 1 - Tabulation plan
Page 58
Table 2.29 Most im
portan
t motive
for first migration by out migrants according to level of education
Percent distribution of out migrants who m
oved to (FIRST DESTINATION SINCE START DATE
OF REFER
ENCE PER
IOD) by the most im
portant motive for first
migration, according to level of ed
ucation before m
igration and gen
der
Educational level before first m
igration
Total
Low
Med
ium
High
Most im
portant reason for moving to first destination by
out migrants
Male
Female
Total
Male
Female
Total
Male
Fem
ale
Total
Male
Female
Total
Country of origin factors
Unemployed and
seeking work / Lack of jobs here
Income insufficient here
Transferred by employer
Work benefits here unsatisfactory
Personal problem
s with em
ployer or others at work
To get away from family problem
s
Lack of security in this country
Environm
ental disaster
Country of destination factors
Higher wages there
Good business opportunities there
To obtain more education for self
To obtain better education for children
Better social and
health services there
To reunite with family
To get married / spouse waiting for him/her there
Easier to access/gain entry
Could obtain asylum in there
Country of origin compared
with country of destination factors
To im
prove living standard
Other
Don’t know
Total
100.0
100.0
100.0
100.0
100.0
100.0
100.0
100.0
100.0
100.0
100.0
100.0
Num
ber
Manual 7 - Part 1 - Tabulation plan
Page 59
Table 2.30.1 Who m
ade the decision for out migrant to m
igrate by residence before first m
igration
Percent distribution of out migrants who m
oved to (FIRST DESTINATION SINCE START DATE
OF REFER
ENCE PER
IOD) by the person m
aking the decision for
out migrant to m
igrate, according type of place of residen
ce of origin household and gen
der
Type of place of residen
ce of origin household
Urban
Rural
To
tal
Person m
aking the migration decision
Male
Female
Total
Male
Female
Total
Male
Female
Total
Out M
igrant
Spouse / Fiancé
Child(ren)
Parents
Other relative
Employer
Friends
Other
Don’t know
Total
100.0
100.0
100.0
100.0
100.0
100.0
100.0
100.0
100.0
Num
ber
Manual 7 - Part 1 - Tabulation plan
Page 60
Table 2.30.2 Who m
ade the decision for out migrant to m
igrate by level of education before first m
igration
Percent distribution of out migrants who m
oved to (FIRST DESTINATION SINCE START DATE
OF REFER
ENCE PER
IOD) by the person m
aking the decision for
out migrant to m
igrate, according to level of ed
ucation before m
igration and gen
der
Educational level before first m
igration
Low
Med
ium
High
Total
Person m
aking the migration decision
Male
Female
Total
Male
Female
Total
Male
Fem
ale
Total
Male
Female
Total
Out M
igrant
Spouse / Fiancé
Child(ren)
Parents
Other relative
Employer
Friends
Other
Don’t know
Total
100.0
100.0
100.0
100.0
100.0
100.0
100.0
100.0
100.0
100.0
100.0
100.0
Num
ber
Manual 7 - Part 1 - Tabulation plan
Page 61
Table 2.31.1 Admission documents and compliance with regulations by out migrants, according to residence
Percent distribution of out migrants who m
oved to (COUNTR
Y OF CURREN
T DESTINATION SINCE START DATE OF REFER
ENCE PER
IOD) by type of admission
document, according to type of place of residen
ce of origin household and gen
der
Type of place of residen
ce of origin household
Urban
Rural
To
tal
Admission document
Male
Female
Total
Male
Female
Total
Male
Female
Total
a) Yes: Visa and/or document
Tourist visa
Business visa
Student visa
Refugee visa
Temporary residence permit
Migrant/Residence permit
Work permit
Other
Don’t know
b) N
o visa or document
Asked
for political asylum
Undocumented entry
Other
Don’t know
c) Did not need visa
d) D
on’t know
Total
100.0
100.0
100.0
100.0
100.0
100.0
100.0
100.0
100.0
Num
ber
Manual 7 - Part 1 - Tabulation plan
Page 62
Table 2.31.2 Admission documents and compliance with regulations by out migrants, according to level o
f education before first m
igration
Percent distribution of out migrants who m
oved to (COUNTR
Y OF CURREN
T DESTINATION SINCE START DATE OF REFER
ENCE PER
IOD) by type of admission
document, according to level of ed
ucation before m
igration and gen
der
Educational level before first m
igration
Low
Med
ium
High
Total
Admission document
Male
Female
Total
Male
Female
Total
Male
Fem
ale
Total
Male
Female
Total
a) Yes: Visa and/or document
Tourist visa
Business visa
Student visa
Refugee visa
Temporary residence permit
Migrant/Residence permit
Work permit
Other
Don’t know
b) N
o visa or document
Asked
for political asylum
Undocumented entry
Other
Don’t know
c) Did not need visa
d) D
on’t know
Total
100.0
100.0
100.0
100.0
100.0
100.0
100.0
100.0
100.0
100.0
100.0
100.0
Num
ber
Manual 7 - Part 1 - Tabulation plan
Page 63
Table 2.32 Admission documents and compliance with regulations by current destination
Percent distribution of out migrants who moved to (COUNTRY OF CURRENT DESTINATION SINCE START DATE OF REFERENCE PERIOD) by type of admission document, according to region of current destination
Region of current destination Admission document
Arab region
Europe North America
Other
Total
a) Yes: Visa and/or document
Tourist visa
Business visa
Student visa
Refugee visa
Temporary residence permit
Migrant/Residence permit
Work permit
Other
Don’t know b) No visa or document
Asked for political asylum
Undocumented entry
Other
Don’t know c) Did not need visa d) Don’t know
Total 100.0 100.0 100.0 100.0 100.0
Number
Manual 7 - Part 1 - Tabulation plan
Page 64
Table 2.33 Family arrangements typology at current destination
Percent distribution of out migrants by family arrangements typology at country of current residence
Country of current residence Gender
Family arrangement Arab
region Europe North
America Other
Total
Males a) Migrant never married
‐ Migrant living alone
‐ Migrant with other relatives
b) Migrant ever married
‐ Migrant living alone
‐ Migrant with spouse
‐ Migrant with children
‐ Migrant with spouse and children
‐ Migrant with other relatives
‐ Migrant with spouse + other relatives
‐ Migrant with children + other relatives
‐ Migrant with spouse + children +other relatives
Total 100.0 100.0 100.0 100.0 100.0
Number
Females a) Migrant never married
‐ Migrant living alone
‐ Migrant with other relatives
b) Migrant ever married
‐ Migrant living alone
‐ Migrant with spouse
‐ Migrant with children
‐ Migrant with spouse and children
‐ Migrant with other relatives
‐ Migrant with spouse + other relatives
‐ Migrant with children + other relatives
‐ Migrant with spouse + children +other relatives
Total 100.0 100.0 100.0 100.0 100.0
Number
Total a) Migrant never married
‐ Migrant living alone
‐ Migrant with other relatives
b) Migrant ever married
Manual 7 - Part 1 - Tabulation plan
Page 65
‐ Migrant living alone
‐ Migrant with spouse
‐ Migrant with children
‐ Migrant with spouse and children
‐ Migrant with other relatives
‐ Migrant with spouse + other relatives
‐ Migrant with children + other relatives
‐ Migrant with spouse + children +other relatives
Total 100.0 100.0 100.0 100.0 100.0
Number
Manual 7 - Part 1 - Tabulation plan
Page 66
Table 2.34 Proficiency in
the language of country of current destination
Percent distribution of out migrants who m
oved to (COUNTR
Y OF CURREN
T DESTINATION SINCE START DATE OF REFER
ENCE PER
IOD) by proficiency in
the
host country language, according to: (a) level of ed
ucation before last m
igration, and (b) curren
t level of education
Region of curren
t destination
Arab region
Europe
North America
Other
Total
A. Level of education before m
arriage
Proficien
cy in
the
host country
language
Low
Med
ium
High
Low
Medium
High
Low
Med
ium
High
Low
Med
ium
High
Low
Med
ium
High
a) Proficiency before m
igration
Native language
Fluen
t
Good
Somew
hat
Not well
Not at all
Don’t know
Total
100.0
100.0
100.0
100.0
100.0
100.0
100.0
100.0
100.0
100.0
100.0
100.0
100.0
100.0
100.0
B. C
urrent Level of education
Low
Med
ium
High
Low
Medium
High
Low
Med
ium
High
Low
Med
ium
High
Low
Med
ium
High
b) Proficiency now*
Fluen
t
Good
Somew
hat
Not well
Not at all
Don’t know
Total
100.0
100.0
100.0
100.0
100.0
100.0
100.0
100.0
100.0
100.0
100.0
100.0
100.0
100.0
100.0
*Figures refer to those whose proficien
cy in
host country language before m
igration in
section (a) above was rep
orted
as below ‘fluent’.
Manual 7 - Part 1 - Tabulation plan
Page 67
MQ-3 Return Migrant
Manual 7 - Part 1 - Tabulation plan
Page 68
Table 3.1 Selected Characteristics of return migrants
Percent distribution of all return migrants according to selected background characteristics
Characteristic Percent Characteristic Percent
Gender Employment status before first migration Male Worked Female Was not working & seeking work Was not working and not seeking work Childhood type of residence Urban Destination at first migration Rural Arab region Europe Current Type of place of residence North America Urban Other Rural Number of countries lived in abroad Current Region of residence 1 Region 1 2 Region 2 3 Region 3 4+ Region 4 Region 5 Last destination Arab region Educational status at first migration Europe No education North America Some primary Other Primary complete /some preparatory Preparatory complete /some secondary Motive for first migration since 2000 Secondary complete/ some post‐secondary Work Higher complete Study Study & work Current educational status Follow a family member abroad No education Other Some primary Primary complete /some preparatory Length of residence in last destination (years) Preparatory complete /some secondary 0‐4 Secondary complete/ some post‐secondary 5‐9 Higher complete 10‐14 15+ Marital status at first migration Single Employment status at last destination Married Worked Separated Was not working & seeking work Divorced Was not working and not seeking work Widowed Current employment status Current marital status Currently working Single Currently not working & seeking work Married Currently not working & not seeking work Separated Divorced Future migration intentions Widowed Remain in country of origin Return to country of last destination Move to another country Undecided
Manual 7 - Part 1 - Tabulation plan
Page 69
Table 3.2 Last destination of return migrants
Distribution of all return migrants by last destination and gender
Males Females Total Country of last destination
Number % Number % Number %
Other*
Total 100 100 100 *Includes countries with fewer than one percent of return migrants
Manual 7 - Part 1 - Tabulation plan
Page 70
Table 3.3 Year of return of migrants
Distribution of all return m
igrants by year of return from last destination, according to year of migration to last destination and gender
Year of migration to last country abroad
Before 1990
1990‐1994
1995‐1999
2000‐2004
2005‐2009
2010+
Total
Year of
return to country of
origin
Number
%
Number
%
Number
%
Number
%
Number
%
Number
%
Number
%
Males
2000
2001
¦
2013
Year of survey
Total
100
100
100
100
100
100
100
Females
2000
2001
¦
2013
¦
Year of survey
Total
100
100
100
100
100
100
100
Total
2000
2001
¦
2013
¦
Year of survey
Total
100
100
100
100
100
100
100 Manual 7 - Part 1 - Tabulation plan
Page 71
Table 3.4 Return migrants and number of destination countries
Percent distribution of all return migrants by the number of all destination countries lived in for 3 or more months, according to selected background characteristics
Number of all destination countries Characteristic
1 2 3 4+ Total Number
Age 15‐29 100.0 30‐44 100.0 45‐59 100.0 60+ 100.0
Gender
Male 100.0
Females 100.0 Current type of residence Urban 100.0 Rural 100.0
Current Region of residence Region 1 100.0 Region 2 100.0 Region 3 100.0 Region 4 100.0 Region 5 100.0
Current level of education No education 100.0 Some primary 100.0 Primary complete /some preparatory 100.0 Preparatory complete /some secondary 100.0 Secondary complete/ some post‐secondary 100.0 Higher complete 100.0
Last destination before returning Arab region 100.0 Europe 100.0 North America 100.0 Other 100.0
Total 100.0
Manual 7 - Part 1 - Tabulation plan
Page 72
Table 3.5 First versus last destinations of return migrants
Percent distribution of all return migrants by region of last destination, according to region of first destination
Region of last destination Region of first destination Arab region Europe North America Other
Total
Males 100.0 Arab region 100.0 Europe 100.0 North America 100.0 Other 100.0
Females 100.0 Arab region 100.0 Europe 100.0 North America 100.0 Other 100.0
Total 100.0 Arab region 100.0 Europe 100.0 North America 100.0 Other 100.0
Manual 7 - Part 1 - Tabulation plan
Page 73
Table 3.6 Age
‐sex distribution of return m
igrants
Percent distribution of all return m
igrants by age, according to sex and selected characteristics
Table 3.6.1: Males
Curren
t age of return m
igrant
Characteristic
15‐19
20‐24
25‐29
30‐34
35‐39
40‐44
45‐49
50‐54
55‐59
60‐64
65+
Total
Number
Region of last destination
Arab region
100.0
Europe
100.0
North America
100.0
Other
100.0
Current type of place of residence
Urban
100.0
Rural
100.0
Current region of residence
Region 1
100.0
Region 2
100.0
Region 3
100.0
Region 4
100.0
Region 5
100.0
Current educational status
No education
100.0
Some primary
100.0
Primary complete /some preparatory
100.0
Preparatory complete /some secondary
100.0
Secondary complete/ some post‐
secondary
100.0
Higher complete
100.0
Total
100.0
Manual 7 - Part 1 - Tabulation plan
Page 74
Table 3.6 Age
‐sex distribution of return m
igrants, continued
Percent distribution of all return m
igrants by age, according to sex and selected background characteristics
Table 3.6.2: Females
Curren
t age of return m
igrant
Characteristic
15‐19
20‐24
25‐29
30‐34
35‐39
40‐44
45‐49
50‐54
55‐59
60‐64
65+
Total
Number
Region of last destination
Arab region
100.0
Europe
100.0
North America
100.0
Other
100.0
Current type of place of residence
Urban
100.0
Rural
100.0
Current region of residence
Region 1
100.0
Region 2
100.0
Region 3
100.0
Region 4
100.0
Region 5
100.0
Current educational status
No education
100.0
Some primary
100.0
Primary complete /some preparatory
100.0
Preparatory complete /some secondary
100.0
Secondary complete/ some post‐
secondary
100.0
Higher complete
100.0
Total
100.0
Manual 7 - Part 1 - Tabulation plan
Page 75
Table 3.6 Age
‐sex distribution of return m
igrants, continued
Percent distribution of all return m
igrants by age, according to gen
der and selected background characteristics
Table 3.6.3: Total
Curren
t age of return m
igrant
Characteristic
15‐19
20‐24
25‐29
30‐34
35‐39
40‐44
45‐49
50‐54
55‐59
60‐64
65+
Total
Number
Region of last destination
Arab region
100.0
Europe
100.0
North America
100.0
Other
100.0
Current type of place of residence
Urban
100.0
Rural
100.0
Current region of residence
Region 1
100.0
Region 2
100.0
Region 3
100.0
Region 4
100.0
Region 5
100.0
Current educational status
No education
100.0
Some primary
100.0
Primary complete /some preparatory
100.0
Preparatory complete /some secondary
100.0
Secondary complete/ some post‐
secondary
100.0
Higher complete
100.0
Total
100.0
Manual 7 - Part 1 - Tabulation plan
Page 76
Table 3.7 Relative age distribution of return migrants
Relative distribution of all return migrants according to current age within categories of socio‐economic characteristics
Current age of migrant Characteristic
15‐19 20‐29 30‐39 40‐49 50‐59 60+
Percent distribution of return migrants
Gender Male Female Current type of place of residence Urban Rural Current region of residence Region 1 Region 2 Region 3 Region 4 Region 5 Childhood type of residence Urban Rural Current educational status No education Some primary Primary complete /some preparatory Preparatory complete /some secondary Secondary complete/ some post‐secondary Higher complete Region of last destination Arab region Europe North America Other Current employment status Currently working Not currently working & seeking work Not currently working & not seeking work
Manual 7 - Part 1 - Tabulation plan
Page 77
Table 3.8 Headship and composition of return migrants’ households
Among households with one or more return migrants, the percent distribution by sex of head of household and household size, according to residence
Current type of place of residence
Current region of residence
Characteristic Urban Rural Region 1 Region 2 Region 3 Region 4 Region 5
Total
Household headship
Male
Female
Total 100.0 100.0 100.0 100.0 100.0 100.0 100.0 100.0
Number of usual residence
1
2
3
4
5
6
7
8
9+
Total 100.0 100.0 100.0 100.0 100.0 100.0 100.0 100.0
Number of households
Mean size
Manual 7 - Part 1 - Tabulation plan
Page 78
Table 3.9 Marital status of out migrants
Percent distribution of all return migrants by current marital status, according to age and gender
Marital status Age
Single Married Separated Divorced Widowed Total Number
Males 15‐19 100
20‐24 100
25‐29 100
30‐34 100
35‐39 100
40‐44 100
45‐49 100
50‐54 100
55‐59 100
60‐64 100
65+ 100
Total 100
Females 15‐19 100
20‐24 100
25‐29 100
30‐34 100
35‐39 100
40‐44 100
45‐49 100
50‐54 100
55‐59 100
60‐64 100
65+ 100
Total 100
Total 15‐19 100
20‐24 100
25‐29 100
30‐34 100
35‐39 100
40‐44 100
45‐49 100
50‐54 100
55‐59 100
60‐64 100
65+ 100
Total 100
Manual 7 - Part 1 - Tabulation plan
Page 79
Table 3.10 Age at first migration of return migrants
Median age at first migration of all return migrants, according to selected background characteristics
Males Females Total
Year of first migration
Background characteristic
Before 2000
Since 2000
Before 2000
Since 2000
Before 2000
Since 2000
Destination at first migration
Arab region
Europe
North America
Other
Current type of residence
Urban Rural Current region of residence Region 1 Region 2 Region 3 Region 4 Region 5 Level of education before first migration No education Some primary Primary complete /some preparatory Preparatory complete /some secondary Secondary complete/ some post‐secondary Higher complete
Total
Manual 7 - Part 1 - Tabulation plan
Page 80
Table 3.11 Employment status before migration
Percent distribution of return migrants who moved to (FIRST DESTINATION SINCE START DATE OF REFERENCE PERIOD) by employment status before migration, according to selected characteristics
Employment status
in the 3 months preceding first migration
Did not work and Characteristic Worked
Was seeking work
Was not seeking work
Total Number
First destination region
Arab region 100
Europe 100
North America 100
Other 100
Age at first migration
15‐29 100 30‐44 100 45‐59 100 60+ 100
Current type of residence of origin household
Urban 100 Rural 100
Current region of residence of origin household
Region 1 100 Region 2 100 Region 3 100 Region 4 100 Region 5 100
Level of education of return migrant before first migration
No education 100 Some primary 100 Primary complete 100 Preparatory complete 100 Secondary complete 100 Higher complete 100
Total 100
Manual 7 - Part 1 - Tabulation plan
Page 81
Table 3.12 Pre‐migration contact with recruiter among return migrants
Percent distribution of return migrants who moved to (FIRST DESTINATION SINCE START DATE OF REFERENCE PERIOD) by whether they had contact with a recruiter to work abroad
Characteristic
Yes:
Had contact No:
Didn’t have contact
Total Number
First destination region
Arab region 100 Europe 100 North America 100 Other 100
Age at migration
15‐29 100 30‐44 100 45‐59 100 60+ 100
Current type of residence of origin household
Urban 100 Rural 100
Current region of residence of origin household
Region 1 100 Region 2 100 Region 3 100 Region 4 100 Region 5 100
Level of education before first migration
No education 100 Some primary 100 Primary complete 100 Preparatory complete 100 Secondary complete 100 Higher complete 100
Total 100
Manual 7 - Part 1 - Tabulation plan
Page 82
Table 3.13.1 Reasons of first migration by return m
igrants according to residence
Reason for first migration among return m
igrants who m
oved to (FIRST DESTINATION SINCE START DATE OF REFER
ENCE PER
IOD), according to type of place
of residen
ce of origin household and gen
der
Type of place of residen
ce of origin household
Urban
Rural
To
tal
Reason(s) for moving to first destination
(Multiple response)
Male
Female
Total
Male
Female
Total
Male
Female
Total
Unemployed & seeking work/Lack of jobs in country
Income insufficient here/ Higher wages there
Transferred by em
ployer
Good business opportunities there
Work ben
efits here unsatisfactory
To im
prove living standard
Personal problems with employer or others at work
To obtain m
ore education for self
To obtain better education for children
Better social and health services there
To reu
nite with fam
ily
To get m
arried
/ spouse waiting for me there
To get away from fam
ily problems
Easier to access / gain entry
Could obtain asylum in
there
Lack of security in
country
Environmental disaster
Other
Num
ber of return migrants
Manual 7 - Part 1 - Tabulation plan
Page 83
Table 3.13.2 Reasons of first migration by return m
igrants according to level o
f education before m
igration
Reason for first migration among return m
igrants who m
oved to (FIRST DESTINATION SINCE START DATE OF REFER
ENCE PER
IOD), according to level of
education before m
igration and gen
der
Educational level before first m
igration
Low
Med
ium
High
To
tal
Reason(s) for moving to first destination
(Multiple response)
Male
Female
Total
Male
Female
Total
Male
Fem
ale
Total
Male
Female
Total
Unemployed & seeking work/Lack of jobs in country
Income insufficient here/ Higher wages there
Transferred by em
ployer
Good business opportunities there
Work ben
efits here unsatisfactory
To im
prove living standard
Personal problems with employer or others at work
To obtain m
ore education for self
To obtain better education for children
Better social and health services there
To reu
nite with fam
ily
To get m
arried
/ spouse waiting for me there
To get away from fam
ily problems
Easier to access / gain entry
Could obtain asylum in
there
Lack of security in
country
Environmental disaster
Other
Num
ber of return migrants
Manual 7 - Part 1 - Tabulation plan
Page 84
Table 3.14.1 Most im
portan
t motive
for first migration by return m
igrants according to residence
Percent distribution of return m
igrants who m
oved to (FIRST DESTINATION SINCE START DATE
OF REFER
ENCE PER
IOD) by the most im
portant motive for
first migration, according to type of place of residen
ce of origin household and gen
der
Type of place of residen
ce of origin household
Urban
Rural
To
tal
Most im
portant reason for moving to first destination
Male
Female
Total
Male
Female
Total
Male
Female
Total
Unemployed & seeking work/Lack of jobs in country
Income insufficient here/ Higher wages there
Transferred by em
ployer
Good business opportunities there
Work ben
efits here unsatisfactory
To im
prove living standard
Personal problems with employer or others at work
To obtain m
ore education for self
To obtain better education for children
Better social and health services there
To reu
nite with fam
ily
To get m
arried
/ spouse waiting for me there
To get away from fam
ily problems
Easier to access / gain entry
Could obtain asylum in
there
Lack of security in
country
Environmental disaster
Other
Total
100.0
100.0
100.0
100.0
100.0
100.0
100.0
100.0
100.0
Num
ber of return migrants
Manual 7 - Part 1 - Tabulation plan
Page 85
Table 3.14.2 Most im
portan
t motive
for first migration by return m
igrants according to level of education
Percent distribution of return m
igrants who m
oved to (FIRST DESTINATION SINCE START DATE
OF REFER
ENCE PER
IOD) by the most im
portant motive for
first migration, according to level of education before m
igration and gender
Educational level before first m
igration
Low
Med
ium
High
To
tal
Most im
portant reason for moving to first destination
Male
Female
Total
Male
Female
Total
Male
Fem
ale
Total
Male
Female
Total
Unemployed & seeking work/Lack of jobs in country
Income insufficient here/ Higher wages there
Transferred by em
ployer
Good business opportunities there
Work ben
efits here unsatisfactory
To im
prove living standard
Personal problems with employer or others at work
To obtain m
ore education for self
To obtain better education for children
Better social and health services there
To reu
nite with fam
ily
To get m
arried
/ spouse waiting for me there
To get away from fam
ily problems
Easier to access / gain entry
Could obtain asylum in
there
Lack of security in
country
Environmental disaster
Other
Total
100.0
100.0
100.0
100.0
100.0
100.0
100.0
100.0
100.0
100.0
100.0
100.0
Num
ber of return migrants
Manual 7 - Part 1 - Tabulation plan
Page 86
Table 3.15.1 Who m
ade the decision for return m
igrant to m
igrate, according to residence
Percent distribution of return m
igrants who m
oved to (FIRST DESTINATION SINCE START DATE
OF REFER
ENCE PER
IOD) by the person m
aking the decision
for return m
igrant to m
igrate, according type of place of residen
ce of origin household and gen
der
Type of place of residen
ce of origin household
Urban
Rural
To
tal
Person m
aking the migration decision
Male
Female
Total
Male
Female
Total
Male
Female
Total
Return migrant
Spouse / Fiancé
Child(ren)
Parents
Other relative
Com
munity mem
bers
Employer in destination country
Employer in country of origin
Other
Total
100.0
100.0
100.0
100.0
100.0
100.0
100.0
100.0
100.0
Num
ber of return migrants
Manual 7 - Part 1 - Tabulation plan
Page 87
Table 3.15.2 Who m
ade the decision for return m
igrant to m
igrate, according to level of education before first m
igration
Percent distribution of return m
igrants who m
oved to (FIRST DESTINATION SINCE START DATE
OF REFER
ENCE PER
IOD) by the person m
aking the decision
for return m
igrant to m
igrate, according to level of education before m
igration and gen
der
Educational level before first m
igration
Low
Med
ium
High
To
tal
Person m
aking the migration decision
Male
Female
Total
Male
Female
Total
Male
Fem
ale
Total
Male
Female
Total
Return migrant
Spouse / Fiancé
Child(ren)
Parents
Other relative
Com
munity mem
bers
Employer in destination country
Employer in country of origin
Other
Total
100.0
100.0
100.0
100.0
100.0
100.0
100.0
100.0
100.0
100.0
100.0
100.0
Num
ber
Manual 7 - Part 1 - Tabulation plan
Page 88
Table 3.16.1 Admission documents and compliance with regulations by return m
igrants, according to residence
Percent distribution of return m
igrants who m
oved to (FIRST DESTINATION SINCE START DATE
OF REFER
ENCE) by type of admission document, according to
type of place of residen
ce of origin household and gen
der
Type of place of residen
ce of origin household
Urban
Rural
To
tal
Admission document
Male
Female
Total
Male
Female
Total
Male
Female
Total
a) Yes: Visa and/or document
Tourist visa
Work visa / perm
it
Business visa
Student visa
Refugee visa (UNHCR)
Temporary residence permit
Migrant/Residence permit
Other
b) N
o visa or document
Asked
for political asylum
Undocumented entry
Other
c) Did not need visa
Total
100.0
100.0
100.0
100.0
100.0
100.0
100.0
100.0
100.0
Num
ber
Manual 7 - Part 1 - Tabulation plan
Page 89
Table 3.16.2 Admission documents and compliance with regulations by return m
igrants, according to level of education before first m
igration
Percent distribution of return m
igrants who m
oved to (FIRST DESTINATION SINCE START DATE
OF REFER
ENCE) by type of admission document, according to
level of ed
ucation before m
igration and gender
Educational level before first m
igration
Low
Med
ium
High
To
tal
Admission document
Male
Female
Total
Male
Female
Total
Male
Fem
ale
Total
Male
Female
Total
a) Yes: Visa and/or document
Tourist visa
Work visa / perm
it
Business visa
Student visa
Refugee visa (UNHCR)
Temporary residence permit
Migrant/Residence permit
Other
b) N
o visa or document
Asked
for political asylum
Undocumented entry
Other
c) Did not need visa
Total
100.0
100.0
100.0
100.0
100.0
100.0
100.0
100.0
100.0
100.0
100.0
100.0
Num
ber
Manual 7 - Part 1 - Tabulation plan
Page 90
Table 3.17 Admission documents and compliance with regulations by return migrants, according to first destination
Percent distribution of out migrants who moved to (FIRST DESTINATION SINCE START DATE OF REFERENCE PERIOD) by type of admission document, according to first destination
First destination Admission document Arab
region Europe North
America Other
Total
a) Yes: Visa and/or document
Tourist visa
Business visa
Student visa
Refugee visa
Temporary residence permit
Migrant/Residence permit
Work permit
Other
Don’t know
b) No visa or document
Asked for political asylum
Undocumented entry
Other
Don’t know
c) Did not need visa
d) Don’t know
Total 100.0 100.0 100.0 100.0 100.0
Number
Manual 7 - Part 1 - Tabulation plan
Page 91
Table 3.18 Length of residence in
last destination before returning
Percent distribution of all return m
igrants by length of residen
ce in
country of last destination, according to gen
der and selected characteristics
Length of residen
ce in
country of last destination (years)
Males
Females
Total
Characteristic
0‐4
5‐9 10‐1415‐19
20+
Total
N
0‐4
5‐9 10‐14 15‐19
20+
Total
N
0‐4
5‐9 10‐1415‐19
20+
Total
N
Last destination
Arab region
100.0
100.0
100.0
Eu
rope
100.0
100.0
100.0
North America
100.0
100.0
100.0
Other
100.0
100.0
100.0
Current type of place of residence
Urban
100.0
100.0
100.0
Rural
100.0
100.0
100.0
Current region of residen
ce
Region 1
100.0
100.0
100.0
Region 2
100.0
100.0
100.0
Region 3
100.0
100.0
100.0
Region 4
100.0
100.0
100.0
Region 5
100.0
100.0
100.0
Current ed
ucational status
No education
100.0
100.0
100.0
Some primary
100.0
100.0
100.0
Primary complete
100.0
100.0
100.0
Preparatory complete
100.0
100.0
100.0
Secondary complete
100.0
100.0
100.0
Higher complete
100.0
100.0
100.0
Total
100.0
100.0
100.0
Manual 7 - Part 1 - Tabulation plan
Page 92
Table 3.19 Family arrangements typology before returning from last destination
Percent distribution of return migrants by living arrangements typology before returning from last destination
Last destination Family arrangement before returning
Arab region
Europe North America
Other
Total
a) Return migrant never married
‐ Migrant lived alone
‐ Migrant lived with other relatives
b) Return migrant ever married
‐ Migrant lived alone
‐ Migrant lived with spouse
‐ Migrant lived with children
‐ Migrant lived with spouse +children
‐ Migrant lived with other relatives
‐ Migrant lived with spouse + other relatives
‐ Migrant lived with children +other relatives
‐ Migrant lived with spouse + children + other relatives
Total 100.0 100.0 100.0 100.0 100.0
Number
Manual 7 - Part 1 - Tabulation plan
Page 93
Table 3.20 Who returned from where
Percent distribution of all return migrants by country of last destination, according to current residence and current educational status
Characteristics of return migrants
Current type of place of residence
Current region of residence Current educational
status
Country of last destination Urban Rural Region
1 Region
2 Region
3 Region
4 Region
5 Low Medium High
Total
Arab region
Europe
North America
Other
Total 100 100 100 100 100 100 100 100 100 100 100
Number
Table 3.21 Return migrants and citizenship of spouse
Percent distribution of return migrants by citizenship of spouse, according to gender and number of times married
Gender of return migrant Nationality of spouse at marriage by number of times married
Male Female Total
A) Married once only
Country of origin of return migrant
Country of any migration*
Other nationality
B) Married more than once
B‐1) First spouse
Country of origin of return migrant
Country of any migration*
Other nationality
B‐2) Current / Last spouse
Country of origin of return migrant
Country of any migration*
Other nationality
Total 100 100 100
Number ever‐married
Manual 7 - Part 1 - Tabulation plan
Page 94
*Includes any country resided in by return migrant for more than 3 months.
Table 3.22 Level of education of return migrants before first migration and after returning
Percent distribution of all return migrants by: (a) level of education before first migration, and (b) current level of education
Before first migration Current level
Level of education Male Female Total Male Female Total
No education
Some primary
Primary complete /some preparatory
Preparatory complete /some secondary
Secondary complete/ some post‐secondary
Higher complete
Total 100.0 100.0 100.0 100.0 100.0 100.0
Number of return migrants
Table 3.23 Share of female return migrants by educational level
Female return migrants as a share of total return migrants by current level of education according to last destination
Last destination
No education
Some primary
Primary complete /some
preparatory
Preparatory complete /some
secondary
Secondary complete/ some post‐secondary
Higher complete
Total
Arab region
Europe
North America
Other
Total
Number
Manual 7 - Part 1 - Tabulation plan
Page 95
Table 3.24 Country aw
arding higher degrees of highly skilled return m
igrants
Distribution of tertiary‐educated return m
igrants by country aw
arding higher degree
Degree
Bachelor
Higher diploma / Master
Doctorate
Country aw
arding degree
Country aw
arding degree
Country aw
arding degree
Characteristic
Country
of origin
Arab
country Europe
North
America
Other
Total
Country
of origin
Arab
countryEu
rope
North
America
Other
Total
Country
of origin
Arab
country
Europe North
America
Other
Total
Country of last destination
Arab region
100
100
100
Europe
100
100
100
North
America
100
100
100
Other
100
100
100
Current type of residence
Urban
100
100
100
Rural
100
100
100
Current region of residen
ce
Region 1
100
100
100
Region 2
100
100
100
Region 3
100
100
100
Region 4
100
100
100
Region 5
100
100
100
Total
100
100
100
Manual 7 - Part 1 - Tabulation plan
Page 96
Table 3.25 Highly skilled return m
igrants and length of residence at last destination
Among all return m
igrants, the percentage of tertiary‐educated return m
igrants, according to length of residen
ce in
last destination
Length of residen
ce at last destination (years) and gen
der
0‐4
5‐9
10‐14
15+
Total
Last destination
M
F T
M
F T
M
F T
M
F T
M
F T
Arab region
%
N
Europe
%
N
North America
%
N
Other
%
N
Total
%
N
Manual 7 - Part 1 - Tabulation plan
Page 97
MQ-4 Non Migrant
Manual 7 - Part 1 - Tabulation plan
Page 98
Table 4.1 Selected Characteristics of non migrants
Percent distribution of all non‐migrants according by selected background characteristics, according to migration status of household
Non migrants residing in:
Characteristic Migrant household
Non‐migrant household
All
non migrants
Gender Male Female Age 15‐29 30‐44 45‐59 60+ Current Type of place of residence Urban Rural Current Region of residence Region 1 Region 2 Region 3 Region 4 Region 5 Current educational status No education Some primary Primary complete /some preparatory Preparatory complete /some secondary Secondary complete/ some post‐secondary Higher complete Current marital status Single Married Separated Divorced Widowed Current employment status Currently working Currently not working & seeking work Currently not working & not seeking work Migration intentions Remain in country of origin Move to another country Undecided Main reason for intention to migrate Work Study Study & work Follow a family member abroad Other Intended destination Arab region Europe North America Other
Total 100.0 100.0 100.0
Number of non migrants
Manual 7 - Part 1 - Tabulation plan
Page 99
Table 4.2 Age
‐sex distribution of all n
on m
igrants
Percent distribution of all non m
igrants by age, according to sex and selected characteristics
Table 4.2.1: Males
Curren
t age of non m
igrant
Characteristic
15‐19
20‐24
25‐29
30‐34
35‐39
40‐44
45‐49
50‐54
55‐59
60‐64
65+
Total
Number
Current type of place of residence
Urban
100.0
Rural
100.0
Current region of residence
Region 1
100.0
Region 2
100.0
Region 3
100.0
Region 4
100.0
Region 5
100.0
Current educational status
No education
100.0
Some primary
100.0
Primary complete /some preparatory
100.0
Preparatory complete /some secondary
100.0
Secondary complete/ some post‐
secondary
100.0
Higher complete
100.0
Total
100.0
Manual 7 - Part 1 - Tabulation plan
Page 100
Table 4.2 Age
‐sex distribution of all n
on m
igrants, continued
Percent distribution of all non m
igrants by age, according to sex and selected background characteristics
Table 4.2.2: Females
Curren
t age of non m
igrant
Characteristic
15‐19
20‐24
25‐29
30‐34
35‐39
40‐44
45‐49
50‐54
55‐59
60‐64
65+
Total
Number
Current type of place of residence
Urban
100.0
Rural
100.0
Current region of residence
Region 1
100.0
Region 2
100.0
Region 3
100.0
Region 4
100.0
Region 5
100.0
Current educational status
No education
100.0
Some primary
100.0
Primary complete /some preparatory
100.0
Preparatory complete /some secondary
100.0
Secondary complete/ some post‐
secondary
100.0
Higher complete
100.0
Total
100.0
Manual 7 - Part 1 - Tabulation plan
Page 101
Table 4.2 Age
‐sex distribution of all n
on m
igrants, continued
Percent distribution of all non m
igrants by age, according to gender and selected background characteristics
Table 4.2.3: Total
Curren
t age of non m
igrant
Characteristic
15‐19
20‐24
25‐29
30‐34
35‐39
40‐44
45‐49
50‐54
55‐59
60‐64
65+
Total
Number
Current type of place of residence
Urban
100.0
Rural
100.0
Current region of residence
Region 1
100.0
Region 2
100.0
Region 3
100.0
Region 4
100.0
Region 5
100.0
Current educational status
No education
100.0
Some primary
100.0
Primary complete /some preparatory
100.0
Preparatory complete /some secondary
100.0
Secondary complete/ some post‐
secondary
100.0
Higher complete
100.0
Total
100.0
Manual 7 - Part 1 - Tabulation plan
Page 102
Table 4.3 Relative age distribution of non migrants
Relative distribution of all non migrants according to current age within categories of socio‐economic characteristics
Current age of non migrant Characteristic
15‐19 20‐29 30‐39 40‐49 50‐59 60+
Percent distribution of return migrants
Gender Male Female Current type of place of residence Urban Rural Current region of residence Region 1 Region 2 Region 3 Region 4 Region 5 Childhood type of residence Urban Rural Current educational status No education Some primary Primary complete /some preparatory Preparatory complete /some secondary Secondary complete/ some post‐secondary Higher complete Current employment status Currently working Not currently working & seeking work Not currently working & not seeking work
Manual 7 - Part 1 - Tabulation plan
Page 103
Table 4.4 Headship and composition of non migrants’ households
Among households with one or more non migrants, the percent distribution by sex of head of household and household size, according to residence
Current type of place of residence
Current region of residence
Characteristic Urban Rural Region 1 Region 2 Region 3 Region 4 Region 5
Total
Household headship
Male
Female
Total 100.0 100.0 100.0 100.0 100.0 100.0 100.0 100.0
Number of usual residence
1
2
3
4
5
6
7
8
9+
Total 100.0 100.0 100.0 100.0 100.0 100.0 100.0 100.0
Number of households
Mean size
Manual 7 - Part 1 - Tabulation plan
Page 104
Table 4.5 Marital status of non migrants
Percent distribution of all non migrants by current marital status, according to age and gender
Marital status Age
Single Married Separated Divorced Widowed Total Number
Males 15‐19 100
20‐24 100
25‐29 100
30‐34 100
35‐39 100
40‐44 100
45‐49 100
50‐54 100
55‐59 100
60‐64 100
65+ 100
Total 100
Females 15‐19 100
20‐24 100
25‐29 100
30‐34 100
35‐39 100
40‐44 100
45‐49 100
50‐54 100
55‐59 100
60‐64 100
65+ 100
Total 100
Total 15‐19 100
20‐24 100
25‐29 100
30‐34 100
35‐39 100
40‐44 100
45‐49 100
50‐54 100
55‐59 100
60‐64 100
65+ 100
Total 100
Manual 7 - Part 1 - Tabulation plan
Page 105
Table 4.6 Who intend to migrate and to where
Percent distribution of potential migrants by intended destination, according to current residence and educational status
Characteristics of return migrants
Current type of place of residence
Current region of residence Current educational
status
Intended destination
Urban Rural Region 1
Region2
Region3
Region4
Region5
Low Medium High
Total
Arab region
Europe
North America
Other
Total 100 100 100 100 100 100 100 100 100 100 100
Number
Manual 7 - Part 1 - Tabulation plan
Page 106
Table 4.7 Time of intended m
igration
Among non m
igrants who intend to m
igrate, the percent distribution by the tim
e of intended
migration, according to selected background characteristics
Males
Females
Total
Time of intended
migration
Background characteristic
Within
a year Between
1 and 2
years
from
now
More
than
2
years
from
now
Not
sure
Total
Within
a year
Between
1 and 2
years
from now
More
than
2
years
from
now
Not
sure
Total
Within
a year Between
1 and 2
years
from now
More
than
2
years
from
now
Not
sure
Total
Age
15‐29
100
100
100
30‐49
100
100
100
50‐59
100
100
100
Current type of residence
U
rban
100
100
100
Rural
100
100
100
Current region of residen
ce
Region 1
100
100
100
Region 2
100
100
100
Region 3
100
100
100
Region 4
100
100
100
Region 5
100
100
100
Level of ed
ucation
No education
100
100
100
Some primary
100
100
100
Primary complete
100
100
100
Preparatory complete
100
100
100
Secondary complete
100
100
100
Current em
ploym
ent status
Curren
tly working
100
100
100
Curren
tly not working &
seeking work
100
100
100
Curren
tly not working & not
seeking work
100
100
100
Total
100
100
100 Manual 7 - Part 1 - Tabulation plan
Page 107
Table 4.8 Intended destination
Among non m
igrants who intend to m
igrate, the percent distribution by intended
destination, according to selected background characteristics
Males
Females
Total
Intended
destination
Background characteristic
Arab
region Eu
rope
North
America
Other
Total
Arab
region Eu
rope
North
America
Other
Total
Arab
region Eu
rope
North
America
Other
Total
Age
15‐29
100
100
100
30‐49
100
100
100
50‐59
100
100
100
Current type of residence
U
rban
100
100
100
Rural
100
100
100
Current region of residen
ce
Region 1
100
100
100
Region 2
100
100
100
Region 3
100
100
100
Region 4
100
100
100
Region 5
100
100
100
Level of ed
ucation
No education
100
100
100
Some primary
100
100
100
Primary complete
100
100
100
Preparatory complete
100
100
100
Secondary complete
100
100
100
Current em
ploym
ent status
Curren
tly working
100
100
100
Curren
tly not working &
seeking work
100
100
100
Curren
tly not working & not
seeking work
100
100
100
Total
100
100
100 Manual 7 - Part 1 - Tabulation plan
Page 108
Table 4.9.1 Reasons of intended m
igration by residence
Distribution of potential m
igrants by reason of thinking of moving abroad, according to type of place of residen
ce and gen
der
Type of place of residen
ce of origin household
Urban
Rural
To
tal
Reason(s) of intended
migration
(Multiple response)
Male
Female
Total
Male
Female
Total
Male
Female
Total
Unemployed and can’t find work
Poor job, low pay
Poor working conditions
High cost of living
Income insufficient here/ Higher wages there
Work ben
efits here unsatisfactory
Personal problems with employer or others at work
To im
prove living standard
Better social and health services there
To obtain m
ore education for self
To obtain better education for children
Good business opportunities there
To reu
nite with fam
ily
To get m
arried
/ spouse waiting for me there
To get away from fam
ily problems
Lack of security in
country
Political persecution
Religious persecution
Other
Num
ber of return migrants
Manual 7 - Part 1 - Tabulation plan
Page 109
Table 4.9.2 Reasons of intended m
igration by level of education
Distribution of potential m
igrants by reason of thinking of moving abroad, according to level of ed
ucation and gender
Educational level
Low
Med
ium
High
To
tal
Reason(s) of intended
migration
(Multiple response)
Male
Female
Total
Male
Female
Total
Male
Fem
ale
Total
Male
Female
Total
Unemployed & seeking work/Lack of jobs in country
Income insufficient here/ Higher wages there
Transferred by em
ployer
Good business opportunities there
Work ben
efits here unsatisfactory
To im
prove living standard
Personal problems with employer or others at work
To obtain m
ore education for self
To obtain better education for children
Better social and health services there
To reu
nite with fam
ily
To get m
arried
/ spouse waiting for me there
To get away from fam
ily problems
Easier to access / gain entry
Could obtain asylum in
there
Lack of security in
country
Environmental disaster
Other
Total
100.0
100.0
100.0
100.0
100.0
100.0
100.0
100.0
100.0
100.0
100.0
100.0
Num
ber of return migrants
Manual 7 - Part 1 - Tabulation plan
Page 110
Table 4.10.1 Most im
portan
t reason of intended m
igration according to residence
Percent distribution of potential m
igrants by the m
ost im
portant reason of intended
migration, according to type of place of residence and gen
der
Type of place of residen
ce of origin household
Urban
Rural
To
tal
Most im
portant reason for intended
migration
Male
Female
Total
Male
Female
Total
Male
Female
Total
Unemployed and can’t find work
Poor job, low pay
Poor working conditions
High cost of living
Income insufficient here/ Higher wages there
Work ben
efits here unsatisfactory
Personal problems with employer or others at work
To im
prove living standard
Better social and health services there
To obtain m
ore education for self
To obtain better education for children
Good business opportunities there
To reu
nite with fam
ily
To get m
arried
/ spouse waiting for me there
To get away from fam
ily problems
Lack of security in
country
Political persecution
Religious persecution
Other
Total
100.0
100.0
100.0
100.0
100.0
100.0
100.0
100.0
100.0
Num
ber of potential m
igrants
Manual 7 - Part 1 - Tabulation plan
Page 111
Table 4.10.2 Most im
portan
t reason of intended m
igration according to level o
f education
Percent distribution of potential m
igrants by the m
ost im
portant reason of intended
migration, according to level of ed
ucation and gen
der
Educational level before first m
igration
Low
Med
ium
High
To
tal
Most im
portant reason for intended
migration
Male
Female
Total
Male
Female
Total
Male
Fem
ale
Total
Male
Female
Total
Unemployed & seeking work/Lack of jobs in country
Income insufficient here/ Higher wages there
Transferred by em
ployer
Good business opportunities there
Work ben
efits here unsatisfactory
To im
prove living standard
Personal problems with employer or others at work
To obtain m
ore education for self
To obtain better education for children
Better social and health services there
To reu
nite with fam
ily
To get m
arried
/ spouse waiting for me there
To get away from fam
ily problems
Easier to access / gain entry
Could obtain asylum in
there
Lack of security in
country
Environmental disaster
Other
Total
100.0
100.0
100.0
100.0
100.0
100.0
100.0
100.0
100.0
100.0
100.0
100.0
Num
ber of return migrants
Manual 7 - Part 1 - Tabulation plan
Page 112
Table 4.11 Employment status of potential migrants
Percent distribution of potential migrants by current employment status, according to selected characteristics
Employment status
in the 3 months preceding first migration
Did not work and Characteristic Worked
Was seeking work
Was not seeking work
Total Number
Intended destination
Arab region 100
Europe 100
North America 100
Other 100
Age
15‐29 100 30‐44 100 45‐59 100 60+ 100
Current type of residence
Urban 100 Rural 100
Current region of residence
Region 1 100 Region 2 100 Region 3 100 Region 4 100 Region 5 100
Level of education
No education 100 Some primary 100 Primary complete 100 Preparatory complete 100 Secondary complete 100 Higher complete 100
Total 100
Manual 7 - Part 1 - Tabulation plan
Page 113
Table 4.12 Contact with recruiter among potential migrants
Percent distribution of potential migrants by whether they had contact with a recruiter to work abroad
Characteristic
Yes:
Had contact No:
Didn’t have contact
Total Number
Intended destination r
Arab region 100 Europe 100 North America 100 Other 100
Age
15‐29 100 30‐44 100 45‐59 100 60+ 100
Current type of residence
Urban 100 Rural 100
Current region of residence
Region 1 100 Region 2 100 Region 3 100 Region 4 100 Region 5 100
Level of education
No education 100 Some primary 100 Primary complete 100 Preparatory complete 100 Secondary complete 100 Higher complete 100
Total 100
Manual 7 - Part 1 - Tabulation plan
Page 114
Table 4.13 Who would m
ake the decision to m
igrate, according to residence
Percent distribution of potential m
igrants by the person m
aking the decision for potential m
igrant to m
igrate, according type of place of residen
ce and gen
der
Type of place of residen
ce
Urban
Rural
To
tal
Person m
aking the migration decision
Male
Female
Total
Male
Female
Total
Male
Female
Total
Potential m
igrant
Spouse / Fiancé
Child(ren)
Parents
Other relative
Employer
Friends
Other
Total
100.0
100.0
100.0
100.0
100.0
100.0
100.0
100.0
100.0
Num
ber of return migrants
Manual 7 - Part 1 - Tabulation plan
Page 115
Table 4.14 Share of female potential migrants by educational level
Female potential migrants as a share of total potential migrants by current level of education according to intended destination
Last destination
No education
Some primary
Primary complete /some
preparatory
Preparatory complete /some
secondary
Secondary complete/ some post‐secondary
Higher complete
Total
Arab region
Europe
North America
Other
Total
Number
Manual 7 - Part 1 - Tabulation plan
Page 116
Table 4.15 Country aw
arding higher degrees of highly skilled potential m
igrants
Distribution of tertiary‐educated potential m
igrants by country aw
arding higher degree Degree
Bachelor
Higher diploma / Master
Doctorate
Country aw
arding degree
Country aw
arding degree
Country aw
arding degree
Characteristic
Country
of origin
Arab
country Europe
North
America
Other
Total
Country
of origin
Arab
countryEu
rope
North
America
Other
Total
Country
of origin
Arab
country
Europe North
America
Other
Total
Intended destination
Arab region
100
100
100
Europe
100
100
100
North
America
100
100
100
Other
100
100
100
Current type of residence
Urban
100
100
100
Rural
100
100
100
Current region of residen
ce
Region 1
100
100
100
Region 2
100
100
100
Region 3
100
100
100
Region 4
100
100
100
Region 5
100
100
100
Total
100
100
100
Manual 7 - Part 1 - Tabulation plan
Page 117
MQ-5 Forced Migrant
Manual 7 - Part 1 - Tabulation plan
Page 118
Table 5.1 Selected Characteristics of forced migrants
Percent distribution of all forced migrants by selected background characteristics, according to household members’ blood relation
Forced migrant residing in household whose members are :
Characteristic Blood related Not blood
related
All
forced migrants
Gender Male Female Age Less than 18 18‐59 60+ Current Type of place of residence Urban Rural Current Region of residence Region 1 Region 2 Region 3 Region 4 Region 5 Current educational status No education Some primary Primary complete /some preparatory Preparatory complete /some secondary Secondary complete/ some post‐secondary Higher complete Current marital status Single Married Separated Divorced Widowed Current employment status Currently working Currently not working & seeking work Currently not working & not seeking work
Main reason for moving from country of origin for the first time Persecution related reasons
Generalized insecurity / war
Family reunification (within asylum procedure)
Trafficking / Coercion
Find employment abroad
Family reunification (other)
Other
Migration intentions Remain in this country Return to country of origin
Move to another country Undecided
Total 100.0 100.0 100.0
Number of non migrants
Manual 7 - Part 1 - Tabulation plan
Page 119
Table 5.2 Demographic composition of forced migrants
Percent distribution of forced migrants by age group and the percentage female per age group
Age group Characteristic
0‐4 5‐11 12‐17 Less than 18
18‐59 60+
Total Number
Male 100
Female 100
Total 100
% female per age group
Table 5.3 Why forced migrants choose to come to this country?
Percent distribution of forced migrants by the main reason for coming to this country
According to main country of origin
Country of origin Main reason for coming to this country Country
1 Country
2 Country
3 Country
4 Country
5 Other
Transit, easier to move onwards
To ask for asylum / get refugee status
Good living conditions
Family and/or friends networks
Access to labour market
Other
Total
Number
Table 5.4 Asylum applications
Percentage of forced migrants who applied for asylum according to country of origin, and percent distribution of applicants for asylum by source of assistance
Percent distribution of asylum applicants by type of assistance they received for their asylum application
Country of origin
Percentage who
applied for asylum in (THIS
COUNTRY)
Yes: from Government
of host country
Yes: from NGOs
None Other Total
Number of all forced migrants
Country 1 100
Country 2 100
Country 3 100
Country 4 100
Country 5 100
Other 100
Total 100
Manual 7 - Part 1 - Tabulation plan
Page 120
Table 5.5 Refugee status determination Percent distribution of refugee status determination by country of origin
Decisions Country of origin Recognition Procedure
still ongoing
Rejection Other Total
Number
Country 1 100
Country 2 100
Country 3 100
Country 4 100
Country 5 100
Other 100
Total 100
Table 5.6 Current status of forced migrants Percent distribution of forced migrants by current status according to country of origin
Current status of forced migrants Country of origin Asylum
seeker Recognised refugee
Humanitarian status
No legal status
Other Total Number
Country 1 100
Country 2 100
Country 3 100
Country 4 100
Country 5 100
Other 100
Total 100
Manual 7 - Part 1 - Tabulation plan
Page 121
Table 5.7 Identity documents Percent distribution of forced migrants by type of identity documents they have in host country
Identity document Country 1
Country 2
Country 3
Country 4
Country 5
Total
No official document
National passport
ID card
Refugee/Asylum‐seeker ID from Government
Refugee/Asylum‐seeker ID from UNHCR
Valid residence permit
Valid work permit
Other
No official document
Total 100 100 100 100 100 100
Number
Table 5.8 Employment status Percent distribution of forced migrants aged 15 years or more by status in employment, according to country of origin
Current employment status Country 1
Country 2
Country 3
Country 4
Country 5
Total
Not working
Working
Own‐account worker
Employer (& hires one or more employees)
Salaried employee
Casual employee in agriculture
Casual employee not in agriculture
Tenant (work on farm, pay rent)
Sharecropper (work on farm, pay part of production to owner)
Farmer
Unpaid family worker
Unpaid worker
Other
Total 100 100 100 100 100 100
Number
Manual 7 - Part 1 - Tabulation plan
Page 122
Table 5.9 Future plans Percent distribution of forced migrants aged 15 years or more by plans for the future, according to country of origin
Future plans Country 1
Country 2
Country 3
Country 4
Country 5
Total
Stay in (THIS COUNTRY)
Return back home soon (<6 months) without conditions
Return back home later (>6 months) without conditions
Return back home under certain conditions
Move onwards to another country
Don’t know
Total 100 100 100 100 100 100
Number
Manual 7 - Part 1 - Tabulation plan
Page 123
Table 5.10 Health care
Percent distribution of forced
migrant by type of health care received
in past month, according to age and gen
der
Age (years)
Less than
18
18‐59
60+
Total
Type of health care received
Male
Female
Total
Male
Female
Total
Male
Fem
ale
Total
Male
Female
Total
a) Yes: received health care in past month
Acute condition
Acciden
t
Follow‐up chronic condition
Complications
Minor operations
Major operations
Other
b) N
o: didn’t receive health care in past month
Total
100.0
100.0
100.0
100.0
100.0
100.0
100.0
100.0
100.0
100.0
100.0
100.0
Num
ber
Manual 7 - Part 1 - Tabulation plan
Page 124
MQ-6 Household
Socio-economic Characteristics
Manual 7 - Part 1 - Tabulation plan
Page 125
Table 6.1 Dwelling characteristics by household residence and m
igration status
Percent distribution of households selected
for the m
igration survey by type and tenure of dwelling, availability of electricity, type of flooring, walls m
aterial
and windows material, according to household residence and m
igration status, and percentage of de jure population by dwelling characteristics
Urban
Rural
Total households
Dwelling characteristic
Migrant
household
Non
migrant
household
Total
Migrant
household
Non
migrant
household
Total
Migrant
household
Non
migrant
household
Total
Total
de jure
population
Type of dwelling
Apartm
ent
Single dwelling/Villa
Rural house
Room in
house/apartm
ent
Studio
Hut / Tent
Other
Tenure
Owned
/ owned
jointly
Ren
ted: U
nfurnished
Ren
ted: Furnished
Provided
by employer
Other
Lighting
Electric
Kerosene
Oil/Gas lamp
Candles / To
rches
Gen
erator
Solar en
ergy
Other
None
Total percent
100.0
100.0
100.0
100.0
100.0
100.0
100.0
100.0
100.0
100.0
Manual 7 - Part 1 - Tabulation plan
Page 126
Table 6.1 Dwelling characteristics by household residence and m
igration status, continued
Urban
Rural
Total households
Dwelling characteristic
Migrant
household
Non
migrant
household
Total
Migrant
household
Non
migrant
household
Total
Migrant
household
Non
migrant
household
Total
Total
de jure
population
Flooring material
Earth/Sand
Cem
ent
Stone/Brick
Cem
ent Tiles
Wood Planks
Vinyl / Plastic
Wall‐to‐w
all Carpet
Ceram
ic/M
arble Tiles
Parquet
Other
Exterior walls m
aterial
Bricks & Cem
ent
Bricks / Stone
Wood
Concrete
Clay bricks
Other
Windows material
Glass only
Shutters only
Glass & Shutters
Curtains only
No covering
No windows
Total percent
100.0
100.0
100.0
100.0
100.0
100.0
100.0
100.0
100.0
100.0
Number of households
Manual 7 - Part 1 - Tabulation plan
Page 127
Table 6.2 Crowding by residence and household m
igration status
Percent distribution of households selected
for the m
igration survey by number of rooms and number of bed
rooms, according to household residen
ce and
migration status, and percent distribution of the de jure population by number of rooms
Urban
Rural
Total households
Crowding
Migrant
household
Non
migrant
household
Total
Migrant
household
Non
migrant
household
Total
Migrant
household
Non
migrant
household
Total
Total
de jure
population
Number of rooms
1
2
3
4
5
6+
Number of bedrooms
1
2
3
4
5+
Total percent
100.0
100.0
100.0
100.0
100.0
100.0
100.0
100.0
100.0
100.0
Number of households
Mean number of rooms per household
Mean number of persons per room
Mean number of bed
rooms per household
Mean number of persons per bedroom
Manual 7 - Part 1 - Tabulation plan
Page 128
Table 6.3 Household drinking water access by residence and m
igration status
Percent distribution of households selected
for the m
igration survey by source of drinking water, tim
e to collect water (if not within residen
ce or plot), and
person fetching the water, according to household residen
ce and m
igration status, and percent distribution of the de jure population by household drinking
water arrangemen
ts
Urban
Rural
Total households
Drinking water access
Migrant
household
Non
migrant
household
Total
Migrant
household
Non
migrant
household
Total
Migrant
household
Non
migrant
household
Total
Total
de jure
population
Source of drinking water
Piped
supply
Public tap
Bottled water
Well w
ith pump
Well w
ithout pump
Tanker truck (or similar)
Surface water
Other
Time to water source
On premises
Within 15 m
inutes
15‐29 m
inutes
30+ minutes
Person obtaining water for household
Adult m
an
Adult woman
Male child
under 15years old
Female child
under 15years old
Traditional water delivery person
Tanker truck
Water on premises
Other
Total
100.0
100.0
100.0
100.0
100.0
100.0
100.0
100.0
100.0
100.0
Number of households
Manual 7 - Part 1 - Tabulation plan
Page 129
Table 6.4 Household drinking water storage
practices by residence and m
igration status
Percent distribution of households selected
for the m
igration survey by storage of drinking water and, among households in which water is stored, percent
distribution by presence of covers on the containers in which water is stored, and type of container in
which water is stored, according to household
residen
ce and m
igration status, and percen
t distribution of de jure population by water storage practices
Urban
Rural
Total households
Drinking water storage
Migrant
household
Non
migrant
household
Total
Migrant
household
Non
migrant
household
Total
Migrant
household
Non
migrant
household
Total
Total
de jure
population
Storage
of drinking water
Stored
Not stored
Don’t know
Total
100.0
100.0
100.0
100.0
100.0
100.0
100.0
100.0
100.0
100.0
Number
Storage
container covered
Covered
Not covered
Type of storage
container
Water tank
Plastic container
Bottles
Cans (tin)
Other
Don’t know
Total
100.0
100.0
100.0
100.0
100.0
100.0
100.0
100.0
100.0
100.0
Number of households storing water
Manual 7 - Part 1 - Tabulation plan
Page 130
Table 6.5 Household drinking water treatment by residence and m
igration status
Among households selected
for the migration survey, the percentage using various modes for treating drinking water, according to household residen
ce
and m
igration status, and percent distribution of de jure population by mode of water treatmen
t
Urban
Rural
Total households
Mode of water treatmen
t prior to drinking
Migrant
household
Non
migrant
household
Total
Migrant
household
Non
migrant
household
Total
Migrant
household
Non
migrant
household
Total
Total
de jure
population
Not treated
Boiled sometim
es
Boiled usually
Boiled always
Water filter used
Chlorine added
Strained
through
cloth/cotton
Stand and settle
Other
Don’t know
Total number
Manual 7 - Part 1 - Tabulation plan
Page 131
Table 6.6 Sanitation facilities by household residence and m
igration status
Percent distribution of households selected
for the m
igration survey by type of toilet facility, location of toilet facility, and type of sanitation facilities,
according to household residen
ce and m
igration status, and percent distribution of de jure population by sanitation facilities
Urban
Rural
Total households
Sanitation facility
Migrant
household
Non
migrant
household
Total
Migrant
household
Non
migrant
household
Total
Migrant
household
Non
migrant
household
Total
Total
de jure
population
Sanitation facility
Modern flush toilet connected to
public sew
er
Traditional with tank flush
Traditional with bucket flush
Pit latrine toilet
Other
No facility
Location of sanitation facility
Inside dwelling
Outside dwelling, within courtyard
Elsewhere
Use of sanitation facility
Sole use by household
Shared
use with other households
Sanitation facilities
Improved*
Not im
proved
Availability of han
d soap
on the premises
Available
Not available
Total
100.0
100.0
100.0
100.0
100.0
100.0
100.0
100.0
100.0
100.0
Number
*The household is considered
to have im
proved sanitation facilities if the household has sole use of a modern or traditional flush toilet that empties into a public sew
er or septic system
.
Manual 7 - Part 1 - Tabulation plan
Page 132
Table 6.7 Cooking facilities by household residence and m
igration status
Percent distribution of households selected
for the m
igration survey by cooking facilities, according to household residence and m
igration status, and
percent distribution of de jure population by waste disposal
Urban
Rural
Total households
Cooking facilities
Migrant
household
Non
migrant
household
Total
Migrant
household
Non
migrant
household
Total
Migrant
household
Non
migrant
household
Total
Total
de jure
population
Location of kitchen
Inside dwelling
Outside dwelling
No sep
arate room for cooking
Sharing of cooking facility with other households
Shared
Not shared
Fuel used for cooking
Butane gas cylinder
Natural gas
Oil /Kerosene
Electricity
Wood
Coal / Charcoal
Crop residue
Other
Fat /oil used for cooking
Don’t use any fats
Seed
s oils
Anim
al fats
Butter / Gee
Margarine
Other
Don’t know
Total
100.0
100.0
100.0
100.0
100.0
100.0
100.0
100.0
100.0
100.0
Number of households
Manual 7 - Part 1 - Tabulation plan
Page 133
Table 6.8 Waste disposal by household residence and m
igration status
Percent distribution of households selected
for the m
igration survey by method of disposal of waste, according to household residence and m
igration
status, and percent distribution of de jure population by waste disposal
Urban
Rural
Total households
Disposal of waste
Migrant
household
Non
migrant
household
Total
Migrant
household
Non
migrant
household
Total
Migrant
household
Non
migrant
household
Total
Total
de jure
population
Type of waste container
Container with lid
Container without lid
Plastic bag
Old new
spaper
Thrown straight in street
Other
Place in
which waste container is kept
Inside kitchen
Outside kitchen
, within dwelling
Outside dwelling
No container available
Sharing of sanitation facility with other household
Shared
Not shared
Disposal of waste
Garbage collector
Dumping in special place
Burning
Thrown in
street
Other
Total
100.0
100.0
100.0
100.0
100.0
100.0
100.0
100.0
100.0
100.0
Number of households
Manual 7 - Part 1 - Tabulation plan
Page 134
Table 6.9 Type of road
and drainage by household residence and m
igration status
Percent distribution of households selected
for the m
igration survey by method of disposal of waste, according to household residence and m
igration
status, and percent distribution of de jure population by waste disposal
Urban
Rural
Total households
Disposal of waste
Migrant
household
Non
migrant
household
Total
Migrant
household
Non
migrant
household
Total
Migrant
household
Non
migrant
household
Total
Total
de jure
population
Location of dwelling
On paved road
On unpaved
road
Neither
Time to get to nearest paved road
Within 15 m
inutes
15‐29 m
inutes
30+ minutes
Tran
sport m
ode used to get to nearest paved road
Walking
Anim
als
Bicycle
Motorcycle
Motor Car (any type)
Other
Drainage around house
Area dry
Stagnant water
Area flooded
Total
100.0
100.0
100.0
100.0
100.0
100.0
100.0
100.0
100.0
100.0
Number of households
Manual 7 - Part 1 - Tabulation plan
Page 135
Table 6.10 Household possessions of objects by household residence and m
igration status
Among households selected
for the migration survey, the percentage possessing various household objects, according to household residence and
migration status, and percent age of de jure population by household possessions
Urban
Rural
Total households
Household objects
Migrant
household
Non
migrant
household
Total
Migrant
household
Non
migrant
household
Total
Migrant
household
Non
migrant
household
Total
Total
de jure
population
1. R
adio
2. C
lock or watch
3. TV
4. Satellite / Cable TV
5. R
efrigerator
6. G
as / Electric cooking stove
7 M
icrowave
8. Food processor
9. W
ater heater
10. Electric iron
11. W
ashing machine
12. D
ishwasher
13. Sew
ing machine
14. V
acuum cleaner
15. Telephone (fixed
)
16. M
obile telephone
17. V
ideo
/ VCR
18. V
ideo
Cam
era
19. Electric fan
20. D
esert/Air cooler
21. A
ir conditioner
22. D
esktop computer
23. Laptop
24. A
ccess to Internet
25. Tablet (iPad)
26. Sports equipment
27. Swim
ming pool
28. Special container for med
icines
None of the above
Number of households
Manual 7 - Part 1 - Tabulation plan
Page 136
Table 6.11 Household assets by household residence and m
igration status
Among households selected
for the migration survey, the percentage possessing various assets, according to household residence and m
igration status, and
percent age of de jure population by household assets
Urban
Rural
Total households
Household assets
Migrant
household
Non
migrant
household
Total
Migrant
household
Non
migrant
household
Total
Migrant
household
Non
migrant
household
Total
Total
de jure
population
1. B
icycle
2. M
otorcycle or motor scooter
3. Tocktock
4. Private car or truck
5. H
alf truck
6. B
oat
7. A
nim
al‐drawn cart
8. Livestock
9. Poultry
10. Farm land
11. O
ther land
12. Farm tractors/tools
13. R
esiden
tial buildings
14. Commercial buildings
15. Industrial buildings
16. Industrial m
achines / equipmen
t
17. Transport facilities for goods
18. B
ank / Post Office account
19. Savings
20. Shares
21. B
onds
22. Credit card
Number of households
Manual 7 - Part 1 - Tabulation plan
Page 137
Adetef – Medstat III Paris, December 2013
ISBN 978-2-37009-018-8
For more information:
Contacts for the MED-HIMS Programme and its model manuals
Samir FARID, MED-HIMS Chief Technical Adviser, [email protected] Giambattista CANTISANI, Key Expert for MEDSTAT III Migration, [email protected]
Contacts for national surveys / National Coordinators for MEDSTAT III Migration
Amel LAKEHAL, Director of Population and Employment Statistics, ONS, Algeria, [email protected] Abdallah ABDEL RAZEK, Specialist of Studies & Researches, CAPMAS, Egypt,
[email protected] Mohammad AL-ASSAF, Director of Population & Social Statistics, DoS, Jordan, [email protected] Lara BADRE, Sociologist, CAS, Lebanon, [email protected] Bouchra BOUZIANI, Head of Social Indicators Service, HCP/DS, Morocco, [email protected] Mohammed DURAIDI, Director of Technical Operation, PCBS, Palestine, [email protected] Nadia TOUIHRI, Head of Social Statistics Service, INS, Tunisia, [email protected]
Other means
MED-HIMS page at Eurostat Website: http://epp.eurostat.ec.europa.eu/portal/page/portal/european_neighbourhood_policy/enp_south/med_hims
MED-HIMS Newsletter (issued every 6-9 months) Progress reports, papers and other documents for international meetings
MED-HIMS is a joint programme of regionally coordinated migration surveys currently supported by the European Commission (EC), the World Bank, the UNFPA, the UNHCR, the IOM, the ILO and the League of Arab States (LAS). It has its roots in the EC’s MEDSTAT programme, and has been developed at the request of and together with the NSOs of seven of the MEDSTAT countries (Algeria, Egypt, Jordan, Lebanon, Morocco, Palestine and Tunisia). MED-HIMS Coordination Committee (as of October 2013):
The World Bank (Development Data Group) UNFPA (Arab States Regional Office) UNHCR (Division of Programme Support and Management) IOM (Regional Office for Middle East and North Africa) ILO (Arab States Regional Office) The League of Arab States (Migration and Arab Expatriates Department)
MED-HIMS participating national agencies:
National Statistical Office (ONS), Algeria Central Agency for Public Mobilization and Statistics (CAPMAS), Egypt Department of Statistics (DoS), Jordan Central Administration of Statistics (CAS), Lebanon High Planning Commission, Directorate for Statistics (HCP/DS), Morocco Palestinian Central Bureau of Statistics (PCBS), Palestine National Statistical Institute (INS), Tunisia