Leak detection on water pipelines in unsaturated ground by discrete fibre optic sensing S.W. Jacobsz Department of Civil Engineering, University of Pretoria, Private Bag X20, Hatfield, 0028 [email protected]S.I. Jahnke Department of Civil Engineering, University of Pretoria, Private Bag X20, Hatfield, 0028 Abstract The paper describes a study using discrete fibre optic sensing as a means of leak detection on water distribution pipes installed in unsaturated ground. A short length of pipe fitted with artificial leak points was installed, to which a fibre optic cable with fibre Bragg grating (FBGs) was attached. An optical fibre with FBGs was also installed in the ground parallel to, but separate from the pipe. Thermistors were installed at selected locations to measure temperature changes independent of strain. It was found that a simulated water leak resulted in clearly detectable temperature changes and thermally induced FBG wavelength changes in the ground around the pipe. However, significantly larger deformation-induced FBG wavelength changes were measured on the pipe walls and also in the initially unsaturated ground in response to leaks. A wetting front originating from a water leak propagating through unsaturated soil is associated with significant effective stress changes because the infiltrating water alters the ambient matric suction in the soil. This effective stress change is associated with significant ground deformation resulting in a FBG response which significantly exceeds the thermal response associated with (usually) colder water leaking into unsaturated soil. The study illustrates advantages of measuring ground deformation- induced FBG wavelength changes over pure temperature changes as an efficient means of leak detection in unsaturated ground. However, due to the limited number of FBGs that can be monitored along a single optical fibre, a leak detection system suitable for practical implementation should be based on distributed fibre optic strain sensing, an aspect requiring further research. Keywords: Fibre optic leak detection, unsaturated ground, temperature measurement, FBG wavelength measurement, Bragg gratings, pipe leak Introduction It is estimated that approximately 26% of the potable water distributed by the City of Tshwane/Pretoria (capital of South Africa) is lost due to leakages from the aging distribution system (McKenzie et al. 2012). Just in the City of Tshwane this amounts to approximately 75 million cubic metres per annum. It is often mentioned in the media that up to a third of potable water distributed in South Africa is lost from distribution systems, a situation that cannot be afforded in a water-scarce country with a growing population and rapid urbanisation. This problem is a global phenomenon as illustrated by the statistics of estimated ratios of non-revenue water from a number of countries in Figure 1. [Insert Figure 1] Aging water distribution networks eventually develop leaks, which is a major contributor to non- revenue water volumes around the world (McKenzie et al., 2012). Leaks from distribution networks are generally not easily detected before a large volume of water had been lost. This results in remedial action normally being implemented late. The simplest form of leak detection is field inspections, followed by mass balance methods, relying on isolating sections of the water distribution 1
Transcript
Leak detection on water pipelines in unsaturated ground by discrete fibre optic sensing
S.W. Jacobsz Department of Civil Engineering, University of Pretoria, Private Bag X20, Hatfield, 0028 [email protected]
S.I. Jahnke Department of Civil Engineering, University of Pretoria, Private Bag X20, Hatfield, 0028
Abstract
The paper describes a study using discrete fibre optic sensing as a means of leak detection on water distribution pipes installed in unsaturated ground. A short length of pipe fitted with artificial leak points was installed, to which a fibre optic cable with fibre Bragg grating (FBGs) was attached. An optical fibre with FBGs was also installed in the ground parallel to, but separate from the pipe. Thermistors were installed at selected locations to measure temperature changes independent of strain. It was found that a simulated water leak resulted in clearly detectable temperature changes and thermally induced FBG wavelength changes in the ground around the pipe. However, significantly larger deformation-induced FBG wavelength changes were measured on the pipe walls and also in the initially unsaturated ground in response to leaks.
A wetting front originating from a water leak propagating through unsaturated soil is associated with significant effective stress changes because the infiltrating water alters the ambient matric suction in the soil. This effective stress change is associated with significant ground deformation resulting in a FBG response which significantly exceeds the thermal response associated with (usually) colder water leaking into unsaturated soil. The study illustrates advantages of measuring ground deformation-induced FBG wavelength changes over pure temperature changes as an efficient means of leak detection in unsaturated ground. However, due to the limited number of FBGs that can be monitored along a single optical fibre, a leak detection system suitable for practical implementation should be based on distributed fibre optic strain sensing, an aspect requiring further research.
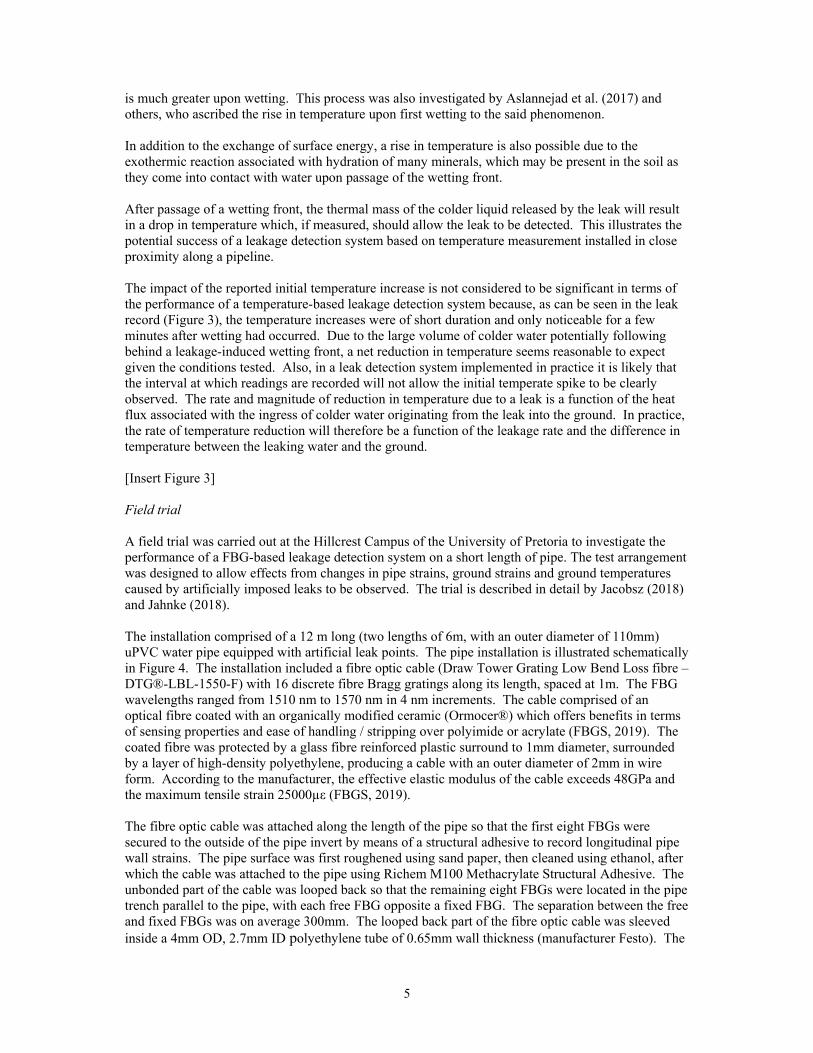
It is estimated that approximately 26% of the potable water distributed by the City of Tshwane/Pretoria (capital of South Africa) is lost due to leakages from the aging distribution system (McKenzie et al. 2012). Just in the City of Tshwane this amounts to approximately 75 million cubic metres per annum. It is often mentioned in the media that up to a third of potable water distributed in South Africa is lost from distribution systems, a situation that cannot be afforded in a water-scarce country with a growing population and rapid urbanisation. This problem is a global phenomenon as illustrated by the statistics of estimated ratios of non-revenue water from a number of countries in Figure 1.
[Insert Figure 1]
Aging water distribution networks eventually develop leaks, which is a major contributor to non-revenue water volumes around the world (McKenzie et al., 2012). Leaks from distribution networks are generally not easily detected before a large volume of water had been lost. This results in remedial action normally being implemented late. The simplest form of leak detection is field inspections, followed by mass balance methods, relying on isolating sections of the water distribution
1
network and comparing metred inflow to outflows. To assess extended water networks using such methods is labour intensive. Advances in technology has resulted in a variety of more sophisticated leak detection methods becoming available. Examples include a range of acoustic detection methods (Van Zyl, 2014; USEPA, 2010), chemical detection methods using tracer gas or liquid techniques (USACE, 2001; USEPA, 2010), thermography (USEPA, 2010), ground penetrating radar (Eyuboglu et al., 2003), satellite based spectral analysis (Agapiou et al., 2013) and others. A shortcoming common to all these methods is that a third party has to be appointed to search for leaks. Given the extent and complexity of water reticulation networks in urban environments, the risk of non-detection is significant.
A number of technology streams are commercially available to monitor strains and temperature in optical fibres. The first sensor type provides discrete strain measurements using Bragg gratings. Bragg gratings can be etched into photo-sensitive optical fibre using a suitable laser source to create a periodic variation in the fibre refractive index (Rao, 1997). Several of these gratings, each with a slightly different wavelength are typically created in a single fibre. When a broad-band light source is passed along the fibre, some light is reflected back by each Bragg grating. The reflected wavelength is influenced by both the mechanical strain and temperature changes that the Bragg grating is subjected to as defined in equation 1.
∆𝑙 𝑙 𝑘𝜀 𝜉 𝛼 ∆𝑇 (1)
with l0 the original FBGs wavelength, ε the mechanical strain and ΔT temperature change imposed on the Bragg grating, while k is the strain-optic coefficient, ξ the thermo-optic coefficient and α the thermal expansion coefficient for silica. If the Bragg grating is subjected to strain, the wavelength of the light reflected back will change and by analysing changes in the reflected wavelength, strain can be determined to a high resolution, provided that the associated temperature change is known. As temperature changes result in changes in the wavelength of light reflected back from each Bragg grating, Bragg gratings isolated from mechanical strain can also be utilised for temperature sensing.
Analysis of Raman, Rayleigh and Brillouin back-scatter in optical fibres enables the determination of mechanical strains and temperature that the fibre is subjected to. Mechanical strains and temperature can be detected in optical fibres using Brillouin optical time-domain reflectometry/analysis (BOTDR or BOTDA) (Nikles et al. 1997). These methods represent optical measurement techniques to measure the Brillouin frequency shift in an optical fibre. The shift in the Brillouin frequency is linearly correlated to either the mechanical strain or temperature that the optical fibre is subjected to, but the two quantities cannot be resolved independently if both vary (Nikles et al. 1997; Motil et al. 2016). Therefore, by using a tight buffered fibre optic cable, the mechanical strain in the medium in which or to which the fibre is attached can be resolved and, by using an optical fibre which is mechanically isolated from its surround, temperature can be resolved. Several commercial systems have become available over the past 20 years that provide distributed strain and temperature measurements capability over many kilometres of fibre optic cable to a spatial resolution down to 0.05m or better (Motil et al. 2016). Both Bragg gratings and distributed strain technology are used with success in many monitoring applications, including monitoring deformations of buried structures such as pipes.
The sensing capabilities resulting from the development of fibre optic strain, temperature and vibration sensing technology are finding application across most civil engineering disciplines. Some examples in geotechnical engineering include ground movement detection and monitoring associated with tunnelling (Klar and Linker, 2010; Mohamad et al., 2011; Hauswirth et al., 2014, Klar et al., 2014), sinkhole formation (Linker & Klar, 2017) and landslides (Iten et al., 2008). Numerous applications are found in structural monitoring, including the monitoring of the performance of advanced composite materials (Green et al., 2000), concrete structures (Mendez and Morse, 1992), bridges (Holton 1998; Maaskant et al. 1997), tunnel linings (Beck et al. 2016), monitoring of pipeline structural integrity in the nuclear industry (Lee et al., 2012), with new applications being devised
2
regularly. The use of these monitoring systems provides real time or near-real time information on the actual performance of working infrastructure, allowing for timeous mitigation of deficiencies.
Fibre optic technology is also employed in leak detection. Fibre optic leak detection systems typically operate by detecting leakage-induced temperature fluctuations (e.g. Nikles et al., 2004; Mishra & Soni, 2011), with some applications in which strain in the pipe wall itself is measured (e.g. Inaudi & Branko, 2010; Feng et al. 2016). Many examples of leak detection applications can be found on oil, gas and brine pipelines. Leakage in oil, gas and brine pipelines are usually associated with substantial temperature deviations as warm or cold fluid leaks from a pipe or as adiabatic cooling occurs during leakage from pressurised gas mains. In the case of water distribution pipelines, the temperature differential between the water in the pipe and the ground outside the pipe is typically much smaller. Detection of a small leak-induced temperature deviation may be difficult before a large volume of water had been lost because of substantial daily and seasonal temperature fluctuations. Limited information on such detection systems for water distribution networks in the literature suggests that the implementation of such systems on water distribution networks is still in its infancy compared to what is available in the oil and gas industries.
Experimental study into leak detection using Fibre Bragg Gratings
This paper describes a study investigating the potential application of the discrete sensing capabilities of fibre Bragg gratings (FBGs) as a means of leak detection on water pipelines. It was hypothesised that because FBGs can detect strains and/or temperature changes at a very high resolution, they can potentially be used to measure pipe and ground strain and/or temperature changes associated with water leaks.
Thermal monitoring of the ground profile
It was hypothesised that the most efficient detectable parameter to indicate a leak would be a thermal effect (i.e. a temperature change) near a pipe caused by the leakage of usually colder water into the ground. For a leakage detection system to be successful, leakage-induced temperature changes must be distinguishable from naturally occurring fluctuations. A temperature measurement array was therefore set up to measure ground temperature variation with depth over the course of the two year study period, as well as the variation in the water temperature in a water distribution main (monitored for six months). A set of thermistors was buried at depth increments of 0.25m to a depth of 2m, with a deeper thermistor at 3m.
The ground conditions on site comprised of a slightly moist, red-brown, slightly clayey silty sand of medium dense to dense in situ consistency (Jahnke et al., 2018). The soil profile in this trial was unsaturated with an in situ moisture content of about 13%, corresponding to a degree of saturation of about 15%. The water table was deep and did not affect the site.
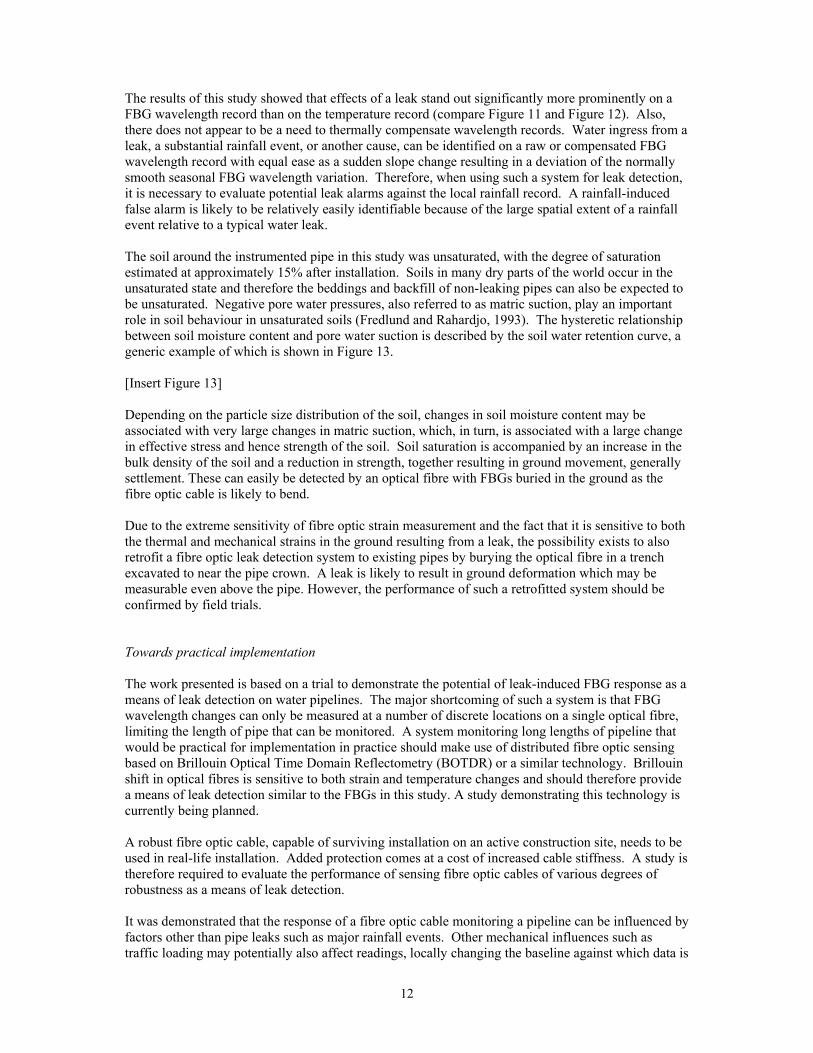
Ground temperature profiles are dependent on climatic conditions. It is therefore important to assess whether a measurable temperature differential exists between the water temperature in distribution mains and the surrounding soil where such systems will be implemented. Figure 2 presents ground temperatures, as well as the temperature in the monitored water main over an approximately six month period. The temperature fluctuation in the water main significantly exceeded that in the ground, but the maximum water temperature was consistently approximately 2°C lower than the ground temperature at 0.5m. This indicates that a leak detection system based on temperature monitoring has potential to be successful in the environment investigated. The influence of leakage-induced mechanical ground strain changes is considered later in this paper.
[Insert Figure 2]
3
Laboratory leak tests
Having measured a distinct temperature difference between the water main and the ground, the question arose whether the temperature of water slowly leaking from the pipe will not soon rise to that of the surrounding ground, eliminating the temperature differential, impacting negatively on the performance of the leakage detection system. A small-scale laboratory study was carried out to assess whether temperature measurement can be effective in detecting a passing wetting front from a leak in which the water temperature is given time to equilibrate to that of the soil. A transparent plastic container measuring 790mm x 400mm x 590mm high was filled with a fine dry silica sand (D50 of 70m) in which a number of thermistors (Vishay NTCLE305E4) were embedded. A slow leak rate of 2.3 ml/sec was imposed and the propagation of the wetting was visually monitored as it advanced past a number of thermistors.
Immediately upon passage of the wetting front, a clearly measureable increase in temperature of 0.2°C to 0.5°C was observed, after which the expected temperature reduction followed, resulting in a final temperature lower than the initial. The initial temperature increase was not anticipated and was investigated further by monitoring temperature changes on wetting fronts in five different granular materials. For this purposes five Perspex cylinders (100 mm high x 50 mm diameter) were filled with respectively dry fine silica sand (D50 of 70 m), gold tailings (D50 of 113 m), platinum tailings (D50 of 100 m) and iron tailings (D50 of 8 m), while the fifth cylinder was filled with dried soil from the test site where the field monitoring was carried out (D50 of 88 m). After filling, the cylinders were lightly tapped to nominally compact the contents until visible settlement of the contents had stopped. The particle distributions of the sand and tailings all fell within the fine sand and silt size ranges, while the soil from site also contained approximately 9.2% clay. Thermistors were positioned at mid-depth in each cylinder and the cylinders with their contents were placed in Petri dishes into which water was poured. A wetting front advanced upwards in each cylinder under capillary rise.
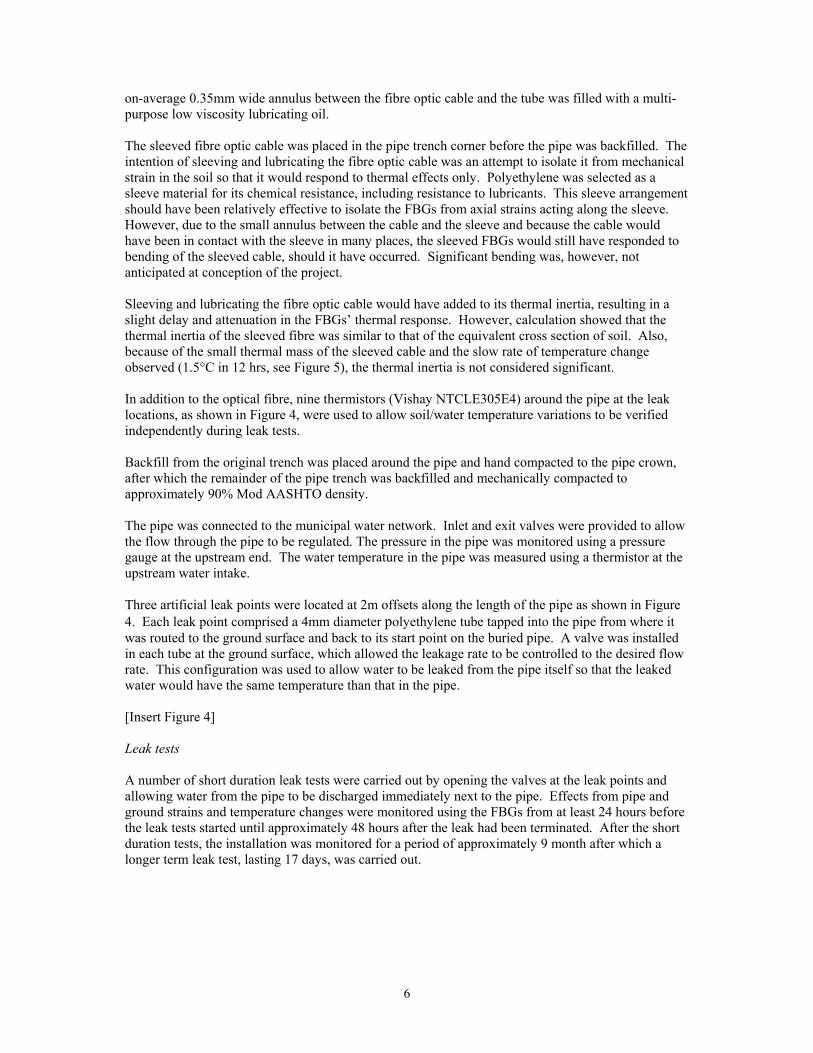
The temperature records from the experiment are presented in Figure 3. The ambient room temperature was 26°C. It can be seen that in all materials tested, a clearly measurable temperature increase occurred upon first wetting, followed by a reduction in temperature as the flux of colder water advanced past the thermistors. The net effect was still, as initially expected, a reduction in temperature. The soil from site, which contained a significant clay fraction, showed a nearly 20 fold greater temperature increase (plotted on the secondary vertical axis) compared to the tailings and sand.
A literature search revealed that initial rise in temperature can be attributed to the release of surface energy from the surfaces of the soil grains upon wetting with water. The process of wetting of a solid surface by a liquid involves interaction between three interface types, i.e. solid-liquid, solid-air and liquid-air. Wetting results in a solid-air interface along the particle surfaces being replaced by a solid-liquid interface. Each solid surface has its own specific surface energy, which is associated with the way in which atoms are bonded into that solid (e.g. co-valent, ionic or hydrogen bonding) (Parks, 1984). A certain amount of energy (i.e. surface energy) needs to be added to a surface to allow atoms to be removed from the lattice structure. Wetting can result in a net increase or a net decrease in total surface energy. When energy is released upon wetting, wetting occurs spontaneously and the surface is hydrophilic. Should energy be required to be added for wetting to occur, the surface will not wet naturally and will be hydrophobic (Wenzel, 1936).
Wetting of quartz by water results in a reduction in the specific surface energy of quartz by about 72 mJ/m2 (Parks, 1984). Due to the fine-grained particulate nature of soils, the surface area of a small volume of material rapidly becomes large as grain size is reduced. Wetting a fine-grained soil, which is known to occur spontaneously, is therefore associated with a measurable release of surface energy. This release of surface energy is responsible for the small rise in temperature associated with the passage of the wetting front. Because of a different value of specific surface energy and the substantially increase surface area of clays compared to silts and sands, the release of surface energy
4
is much greater upon wetting. This process was also investigated by Aslannejad et al. (2017) and others, who ascribed the rise in temperature upon first wetting to the said phenomenon.
In addition to the exchange of surface energy, a rise in temperature is also possible due to the exothermic reaction associated with hydration of many minerals, which may be present in the soil as they come into contact with water upon passage of the wetting front.
After passage of a wetting front, the thermal mass of the colder liquid released by the leak will result in a drop in temperature which, if measured, should allow the leak to be detected. This illustrates the potential success of a leakage detection system based on temperature measurement installed in close proximity along a pipeline.
The impact of the reported initial temperature increase is not considered to be significant in terms of the performance of a temperature-based leakage detection system because, as can be seen in the leak record (Figure 3), the temperature increases were of short duration and only noticeable for a few minutes after wetting had occurred. Due to the large volume of colder water potentially following behind a leakage-induced wetting front, a net reduction in temperature seems reasonable to expect given the conditions tested. Also, in a leak detection system implemented in practice it is likely that the interval at which readings are recorded will not allow the initial temperate spike to be clearly observed. The rate and magnitude of reduction in temperature due to a leak is a function of the heat flux associated with the ingress of colder water originating from the leak into the ground. In practice, the rate of temperature reduction will therefore be a function of the leakage rate and the difference in temperature between the leaking water and the ground.
[Insert Figure 3]
Field trial
A field trial was carried out at the Hillcrest Campus of the University of Pretoria to investigate the performance of a FBG-based leakage detection system on a short length of pipe. The test arrangement was designed to allow effects from changes in pipe strains, ground strains and ground temperatures caused by artificially imposed leaks to be observed. The trial is described in detail by Jacobsz (2018) and Jahnke (2018).
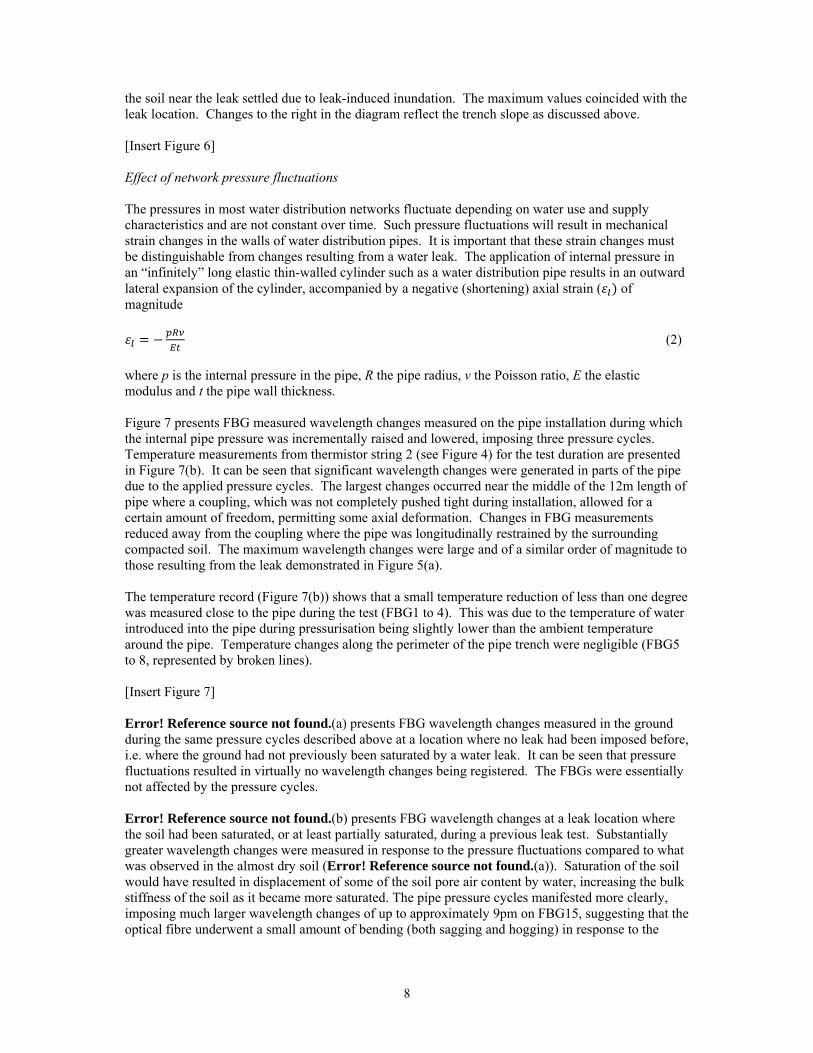
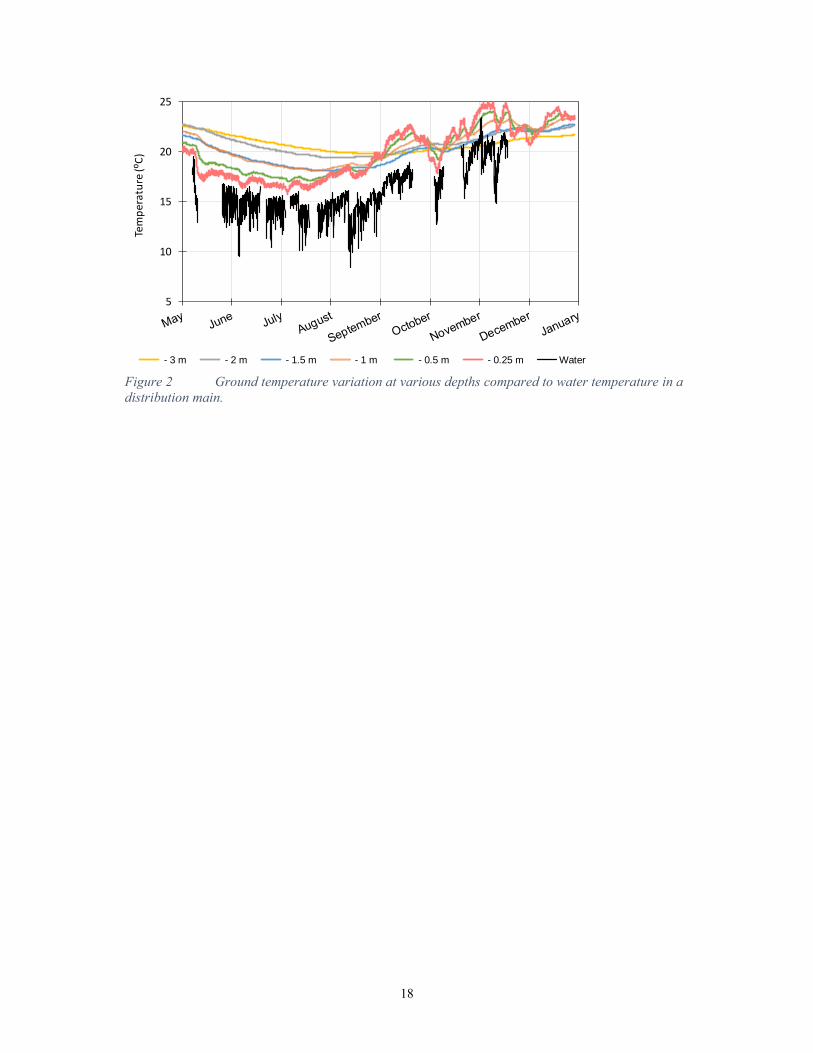
The installation comprised of a 12 m long (two lengths of 6m, with an outer diameter of 110mm) uPVC water pipe equipped with artificial leak points. The pipe installation is illustrated schematically in Figure 4. The installation included a fibre optic cable (Draw Tower Grating Low Bend Loss fibre – DTG®-LBL-1550-F) with 16 discrete fibre Bragg gratings along its length, spaced at 1m. The FBG wavelengths ranged from 1510 nm to 1570 nm in 4 nm increments. The cable comprised of an optical fibre coated with an organically modified ceramic (Ormocer®) which offers benefits in terms of sensing properties and ease of handling / stripping over polyimide or acrylate (FBGS, 2019). The coated fibre was protected by a glass fibre reinforced plastic surround to 1mm diameter, surrounded by a layer of high-density polyethylene, producing a cable with an outer diameter of 2mm in wire form. According to the manufacturer, the effective elastic modulus of the cable exceeds 48GPa and the maximum tensile strain 25000µε (FBGS, 2019).
The fibre optic cable was attached along the length of the pipe so that the first eight FBGs were secured to the outside of the pipe invert by means of a structural adhesive to record longitudinal pipe wall strains. The pipe surface was first roughened using sand paper, then cleaned using ethanol, after which the cable was attached to the pipe using Richem M100 Methacrylate Structural Adhesive. The unbonded part of the cable was looped back so that the remaining eight FBGs were located in the pipe trench parallel to the pipe, with each free FBG opposite a fixed FBG. The separation between the free and fixed FBGs was on average 300mm. The looped back part of the fibre optic cable was sleeved inside a 4mm OD, 2.7mm ID polyethylene tube of 0.65mm wall thickness (manufacturer Festo). The
5
on-average 0.35mm wide annulus between the fibre optic cable and the tube was filled with a multi-purpose low viscosity lubricating oil.
The sleeved fibre optic cable was placed in the pipe trench corner before the pipe was backfilled. The intention of sleeving and lubricating the fibre optic cable was an attempt to isolate it from mechanical strain in the soil so that it would respond to thermal effects only. Polyethylene was selected as a sleeve material for its chemical resistance, including resistance to lubricants. This sleeve arrangement should have been relatively effective to isolate the FBGs from axial strains acting along the sleeve. However, due to the small annulus between the cable and the sleeve and because the cable would have been in contact with the sleeve in many places, the sleeved FBGs would still have responded to bending of the sleeved cable, should it have occurred. Significant bending was, however, not anticipated at conception of the project.
Sleeving and lubricating the fibre optic cable would have added to its thermal inertia, resulting in a slight delay and attenuation in the FBGs’ thermal response. However, calculation showed that the thermal inertia of the sleeved fibre was similar to that of the equivalent cross section of soil. Also, because of the small thermal mass of the sleeved cable and the slow rate of temperature change observed (1.5°C in 12 hrs, see Figure 5), the thermal inertia is not considered significant.
In addition to the optical fibre, nine thermistors (Vishay NTCLE305E4) around the pipe at the leak locations, as shown in Figure 4, were used to allow soil/water temperature variations to be verified independently during leak tests.
Backfill from the original trench was placed around the pipe and hand compacted to the pipe crown, after which the remainder of the pipe trench was backfilled and mechanically compacted to approximately 90% Mod AASHTO density.
The pipe was connected to the municipal water network. Inlet and exit valves were provided to allow the flow through the pipe to be regulated. The pressure in the pipe was monitored using a pressure gauge at the upstream end. The water temperature in the pipe was measured using a thermistor at the upstream water intake.
Three artificial leak points were located at 2m offsets along the length of the pipe as shown in Figure 4. Each leak point comprised a 4mm diameter polyethylene tube tapped into the pipe from where itwas routed to the ground surface and back to its start point on the buried pipe. A valve was installed in each tube at the ground surface, which allowed the leakage rate to be controlled to the desired flow rate. This configuration was used to allow water to be leaked from the pipe itself so that the leaked water would have the same temperature than that in the pipe.
[Insert Figure 4]
Leak tests
A number of short duration leak tests were carried out by opening the valves at the leak points and allowing water from the pipe to be discharged immediately next to the pipe. Effects from pipe and ground strains and temperature changes were monitored using the FBGs from at least 24 hours before the leak tests started until approximately 48 hours after the leak had been terminated. After the short duration tests, the installation was monitored for a period of approximately 9 month after which a longer term leak test, lasting 17 days, was carried out.
6
Because only a number of the FBGs had thermistors installed near them to measure temperature independently, only some FBG results could be temperature compensated. For this reason, FBG results are generally presented in terms of wavelength change.
Leak induced pipe and ground deformation changes
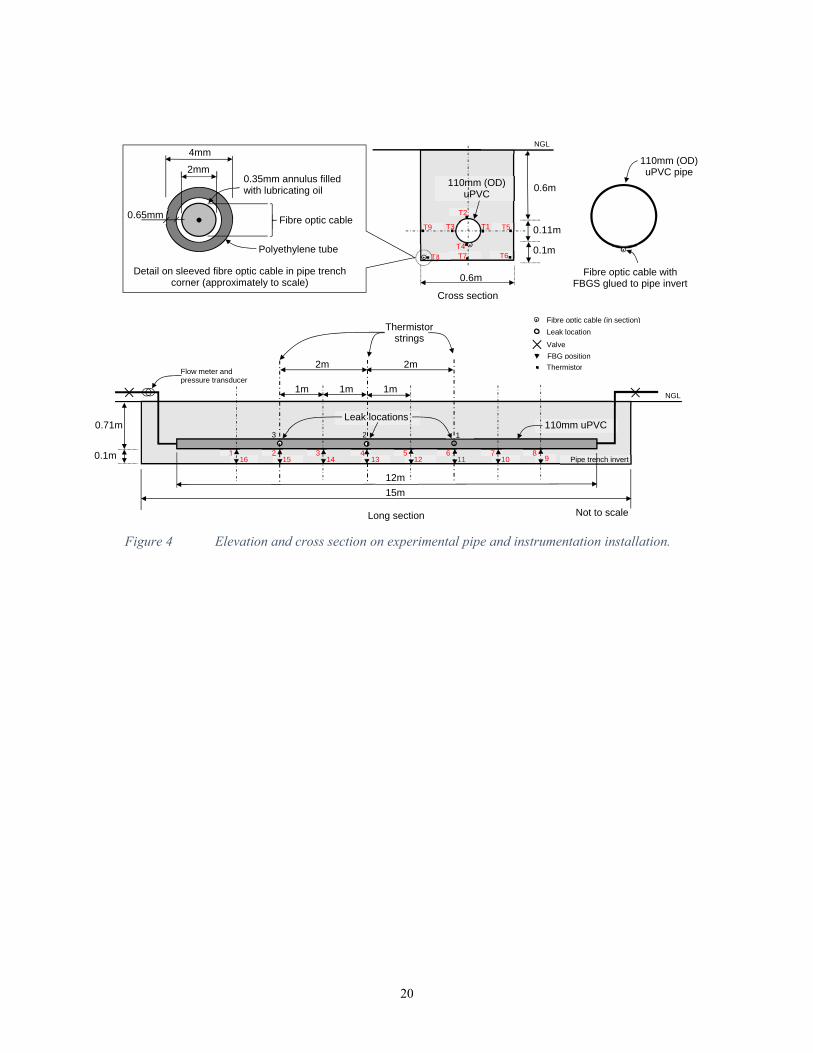
Figure 5(a) presents wavelength changes measured by the eight FBGs glued to the pipe before, during and after imposing a leak. The leak duration was approximately 14 hrs during which water was released into the ground at leak location 1 (see Figure 4) at a flow rate of 85 ml/sec. The initiation and end times are indicated by the broken vertical lines. Figure 5(b) shows wavelength changes measured using the eight FBGs located in the pipe trench corner. The leak location was closest to FBG6 (on pipe) and FBG11 (in soil) (see Figure 4). Thermistors were present next to FBG1, 6, 11 and 16 and allowed the components of FBG-measured wavelength change caused by the leak-induced temperature variation to be quantified and subtracted from the measured wavelength change using Equation 1. A thermal coefficient (ξ + α) of 6.5E-6/K was provided by the fibre optic cable manufacturer. The thermally compensated results are represented by the thin lines plotted in Figure 5, visible next to the uncompensated values for FBG1, 6, 11 and 16. The temperature records used for the thermal compensation of FBG1, 6, 11 and 16 are plotted in Figure 5(c). As observed in the laboratory, temperatures near the leak first exhibited an initial increase, after which a reduction in temperature followed.
[Insert Figure 5]
It can be seen from Figure 5(a) that leak initiation was immediately accompanied by clearly measurable deformation of the pipe. Strains were detectable at all FBGs mounted on the pipe, with the effect generally reducing with increasing distance from the leak point. Deformation continued to occur throughout the entire leak duration. Once the leak had been closed, the wavelength variations gradually returned to their seasonal trend, i.e. a gradually increasing ground temperature.
A similar response was observed by the free FBGs in the pipe trench corner, although the change in FBG wavelength was considerably smaller compared to those on the pipe itself. Despite much smaller values, the leak-induced effects were clearly measurable despite the attempt to mechanically isolate this part of the fibre optic cable from mechanical strains.
Figure 5(a) shows that the thermal component of the FBG measurements represented a small component of the leak-induced effect measured on the pipe itself. Given a maximum temperature deviation during the leak test of about 1°C relative to the start of the experiment, a maximum thermally induced wavelength change of about 10pm (pico meter) was calculated (Equation 1), a small portion of the total wavelength change as demonstrated in Figure 5(a). Due to the smaller effect measured by the FBGs in the ground, the thermal effect represented a larger fraction of the total leak induced effect as shown in Figure 5(b). It is apparent that the component of wavelength change from mechanical strain was much larger than the thermal effect.
Figure 6(a) and (b) present the wavelength changes during the leak test referred to above, plotted with distance along the length of the pipe and in the ground respectively. Positive values represent tensile strains. It is apparent that the leak resulted in sagging of the pipe near the leak location, although the maximum leak-induced wavelength change (strain) was measured at FBG 7, 1m from the leak. The reason for this was most probably attributable to the pipe trench invert, which sloped from FBG1 towards FBG8. Negative strains to the left in Figure 6(a) indicated compression, i.e. hogging deformation of the pipe outside the sagging zone, as would be expected.
Although of a smaller magnitude, Figure 6(b) demonstrates that wavelength changes measured in the ground generally corresponded with those observed on the pipe. The hogging deformation that occurred on the pipe was largely absent due to the low bending stiffness of the sleeved fibre optic cable compared to that of the pipe. It appears that the fibre optic cable registered bending strains as
Results
7
the soil near the leak settled due to leak-induced inundation. The maximum values coincided with the leak location. Changes to the right in the diagram reflect the trench slope as discussed above.
[Insert Figure 6]
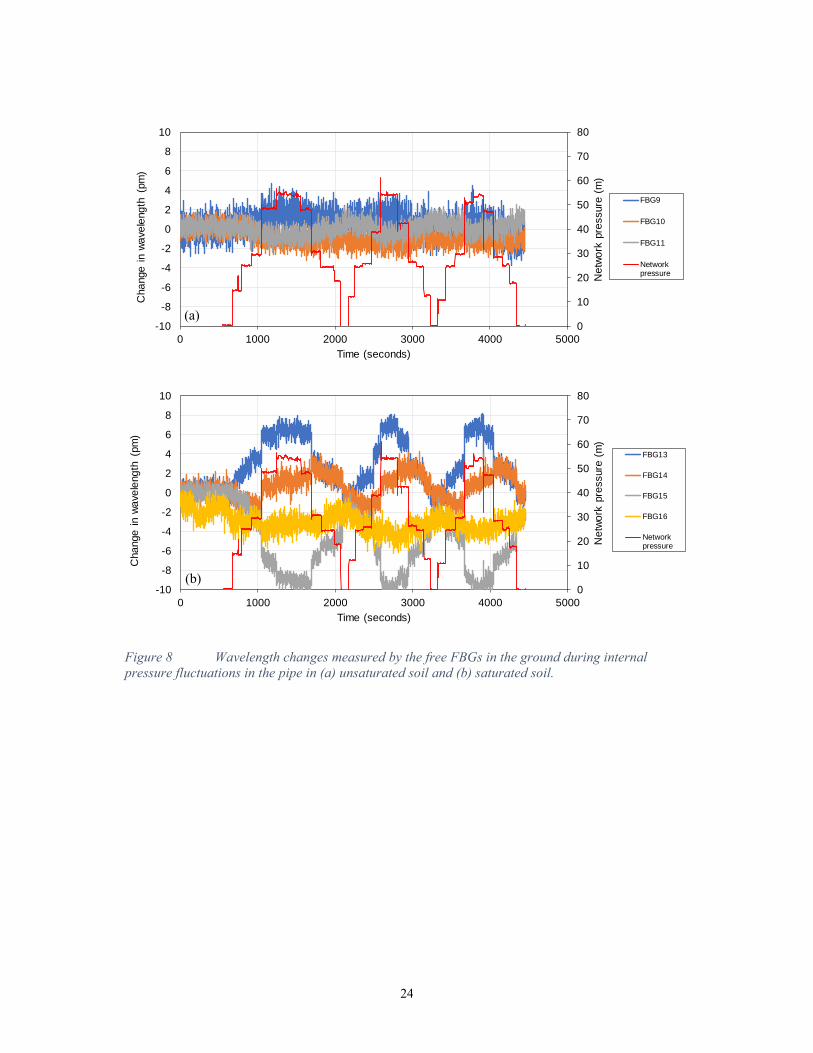
Effect of network pressure fluctuations
The pressures in most water distribution networks fluctuate depending on water use and supply characteristics and are not constant over time. Such pressure fluctuations will result in mechanical strain changes in the walls of water distribution pipes. It is important that these strain changes must be distinguishable from changes resulting from a water leak. The application of internal pressure in an “infinitely” long elastic thin-walled cylinder such as a water distribution pipe results in an outward lateral expansion of the cylinder, accompanied by a negative (shortening) axial strain (𝜀 of magnitude
𝜀 (2)
where p is the internal pressure in the pipe, R the pipe radius, ν the Poisson ratio, E the elastic modulus and t the pipe wall thickness.
Figure 7 presents FBG measured wavelength changes measured on the pipe installation during which the internal pipe pressure was incrementally raised and lowered, imposing three pressure cycles. Temperature measurements from thermistor string 2 (see Figure 4) for the test duration are presented in Figure 7(b). It can be seen that significant wavelength changes were generated in parts of the pipe due to the applied pressure cycles. The largest changes occurred near the middle of the 12m length of pipe where a coupling, which was not completely pushed tight during installation, allowed for a certain amount of freedom, permitting some axial deformation. Changes in FBG measurements reduced away from the coupling where the pipe was longitudinally restrained by the surrounding compacted soil. The maximum wavelength changes were large and of a similar order of magnitude to those resulting from the leak demonstrated in Figure 5(a).
The temperature record (Figure 7(b)) shows that a small temperature reduction of less than one degree was measured close to the pipe during the test (FBG1 to 4). This was due to the temperature of water introduced into the pipe during pressurisation being slightly lower than the ambient temperature around the pipe. Temperature changes along the perimeter of the pipe trench were negligible (FBG5 to 8, represented by broken lines).
[Insert Figure 7]
Error! Reference source not found.(a) presents FBG wavelength changes measured in the ground during the same pressure cycles described above at a location where no leak had been imposed before, i.e. where the ground had not previously been saturated by a water leak. It can be seen that pressure fluctuations resulted in virtually no wavelength changes being registered. The FBGs were essentially not affected by the pressure cycles.
Error! Reference source not found.(b) presents FBG wavelength changes at a leak location where the soil had been saturated, or at least partially saturated, during a previous leak test. Substantially greater wavelength changes were measured in response to the pressure fluctuations compared to what was observed in the almost dry soil (Error! Reference source not found.(a)). Saturation of the soil would have resulted in displacement of some of the soil pore air content by water, increasing the bulk stiffness of the soil as it became more saturated. The pipe pressure cycles manifested more clearly, imposing much larger wavelength changes of up to approximately 9pm on FBG15, suggesting that the optical fibre underwent a small amount of bending (both sagging and hogging) in response to the
8
pressure cycles, despite the attempt to mechanically isolate the fibre optic cable from the surrounding ground.
[Insert Figure 8]
Long term monitoring
Substantial variations in temperature and FBG wavelength were recorded over time and it was therefore necessary to carry out long term monitoring as it is important that leakage-induced changes must be distinguishable from those occurring naturally, e.g. due to temperature fluctuations and/or rainfall infiltration. It was possible to monitor ground temperatures by means of the thermistor installation for a period of two years and pipe and FBG wavelength changes for a period of 45 weeks, with a number of interruptions totalling approximately 5 weeks. This allowed the naturally occurring temperature and FBG wavelength changes to be observed.
Figure 9 presents temperature records from a range of depths down to 3m, also showing the daily rainfall record. The annual temperature cycle is evident, showing how temperature variation reduces with depth. Major rainfall events were found to have an impact on ground temperatures, lowering ground temperatures significantly, but the effect reduced with depth.
[Insert Figure 9]
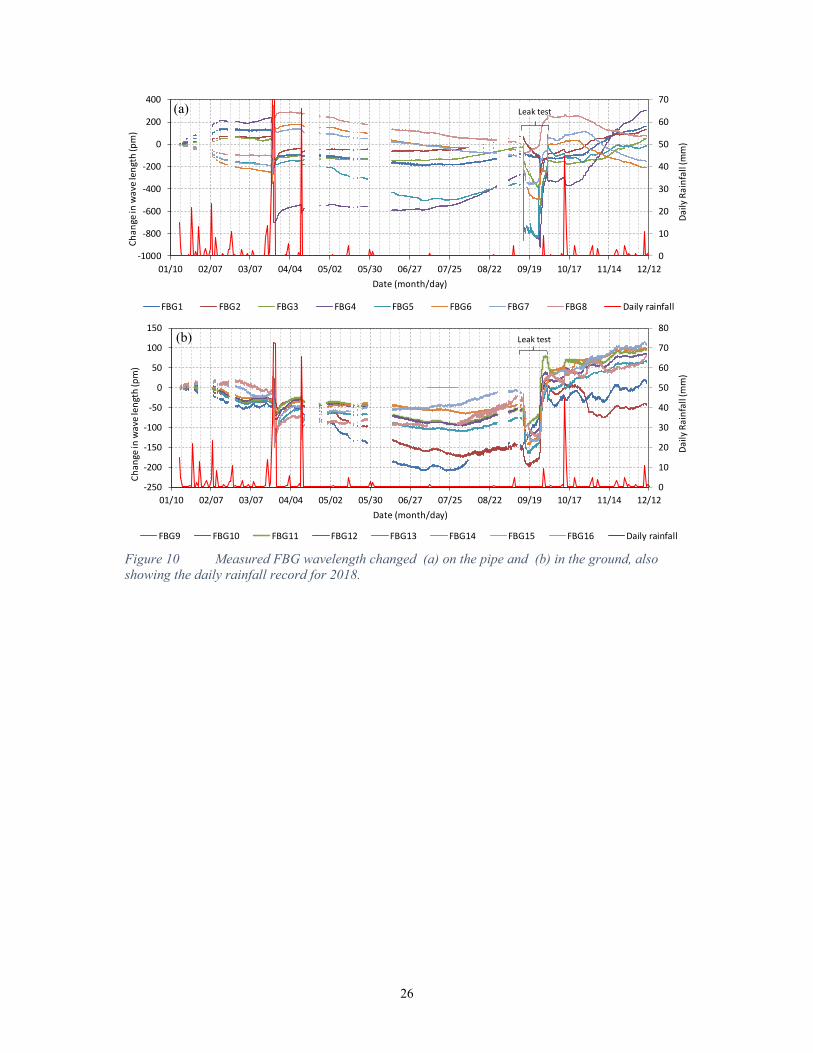
The FBGs mounted on the pipe and those “free floating” in the ground were monitored for most of 2018. The FBG wavelength variation on the pipe is presented in Figure 10(a), also showing the rainfall record. Figure 10(b) shows the wavelength variation measured by the FBGs in the ground. Records were zeroed at commencement of the monitoring period. Gaps in the record reflect periods when the Bragg interrogator was not available. The results show that rainfall events of less than 30mm per day did not result in significant wavelength variation. However, as in the case of ground temperature, there was a significant impact from major rainfall events on both the FBG wavelengths measured on the pipe, as well as the FBG wavelengths measured in the ground. The largest effect arose from heavy rainfall occurring on 23 and 24 March 2018 when 145 mm of rain fell in two days. The pipe was installed in July 2017 and the rainfall record shows that the March 2018 event was by far the most significant the installation had been subjected to at the time. Considerable wavelength changes were observed on the pipe and in the ground and it is believed that this was the first time that the pipe itself had been affected by rainfall related infiltration since installation, i.e. this was the first wetting event. The wavelength changes from a second major rainfall event 19 days later when 66 mm of rainfall occurred showed much less effect. After the two major rainfall events, very little further rainfall occurred and only gradual seasonal strain variations were observed during the dry winter season.
[Insert Figure 10]
Final leak test
After near-continuous monitoring of the installation for nine months, a leak test of a nearly three-week duration was carried out before the start of the 2018-2019 rainy season. This test commenced on 14 Sept 2018 and ended on 1 October. In this test a leak flow rate of approximately 8ml/sec (30 l/hr) was imposed for 11 days, after which the leakage rate was increased approximately 10 fold to approximately 80 ml/sec (290 l/hr) for 6 days. The leak flow rate is indicated on the secondary axis in Figure 11(b). The leak was induced at leak location 2 (see Figure 4). The water supply for the pipe came from the municipal network and the in-pipe pressure fluctuated just above 50kPa.
Figure 11(a) presents temperature changes measured by the thermistor string (see Figure 4) at the leak location monitored over the course of approximately one year. It also presents the daily rainfall record and includes measurements during the leak test carried out in the second half of September.
9
The seasonal fluctuation in temperature is evident and it can be seen that the ground temperatures around the pipe were influenced by heavy rainfall events.
Figure 11(b) presents an enlarged version of the data set around the time of the September leak test. The leak is clearly identifiable from the temperature records for thermistors T1 to T4 around the pipe (see Figure 4) which exhibited daily fluctuation of 0.5°C to 1.5°C after leak commencement, reflecting the water temperature variation in the distribution mains, also evident in Figure 2. Thermistors T5 to T9, further away from the pipe, exhibited little daily fluctuation due to their larger separation from the pipe.
[Insert Figure 11]
The data in both Figure 10 and Figure 11 include the September 2018 leak test. Data from thermistor strings at leak locations 2 and 3 were recorded over the course of 2018. Data is therefore available at these two leak locations to allow temperature records to be compared to the FBG results at FBG2, 4, 13 and 15 as shown in Figure 12. FBG2 and 4 were attached to the pipe and FBG15 and 13 were installed opposite them in the ground, as shown in the legend at the bottom of Figure 12. The measured wavelength changes are shown in red. The temperature records allowed the components of wavelength variation attributed to temperature variation to be calculated and subtracted from the measured values to produce components attributed to strain changes, i.e.:
[Insert Figure 12]
𝑙 𝑘𝜀 ∆𝑙 𝜉 𝛼 ∆𝑇𝑙 (3)
(Symbols declared with Equation 1.) Figure 12 presents the components of wavelength changes attributed to strain changes in blue. Strictly speaking, the reference temperature required to apply temperature compensation should be recorded when the pipe is stress free to allow true temperature compensation. A pipe is probably closest to a stress free condition only when positioned on a perfectly flat pipe bedding during installation prior to backfilling of the trench. It was not practical to record FBG or temperature measurements during pipe installation and for this reason, temperature compensation was based on the values when data logging commenced. The implication is that strain changes refer to the state of strain when logging commenced and not to the strain free state.
The thermal data presented in Figure 11 shows that rainfall and leakage-induced temperature deviations were small, typically below 2°C, much smaller than the maximum seasonal temperature variation of approximately 10°C for the installation presented here. A temperature deviation of 10°C allows a thermally induced FBG wavelength change of approximately 100pm to be calculated. Guidance regarding the seasonal temperature variation can be found from ground temperature data such as presented in Figure 2. With the exception of heavy rainfall events and pipe leaks, producing small and sudden temperature deviations, the seasonal deviation progressed gradually during the season as ground temperatures varied, so that the thermally compensated wavelength record representing strain changes deviate smoothly from the measured values.
Figure 12 contains five prominent slope changes/deviations, with 1 and 3 being most prominent. Number 1 represents the most significant rainfall event, probably the event of first wetting of the pipe bedding as discussed previously. Subsequent rainfall events showed a much less pronounced effect. Event 3 represents the start of the September leak test which was also significant in terms of wetting of the pipe bedding, discharging 50 m3 of water into the pipe bedding. The initial leakage rate of 30l/hr represents a relatively slow leak, but it features very prominently on both the thermally compensated and uncompensated wavelength records. Event 4 represents the end of the leak test and event 5 another significant rainfall event. The data shows that major rainfall events and the pipe leak are readily identified by sudden sharp slope changes causing large deviations from seasonal wavelength trends. The magnitude of the wavelength changes on the pipe considerably exceeded the
10
measurements from the FBGs in the ground, suggesting that leak-induced bending of the pipe caused larger bending strains in the pipe than the bending strains mobilised in the sleeved optical fibre.
The data presented Figure 12 shows that major rainfall events and pipe leaks can be identified equally well from raw FBG wavelength records and records compensated for temperature. The data suggest that there does not appear to be an advantage by applying temperature compensation when using FBG wavelength measurements as a means of leak detection. However, when observing a sudden slope change in FBG wavelength records, it is necessary to consult the local rainfall record to assess whether an event is the result of rainwater infiltration or a pipe leak.
Discussion
The purpose of this study was to investigate the performance fibre optic cables incorporating fibre Bragg gratings to provide a means of leak detection on water pipelines. At conception of the study it was expected that the most practical implementation of such a leak detection system would be to bury a string of FBGs in the ground next to a new pipe during its installation. It was expected that these FBGs would be sensitive to leak-induced temperature changes from usually colder water flowing from a leak into the ground. In the field installation reported here, the fibre optic cable with FBGs was therefore sleeved as described in an attempt to ensure that it is largely isolated from axial mechanical strains acting on the sleeve, so that it would respond predominantly to temperature changes. In addition, it was expected that a water leak may result in strain changes in the walls of the leaking pipe because water infiltration into the backfill material may affect the support conditions around the pipe and therefore FBGs were attached to the pipe itself opposite each of the sleeved FBGs. Furthermore, a number of thermistors were installed to independently measure temperature changes near some of the sleeved FBGs and those on the pipe, allowing the strain and thermal responses of these FBGs to be separated.
It was found that a water leak resulted in large axial strain changes in the pipe walls. This is attributed to bending of the pipe as the leaking water resulted in a change in support conditions around the pipe (discussed further below). As expected, the thermistor results also responded to water leaks, allowing the thermal component of the FBG response to be calculated. Given a typical observed leak-induced temperature reduction of between 1°C and 3°C, a FBG wavelength change of 10pm to 30pm was calculated for the fibre optic cable used. However, examining the FBG responses on the pipe revealed wavelength changes of several hundred picometre. Much larger than expected wavelength changes, amounting to over 100pm were also observed on the sleeved FBGs, despite their partial mechanical isolation. Their response is attributed to leak-induced bending of the sleeved fibre optic cable in addition to a thermal effect. This much larger than expected response recorded by the sleeved FBGs suggests that the best means of leak detection will be to bury a fibre optic cable close to the pipe. There is no need to isolate it mechanically so that it is free to respond to both leak-induced thermal effects and mechanical strains. The response of a cable with FBGs without a sleeve can be expected to be even more sensitive to a leak than the results obtained in this study with sleeved FBGs.
A leak detection system comprising a free fibre optic cable is preferred to one fixed to the pipe for the following reasons:
It is a laborious undertaking to attach a fibre optic cable along the entire length of a new pipe onan active pipeline construction site. Simply burying a cable near the pipe in the pipe trench isreadily achievable.
A working pipeline is subjected to internal pressure fluctuation during use, which will result in anoisy FBG response which will complicate the detection of leak-induced effects. A cable withFBGs some distance from the pipe is much less sensitive to internal pipe pressure fluctuation.
11
The results of this study showed that effects of a leak stand out significantly more prominently on a FBG wavelength record than on the temperature record (compare Figure 11 and Figure 12). Also, there does not appear to be a need to thermally compensate wavelength records. Water ingress from a leak, a substantial rainfall event, or another cause, can be identified on a raw or compensated FBG wavelength record with equal ease as a sudden slope change resulting in a deviation of the normally smooth seasonal FBG wavelength variation. Therefore, when using such a system for leak detection, it is necessary to evaluate potential leak alarms against the local rainfall record. A rainfall-induced false alarm is likely to be relatively easily identifiable because of the large spatial extent of a rainfall event relative to a typical water leak.
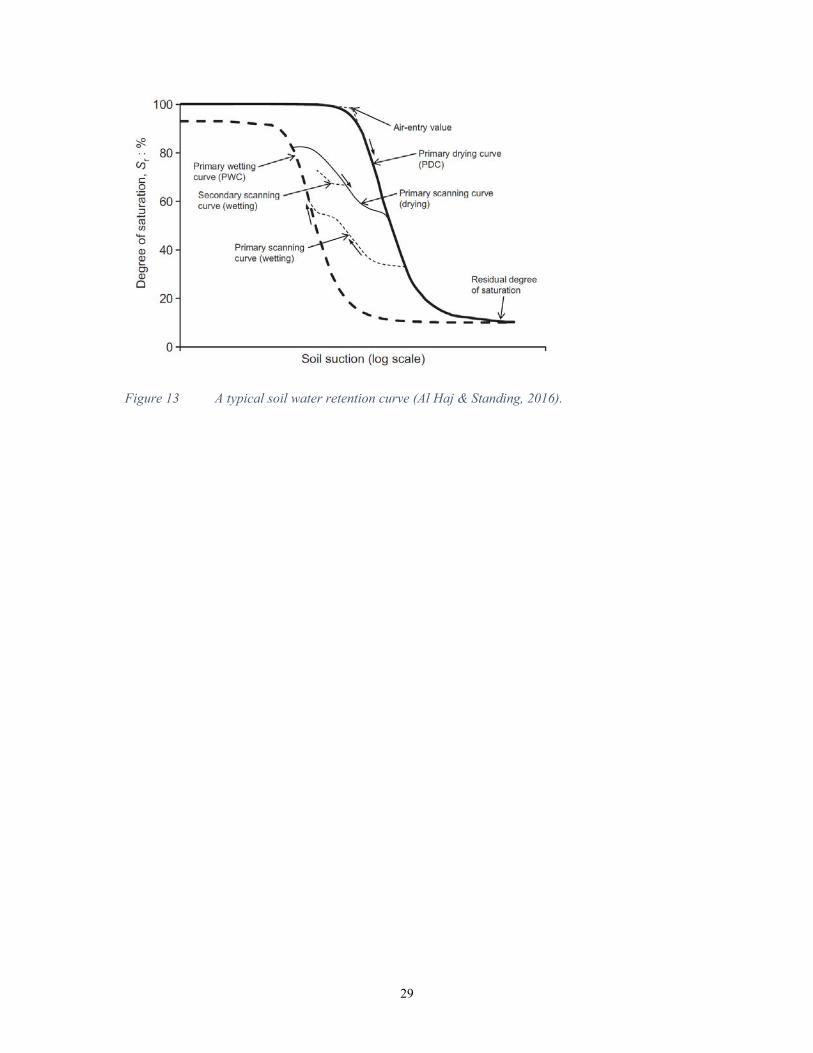
The soil around the instrumented pipe in this study was unsaturated, with the degree of saturation estimated at approximately 15% after installation. Soils in many dry parts of the world occur in the unsaturated state and therefore the beddings and backfill of non-leaking pipes can also be expected to be unsaturated. Negative pore water pressures, also referred to as matric suction, play an important role in soil behaviour in unsaturated soils (Fredlund and Rahardjo, 1993). The hysteretic relationship between soil moisture content and pore water suction is described by the soil water retention curve, a generic example of which is shown in Figure 13.
[Insert Figure 13]
Depending on the particle size distribution of the soil, changes in soil moisture content may be associated with very large changes in matric suction, which, in turn, is associated with a large change in effective stress and hence strength of the soil. Soil saturation is accompanied by an increase in the bulk density of the soil and a reduction in strength, together resulting in ground movement, generally settlement. These can easily be detected by an optical fibre with FBGs buried in the ground as the fibre optic cable is likely to bend.
Due to the extreme sensitivity of fibre optic strain measurement and the fact that it is sensitive to both the thermal and mechanical strains in the ground resulting from a leak, the possibility exists to also retrofit a fibre optic leak detection system to existing pipes by burying the optical fibre in a trench excavated to near the pipe crown. A leak is likely to result in ground deformation which may be measurable even above the pipe. However, the performance of such a retrofitted system should be confirmed by field trials.
Towards practical implementation
The work presented is based on a trial to demonstrate the potential of leak-induced FBG response as a means of leak detection on water pipelines. The major shortcoming of such a system is that FBG wavelength changes can only be measured at a number of discrete locations on a single optical fibre, limiting the length of pipe that can be monitored. A system monitoring long lengths of pipeline that would be practical for implementation in practice should make use of distributed fibre optic sensing based on Brillouin Optical Time Domain Reflectometry (BOTDR) or a similar technology. Brillouin shift in optical fibres is sensitive to both strain and temperature changes and should therefore provide a means of leak detection similar to the FBGs in this study. A study demonstrating this technology is currently being planned.
A robust fibre optic cable, capable of surviving installation on an active construction site, needs to be used in real-life installation. Added protection comes at a cost of increased cable stiffness. A study is therefore required to evaluate the performance of sensing fibre optic cables of various degrees of robustness as a means of leak detection.
It was demonstrated that the response of a fibre optic cable monitoring a pipeline can be influenced by factors other than pipe leaks such as major rainfall events. Other mechanical influences such as traffic loading may potentially also affect readings, locally changing the baseline against which data is
12
interpreted. It will therefore be necessary to adjust the baseline after major rainfall events. The time history from areas likely to be affected by other mechanical influences such as traffic crossings, should be examined to identify changes out of the norm, which may be indicative of a leak. It is recommended that trial leak detection installation be monitored to aid in the development of algorithms that may allow the leak detection process to be automated.
Conclusions and recommendations
It was demonstrated that wavelength data recorded using FBGs on a fibre optic cable buried alongside a pipe in the pipe trench provide a means of leak detection in unsaturated soils. Due to the large influence of infiltrating water on the ambient matric suction in the ground, water infiltration may cause significant effective stress changes and hence deformation of the ground, also resulting in deformation of a buried pipe and fibre optic cable when present. The deformation thus imposed on the pipe and the fibre optic cable significantly exceeds the thermal effects from the leak and can be detected on a FBG wavelength record.
Leak-induced FBG wavelength changes must be distinguished from other changes caused by temperature variation, network pressure variation, major rainfall events and other mechanical influences. A leak manifests as a pronounced slope change in the wavelength record, whereas season variations are gradual (excluding effects from major rainfall events). Potential water leaks can be identified by interrogating the FBG wavelength record for sudden slope changes and comparison against the local rainfall record and the spatial extent over which a deviation is observed. It was not found necessary to compensate wavelength records for thermal effects because the thermal effects were of a much smaller magnitude that effects from mechanical deformation in this particular investigation.
Major advantages of fibre optic leak detection systems are their low cost and the fact that fibre optic cables are inert from electrical disturbances. Fibre optic cables are often buried with newly installed pipelines for telemetry purposes and the potential exists to use these fibre optics cables as a means of leak detection. Entire pipe networks can, in principle, be monitored for leaks on a permanent basis by routing fibre optic cables from various parts of a greater network to a pipe network surveillance centre where a suitable interrogator is housed. The advantage of such systems is that, once installed, the fibre optic sensing system can be viewed as passive, continuously monitoring pipelines for leaks and alerting the owner without the need for a third party to be appointed to locate a leak, i.e. an active system of leak detection.
In terms of practical implementation of such a leak detection system, it is recommended that the fibre optic cable be buried in the pipe trench alongside the pipe, but not attached to the pipe. The reason for not attaching the fibre optic cable is that pipe wall strain changes occur during daily internal pressure fluctuations and may cause some difficulty to distinguish leak-induced responses. A free fibre optic cable is also much simpler to install than bonding a cable to a pipe on a construction site. A practical system suitable for monitoring many kilometres of pipeline is likely to be based on distributed fibre optic sensing based on BOTDR or a similar technology, monitoring changes in Brillouin shift as a parameter of leak indication in lieu of FBG wavelength changes as investigated in this study. The performance of such a system requires further research. In addition, the optimal degree of robustness of the fibre optic sensing cable should be researched, ensuring that it survives the installation process, while being sufficiently sensitive to respond to leaks.
Funding
The authors would like to acknowledge the South African Water Research Commission for funding this project [grant number 5/2726/3].
13
Declaration of Conflicting Interests
The Authors declare that there is no conflict of interest. References
Agapiou, A., Toulios, L., Themistocleous, K., Perdikou, S., Alexakis, D.D., Sarris, A., Toulios, G., Clayton, C., Foinikaridou, H., Manolis, A. and Hadjimitsis, D.G. 2013. Use of satellite derived vegetation indices for the detection of water pipeline leakages in semiarid areas. Proceedings of the SPIE, 8795, 879507.
Al Haj, K.M.A. and Standing J.R. 2016. Soil water retention curves representing two tropical clay soils from Sudan. Geotechnique 66(1), 71–84.
Aslannejad, H., Terzis, A., Hassanizadeh, S. and Weigand, B. 2017. Occurrence of temperature spikes at a wetting front during spontaneous imbibition. Scientific Reports, 7(1).
Beck,Y.-L., Di Murro, V., Pelecanos, L., Soga, K., Kechavarzi, C., Morton, R.F. and Scibile, L. 2016. Distributed fibre optic long-term monitoring of concrete-lined tunnel section TT10 at CERN
Bishop, A.W. 1959. The principle of effective stress. Tekniche Ukeblad 39, 4-16.
Eyuboglu, S., Mahdi, H. and Al-Shukri, H. 2003. Detection of water leaks using ground penetrating radar. In N. Anderson (Ed.), Geophysics 2003: Conference on Applied Geophysics Rolla, MO: The University of Missouri-Rolla., 8-12.
Feng, X., Zhang, X.W., Wu, W.J., Li, X.Y., Li, X. and Zhou, J. 2016. Distributed monitoring of buried pipelines with Brillouin fiber optic sensors. Proceedings of the International Conference on Smart infrastructure and construction. ICE Publishing, CSIC, 33-38.
Frendlund, D.G. and Rahardjo, H. 1993. Soil mechanics for unsaturated soils. John Wiley & Sons, Inc.
Green A.K., Zaidman, M.M., Shafir, E., Tur, M. and Gali, S. 2000. Infrastructure development for incorporating fibre-optic sensors in composite materials. Smart Materials and Structures, 2000, 9, 316–321.
Hauswirth, D., Puzrin, A., Carrera, A., Standing, J., and Wan, M. 2014. Use of fibre-optic sensors for simple assessment of ground surface displacements during tunnelling. Geotechnique, 64(10), 837–842.
Holton, W. C. Multiplexing sensors test new bridge material. Laser Focus World, 1998, 4, No. 7, 26–29.
Inaudi, D. and Glisic, B. 2010. Long-range pipe line monitoring by distributed fiber optic sensing. Journal of pressure vessel technology 132, 011701: pp 1-9.
Iten, M., Puzrin, A. M., and Schmid, A. 2008. Landslide monitoring using a road-embedded optical fiber sensor.” Proc., Society of Photo-optical Instrumentation Engineers (SPIE) Smart Sensor Phenomena, Technology, Networks and Systems, W. Ecke, K. J. Peters, and N. G. Meyendorf, eds., Vol. 6933, SPIE.
Jacobsz, S.W. 2018. Responsive pipe networks. South African Water Research Commission. WRC Report No K5/2726/3.
14
Jahnke, S.I. 2018. Pipeline leak detection using in-situ soil temperature and strain measurements. MEng dissertation. University of Pretoria.
Jahnke, S.I., Jacobsz, S.W. and Kearsley, E.P. 2018. A field model investigating pipeline leak detection using discrete fibre optic sensors. Proc of 9th International Conference on Physical Modelling in Geotechnics, London (in press).
Klar, A., Dromy, I., and Linker, R. 2014. Monitoring tunneling induced ground displacements using distributed fiber-optic sensing. Tunnelling Underground Space Technol., 40, 141–150.
Klar, A., and Linker, R. 2010. Feasibility study of automated detection of tunnel excavation by Brillouin optical time domain reflectometry. Tunnelling Underground Space Technol., 25(5), 575–586.
Lee, H., Yang, J. and Sohn, H. 2012. Baseline-free pipeline monitoring using optical fiber–guided laser ultrasonics. Structural Health Montoring 11(6), 684-695.
Linker, R. and Klar, A. 2017. Detection of Sinkhole Formation by Strain Profile Measurements Using BOTDR: Simulation Study. ASCE Journal of Engineering Mechanics 143(3), B4015002.
Maaskant, R., Alavie, T., Measures, R. M., Tadros, G., Rizkalla, S. H. and Guha-Thakurta, A. Fibre-optic Bragg grating sensors for bridge monitoring. Cement and Concrete Composites, 1997, 19, 21–33.
McKenzie, R.S. Siqalaba, Z.N. & Wegelin, W.A. 2012 The State of Non-Revenue Water in South Africa. Pretoria: Water Research Commission. Report no. TT 522/12.
Mendez, A. and Morse, T. F. 1992. Overview of optical fibre sensors embedded in concrete. Fibre Optic Smart Structures and Skins, 1992, 1798, 205–16.
Mishra, A. and Soni, A. 2011. Leakage Detection using Fibre Optics Distributed Temperature Sensing. 6th Pipeline Technology Conference (PTC). Euro Institute for Information and Technology Transfer. Hannover Messe, Germany.1-12.
Mohamad, H., Soga, K., and Bennett, P. 2011. Monitoring twin tunnel interaction using distributed optical fiber strain measurements. J. Geotech. Geoenviron. Eng., 10.1061/(ASCE)GT.1943-5606.0000656, 957–967.
Motil, A., Bergman, A. and Tur, M. 2016. State of the art of Brillouin fibre-optic sensing. Optic & Laser Technology 78: 81-103.
Niklès, M., Vogel, B., Briffod, F., Grosswig, S., Sauser, F., Luebbecke, S., Bals, A., and Pfeiffer, T., 2004. Leakage Detection Using Fiber Optics Distributed Temperature Monitoring. 11th SPIE Annual International Symposium on Smart Structures and Materials, San Diego, CA, Mar. 14–18.
Parks, G.A. 1984. Surface and interfacial free energies of quartz. Journal of Geophysical Research 89(B6), pp 3997-4008.
US Army Corps of Engineers (USACE), 2001 Washington, D.C., CEMP-R, Public Works Technical Bulletin 420-49-36 – Leak Detection, https://www.wbdg.org/FFC/ARMYCOE/PWTB/pwtb_420_49_36.pdf (accessed 28 March 2018).
US Environmental Protection Agency (USEPA). 2010 Control and mitigation of drinking water losses in distribution systems. Washington: EPA Office of Water (4606M). EPA 816-R-10-019.
15
Van Zyl, J.E. 2014. Theoretical modeling of pressure and leakage in water distribution systems. Procedia Engineering, 89, 273-277. Wenzel, R.N. 1936. Resistance of solid surfaces to wetting by water. Industrial and engineering chemistry 28(8), pp 988-994.
16
Figure 1 Non-revenue water ratios - international statistics (McKenzie et al., 2012).
17
Figure 2 Ground temperature variation at various depths compared to water temperature in a distribution main.
5
10
15
20
25
Temperature (⁰C)
- 3 m - 2 m - 1.5 m - 1 m - 0.5 m - 0.25 m Water
18
Figure 3 Measured temperature response upon wetting during passage of a wetting front through different soils.
24
28
32
36
40
25
25.5
26
26.5
27
0 500 1000 1500 2000 2500 3000
Site soil temperature (°C)
Sand and tailngs tem
perature (°C)
Time (sec)
Iron tailings
Platinum tail ings
Silica sand
Gold tailings
Site soil (secondary
vert axis)
19
Figure 4 Elevation and cross section on experimental pipe and instrumentation installation.
2m 2m
12m
15m
110mm uPVC
Not to scale
1 2 3 4 5 6 7 816 15 14 13 12 11 10 9
Leak locations
1 2 3 0.71m
0.1m Pipe trench invert
1m 1m 1m
Thermistor strings
Long section
NGL
Flow meter and pressure transducer
. Leak location
Valve
FBG position
Thermistor
Fibre optic cable (in section)
Cross section
T2
T1 T3
T4
T5
T6 T7 T8
T9
0.6m
0.11m
0.1m
0.6m
NGL
110mm (OD) uPVC
4mm
2mm
Fibre optic cable
0.35mm annulus filled with lubricating oil
Polyethylene tube
0.65mm
Detail on sleeved fibre optic cable in pipe trench corner (approximately to scale)
. .
110mm (OD) uPVC pipe
Fibre optic cable with FBGS glued to pipe invert
.
20
Figure 5 FBG wavelength changes measured before, during and after a leak using (a) FBGs glued to the pipe and (b) free FBGs in the pipe trench corner. (c) represents the temperature records.
-100
0
100
200
300
400
09/12 09/13 09/14 09/15 09/16 09/17
Cha
nge
in
wa
vele
ngth
(pm
)
Date (month/day)
FBG 1
FBG 1 comp
FBG 2
FBG 3
FBG 4
FBG 5
FBG 6
FBG 6 comp
FBG 7
FBG 8
Leak initiation
Leak term
ination
Compensated for temp
FBG1
FBG7
FBG6
FBG8
FBG5
FBG4
FBG2
FBG3
At leak location
-20
0
20
40
60
80
09/12 09/13 09/14 09/15 09/16 09/17
Cha
nge
in
wa
vele
ngth
(pm
)
Date (month/day)
FBG 16
FBG 16 comp
FBG 15
FBG 14
FBG 13
FBG 12
FBG 11
FBG 11 comp
FBG 10
FBG 9
Leak initiation
Leak term
ination
FBG11
FBG12
FBG13
FBG15
FBG14 FBG16
Compensated for temp
Compensated for temp
At leak location
17.5
18.0
18.5
19.0
19.5
09/12 09/13 09/14 09/15 09/16 09/17
Me
asu
red
tem
pera
ture
(°
C)
Date (month/day)
FBG 1
FBG 6
FBG 11
FBG 16
(a)
(b)
(c)
21
Figure 6 FBG wavelength changes plotted against distance measured (a) on the pipe and (b) in the ground.
‐100
‐50
0
50
100
150
200
250
300
350
400
1 2 3 4 5 6 7 8Change in wavelength (pm)
FBG no (spacing 1m)
Baseline 5.52 13.44 21.36 71.52
At leak termination
Hours after onset of leak
Leak location
‐20
‐10
0
10
20
30
40
50
60
70
80
910111213141516
Change in wavelength (pm)
FBG no (spacing 1m)
Baseline 5.52 13.44 21.36 71.52
At leak termination
Hours after onset of leak
Leak location
(a)
(b)
22
Figure 7 (a) FBG wavelength changes measured by the glued FBGs during internal pressure fluctuations and (b) the corresponding thermistor measurements around the pipe
0
10
20
30
40
50
60
70
80
-700
-600
-500
-400
-300
-200
-100
0
100
0 1000 2000 3000 4000 5000
Ne
two
rk p
ress
ure
(m
)
Cha
nge
in
wa
vele
ngth
(pm
)
Time (seconds)
FBG1
FBG2
FBG3
FBG4
FBG5
FBG6
FBG7
FBG8
Networkpressure
(a)
(b)
23
Figure 8 Wavelength changes measured by the free FBGs in the ground during internal pressure fluctuations in the pipe in (a) unsaturated soil and (b) saturated soil.
0
10
20
30
40
50
60
70
80
-10
-8
-6
-4
-2
0
2
4
6
8
10
0 1000 2000 3000 4000 5000
Ne
two
rk p
ress
ure
(m
)
Cha
nge
in
wa
vele
ngth
(pm
)
Time (seconds)
FBG9
FBG10
FBG11
Networkpressure
0
10
20
30
40
50
60
70
80
-10
-8
-6
-4
-2
0
2
4
6
8
10
0 1000 2000 3000 4000 5000N
etw
ork
pre
ssur
e (
m)
Cha
nge
in
wa
vele
ngth
(pm
)
Time (seconds)
FBG13
FBG14
FBG15
FBG16
Networkpressure
(b)
(a)
24
Figure 9 Baseline ground temperature and rainfall data over the two year study period.
Date (month/day)T1 T2 T3 T4 T5 T6 T7 T8 T9 Daily rainfall Flow rate
Leak test
(a)
(b)
27
Figure 12 Raw FBG wavelength changes measured on the pipe (shown in red) and in the ground (in red), plotted with temperature compensated results (in blue), together with temperature over the course of 2018.


![[HOT LEAK] MONEY MAKING $500 A WEEK | PROFITABLE GUIDE OF 2015 | UNSATURATED](https://static.documents.pub/doc/80x56/587b147e1a28abb15c8b7091/hot-leak-money-making-500-a-week-profitable-guide-of-2015-unsaturated-58baf49728cb8.jpg)


