10/16/13 1 1 Lean Accounting and Operational Excellence: A Survey of Practices at Lean Companies and Companies Engaged in Lean Transformation Larry Grasso Tom Tyson Clifford Skousen Rosemary Fullerton 2 Note to potential attendees Throughout our presentation we will be asking those of you who attend our session to respond to a few questions about your facilities and companies. Your responses will be collected electronically and will be anonymous. A summary of the collective responses of our attendees to each question will be instantly displayed during the session. To avoid influencing your answers, some of our survey results have been deleted from this handout. A complete handout will be available for download shortly after the session is finished. We look forward to seeing you!
Transcript
10/16/13
1
1
Lean Accounting and Operational Excellence:
A Survey of Practices at Lean Companies and Companies
Engaged in Lean Transformation
Larry Grasso Tom Tyson
Clifford Skousen Rosemary Fullerton
2
Note to potential attendees
§ Throughout our presentation we will be asking those of you who attend our session to respond to a few questions about your facilities and companies.
§ Your responses will be collected electronically and will be anonymous.
§ A summary of the collective responses of our attendees to each question will be instantly displayed during the session.
§ To avoid influencing your answers, some of our survey results have been deleted from this handout.
§ A complete handout will be available for download shortly after the session is finished.
§ We look forward to seeing you!
10/16/13
2
3
Goal of our study
§ Explore the “current state” of the relationship between management accounting systems and performance measures and operating results at companies engaged at various stages of lean transformations.
§ Phase I – Obtain a broad perspective using an online survey.
§ Phase II – Obtain deeper insight using a multi-site field study.
4
Who we surveyed
§ Contact list from the Shingo Prize Organization § Individuals who had expressed an interest
in receiving information from the organization.
§ Reduced to those working at a manufacturing or service (mostly logistics and repair) facility.
§ 4,537 subjects at 697 facilities.
10/16/13
3
5
Who Responded
§ 510 Usable responses from people representing 368 different facilities at 195 different organizations. § 25 – 30% Lean, Quality or CI managers § 20 – 25% Prod., Op., Mfg. or Plant mgrs. § 10 – 15% Other manager/director § 5 – 10% Engineering, R&D § 5 – 10% VP, President or CEO
§ 11% unspecified or other, < 2% Finance/Accounting
6
How would you rate your manufacturing operations? A. Tradi/onal B. C. Progressive D. E. Highly innova/ve
10/16/13
4
7
Cost & Measurement Systems
§ We asked about the extent of use of eight cost and measurement systems. 1. Labor & overhead efficiency measures. 2. Overhead & volume efficiency measures. 3. Standard costing. 4. Activity-based costing. 5. Target costing. 6. Balanced Scorecard. 7. Value stream costing. 8. Throughput accounting.
8
Does your facility make considerable use or a great deal of use of: A. Labor & material efficiency measures? B. Overhead and volume efficiency measures? C. Standard costing? A. A, B & C. B. A & B, but not C. C. C, but not A & B. D. Just A. E. Just B. F. Just C. G. None of them.
10/16/13
5
9
Traditional accounting costing & measurement
Cost / Performance Measurement System (not at all 1, little 2, some 3, considerable 4, great deal 5) N Mean
Consid-erable
Great Deal
Performance measures related to labor/material efficiency
362
Performance measures related to overhead volume/efficiency
360
Standard costing
360
§ Traditional measurements like labor efficiency, purchase price variance … and others drive mass-production thinking. ... This is the opposite of what a Lean company is trying to achieve. … these accounting and operational measurements will push back and stymie our efforts. § Brian Maskell Printing Industries of America: The Magazine 2013, p. 28
10
If you use labor material and overhead efficiency measures, how do you deal with an8-‐lean signals?
A. We use lean efficiency measures that don’t conflict with lean behavior.
B. We have to report tradi/onal measures to corporate, but they understand the conflicts and lean measures have priority
C. We have to report tradi/onal measures to corporate, and we do get push back when they conflict.
D. We s/ll find the tradi/onal measures valuable, and we don’t see a conflict.
10/16/13
6
11
If you use standard cos8ng, how do you deal with the an8-‐lean signals?
A. We only use standard cos/ng for financial repor/ng, not decision-‐making.
B. We have to report standard costs to corporate, but they understand the conflicts and lean measures have priority.
C. We have to report standard costs to corporate, and we do get push back when they conflict.
D. We find standard costs useful for some decisions, and we don’t see a conflict.
12
To what extent does your facility use value stream cos8ng? A. Not at all B. A liVle C. Some D. Considerable E. A great deal
10/16/13
7
13
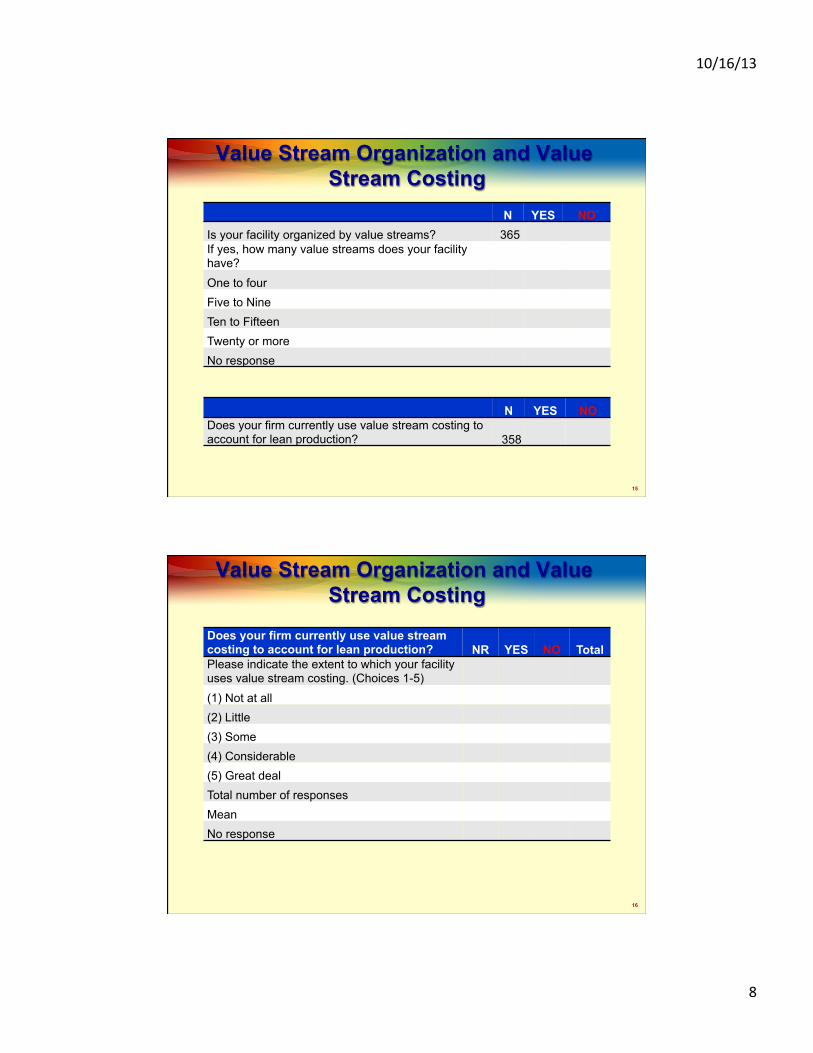
Is your facility organized by value streams?
A. Yes B. No
14
Does your firm currently use value stream costing to account for lean production? A. Yes B. No
10/16/13
8
15
Value Stream Organization and Value Stream Costing
N YES NO Is your facility organized by value streams? 365 If yes, how many value streams does your facility have? One to four Five to Nine Ten to Fifteen Twenty or more No response
N YES NO Does your firm currently use value stream costing to account for lean production? 358
16
Value Stream Organization and Value Stream Costing
Does your firm currently use value stream costing to account for lean production? NR YES NO Total Please indicate the extent to which your facility uses value stream costing. (Choices 1-5) (1) Not at all (2) Little (3) Some (4) Considerable (5) Great deal Total number of responses Mean No response
10/16/13
9
17
If you do not currently use value stream cos8ng, Why not? A. We don’t understand value stream
cos/ng. B. Our auditors prefer standard cos/ng. C. We don’t see the benefits of value
stream cos/ng. D. It’s too costly to implement new
accoun/ng systems. E. We our sa/sfied with our current
accoun/ng system. F. Our corporate headquarters won’t
allow the change. G. We aren’t organized by value stream.
18
Reasons for not using VSC Why do you not use value stream costing (VSC)? (1) strongly disagree to (5) strongly agree. N Mean
Number that agree or
strongly agree We don’t understand VSC 287 Our auditors prefer standard costing 284 We don’t see the benefits of VSC 283 It is too costly to implement new accounting systems 284 We are satisfied with our current costing system 283
10/16/13
10
19
Does your facility make considerable use or a great deal of use of: Ac8vity-‐based cos8ng (ABC)? Value stream cos8ng (VSC)? A. Only VSC. B. VSC & ABC. C. Only ABC. D. Neither one.
20
Value Stream Costing and Activity-Based Costing
Cost/Performance Measurement System (not at all 1, little 2, some 3, considerable 4, great deal 5) N Mean
§ Organizing by value stream reduces the heterogeneity of resource use (within each value stream) that ABC is designed to address.
§ ABC systems are complex and expensive to maintain. They don’t focus on overall value stream performance.
§ Facilities with extensive use of VSC will not use ABC.
10/16/13
11
21
Value Stream Costing and Activity-Based Costing
Use of ABC > Low Medium High High
Medium Low
Use of VSC ^
§ We compared mean values of our organization, culture, performance measurement, and action (manufacturing, top management support & accounting system change) as well as mean values for improvement, across levels of VSC & ABC.
22
Value Stream Costing and Activity-Based Costing VSC
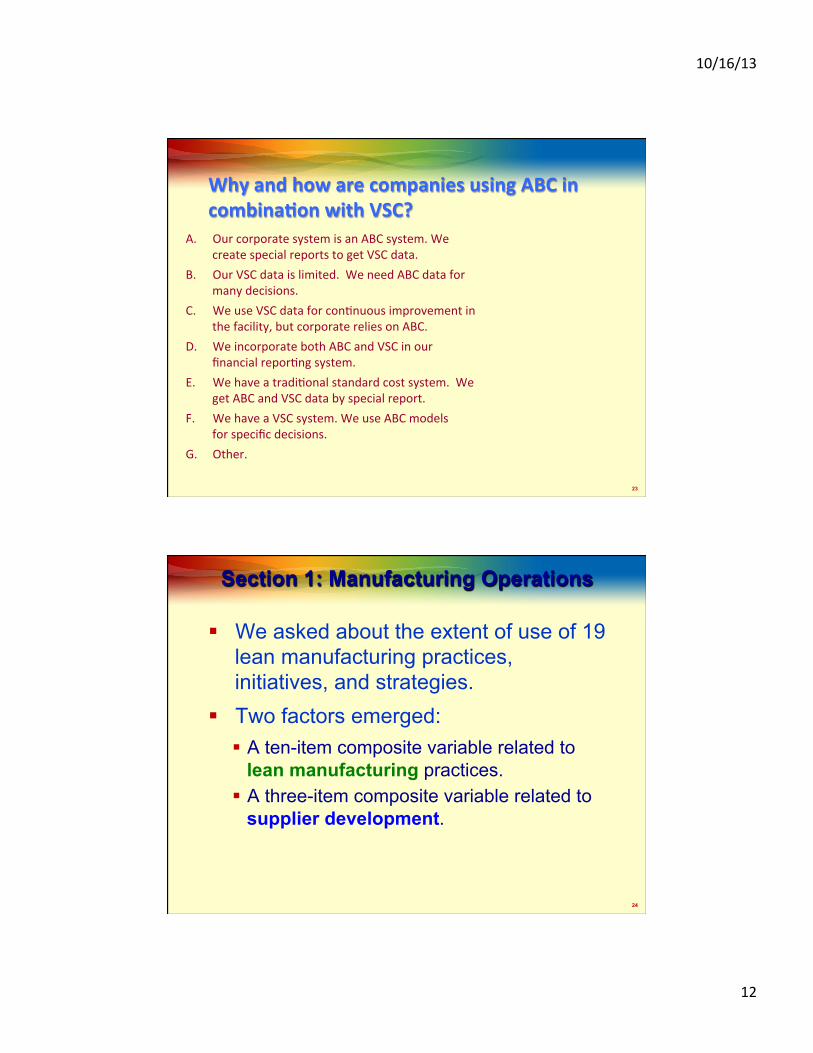
Why and how are companies using ABC in combina8on with VSC?
A. Our corporate system is an ABC system. We create special reports to get VSC data.
B. Our VSC data is limited. We need ABC data for many decisions.
C. We use VSC data for con/nuous improvement in the facility, but corporate relies on ABC.
D. We incorporate both ABC and VSC in our financial repor/ng system.
E. We have a tradi/onal standard cost system. We get ABC and VSC data by special report.
F. We have a VSC system. We use ABC models for specific decisions.
G. Other.
24
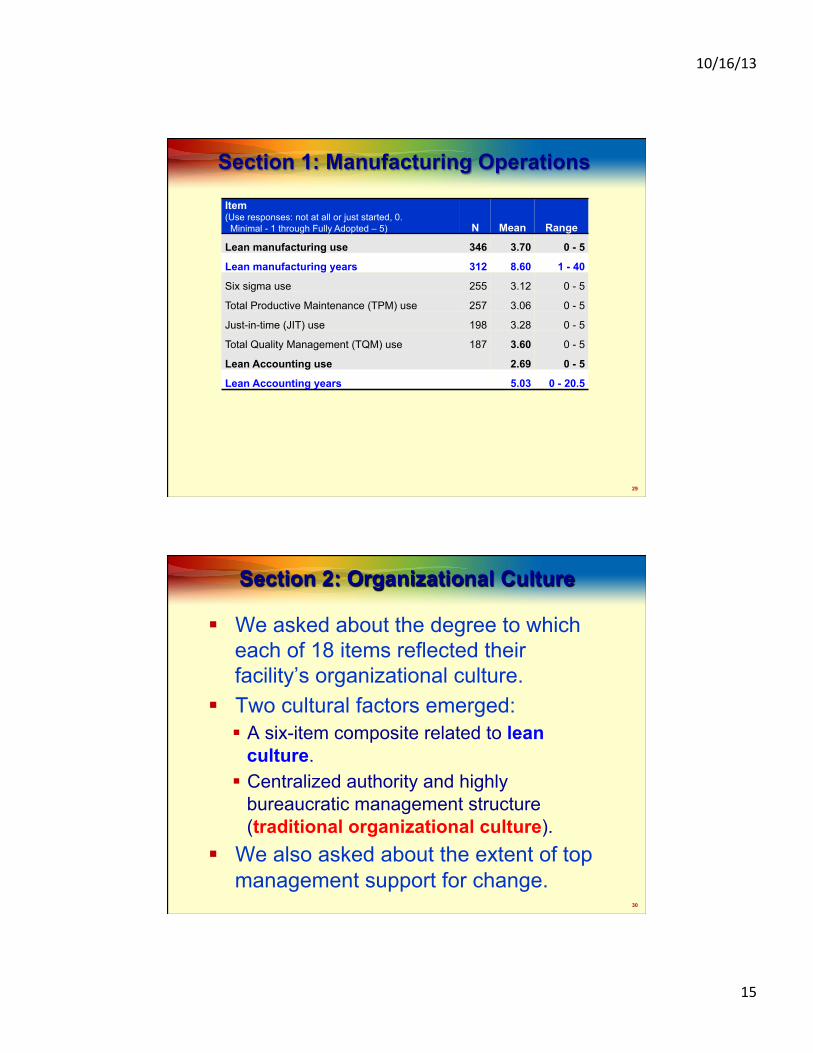
Section 1: Manufacturing Operations
§ We asked about the extent of use of 19 lean manufacturing practices, initiatives, and strategies.
§ Two factors emerged: § A ten-item composite variable related to
lean manufacturing practices. § A three-item composite variable related to
supplier development.
10/16/13
13
25
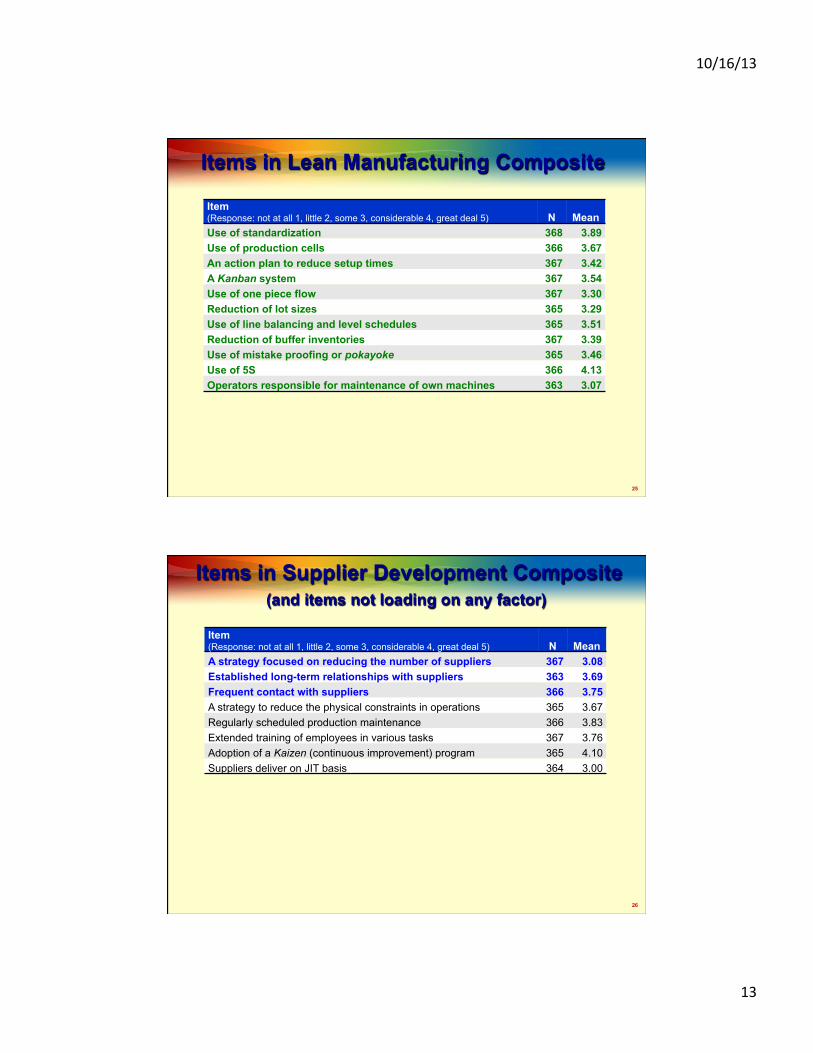
Items in Lean Manufacturing Composite
Item (Response: not at all 1, little 2, some 3, considerable 4, great deal 5) N Mean Use of standardization 368 3.89 Use of production cells 366 3.67 An action plan to reduce setup times 367 3.42 A Kanban system 367 3.54 Use of one piece flow 367 3.30 Reduction of lot sizes 365 3.29 Use of line balancing and level schedules 365 3.51 Reduction of buffer inventories 367 3.39 Use of mistake proofing or pokayoke 365 3.46 Use of 5S 366 4.13 Operators responsible for maintenance of own machines 363 3.07
26
Items in Supplier Development Composite (and items not loading on any factor)
Item (Response: not at all 1, little 2, some 3, considerable 4, great deal 5) N Mean A strategy focused on reducing the number of suppliers 367 3.08 Established long-term relationships with suppliers 363 3.69 Frequent contact with suppliers 366 3.75 A strategy to reduce the physical constraints in operations 365 3.67 Regularly scheduled production maintenance 366 3.83 Extended training of employees in various tasks 367 3.76 Adoption of a Kaizen (continuous improvement) program 365 4.10 Suppliers deliver on JIT basis 364 3.00
10/16/13
14
27
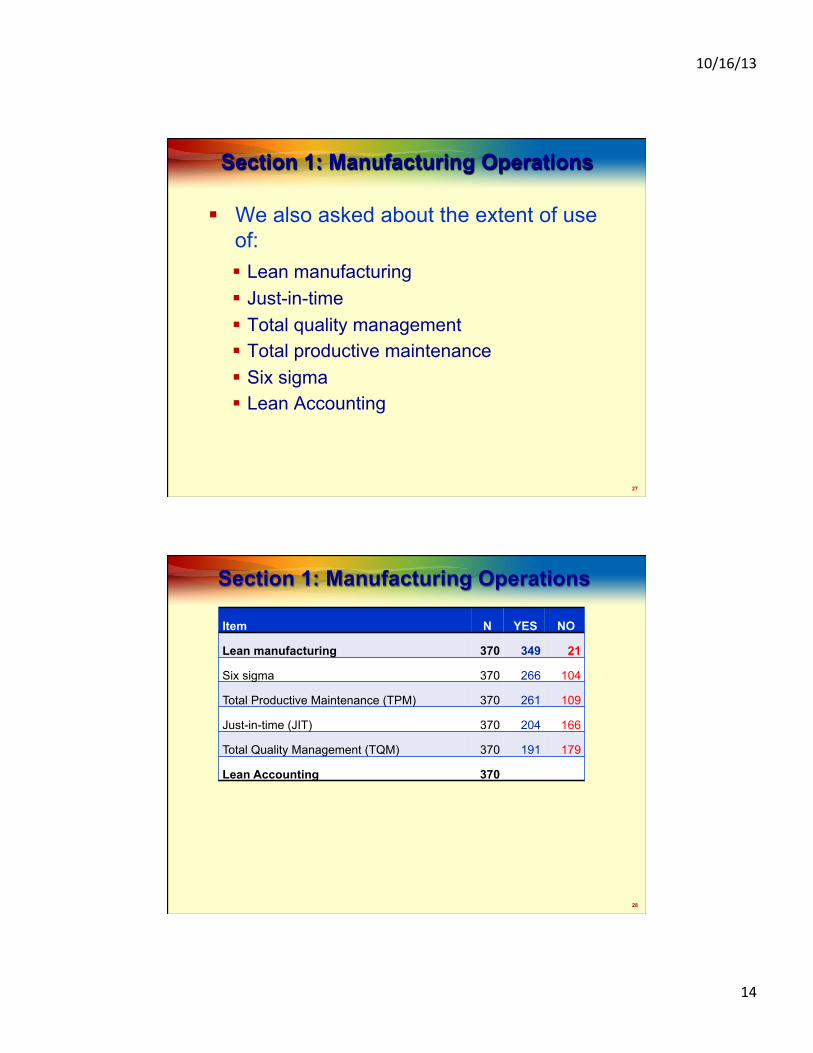
Section 1: Manufacturing Operations
§ We also asked about the extent of use of: § Lean manufacturing § Just-in-time § Total quality management § Total productive maintenance § Six sigma § Lean Accounting
28
Section 1: Manufacturing Operations
Item N YES NO
Lean manufacturing 370 349 21
Six sigma 370 266 104
Total Productive Maintenance (TPM) 370 261 109
Just-in-time (JIT) 370 204 166
Total Quality Management (TQM) 370 191 179
Lean Accounting 370
10/16/13
15
29
Section 1: Manufacturing Operations
Item (Use responses: not at all or just started, 0. Minimal - 1 through Fully Adopted – 5) N Mean Range
Lean manufacturing use 346 3.70 0 - 5
Lean manufacturing years 312 8.60 1 - 40
Six sigma use 255 3.12 0 - 5
Total Productive Maintenance (TPM) use 257 3.06 0 - 5
Just-in-time (JIT) use 198 3.28 0 - 5
Total Quality Management (TQM) use 187 3.60 0 - 5
Lean Accounting use 2.69 0 - 5
Lean Accounting years 5.03 0 - 20.5
30
Section 2: Organizational Culture
§ We asked about the degree to which each of 18 items reflected their facility’s organizational culture.
§ Two cultural factors emerged: § A six-item composite related to lean
§ We also asked about the extent of top management support for change.
10/16/13
16
31
Lean Culture & Traditional Culture Item (1) strongly disagree to (5) strongly agree. N Mean Team members encourage each other to gain additional training 363 3.14
Support areas participate in Kaizen events 365 3.44
Our whole facility is trained in lean principles 364 3.41
Every area of our facility works on cont. improvement 364 3.44
Management is focused on eliminating waste everywhere 366 3.53
Lean thinking has permeated all of our operations 363 3.20
Management structure is highly bureaucratic 364 3.05
Authority is more centralized than decentralized 365 3.25
32
Culture items not loading on either variable Item (1) strongly disagree to (5) strongly agree. N Mean
The majority of our production workers are cross trained 365 3.57
Production workers participate in quality-related decisions 365 3.61
Management is committed to quality-related training 365 3.87
All employees are involved in problem solving 365 3.35
Training resources are readily available 365 3.46
Employees are recognized for superior quality performance 365 3.55
Management style is more participative than autocratic 366 3.51
Responsibility for action items is posted on shop floor 364 3.34
Team members feel peer pressure to perform 363 3.35
Line managers are empowered to make decisions 363 3.72
10/16/13
17
33
Section 3: Performance Measures
§ We asked about the importance of 13 different types of performance measures.
§ Two factors emerged: § Non-financial performance at cell, value
stream and facility levels, and cost of quality (Non-financial performance)
Item (Choices: Not at all, Somewhat, Important, Very Important, Critical) N Mean Non-financial measures related to cell performance 362 3.21 Non-financial measures related to VS performance 362 3.04 Non-financial measures related to facility performance 362 3.21 Cost of quality 363 3.48 Overall financial results 364 4.21 Market share 363 3.45 Cash flow 363 3.74
10/16/13
18
35
Performance Measures not loading on a variable
Item (Choices: Not at all, Somewhat, Important, Very Important, Critical) N Mean Productivity 364 3.95 On-time deliveries 362 4.23 First-pass yields 363 3.54 Cycle time improvements 363 3.42 Customer satisfaction 365 4.22 Inventory turns 365 3.20
36
Section 4: MAS Characteristics
§ We asked about the degree to which each of 26 items related to their management accounting systems.
§ Three MAS factors emerged: § A ten-item visual measures composite
related to gathering and displaying information on the shop floor.
§ A six-item lean accounting processes composite related to system simplification.
§ A six-item traditional accounting composite related to inventory tracking, product cost computation & variances.
10/16/13
19
37
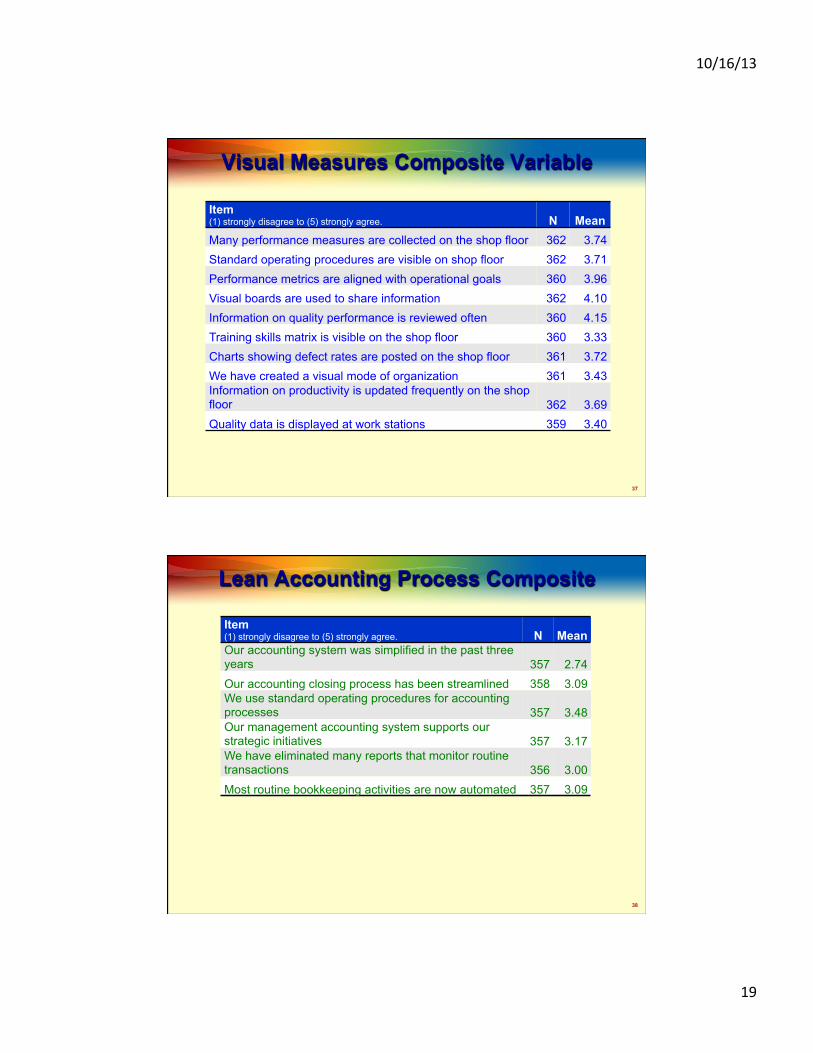
Visual Measures Composite Variable
Item (1) strongly disagree to (5) strongly agree. N Mean Many performance measures are collected on the shop floor 362 3.74 Standard operating procedures are visible on shop floor 362 3.71 Performance metrics are aligned with operational goals 360 3.96 Visual boards are used to share information 362 4.10 Information on quality performance is reviewed often 360 4.15 Training skills matrix is visible on the shop floor 360 3.33 Charts showing defect rates are posted on the shop floor 361 3.72 We have created a visual mode of organization 361 3.43 Information on productivity is updated frequently on the shop floor 362 3.69 Quality data is displayed at work stations 359 3.40
38
Lean Accounting Process Composite
Item (1) strongly disagree to (5) strongly agree. N Mean Our accounting system was simplified in the past three years 357 2.74 Our accounting closing process has been streamlined 358 3.09 We use standard operating procedures for accounting processes 357 3.48 Our management accounting system supports our strategic initiatives 357 3.17 We have eliminated many reports that monitor routine transactions 356 3.00 Most routine bookkeeping activities are now automated 357 3.09
10/16/13
20
39
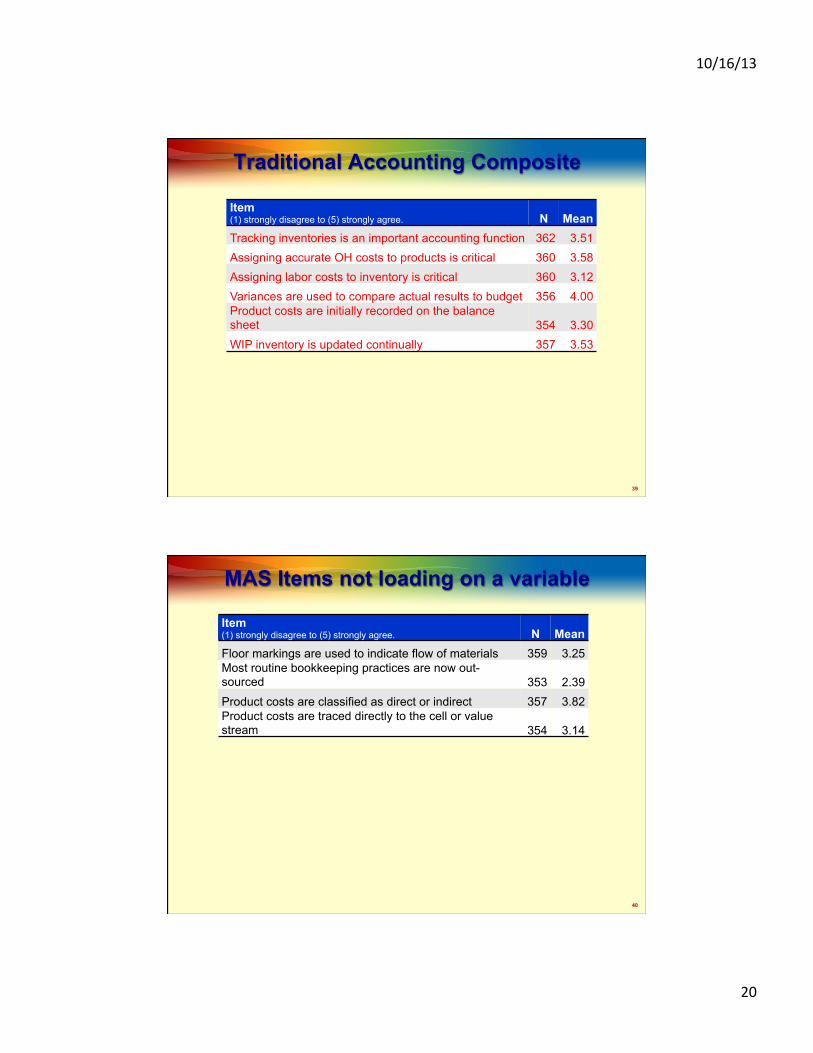
Traditional Accounting Composite
Item (1) strongly disagree to (5) strongly agree. N Mean Tracking inventories is an important accounting function 362 3.51 Assigning accurate OH costs to products is critical 360 3.58 Assigning labor costs to inventory is critical 360 3.12 Variances are used to compare actual results to budget 356 4.00 Product costs are initially recorded on the balance sheet 354 3.30 WIP inventory is updated continually 357 3.53
40
MAS Items not loading on a variable
Item (1) strongly disagree to (5) strongly agree. N Mean Floor markings are used to indicate flow of materials 359 3.25 Most routine bookkeeping practices are now out-sourced 353 2.39 Product costs are classified as direct or indirect 357 3.82 Product costs are traced directly to the cell or value stream 354 3.14
10/16/13
21
41
Improvement as a result of Lean § We asked about improvements realized on 8
dimensions as a result of lean initiatives: Dimension (Choices: Not at all, Little, Some, Considerable, Great deal)
N
Mean
Inventory-related resources have been freed up 366 3.26 Capacity is managed more effectively 366 3.61 Cycle/production time is improved 366 3.74 Quality is improved 367 3.66 Overall communication is improved 365 3.65 The need to monitor transactions is reduced 364 3.05 Costs are reduced 366 3.63 Profitability is improved 366 3.55
42
Which factor do you think had the strongest associa8on with overall improvement from lean ini8a8ves?
A. Lean manufacturing B. Supplier development C. Top management support for change D. Lean culture E. Tradi/onal culture F. Importance of non-‐financial measures G. Importance of financial measures H. Visual measurement system I. Lean accoun/ng processes J. Tradi/onal accoun/ng methods
10/16/13
22
43
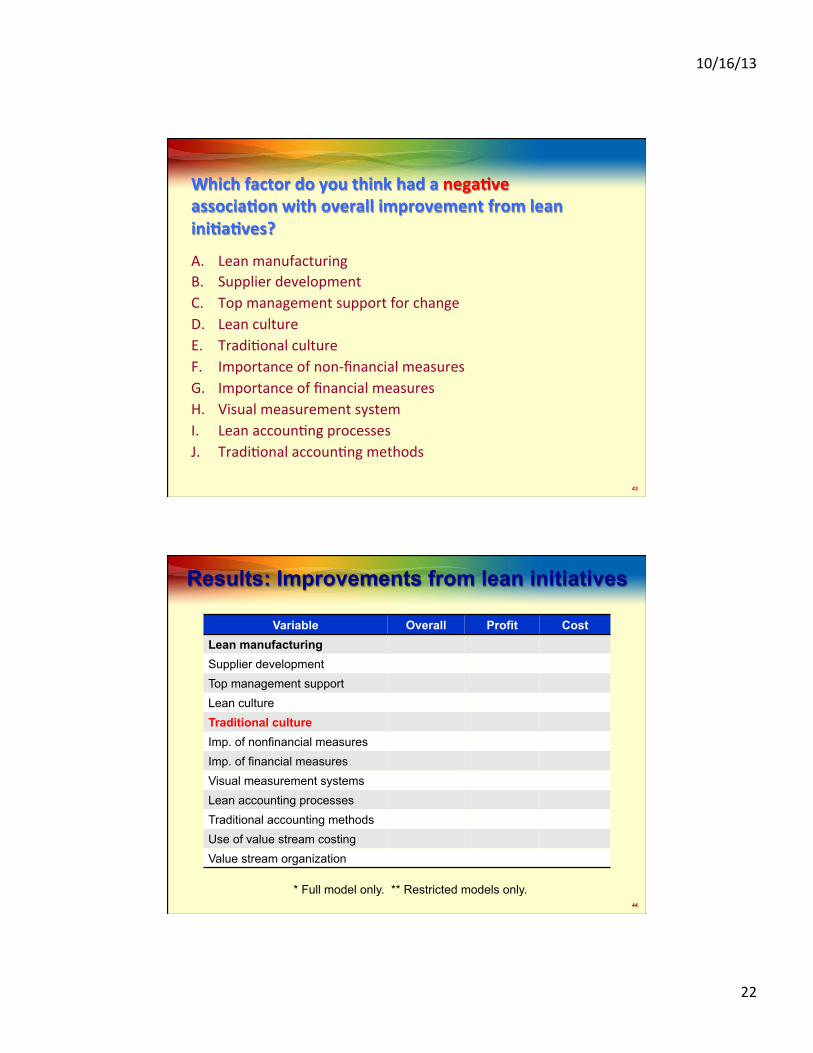
Which factor do you think had a nega8ve associa8on with overall improvement from lean ini8a8ves?
A. Lean manufacturing B. Supplier development C. Top management support for change D. Lean culture E. Tradi/onal culture F. Importance of non-‐financial measures G. Importance of financial measures H. Visual measurement system I. Lean accoun/ng processes J. Tradi/onal accoun/ng methods
44
Results: Improvements from lean initiatives
Variable Overall Profit Cost Lean manufacturing Supplier development Top management support Lean culture Traditional culture Imp. of nonfinancial measures Imp. of financial measures Visual measurement systems Lean accounting processes Traditional accounting methods Use of value stream costing Value stream organization
* Full model only. ** Restricted models only.
10/16/13
23
45
Some Conclusions
§
46
Want to learn more? Do you have more you’d like to share with us?
§ To ask more questions about the study, or … § for a copy of the preliminary report, or… § to provide us with further reflections or
comments, or… § to invite us to come see your facility,