108
Achieving Process Excellence Through Water Effciency www.epa.gov/lean LEAN & WATER TOOLKIT

Achieving Process Excellence Through Water Efficiency
wwwepagovlean
LEAN amp WATER TOOLKIT
How to Use This Toolkit This toolkit uses icons in the page margins to help you find and follow important information in each chapter
Identifies an important point to remember
Defines an important term or concept
Presents a technique or resource that helps capture communicate or apply new knowledge
Chapters also include one or more ldquoTo Considerrdquo text boxes that contain questions to help you explore how the information relates to your organization
This is one of a series of Lean and Environment publications from the US Environmental Protection Agency For more infor-mation visit the EPA Lean website at wwwepagovlean
Lean and Water Toolkit
AcknowledgmentsThe US Environmental Protection Agency (EPA) is grateful for the valuable assistance of the orga-nizations and individuals who helped develop this toolkit and who shared experiences tools and techniques for integrating Lean manufacturing and water efficiency EPArsquos Office of Policy sponsored and led the development of this toolkit while EPArsquos Office of Water provided considerable input
This toolkit has benefited from the collective expertise and ideas of many individuals In particular EPA would like to thank the following individuals for their thoughtful contributions
Michael Abouezzi Senior Director Lean Six Sigma and Total Productive Maintenance PepsiCo
Barruch Ben-Zekry Manager of Environmental Sustainability for Operations Levi Strauss amp Co
Scott Butler Vice President of Operations and Technical Services Del Monte Foods
Lynn Coleman Environmental Engineer Hazardous Waste and Toxics Reduction ProgramWashington State Department of Ecology
Rob Currie Director Environment Health and Safety Baxter International
Michelle Gaither Technical Research Lead Pacific Northwest Pollution Prevention Resource Center
Amy Goldman Director Global Environmental Management Initiative
Reza Hosseini Manager of Environmental Site and Compliance Assessment Levi Strauss amp Co
Bruce Karas Director Sustainability Environmental and Safety Coca-Cola North America
Deborah Kennedy Senior Principal Engineer Resource Conservation PepsiCo
Robert ter Kuile Senior Director Environmental Sustainability Global Public Policy PepsiCo
Jessica McGlyn Director World Business Council for Sustainable Development US Inc
Rob Meyers Director Environmental Sustainability Global Operations PepsiCo
John Radtke Water Resource Manager Coca-Cola North America
Jason Schulist Director of Program Office DTE Energy
Mike Sklar Continuous Improvement Manager DTE Energy
Charles Souders Manager Environmental Compliance Johnson amp JohnsonMcNeil Consumer Healthcare
David Walker Senior Director Environmental Sustainability PepsiCo
This toolkit was prepared for EPA by Ross amp Associates Environmental Consulting Ltd (wwwross-assoccom) in association with Industrial Economics Inc (EPA Contract EP-W-10-002)
Lean and Water Toolkit
Lean and Water Toolkit
Table of ContentsExecutive Summaryi
Preface iv
Chapter 1 Introduction 1
Importance of Water to Industry 1
Benefits of Addressing Water with Lean 2
Getting Started with Lean and Water 6
Chapter 2 Water Use and Water Waste at Industrial Facilities11
Definition of Water Waste 11
Industrial Water Use12
Water End Uses How Water Is Used at Facilities15
Measuring Facility Water Use Metering and Submetering17
Costs of Water Waste 20
Chapter 3 Finding Water Waste on the Factory Floor 25
Water Gemba Walks 25
Developing a Water Balance 28
Water Waste and Value Stream Mapping33
Root Cause Analysis 38
Chapter 4 Lean and Water Efficiency Improvement Strategies 41
Kaizen Events and Just-Do-Its to Reduce Water Use41
Integrate Water Efficiency into Everyday Lean Practices 45
Lean and Water Applications for Facility Operations and Support Processes50
Chapter 5 Lean and Water Beyond the Factory Floor 53
Lean and Water Efforts in Your Supply Chain 53
Engaging with the Community 58
Lean Product Design61
Chapter 6 Conclusion 67
Your Lean and Water Journey67
Concluding Thoughts 68
Appendices 69Appendix A Water Efficiency Resources and Technical Assistance Providers 69
Appendix B Water Cost Calculator76
Appendix C Water Unit Conversions and Calculations 79
Appendix D Water Efficiency Opportunity Checklist85
Appendix E Glossary of Water Terms88
Lean and Water Toolkit
Boxes Key Benefits of Addressing Water with Lean (Box 1) 2
Example Results From Lean and Water Efforts (Box 2) 3
Learning to See Water Waste and Costs (Box 3) 4
Types of Water-Related Business Risks (Box 4)5
Water Metrics (Box 5) 7
Water-Intensive Industries (Box 6)12
Common Costs Associated with Water Use (Box 7) 21
Steps to Take During a Gemba Walk (Box 8)26
Examples of Water Gemba Walk Success (Box 9)28
Information to Collect for a Water Balance (Box 10)32
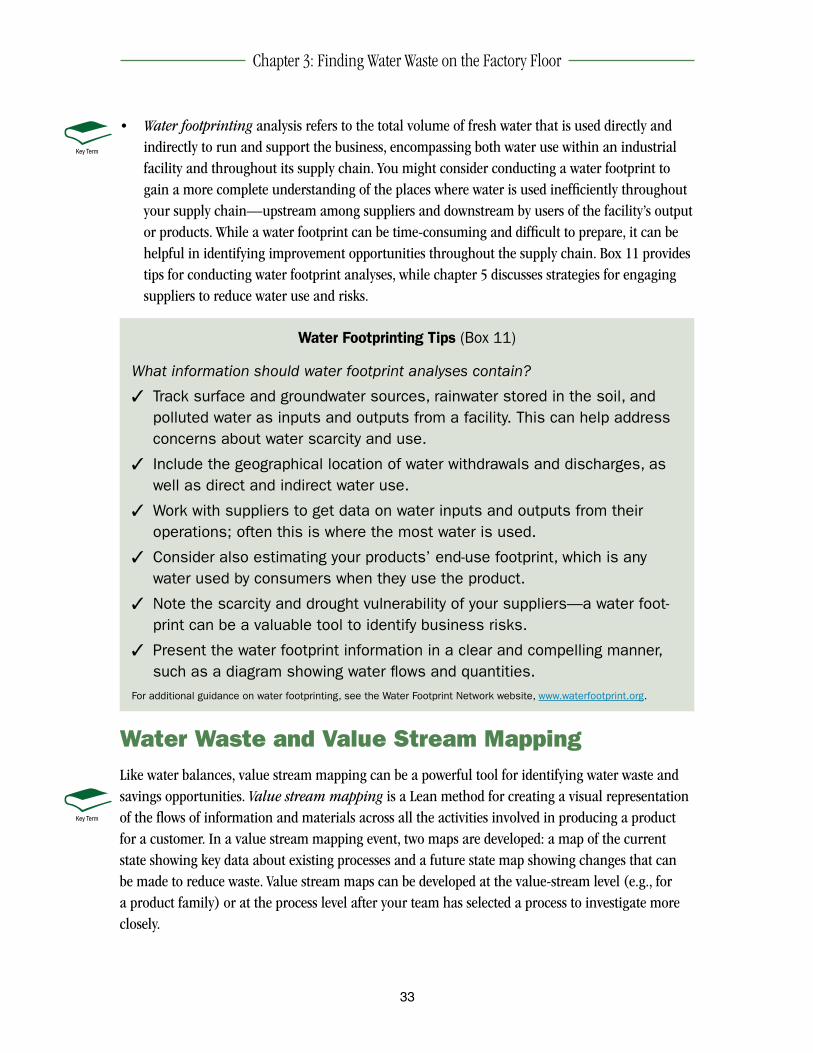
Water Footprinting Tips (Box 11)33
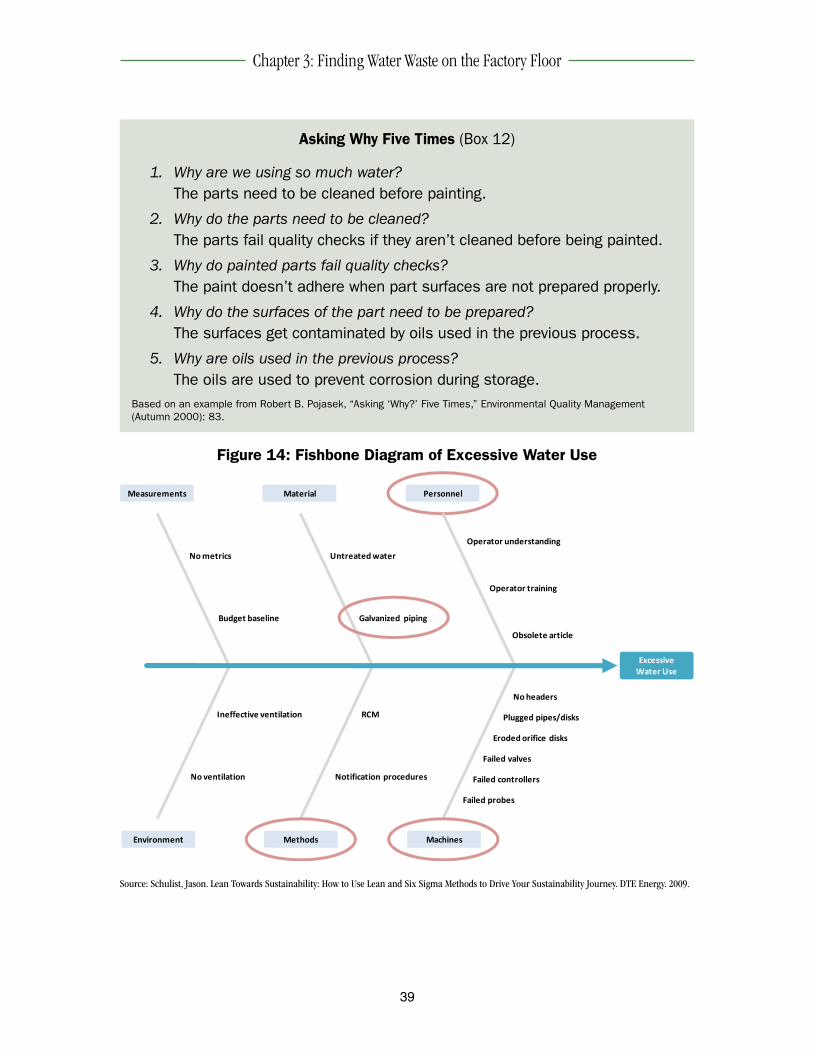
Asking Why Five Times (Box 12)39
Key Water-Efficiency Questions (Box 13)41
Water Kaizen Event Examples (Box 14)42
Waterless Cleaning of Gatoradereg Bottles (Box 15) 44
Frito-Lay Engaging Employees in Water Efficiency (Box 16)46
Water-Efficient Cleaning Strategies (Box 17)49
Proactive Maintenance Tips to Reduce Water Use (Box 18)50
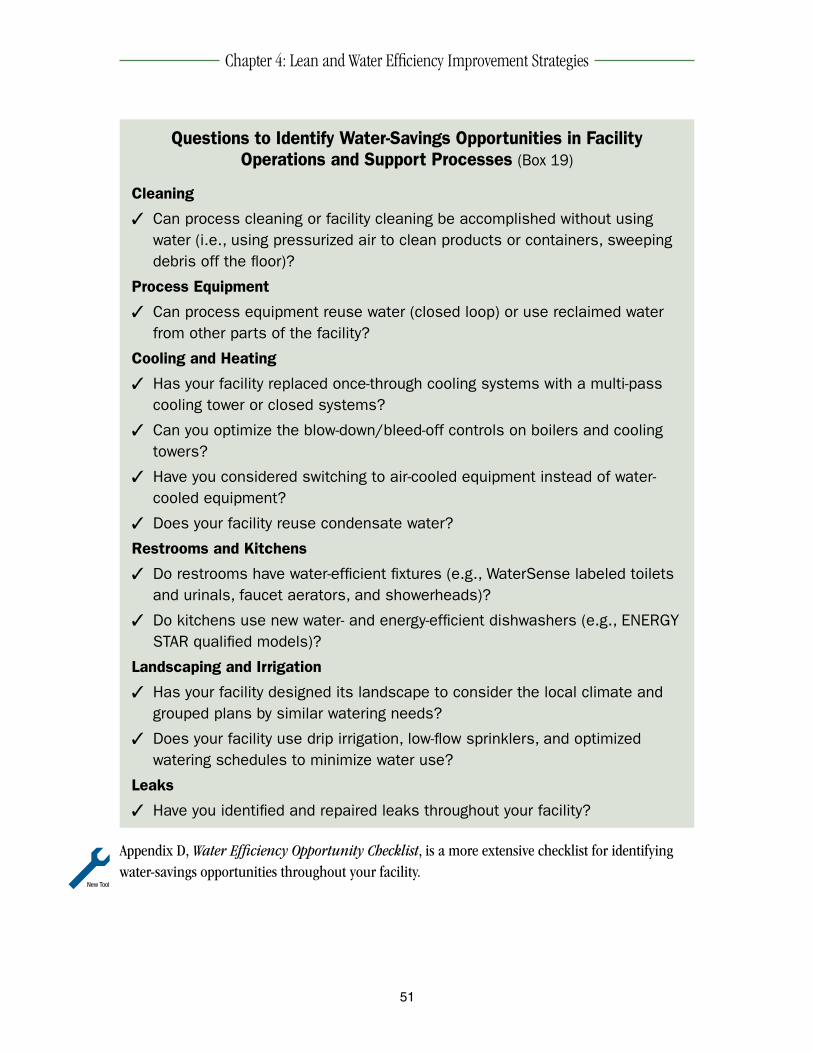
Questions to Identify Water-Savings Opportunitiesin Facility Operations and Support Processes (Box 19) 51
Dubois Chemical and Steelcase An Innovative Lean Water Supplier Partnership (Box 20) 54
Green Suppliers Network Lean and Water Successes (Box 21) 55
Levi Strauss amp Co and the Better Cotton Initiative (Box 22) 58
PepsiCorsquos Positive Water Balance Project in India (Box 23) 59
Examples of Water Conservation through Product Design (Box 24)64
Figures Figure 1 Impact-Difficulty Matrix 8
Figure 2 Lean and Water Implementation Strategies 10
Figure 3 Water Scarcity Map of the World13
Figure 4 Breakdown of Water Uses in Two Industries 16
Figure 5 Example Water End Uses at an Industrial Facility 17
Figure 6 Portable Water Meter18
Figure 7 Costs Associated with Water Use20
Figure 8 Typical Water Balance Calculation 29
Figure 9 Simplified Elements of a Water Balance30
Figure 10 Adding Water Use to Value Stream Map Process Box 34
Figure 11 Value Stream Map Incorporating Water Use Metrics35
Figure 12 Process Boxes Showing Water Waste36
Lean and Water Toolkit
Figure 13 Water Inputs and Outputs Identified on a Value Stream Map 37
Figure 14 Fishbone Diagram of Excessive Water Use 39
Figure 15 Five Water-Savings Strategies43
Figure 16 Sign to Encourage Water Conservation 45
Figure 17 Dual Flush Toilet Visual Control 47
Figure 18 Six Pillars of 6S (5S + Safety)48
Tables Table 1 Typical Water Use Per Ton of Product 14
Table 2 High-Impact Water Use Sectors 14
Table 3 Costs Associated with Water Used in an Industrial Process 22
Table 4 Key Areas to Check During a Water Gemba Walk 27
Table 5 Example Water Balance Summary 31
Table 6 Table for Evaluating Water Reuse Potential44
Table 7 Methods Used in Lean Design62
Table 8 Questions to Ask During Lean Product Design 63
Lean and Water Toolkit
Lean and Water Toolkit
Acronyms and Abbreviations 3P Production Preparation Process or Pre-Production Planning
5S Sort Set in order Shine Standardize Sustain
BMP Best management practice
CO Changeover time
CT Cycle time
E3 Economy Energy and Environment
EHS Environmental Health and Safety
EPA Environmental Protection Agency
GEMI Global Environmental Management Institute
gpf Gallons per flush
gpm Gallons per minute
LEED Leadership in Energy and Environmental Design
MEP Manufacturing Extension Partnership
NIST National Institute of Standards and Technology
psi Pounds per square inch
TPM Total Productive Maintenance
Lean and Water Toolkit
i
Executive Summary
Executive SummaryThis Lean and Water Toolkit describes practical strategies for using Lean manufacturingmdashthe production system developed by Toyotamdashto reduce water use while improving operational per-formance Drawing from the experiences and best practices of multiple industry and government partners this toolkit explores opportunities to identify and eliminate ldquowater wasterdquo including
bull Water losses and leaks
bull Non-value added or inefficient use of water
bull Missed opportunities to reuse water
bull Wastewater discharges
bull Unnecessary water use and risks throughout the supply chain
bull Missed opportunities to address customersrsquo water-efficiency goals
This toolkit is a supplement to EPArsquos Lean and Environment Toolkit (wwwepagovleantoolkit) which addresses all types of environmental wastes and improvement opportunities
Why Address Water Using Lean Companies recognize water use and availability as a critical business concern While direct water costs may be low many indirect costs associated with water use can make the full cost of water substantial Community concerns about water and the risk of water supply disruptions can increase pressures on companies to reduce water use Incorporating water use reduction into Lean initiatives provides an efficient and effective means to
1 Uncover cost savings and operational improvements
2 Reduce water-related business risks
3 Deliver value for customers and employees
Facilities already using Lean can often easily incorporate water considerations into value stream maps and other Lean efforts At the same time facilities conducting water efficiency initiatives may find that Lean tools provide a powerful means to drive effective implementation and results Con-necting Lean and water efforts can engage employees in powerful and rewarding ways that build capacity and momentum to solve problems and create value
Understand Water Uses and Costs The toolkit discusses common water end uses in industrial and manufacturing facilities and discuss-es costs associated with water use Costs of water include not only the cost of purchasing water but also costs associated with treatment heating conveyance and regulatory compliance Metering and sub-metering are important tools for understanding actual water use within a facility and tracking it over time
ii
Executive Summary
Find Water Waste The toolkit discusses several techniques to find water waste and opportunities at your facility in-cluding
bull Water Gemba Walks Have a team walk the factory floor together to observe and inventory inefficiencies related to water use
bull Water Balance Develop a diagram of your facilityrsquos water use that shows and quantifies the flows of water into and out of each process or operation in the facility
bull Value Stream Mapping Add information on water use andor costs to Lean value stream maps to help identify water waste and develop implementation plans for Lean and water efficiency improvement efforts
bull Root Cause Analysis Use root cause analysis methods to explore the underlying causes of water waste and inform improvements
Improve Operations and Processes with Lean and Water Strategies Solutions to reduce water waste can be identified during Lean events and in daily implementation of Lean principles and tools The toolkit discusses facility operations and support functions in which there may be specific improvement opportunities Strategies include
bull Waste Elimination Culture Encourage employees to identify water waste throughout their daily activities and create a culture in which they are empowered to continually im-prove the way your facility uses water
bull Kaizen Events and Just-Do-Its Pursue opportunities to address water waste during Lean kaizen events Consider focusing kaizen events specifically on water waste or water-intensive processes Also find quick opportunities for individuals to immediately improve a process or operation in just-do-it projects
bull Standard Work Embed water use management and efficiency tasks into standard operat-ing procedures to engage all employees in proactive water-efficiency activities
bull Visual Controls Use signs and visual controls to reinforce water waste reduction practices and standard work Clearly display information on water use and costs to raise awareness
bull 5S Incorporate water management and waste reduction activities into 5S housekeeping activities such as cleaning and inspections to engage all employees in identifying and eliminating water waste
bull Total Productive Maintenance Enable teams of workers to quickly identify and correct problems fix leaks and improve water efficiency while optimizing the effectiveness of your manufacturing equipment
iii
Executive Summary
These Lean tools can be used at a facility in concert with water-efficient best management practices (BMPs) that are often available from industry associations and government agencies1 Industrial facilities can target their efforts to the most effective solutions using these technology and process-based improvements
Extend Lean and Water Efforts throughout the Value Chain Looking beyond facility operations can allow you to uncover new ways to reduce water use and risks while adding value and improving business operating conditions and market opportunities Strategies include
bull Supply Chain Initiatives Work with your suppliers to improve understanding of water use costs and risks Provide incentives and technical support to help suppliers identify and eliminate water waste Collaborate with supply chain partners to address water-related op-portunities through joint Lean events and other initiatives
bull Engage Local Communities Educate and engage your employees in water-efficiency efforts at your facility and encourage them to adopt similar practices at home Partner with community members and local organizations to conduct projects or Lean events that improve water use andor quality in the community
bull Product Design Incorporate water efficiency and reuse as design criteria into Lean prod-uct and process design methods as a powerful means of reducing the water use of products throughout their lifecycle
Starting Your Lean and Water Journey There are many ways to get started with identifying and reducing water waste and improving busi-ness results using Lean Consider using the strategies and techniques in this toolkit to help you
1 Learn more about how your facility uses water
2 Engage employees in Lean and water improvement efforts
3 Connect Lean and water efforts to sustainable water management strategies
We hope the strategies and tools in this toolkit will help you on your Lean and water journeymdashen-abling you to reduce water waste and costs improve processes and foster positive relations with your customers and community
1 Appendix A provides information on water efficiency resources and technical assistance providers that offer helpful information on BMPs Also consider contacting your local water utility or the industry or trade association in your sector to inquire about water-related BMPs and resources
iv
Preface
Preface
Purpose of This ToolkitThe Lean and Water Toolkit offers Lean implementers practical strategies and techniques for improving common Lean results related to time cost and quality while also reducing water use costs and risk Environmental Health and Safety professionals will also find useful infor-mation in this toolkit for how to leverage Lean and Six Sigma business improvement methods to eliminate water waste Finally the toolkit introduces Lean practitioners to the wide array of water efficiency resources available from EPA and other organizations
The ldquoLeanrdquo methods discussed in this toolkit are organizational improvement methods pioneered in the Toyota Production System Lean production and Lean manufacturing refer to a customer-focused business model and collection of methods that focus on the elimination of waste (non-value added activity) while delivering quality products on time and at a low cost Six Sigma is a business model that focuses on improving quality by eliminating variation it is often combined with Lean The toolkit assumes that you are familiar with Lean methods For those who want to learn more about Lean see EPArsquos Lean and Environment website (wwwepagovlean)
Key Questions Addressed by This Toolkit Lean works well when it focuses on identifying and eliminating waste This toolkit contains strate-gies and techniques that can enable Lean practitioners to easily identify water waste and improve-ment opportunities alongside the myriad other wastes and improvement opportunities uncovered by Lean To accomplish this the toolkit aims to answer the following questions
What is water waste Water is required in substantial quantities to produce goods from food products to silicon chips Water waste is water that is used beyond the point at which it ceases to add value to the customer Excess water use often leads to wastewater which can harm human health and the environment through the pollutants it collects and overdrawing water resources in certain regions can exacer-bate water scarcity concerns Water can be wasted in the supply chain through facility operations and in product use and disposal This toolkit will help you to recognize water waste so that you can work to reduce it
Why should you address water waste with Lean Substantial water savings can ride the coattails of Lean improvement By eliminating manufactur-ing wastes such as unnecessary processing and cleaning businesses also reduce the water and associated labor and energy costs needed for cleaning conveyance cooling and heating Chapter 1 describes benefits of combining Lean and water efficiency efforts and discusses how to get started Chapter 2 provides an overview of industrial water use including information on water uses water metering and water costs
v
Preface
How do you know how much and where water is used in your facility A key step in effective Lean and water efforts is determining where to target water efficiency im-provement activities Chapter 3 discusses techniques for measuring water use and identifying op-portunities to reduce water use in the context of Lean Methods include gemba walks water balance value stream mapping and root cause analysis
How can you reduce water use with Lean methods Chapter 4 examines specific opportunities for using Lean methods to improve water efficiency including kaizen events standard work visual controls 5S and total productive maintenance These strategies present ways that you can integrate water efficiency principles and practices into the practical implementation-based tools of Lean manufacturing and the waste-elimination culture fostered by Lean
How can you use Lean to pursue water efficiency opportunities beyond your facilityrsquos operations For many companies water costs and risks may be driven by factors and activities beyond the facility fence-line Similarly opportunities to capture market value and win customers may require considerations upstream to manufacturing activities Chapter 5 explores strategies to leverage Lean initiatives and methods to reduce water risks in your supply chain and to engage the local commu-nity in water saving initiatives Chapter 5 also discusses how Lean product design methods can be used to improve water efficiency and add value by addressing customer water needs
Lean and Water Toolkit
1
CHAPTER 1
Introduction
Water is a crucial resource for the world economy Lean provides a framework in which organiza-tions can address water waste while saving costs reducing risks and adding customer value This chapter includes the following sections
bull Importance of Water to Industry bull Benefits of Addressing Water with Lean bull Getting Started with Lean and Water
Importance of Water to Industry Companies worldwide identify water issues as a critical business concern Water is essential for a range of industrial processes and support functions facility operations and as an ingredient for many products Water use is increasing much faster ldquoI am convinced that under present than population growth and regional and seasonal conditions and with the way water is differences in water availability can lead to short- being managed we will run out of ages and even water-related conflicts The World water long before we run out of fuelrdquo Economic Forum reports that 44 percent (28 billion) of people currently live in areas of the Peter Brabeck-Letmathe Chairman
world that are water stressed and if present trends Nestle Corporation
continue water scarcity will affect the livelihood of Source ldquoA water warning Peter Brabeck-Letmathe chairman of Nestleacute argues that water shortage is an even more urgent problem than climate changerdquo The Economist November 19 2008one-third of the worldrsquos population by 20252 wwweconomistcomnode12494630
Corporations are recognizing the important role they play in addressing water resource chal-lenges and companies are responding by engaging in efforts to measure report and reduce their water use In a survey conducted by the Carbon Disclosure Project of 302 of the worldrsquos largest 500 companies 89 percent of responding companies had developed specific water policies strategies and plans and 67 percent indicated that responsibility for water-related issues lies at the Board or Executive Committee level3 The United Nationsrsquo CEO Water Mandate launched in 2007 is designed to help companies develop implement and report on water sustainability policies and practices Industry-led associations such as the World Business Council for Sustainable Development and the Global Environmental Management Initiative also have major water initiatives
One key reason why companies choose to use water more efficiently is to improve their relationship with the communities that surround industrial facilities Water use is of paramount importance to a facilityrsquos relationship with its surrounding community Facilities that use less water in drought-
2 World Economic Forum ldquoThe Bubble Is Close to Bursting A Forecast of the Main Economic and Geopolitical Water Issues Likely to Arise in the World during the Next Two Decadesrdquo Draft Report for Discussion at World Economic Forum
3 Carbon Disclosure Project ldquoCDP Water Disclosure 2010 Global Reportrdquo available at wwwcdprojectnetCDPResultsCDP-2010-Water-Disclosure-Global-Reportpdf
2
Chapter 1 Introduction
prone areas leave more water available for residential use Some companies even risk being forced to withdraw from regions where water is a scarce resource a problem that is likely to recur as water scarcity increases in many regions around the globe In some cases communities around industrial facilities show much greater concern for the amount of water a facility uses than the amount of energy it uses
This toolkit provides strategies and tools for addressing water issues within the context of Lean manufacturing and other business process improvement methods
Benefits of Addressing Water with Lean Lean provides powerful tools for delivering value to customers in a manner that minimizes waste and risks from unnecessary water use Explicit consideration of water waste during Lean imple-mentation can create significant value for an organization helping to deliver quality products and services that customers want when they want them Research sponsored by EPA and others shows that some water use and waste reduction benefits typically ride the coattails of Lean efforts yet other opportunities to reduce wastes risks and non-value added activity associated with water may be overlooked There are three key benefits of addressing water with Lean as listed in Box 1 and further described below
Key Benefits of Addressing Water with Lean (Box 1)
1 Uncover cost savings and operational improvements
2 Reduce water-related business risks
3 Deliver value for customers and employee
Uncover Cost Savings and Operational Improvements Learning to see and eliminate waste is a cornerstone of Lean initiatives Water waste is often a sign of inefficient production and non-value added activity and it frequently indicates opportuni-ties for saving costs and time Lean and water strategies can help you to uncover cost savings and improvements in areas of your facilityrsquos operations that may not have received as much attention in your Lean efforts For production processes that are highly dependent on water or that have water-intensive support processes such as wastewater treatment the operational and environmental benefits from Lean and water efforts are even more significant
Learning to see water and other environmental waste during Lean efforts can reveal significant business improvement opportunities further strengthen Lean results and improve environmental performance Box 2 provides several examples of how companies have used Lean and Six Sigma methods to reduce water use save costs and improve their performance
3
Chapter 1 Introduction
Example Results From Lean and Water Efforts (Box 2)
3 IBM used Six Sigma tools to reduce water consumption and operating costs in wafer fabrication processes saving $3 million annually reducing water usage by 27 percent and increasing production by over 30 percent
3 GE combined high-tech water metering and other water efficiency prac-tices with its kaizen improvement methodology resulting in a 30 percent drop in water use since 2006
3 DTE Energy saved 20 million cubic feet of water (79 percent) and $700000 annually in a Lean Six Sigma project examining electric substa-tion water use
Sources IBM ldquoGreen Sigma Overviewrdquo Presentation to EPA June 2009 GE info cited in Carbon Disclosure Project ldquoCDP Water Disclosure 2010 Global Reportrdquo page 25 available at wwwcdprojectnetCDPResultsCDP-2010-Water-Disclosure-Global-Reportpdf and Jason Schulist DTE Energy ldquoLean Towards Sustainability How to Use Lean and Six Sigma Methods to Drive Your Sustainability Journeyrdquo Presentation at Green Six Sigma Conference May 19 2009
While many places have very low direct costs for water and wastewater there are also indirect costs to water use These costs can be significant yet they are often hidden in overhead or support cost centers (see Box 3 for examples of how facilities have uncovered water waste and costs) Examples of water costs include
bull Raw Material Costs Costs of measures to ensure that purchased water supply is of suf-ficient quality for use at a facility For example some facilities may bear costs for labor equipment and materials needed to improve water quality before use (eg when water is a key product ingredient) as well as for chemicals and other raw materials needed to treat and manage water at the facility and before discharging it Water treatment costs associated with deionized water and reverse osmosis can be substantial
bull Energy Costs for the energy required to heat and cool water pump or transfer water operate water-consuming equipment treat water and wastewater and other functions
bull Pollution Control Wastewater service costs paid to a utility andor industrial pretreat-ment costs for the energy labor materials equipment and chemicals needed to treat wastewater before discharging it from the facility
bull Regulatory Compliance Costs for regulatory compliance activities such as completing permit applications and tracking and reporting wastewater discharges to regulatory agencies In the United States industrial municipal and other facilities must obtain National Pollutant Discharge Elimination System permits if the facilities discharge water pollutants directly into US waters Pretreatment regulations govern industrial facilities that discharge into municipal sewer systems Also in some food and consumer product industries water use may be important to address Food and Drug Administra-tion sanitation requirements
4
Chapter 1 Introduction
Lean and water strategies such as those outlined in this toolkit help to reveal these costs and identify process improvement solutions The next chapter provides more information about water end uses and costs
Learning to See Water Waste and Costs (Box 3)
3A wood products company began metering water into two parallel process units and discovered one was using significantly more water than the other After some investigation the company identified and implemented mainte-nance practices that would substantially lower water use while also prevent-ing equipment failure and downtime
3A food processing company regarded the water supply from its groundwater well as essentially free While completing a facility water balance it me-tered the amount of hot water used for one process step Once the com-pany realized it was heating 25 gallons per minute of ground water from 55 degrees to boiling it began to think of opportunities to reduce and reuse the energy in the hot water rather than sending it down the drain
3A small high tech silicon wafer company was paying its city water utility $120 per hundred cubic feet of water After calculating the cost of pre-treating its process water and adding wastewater treatment and discharge expenses the company realized that the full cost of water was five times the initial cost of purchasing water These insights led the company to reuse rinse water in the process reducing total water use and demand for ultra pure water without affecting product quality
Reduce Water-Related Business Risks Lean provides an effective platform for reducing facility water use and the associated water-related business risks While the specific risks that individual facilities face vary examples of water-related risks include water shortages and reliability issues water quality issues that drive the need for additional water treatment increasing water costs and supply chain interruptions In some water-scarce regions there may be challenges with meeting basic human needs for clean water and sani-tation competition for scarce water resources may be intense between uses associated with public water supply agriculture industry and fisheries Climate change is predicted to exacerbate many of these water risksmdashincreasing global temperatures will likely lead to increases in water de-mand water scarcity more vulnerable ecosystems and more frequent extreme weather events4
How companies respond to water risks can also have important implications for how local commu-nities and customers perceive those companies 4 For more information on water and climate change see CERES and Pacific Institute ldquoWater Scarcity amp Climate Change Grow-
ing Risks for Businesses amp Investorsrdquo February 2009 available at wwwpacinstorgreportsbusiness_water_climatefull_report pdf For a discussion of business perspectives on the connections between water energy and climate change see World Business Council for Sustainable Development ldquoWater Energy and Climate Change A Contribution from the Business Communityrdquo March 2009 available at wwwwbcsdorg
5
Chapter 1 Introduction
Types of Water-Related Business Risks (Box 4)
Companies face a variety of risks related to water security including
3Business Interruption Risks that the supply of water may be disrupted in the supply chain production andor product use
3Reputation Risks related to public scrutiny of how companies respond to water resource challenges and engage with communities stakeholders and employees
3Regulatory Risks of increased government regulations or restrictions on water use and water pollution as well as the associated costs to respond to the requirements
3Access to Capital Risks of financial institutions adopting stricter lending and investment policies based on water uncertainties
Source World Economic Forum ldquoThe Bubble Is Close to Bursting A Forecast of the Main Economic and Geopolitical Water Issues Likely to Arise in the World during the Next Two Decadesrdquo Draft Report for Discussion at World Econom-ic Forum Annual Meeting 2009 January 2009 page 39 www3weforumorgdocsWEF_ManagingFutureWater20 Needs_DiscussionDocument_2009pdf
Reducing non-value added water use is a key strategy for mitigating water risks Integrated Lean and water strategies offer practical solutions that support multiple business objectives such as increased efficiency reduced costs improved customer responsiveness and decreased water and energy use By engaging employees in teams to identify and eliminate sources of water waste in your facilitymdashalongside other production wastes such as over processing defects and delays your facility can proactively reduce water risks while also supporting operational goals Proactively en-gaging with local utilities and communities to collaboratively address water resource challenges can provide additional opportunities to reduce business risks and increase value These efforts will make your facility less vulnerable to risks and better positioned to succeed given changes in water supply demand and quality
Deliver Value for Customers and Employees Reducing water use and risks through Lean Six Sigma and other process improvement meth-odologies can foster a competitive advantage for some businesses Customers and employees may view proactive environmental improvement efforts as an important attribute affecting customer loyalty and the ability to attract and retain employees In some market segments ldquogreenrdquo attributes are an important factor that can give a product or company competitive advantage People around the world view water issues as a key sustainability challenge For example more than 90 percent of the 32000 people polled in 15 countries for a GlobeScan and Circle of Blue survey in 2009 perceived ldquowater pollutionrdquo and ldquofreshwater shortagerdquo to be serious problems (70 percent considered them very serious problems)5 Some companies can tap into significant market niches by providing cus-tomers with water-efficient choices and solutions 5 GlobeScan and Circle of Blue ldquoWater Views Water Issues Researchrdquo August 19 2009
wwwcircleofblueorgwaternewswp-contentuploads200908circle_of_blue_globescanpdf
6
Chapter 1 Introduction
Participation in international or national water sustainability programs or local water efficiency efforts can provide businesses with public recognition and a competitive advantage for their wa-ter management achievements For businesses that manufacture water-using appliances parts or products companies can use design methods to make their products as water-efficient as possible throughout their lifecycles from manufacturing to use and disposal These methods can allow companies to cater to the steadily growing markets for green building and green products There are also awards and competitions that provide recognition and media publicity for water-related in-novations and efficiency accomplishments
Reducing your facilityrsquos water use and the water that your products require during use can add value for your ldquodownstreamrdquo customersmdashsaving them water and energy costs and helping them meet their water-efficiency goals Business interest in gathering and disclosing water use and risk information through initiatives such as the Global Reporting Initiative and the Carbon Disclo-sure Projectrsquos Water Disclosure Initiative may increase in the coming decade as water becomes a more critical business issue in some supply chains and industry sectors Chapter 5 discusses ideas for engaging with customers suppliers and communities on Lean and water efforts as well as incorporating water issues into Lean product design
Getting Started with Lean and Water There are many ways for a facility to get started with reducing water waste and finding Lean and water improvement opportunities While the possibilities can be daunting the important thing is to begin even if the effort is small Consider starting out with small steps such as tracking water use as a metric at your facility with the goal of reducing use This can be a great strategy for smaller facilities Here are some ideas for initiating a Lean and water effort
Learn More About How Your Facility Uses Water A key first step is learning how your facility uses water and identifying the process areas support functions and facility operations that have the greatest water waste and improvement opportunities Strategies include beginning to track water metrics as part of Lean and process improvement activi-ties and installing water meters on processes that use large amounts of water Box 5 lists examples of water metrics that facilities can use It is helpful for facility managers and Lean champions to track water usage regularly and to share this information with floor staff Regularly monitoring water use data can help you determine the impact of peak periods (eg during summer andor busier production months) and help you spot variations that could be signs of problems
7
Chapter 1 Introduction
Water Metrics (Box 5)
Facility-Wide Metrics
3 Volume of water used each month or other appropriate time period (eg gallonsmonth or gallonsshift)
3 Volume of wastewater (eg gallonsmonth or gallonsshift)
3 Water used for specific end uses (eg gallonsper month for outdoor ir-rigation cooling water evaporation heated process water bathrooms and kitchens etc)
Metrics Normalized to Production
3 Volume of water used per product (eg gallonspound of product gal-lonsproduct)
3 Volume of wastewater discharged per product (eg gallonspound of product or gallonsproduct)
Chapter 2 of this toolkit has more information on water end uses metering and costs
To be most effective in Lean and water implementation efforts Lean champions or operations man-agers should connect with environmental and facilities personnel early on to discuss plans for Lean and water efforts Environmental Health and Safety (EHS) personnel can assist with developing water balances and other assessments of facility and process water use including gathering data on water use and costs as well as helping prioritize Lean and water activities
After completing an initial water assessment managers can consider it in the context of other planned Lean events and prioritize opportunities for involving EHS personnel in value stream map-ping and kaizen events based on when their environmental expertise will add the most value
Engage Employees in Lean and Water Improvement Efforts Lean provides a solid framework to empower cross-disciplinary employee teams to identify and eliminate excess water use and other production waste thereby realizing both environmental and Lean gains Most likely your efforts to examine water use and waste will generate numerous ideas for process improvements and potential solutions Ideas could include water efficiency and reuse opportunities andor Lean events to improve water-intensive processes
bull Motivate employees and managers by communicating corporate sustainability goals and incorporating water efficiency into performance targets and incentives
bull Consider trying out some of the Lean and water improvement ideas in this toolkit but donrsquot limit employee teams to those ideasmdashencourage their creativity and initiative
bull Train employees on how to identify water waste and improvement opportunities building their capacity to problem solve and help meet your facilityrsquos water use reduction targets
8
Chapter 1 Introduction
bull Actively solicit employee suggestions for kaizen events or other improvement projects by inviting ideas in meetings and conversations andor by using a suggestions board or box
A significant benefit of involving employees throughout your facility in Lean efforts is the oppor-tunity to create a culture of continuous improvement When employees are engaged in identifying ways to improve water efficiency they are more likely to note these opportunities and areas of water waste throughout their normal day-to-day operations You might find that improved water efficiency becomes a continual trend at your facility and not just something that happens within the confines of a specific Lean exercise or event
Focus your facilityrsquos initial Lean and water efforts on high-impact easy-to-implement strategies in order to achieve the highest likelihood of success An Impact-Difficulty Matrix such as the one in Figure 1 can be useful for prioritizing among process improvement and implementation options Lean event participants can plot their ideas onto the four quadrants in the matrix based on whether or not an idea would have a large or small impact (either in terms of operational andor environ-mental objectives) and whether or not it would be difficult to implement This process lets people see visually which projects are most ldquoriperdquo for Lean
Connect Lean and Water Figure 1 Impact-Difficulty Matrix Efforts to Sustainable Water Management Strategies Lean and Six Sigma provide operational High tools that can support a broader corporate water sustainability strategy Leanrsquos focus on performance measurement continual improvement through employee engage-ment waste elimination improved ef- Low ficiency increased profits and customer satisfaction can be leveraged to support corporate water management efforts to Low High measure and report water use factor water
Difficulty into business decisions and implement the practical and effective solutions If your organization already has a sustainability policy andor specific water efficiency goals consider how Lean and water strategies could be used to enhance and accelerate those efforts
Risk-Based Water Sustainability Strategies
Depending on the importance of water to your business it may be worth developing a risk-based water sustainability strategy and then seeing how Lean and water efforts could support implementa-tion A number of resources can help you assess specific water-related risks determine the business case for water sustainability and develop implementation plans These include
Impact
9
Chapter 1 Introduction
bull Global Environmental Management Initiativersquos (GEMIrsquos) Connecting the Drops Toward Creative Water Strategies A Water Sustainability Tooltrade wwwgemiorgwater
bull World Business Council for Sustainable Developmentrsquos Global Water Tool wwwwbcsdorgwebwatertoolhtm
bull GEMIrsquos Local Water Tooltrade (scheduled to be released in spring 2012) wwwgemiorgGEMIInteractiveToolsaspx
This toolkit complements broader water sustainability strategy resources (such as those listed above) by exploring practical opportunities to leverage facility Lean and Six Sigma and similar process improvement initiatives to reduce water waste
True North Goals and Targets
Lean experts often extol the motivational power of setting goals and targets that represent the ldquoTrue Northrdquo for operations As noted by Lean expert Robert Hall of the Association of Manufacturing Excellence ldquoTrue North is what we should do not what we can do the ultimate ideal for the overall process and for every sub-process within itrdquo6 True North goals targets and metrics are powerful tools for inspiring and focusing employee attention and creativity to both continuously improve and find breakthrough solutions For example Nike Inc developed ldquoNorth Starrdquo goals and metrics to define what sustainable products and a sustainable company would look like which includes a focus on water stewardship7 Consider what the True North target is for water use in your facility For many facilities the True North targets may be zero wastewater and zero water use that is not incorporated into the product
Examining the Full Value Chain
To achieve sustainability goals itrsquos important to look beyond a facilityrsquos direct operations Lean methods can support water use and risk reduction efforts not only at areas within the direct control of a manufacturing or industrial facility but also throughout the lifecycle or extended value chain for a product or servicemdashfrom the extraction and processing of raw materials through production processes and onto product distribution use and disposition While the primary focus of this toolkit is on reducing water use at your facility Chapter 5 discusses opportunities to extend Lean and water techniques to other areas Figure 2 provides an illustration of how the content of the toolkit links to a value chain
6 Robert Hall ldquoThe Toyota Production System Seeks True Northrdquo Lean Directions e-Newsletter 2011 available at wwwsmeorgcgi-binget-newsletterplLEANamp20040709amp1amp
7 For more information on Nikersquos North Star see httpwwwnikebizcomcrreportcontentenvironment4-1-0-overviewphpcat=overview
10
Chapter 1 Introduction
Figure 2 Lean and Water Implementation Strategies
Understand Water Uses and Costs (Chapter 2)
Find Water Waste (Chapter 3)
Improve Operations and Processes with Lean and Water Strategies (Chapter 4)
Extend Lean and Water Efforts Throughout the Value Chain (Chapter 5)
Sourcing Materials and Inputs (Chapter5)
Production Manufacturing (Chapters 3 and 4)
Product Distribution Use and Disposition (Chapter 5)
To Consider
3Is water use responsible for major costs waste or risk at your organiza-tion If you donrsquot know how would you find out
3How has Lean affected your organizationrsquos use of water
3How could your organization benefit from efforts to reduce water waste us-ing Lean (Think about time and cost savings reduced risks and liabilities added value to customers etc)
3What ideas do you have for reducing water waste using Lean
11
CHAPTER 2
Water Use and Water Waste at Industrial Facilities
Understanding water use is an important first step in efforts to reduce water-related wastes costs and risks This chapter contains the following sections
bull Definition of Water Waste bull Industrial Water Use bull Water End Uses How Water Is Used at Facilities bull Measuring Facility Water Use Metering and Submetering bull Costs Associated with Water Use
Definition of Water Waste Water is one of the most critical resources in the world and is necessary for all types of industry Water is required in substantial quantities to create goods from food products to silicon chips In this toolkit the term ldquowater wasterdquo refers to use of water beyond the point that optimizes value to the customer This includes non-value-added water use throughout facility operations and support processes and from the supply chain through production product use and waste disposal Water waste can cause harm to health and well-being of people and ecosystems by diverting water from other needs and beneficial uses Reducing water waste can help ensure that present and future gen-erations have access to a sustainable water supply
Improve your facilityrsquos water efficiency by reducing water waste not only by reducing water intake but by finding creative ways to use water more efficiently Water efficiency as the term is used in this toolkit refers to reductions in the amount of water used per unit of production Water effi-ciency refers to the minimum amount of water needed to perform a task (Note that water-efficiency improvements do not necessarily mean that a facilityrsquos total water use is decreased since increases in production may offset water efficiency gains) Examples of water waste include
bull Loss of water through material failures such as leaky hose nozzles
bull Discarding water that could be reused such as treated rinse water
bull Wastewater discharges
bull Water used by high-flow appliances instead of more efficient alternatives
bull Use of water in excess of necessity such as the use of too much water for facility or parts cleaning
Understanding the many places where water waste occurs is an important first step for identifying areas for improvement
Chapter 2 Water Use and Water Waste at Industrial Facilities
Industrial Water UseThe use of water by industries both in the United States and throughout the world represents a significant portion of total water use US industrial water use is estimated to be more than 182 billion gallons per day (from direct water withdrawals not including water use from public water supply)8 While industrial water withdrawals account for just five percent of total water withdrawals in the United States thermoelectric power water withdrawals account for 49 percent Industrial and manufacturing businesses also use about 12 percent of the public water supply Industrial water us-ers include facilities involved in sectors such as chemicals food and beverage paper and associated products steel electronics and computers metal finishing petroleum refining and transportation equipment Overall two of the most water consuming sectors of the economy are agriculture and thermoelectric power although other industries may use a significant proportion of public water supplies in some areas
The share of industrial water use can be much greater in certain geographic areas and these areas can experience substantial supply pressures Figure 3 below shows a geographic distribution of wa-ter scarcity across the globe Areas prone to water scarcity will likely experience continued competi-tion for water resources which can impact your relationship with the surrounding community Be aware of your facilityrsquos location relative to potential water scarcity and consider water competi-tion when siting new facilities or building relationships with new suppliers In the United States the National Integrated Drought Information System maintains a user-friendly web portal(www droughtgov) with current information forecasts maps reports and resources addressing drought conditions and water scarcity
Industrial water use varies by sector as different activities require different inputs of water Box 6 lists eight industries that require substantial inputs of water
Water-Intensive Industries (Box 6)
3 Agriculture
3 Apparel
3 Beverages
3 Biotechnologypharmaceuticals
3 Electric power
3 Forest products
3 High-tech (including semiconductor manufacturing)
3 Metalsmining
8 Kenny Joan F et al Estimated Use of Water in the United States in 2005 USGS 2009 httppubsusgsgovcirc1344 The USGS data does not include industrial water use drawn from municipal water systems only direct withdrawals from surface and groundwater sources Actual industrial water use is likely greater For information on water use outside of the US see AQUASTAT Food and Agricul-ture Organization of the United Nations ldquoWater Withdrawal by Sector Around 2003rdquo data downloaded November 2010 wwwfaoorg nrwateraquastatmainindexstm Note that FAO data includes thermoelectric cooling water withdrawals in its industrial water totals
12
13
Chapter 2 Water Use and Water Waste at Industrial Facilities
Figure 3 Water Scarcity Map of the World
Source United Nations Environment Programme Map of Water Stress Indicator in Major Basins 2004 available at http mapsgridanogographicwater-scarcity-index
Water is a very important resource to many industries and as a result there are many opportuni-ties to reduce water use In the case of the high-tech industry which uses considerable quantities of water to manufacture semiconductors and other components water is vital to industry opera-tions Cleaning and rinsing silicon chips can require billions of gallons of water per year to produce a single chip can use up to 7900 gallons9 Apparel also ranks high in the list of water-intensive industries with cotton production and textile processing requiring substantial inputs of water Among industrial manufacturers the forest products sector is the third-largest consumer of water in the US requiring high volumes of water for pulp and paper manufacturing The electric power industry directly uses water extensively for cooling and emissions scrubbing fossil fuel plants and nuclear power plants require hundreds of liters of water for every kilowatt-hour of electricity that they produce10 Table 1 shows typical water quantities required to produce one ton of several manu-factured products
9 Uphadyay Sanjay ldquoMicroelectronics ndash Fostering Growth Opportunities in the Ultrapure Water Marketrdquo Frost amp Sullivan August 19 2011 available at wwwfrostcomprodservletmarket-insight-toppagdocid=240394448
10 CERES and Pacific Institute ldquoWater Scarcity amp Climate Change Growing Risks for Businesses amp Investorsrdquo February 2009 available at wwwpacinstorgreportsbusiness_water_climatefull_reportpdf
Chapter 2 Water Use and Water Waste at Industrial Facilities
Table 1 Typical Water Use Per Ton of Product
Paper 21000ndash528000 gallons
Beer 2113ndash6604 gallons
Sugar 792ndash105668 gallons
Steel 528ndash92460 gallons
Soap 264ndash9246 gallons
Gasoline 26ndash10566 gallons
Source United Nations World Water Assessment Programme United Nations World Water Development Report Water in a Changing World 2009 available at wwwunescoorgwaterwwapwwdrwwdr3
There is much variation among industrial sectors in relative water use and the need for water varies greatly across the stages of the product or service value chain from suppliers through production to product use It is important to know where in the value chain your industryrsquos water use is heavi-est so that you can appropriately target improvement efforts For example the apparel industry uses high volumes of water in raw material production whereas the biotech and pharmaceuticals industry uses most of its water resources in direct operations Table 2 shows the relative intensity of water impact (ranging from zero to three squares) in different segments of the value chain for several industry sectors
Table 2 High-Impact Water Use Sectors
Raw Material Production
Suppliers Direct Operations
Product Use End of Life
Apparel n n n n n
High-Tech Electronics
n n n
Beverage n n n n
FoodAgriculture n n n n n
Biotech Pharmaceuticals
n
Forest Products n n n
MetalsMining n n n n
Electric Power Energy
n n n n
Source CERES and Pacific Institute ldquoWater Scarcity amp Climate Change Growing Risks for Businesses amp Investorsrdquo February 2009 available at wwwpacinstorgreportsbusiness_water_climatefull_reportpdf
14
15
Chapter 2 Water Use and Water Waste at Industrial Facilities
Water End Uses How Water Is Used at Facilities In order to reduce water waste in industry it is important to understand the many ways that water is used within facilities Understanding water end uses is critical to identifying water savings opportunities While end uses of water vary by industry and by facility there are categories of water use that are present at most industrial facilities Water use in most industries can be classified into the following broad end uses
bull Production processing and in-product use
bull Auxiliary processes (eg pollution control labs and cleaning)
bull Cooling and heating (eg cooling towers and boilers)
bull Indoor domestic use (eg restrooms kitchens and laundry)
bull Landscape irrigation
These broad categories encompass many of the ways industrial facilities use water Among US industrial customers cooling operations (including cooling towers and open cooling systems) com-prise the single largest category of industrial water end use with more than 50 percent of industrial and commercial water demand combined going toward cooling11
The amount of water required for the various end uses differs by industry Service and manufactur-ing facilities require the most water for washing and processing while food and beverage facilities use most of their water intake in product preparation Figure 4 shows examples of water end uses in the computer and electronics manufacturing industry and the food processing industry
11 Vickers Amy Handbook of Water Use and Conservation WaterPlow Press 2001
16
Chapter 2 Water Use and Water Waste at Industrial Facilities
40
20
20
10
5 5
Figure 4 Breakdown of Water Uses in Two Industries
Rinsing
Cooling Systems
Fume Scrubbers
Water Purification
RestroomsOther
Landscaping
Computer and Electronics Manufacturers
3
42
14
13
9 Washing and Sanitation
Cooling and Heating
OneshyPass Cooling
Process
Domestic
OtherUnaccounted
Source Adapted from New Mexico Office of the State Engineer ldquoA Water Conservation Guide for Commercial Institutional and Industrial Usersrdquo July 1999 available at wwwosestatenmuswater-infoconservationpdf-manualscii-users-guidepdf
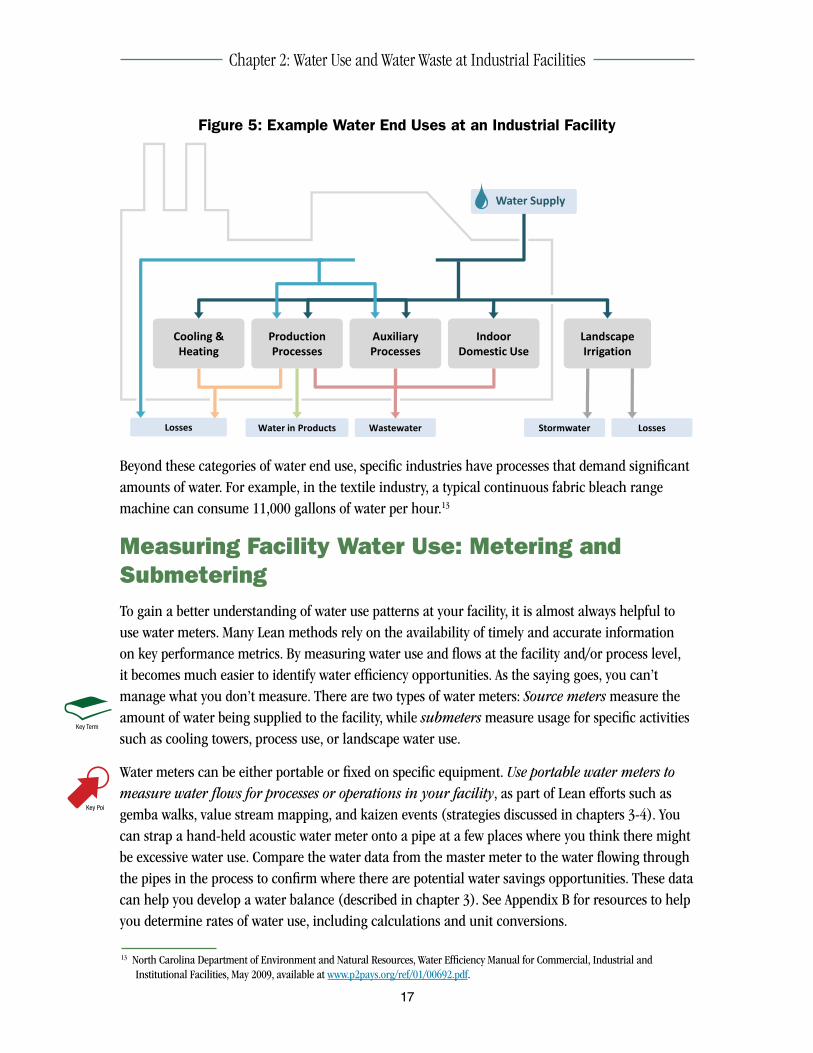
Major end uses of water often provide the greatest opportunities for water waste reduction and efficiency improvement For example in many food beverage and pharmaceutical companies cleaning process equipment can account for as much as 50 to 70 percent of a facilityrsquos total water use and represents a substantial opportunity to save water12 Figure 5 illustrates how water flows through several different end uses at an industrial facility note that this diagram does not incorpo-rate all reuse options Think of how a similar diagram would look that shows the water use at your facility
12 General Electric Company Water amp Process Technologies ldquoSolutions for Sustainable Water Savings A Guide to Water Efficiencyrdquo 2007 available at wwwgewatercompdfCapabilities20Brochures_CustAmericasEnglishBulletin1040enpdf
19
Food Processors
17
Chapter 2 Water Use and Water Waste at Industrial Facilities
Figure 5 Example Water End Uses at an Industrial Facility
Cooling amp Heating
Production Processes
Auxiliary Processes
Indoor Domestic Use
Landscape Irrigation
Treatment
Water Supply
Water in Products Wastewater Stormwater Losses Losses
Beyond these categories of water end use specific industries have processes that demand significant amounts of water For example in the textile industry a typical continuous fabric bleach range machine can consume 11000 gallons of water per hour13
Measuring Facility Water Use Metering and Submetering To gain a better understanding of water use patterns at your facility it is almost always helpful to use water meters Many Lean methods rely on the availability of timely and accurate information on key performance metrics By measuring water use and flows at the facility andor process level it becomes much easier to identify water efficiency opportunities As the saying goes you canrsquot manage what you donrsquot measure There are two types of water meters Source meters measure the amount of water being supplied to the facility while submeters measure usage for specific activities such as cooling towers process use or landscape water use
Water meters can be either portable or fixed on specific equipment Use portable water meters to measure water flows for processes or operations in your facility as part of Lean efforts such as gemba walks value stream mapping and kaizen events (strategies discussed in chapters 3-4) You can strap a hand-held acoustic water meter onto a pipe at a few places where you think there might be excessive water use Compare the water data from the master meter to the water flowing through the pipes in the process to confirm where there are potential water savings opportunities These data can help you develop a water balance (described in chapter 3) See Appendix B for resources to help you determine rates of water use including calculations and unit conversions
13 North Carolina Department of Environment and Natural Resources Water Efficiency Manual for Commercial Industrial and Institutional Facilities May 2009 available at wwwp2paysorgref0100692pdf
18
Chapter 2 Water Use and Water Waste at Industrial Facilities
Figure 6 Portable Water Meter
Source Eno Scientific wwwenoscientificcom
Accurately measuring water use can help you identify areas for targeted reductions and track progress from water-efficiency upgrades Submeters can also help identify leaks and indicate when equipment is malfunctioning In some cases it may also be useful to measure water pressure a drop in pressure can indicate the presence of a leak However especially for smaller facilities it will not necessarily make sense to use meters everywhere Consider using meters when you have a need to closely track data for example before and after a process improvement event on a water-inten-sive process You can use the data provided by the meters to compare water use and see how your efforts have improved your facilityrsquos water efficiency Larger facilities can also integrate meters into centralized building management systems making it easy to electronically track water usage gener-ate reports and trigger alerts when leaks or anomalies are found For additional advice on when to use water meters consult your local water utility or the resources in Appendix A
Installing the correct meter and ensuring it functions properly are critical to accurate water measurement There are many types and sizes of meters intended for different uses so it is impor-tant to choose the correct one Improper sizing or type of meter can cause problems For example
14 Smith Timothy A Plumbing Systems and Design Water-Meter Selection and Sizing 2008 wwwpark-usacomhomeaspxelid=71amparl=108
19
Chapter 2 Water Use and Water Waste at Industrial Facilities
an undersized water meter can cause excessive pressure loss reduced flow and noise Oversized me-ters are not economical and do not accurately measure minimal flow rates14 It is also important to ensure that water meters are properly calibrated according to the manufacturerrsquos recommendation and that appropriate maintenance practices are followed on metering equipment Most meters have internal mechanical parts and will begin to under-register the amount of water used as the meter gets older and the mechanical parts wear down When abnormal water measurements are detected check the metering equipment to ensure that the results are not due to metering equipment failures
By metering water use at the facility and process levels facility personnel can compile data to inform Lean improvement efforts Here are some practical tips for using water meters as a part of Lean efforts
bull Use flow meters and water quality or cleanliness standards to establish standard work for water usage flow and pressure levels taking into consideration ldquoset pointsrdquo recom-mended by equipment specifications and facility operating procedures These baseline levels give important context of what accounts for ldquonormalrdquo operating parameters against which improvements and new water losses can be assessed
bull Use data that meters provide to determine the appropriate frequency for aggregating and reporting water measures (eg hourly daily or weekly) that best meets your facil-ityrsquos needs
bull Show employees how to read and use water meters as part of Lean activities such as gemba walks value stream mapping and kaizen events so that they can identify water savings opportunities
bull Post water use reduction goals and water usage information on the factory floor on Lean production control boards or in other accessible places to raise awareness of water use and efficiency among employees
bull Track data from water meters over time Portfolio Manager an online building per-formance benchmarking tool available from the ENERGY STAR program can help you track and benchmark water consumption data For more information on the Portfolio Manager see Appendix A
20
Chapter 2 Water Use and Water Waste at Industrial Facilities
Costs of Water Waste As noted in chapter 1 costs associated with water use include more than the direct costs you pay for water supply but also the costs of water as it travels through processes and operations (see Figure 7) Box 7 provides examples of water costs such as energy pollution control regulatory compliance and raw material costs
Figure 7 Costs Associated with Water Use
Costs Associated with Water Use
Price of Incoming Water
Sewer Service Charge
Labor and other costs associated with water processing and treatment
Cost of energy and chemicals needed to process water
The ldquoprice on the water billrdquo
The cost of water use at a facility can be much greater than the amount on the water bill
Estimating the many components of total water cost for a facility can begin with the cost of water purchased from utilities but should also include the cost of steps required to process use and discharge the water These costs can amount to a good deal more than what appears on a utility bill When estimating water costs it is important to consider these and other indirect costs throughout all functions of a facility Be sure to use estimated future rates when assessing water costs in order to project the level of savings that will be possible when improvements are made
21
Chapter 2 Water Use and Water Waste at Industrial Facilities
Common Costs Associated with Water Use (Box 7)
Raw Material Costs
3 Water purchased from utilities marginal costs of purchasing additional wa-ter versus costs of conservation
3 Cost of water treatment filtering and softening before use
3 Costs for chemicals needed to treat and manage water
Energy Costs
3 Cost of energy to heat water
3 Cost of energy to pump water from its source or within the facility itself
3 Energy and labor costs for operating and maintaining water-using equip-ment
Pollution Control Costs
3 Wastewater and stormwater service rates including surcharges
3 Total cost of treating wastewater for disposal including labor energy chemi-cals equipment and residual disposal
3 Marginal costs of increasing effluent treatment capacity when water de-mand increases
Regulatory Compliance Costs
3Labor costs for regulatory compliance activities such as completing permit applications monitoring compliance and reporting wastewater discharges to regulatory agencies
Source Adapted from North Carolina Department of Environment and Natural Resources Water Efficiency Manual for Commercial Industrial and Institutional Facilities May 2009 available at wwwp2paysorgref0100692pdf
Full costs associated with water use often vastly outweigh the direct costs The direct cost of pur-chasing water from a utility may not seem significant enough alone to merit the effort to reduce water use but when the full cost of water is assessed the financial savings can be substantial Table 3 shows an example of the various costs of water in an industrial process In this example the esti-mated savings from implementing improvements using direct water and sewer costs alone is only 56 percent of the estimated savings using the full cost of water The flexible cost savings of conserved water is estimated to be 40 percent of total treatment cost Flexible treatment costs refer to expenses that vary according to the volume of water treated (eg energy used to pump and treat water treat-ment chemicals) fixed costs (eg capital equipment used for treatment) do not typically vary as wastewater throughput changes
Chapter 2 Water Use and Water Waste at Industrial Facilities
Table 3 Costs Associated with Water Used in an Industrial Process
Activity Unit Cost ($1000 Gallons)
City Water Purchase $355
Sewer Rate $399
Deionized using reverse osmosis
Equipment $057
Energy $120
Labor $143
Total deionized water $231
Deionized water (flexible cost) 40 x $231 = $092
Wastewater treatment
Sludge disposal $346
Treatment chemicals $244
Energy $032
Labor $625
Total wastewater treatment $1247
Wastewater treatment (flexible cost) 40 x $1247gallon = $498
Total cost of water $1344
Flexible cost savings of conserved water is estimated to be 40 percent of total treatment cost
Source Adapted from North Carolina Department of Environment and Natural Resources Water Efficiency Manual for CommercialIndustrial and Institutional Facilities May 2009 available at wwwp2paysorgref0100692pdf
22
23
Chapter 2 Water Use and Water Waste at Industrial Facilities
Appendix B contains a Water Cost Calculator that provides a template for calculating common costs associated with water use at industrial facilities It may also be useful to estimate the potential water and dollar savings that would result from implementing water efficiency measures at your facility see Appendix C for some equations that you can use to guide these estimates
In some water-stressed areas industrial facilities may face the possibility of an even greater water-related costmdashthat of lost revenue from the need to curtail production in the event of water supply disruptions Competition for water across residential agricultural industrial and environmental needs during periods of water scarcity may lead local water managers to impose limits on industrial water use Understanding the vulnerability to disruption of local water supplies can be an important consideration when assessing the true costs of water use when expanding or developing new facili-ties
The next chapter discusses strategies for understanding how water is used at your facility and iden-tifying opportunities to reduce water use and improve operations
To Consider
3 What are the primary water end uses at your facility
3 What processes and facility operations use the most water
3 What costs are associated with your facilityrsquos water use What indirect costs may be unaccounted for
Lean and Water Toolkit
25
CHAPTER 3
Finding Water Waste on the Factory Floor
Some of the most substantial reductions in water use can be found right on the factory floor This chapter describes several simple techniques to foster an understanding of where water goes in a facility and where it can be saved including the following
bull Water Gemba Walks bull Developing a Water Balance bull Water Waste and Value Stream Mapping bull Root Cause Analysis
While all of these techniques evaluate aspects of facility water use and can support your Lean efforts each has a different level of detail time and staff investment requiredmdashranging from a facility walk to a multi-day value stream mapping event Consider the level of effort desired before getting started to conduct the most effective analysis for your facilityrsquos needs
Water Gemba Walks A useful way to identify ways to reduce water consumption is a ldquogemba walkrdquo A water gemba walk is an exercise in which employees and managers walk the factory floor together to observe and inventory inefficiencies related to water use Gemba is a Japanese term meaning ldquothe real placerdquo in the context of Lean manufacturing gemba typically refers to the place where work happens (eg factory floor) Water gemba walks enable a team to quickly locate ldquolow-hanging fruitrdquo that save water at a small cost They help facilities to
bull Identify major sources of water loss such as leaks that can be repaired for significant savings
bull Acquire a more complete understanding of the major end uses of water and flows of water in the facility than can be achieved solely by analyzing water utility bills
bull Instill floor managers and workers with the importance of looking for and noticing leaks and inefficiencies helping to create a culture of water efficiency
Before you conduct your gemba walk first determine the purpose and scope of the walk How large an area will the walk cover and how long will it take How long will the team look at certain aspects of plant operations What information or data would equip the team to best see wastes and opportunities Second obtain copies of relevant documents and data including the last year of water utility bills or water consumption logs the floor plan of the facility if available and process diagrams for focus areas Third select the members of the gemba walk team A small team is best with approximately five to seven people constituting an ideal team size Include workers and man-agers familiar with the area outsiders new employees and veterans as well as an EHS representa-
26
Chapter 3 Finding Water Waste on the Factory Floor
tive in order to get a diversity of perspectives A brief training can orient your team to the purpose of a gemba walk and help them feel empowered to spot wastes throughout the walk
Once you have your team assembled use the Steps to Take During a Gemba Walk in Box 8 to find water waste and improvement opportunities at your facility
Steps to Take During a Gemba Walk (Box 8)
1 Identify all water-consuming equipment high-use areas and meterlocations
2Note all water losses evaporative losses and water incorporated in product excessive water pressure and leaks
3Observe shift clean-ups and process changeovers
4Quantify water flow rates and usage
5Note the water quality used in each process step
6Determine water quality needs for each process and quality of wastewater discharged
When employees are engaged and interested in finding wastes and identifying ways to improve water efficiency the benefits of your gemba walk can continue well beyond the exercise itself The training that your employees receive to conduct a gemba walk or other Lean exercises combined with immediate engagement in the exercises themselves can help to create a culture in which em-ployees routinely seek out ways to improve water efficiency
Consider conducting your gemba walk during a time when the facility is shut down as this can be a good time to find unexpected losses You can also collect data during your gemba walk on the nature of the water in use at various steps throughout each process knowing when treated water is necessary and when lower-quality water might be okay will help you identify reuse opportuni-ties later Table 4 Key Areas to Check During a Water Gemba Walk lists several common areas in industrial facilities in which water inefficiencies can be observed during a gemba walk
Chapter 3 Finding Water Waste on the Factory Floor
Table 4 Key Areas to Check During a Water Gemba Walk
Process and Equipment Use bull Cleaning Washing Rinsing bull Metal Finishing bull Painting bull Dyeing and Finishing bull Photo Processing bull Process Water Reuse bull Product Fluming (Water Transport) bull Pretreatmentfiltration systems bull Pump and Conveyor Lubrication bull Water Use in Products
Other Facility Support
bull Floor Washing bull Air Emission Wet Scrubbers bull Building Washing bull QAQC Testing bull Laboratories bull Landscaping and Irrigation bull Dust and Particulate Emission
Control bull Decorative Fountains and Ponds bull Vehicle Washing bull Cooling Water for Air Compres-
sors and Vacuum Pumps bull Hazardous Waste Storage and
Effluent
Cooling and Heating bull Single-Pass Cooling bull Cooling Towers bull Boilers Hot Water Steam Systems bull Air Washers bull Boiler Scrubbers
Sanitary and Domestic Kitchens bull Toilets bull Food Preparation and Cleaning bull Faucets bull Dishwashers bull Urinals bull Ice Machines bull Showers bull Faucets bull Wash-up Basins bull Food Disposals
Source Adapted from North Carolina Department of Environment and Natural Resources Water Efficiency Manual for Commercial Industrial and Institutional Facilities May 2009 available at wwwp2paysorgref0100692pdf
Leak detection during a gemba walk can be one of the best low-cost high-yield steps for reduc-ing water waste in a facility Leaks exist in all facilities and can result in water loss ranging from a fraction of a percent of a facilityrsquos total water use all the way up to a substantial portion Low water pressure dirty water and a high quantity of water that cannot be accounted for are all signs of a leak Bluing tablets or dyes can be used to easily check for leaks in tanks toilets or other water holding vessels Sonic or acoustic leak detection equipment can be used to check for leaks in under-ground pipes A simple drip gauge can help you conduct a basic estimate of how much water is lost due to a leak Many leaks can be repaired with simple measures such as tightening or replacing fit-tings15 In some cases it may be best to enlist the services of a professional leak-detection company to identify more complex leaks
15 North Carolina Department of Environment and Natural Resources Water Efficiency Manual for Commercial Industrial and Institutional Facilities May 2009 available at wwwp2paysorgref0100692pdf
27
28
Chapter 3 Finding Water Waste on the Factory Floor
Box 9 lists some examples of successful gemba walk and leak detection efforts
Examples of Water Gemba Walk Success (Box 9)
3Kirtland Air Force Base performed leak-detection gemba walks in which teams walked water lines with acoustic listening devices to find leaks sur-veying 90 percent of water distribution lines on the base The teams found that 31 leaks were dripping away nearly 16 percent of the basersquos water at a rate of 333 gallons lost per minute Repairs after the survey saved over 179 million gallons per year
3In one DTE Energy plant water pressure on the upper floors of the building was problematically low Observations on the factory floor revealed that an open valve on a new water treatment system was responsible for the low water pressure By installing a $3000 variable valve the company saved half a million dollars that it would have spent on a booster pump
3Del Monte Foods used a water gemba walk to identify potential water sav-ings in a recirculation line that was forked from eight inches to two four-inch pipes By combining the freshwater line with the main line the facility was able to save 300000 gallons per day
Sources US Department of Energy Federal Energy Management Program ldquoDistribution System Audits Leak Detec-tion and Repair Kirtland Air Force Base ndash Leak Detection and Repair Programrdquo 2009 information provided by Jason Schulist and Michael Sklar DTE Energy May 2011 and Scott Butler Del Monte Foods ldquoThe Del Monte Production System Lean to Green Integrative Futurerdquo Presentation at Green Six Sigma Summit Presentation May 2009
Developing a Water Balance While a gemba walk will help you identify potential water-savings opportunities developing a water balance will give you a more thorough picture of overall water use at your facility A water balance is a high-level simple assessment of the input and output of water in your facility that can help to identify opportunities for improving water efficiency A water balance might be appropriate for your facility especially if you are just beginning your journey with Lean and water and have not con-ducted a more detailed water audit
A water balance is a chart table or diagram of a facilityrsquos water use that shows the flows of water into and out of each process or operation in the facility It typically includes every water-consuming component on-site and all flows out of the facility A water balance can also include data on the cost of water Figure 8 illustrates the fundamental approach to developing a water balance Water bal-ances can also be developed as part of value stream maps
29
Chapter 3 Finding Water Waste on the Factory Floor
Figure 8 Typical Water Balance Calculation
Input (A)
Process Unit
A B C
Output (C)
A ndash (B+C) = Balance (or discrepancy)
Input is ProcessFacility Water Supply Water Losses (eg to air land and product) Output is Wastewater Discharge
Water Losses (B)
When creating a water balance make note of all water use in the facility and track water flows from the source through all operations at the facility to water losses and outputs including evaporative losses input to products and wastewater discharge All uses of water in a facility should be included in a water balance Common end uses of water are discussed in chapter 2 and include processing and auxiliary processing heating and cooling indoor domestic use and landscape irrigation The water balance should capture all of the flows into and out of each process at the facility and should verify that there is a balance between flows in and flows out Compare the estimated or measured total of end uses with the incoming metered amount Be sure to account for losses such as evaporation as well as wastewater discharge The Simplified Elements of a Water Balance figure (Figure 9) below shows an example of the components of a simple water balance for a facility while Table 5 Example Water Balance Summary presents overview information on water use by process from a water balance
30
Chapter 3 Finding Water Waste on the Factory Floor
Figure 9 Simplified Elements of a Water Balance
Pretreatment 950 gallons
Landscaping
Processing
Cooling Towers
Boilers 50 gallons
50 gallons
Losses
Wastewater
Losses
Wastewater
Water in Products
Stormwater
The process of putting together a water balance helps to capture a baseline of a facilityrsquos current water usage (see Box 10) A water balance will help you identify sources of risk such as leaks and compliance concerns Some companies choose to conduct water balances at varying levels of detail on a regular basis in an effort to locate ways to reduce water use and discover hidden water-savings dividends
Chapter 3 Finding Water Waste on the Factory Floor
Table 5 Example Water Balance Summary
Water Uses Input (GallonsYear)
Output (GallonsYear)
Loss (as a of Water Use)
Cooling tower make-up and boiler make-up
8484000 8248000 236000 (28)
Process use 6298000 6186000 112000 (18)
Cooling air compres-sors and pumps
7654000 7455000 199000 (26)
Landscaping 1675000 1533000 142000 (85)
General washing sanitation and maintenance
1101000 1095000 6000 (05)
Food preparation dishwasher
624000 613000 11000 (18)
Subtotal 26660000 25130000 1530000 (57)
Total Water Loss 1530000 GallonsYear
A spreadsheet developed by GEMI to help you create a water balance for your facility is available at wwwgemiorgwaterplannercalc-waterbalanceasp
Benefits of compiling a water balance include
bull Ability to identify processes that present the best targets for reducing water use
bull Establishment of baseline water use data from which improvements in efficiency can be benchmarked
bull Creation of a tool with which to compare different water-efficiency improvement strategies
31
32
Chapter 3 Finding Water Waste on the Factory Floor
Information to Collect for a Water Balance (Box 10)
To complete a water balance collect data on the volume of water flows for each process or operation in your facility including
3 Water and sewer bills from the previous one to three years
3 Numbers sizes and locations of water meters
3 Sources of incoming water
3 Diagrams of plumbing and water pipes as well as irrigation schematics
3 List of water-consuming processes
3 Information about unsewered wastewater (wastewater not discharged to municipal sewer systems such as through separate permitted discharges)
An outside expert could be the best option to help conduct a water balance for some facilities Contact your local water utility to ask whether it provides assistance for developing water balances some utilities provide this service (or related services) free of charge In many cases a water bal-ance can make it easy to identify steps to take to improve water efficiency If there is a discrepancy between the input and output of water in your facility that becomes apparent after preparing your water balance you might use that baseline to create a target future state that reduces the discrepan-cy by a set percentage Several of the resources in Appendix A provide information about developing water balances more involved assessments such as water footprints (see Box 11) and audits and benchmarking and tracking tools such as ENERGY STARrsquos Portfolio Manager
More Detailed Water Audits Water Assessments and Water Footprints
In the event that a more detailed assessment of water use and risks is desired an organization could consider conducting a water audit water source vulnerability assessment andor water footprint analysis While the results of these methods can inform the use of Lean to improve facility water efficiency they are typically conducted as stand-alone efforts that can require substantial effort and investment These methods are only described briefly below in this toolkit
bull A water audit typically involves a more comprehensive time-intensive facility-wide effort to as-sess a facilityrsquos water use and efficiency improvement opportunities A water audit may include activities described in this toolkit such as metering and baselining but it typically focuses on the full facility in a discrete brief period (eg during a 1ndash2 week effort) You may choose to follow specific standards when conducting the audits such as those of the American Society of Heating Refrigerating Cooling and Air-Conditioning Engineers
bull A water source vulnerability assessment generally looks outside of the facility at factors that have potential to affect the supply and cost of water that the facility and surrounding commu-nity relies upon This assessment can help a facility determine the risks of water supply disrup-tions or costs fluctuations and identify steps that may help to reduce these risks
33
Chapter 3 Finding Water Waste on the Factory Floor
bull Water footprinting analysis refers to the total volume of fresh water that is used directly and indirectly to run and support the business encompassing both water use within an industrial facility and throughout its supply chain You might consider conducting a water footprint to gain a more complete understanding of the places where water is used inefficiently throughout your supply chainmdashupstream among suppliers and downstream by users of the facilityrsquos output or products While a water footprint can be time-consuming and difficult to prepare it can be helpful in identifying improvement opportunities throughout the supply chain Box 11 provides tips for conducting water footprint analyses while chapter 5 discusses strategies for engaging suppliers to reduce water use and risks
Water Footprinting Tips (Box 11)
What information should water footprint analyses contain
3Track surface and groundwater sources rainwater stored in the soil and polluted water as inputs and outputs from a facility This can help address concerns about water scarcity and use
3 Include the geographical location of water withdrawals and discharges as well as direct and indirect water use
3 Work with suppliers to get data on water inputs and outputs from their operations often this is where the most water is used
3 Consider also estimating your productsrsquo end-use footprint which is any water used by consumers when they use the product
3 Note the scarcity and drought vulnerability of your suppliersmdasha water foot-print can be a valuable tool to identify business risks
3 Present the water footprint information in a clear and compelling manner such as a diagram showing water flows and quantities
For additional guidance on water footprinting see the Water Footprint Network website wwwwaterfootprintorg
Water Waste and Value Stream Mapping Like water balances value stream mapping can be a powerful tool for identifying water waste and savings opportunities Value stream mapping is a Lean method for creating a visual representation of the flows of information and materials across all the activities involved in producing a product for a customer In a value stream mapping event two maps are developed a map of the current state showing key data about existing processes and a future state map showing changes that can be made to reduce waste Value stream maps can be developed at the value-stream level (eg for a product family) or at the process level after your team has selected a process to investigate more closely
34
Chapter 3 Finding Water Waste on the Factory Floor
By adding water data to value stream maps value stream mapping can help you
bull Gain a better understanding of where the greatest water waste occurs
bull Identify areas where improvements can be made to reduce excess water use and other wastes
bull Develop an implementation plan for process improvements to reduce wastes in the value stream prioritizing water efficiency projects alongside other Lean and environ-mental projects
bull Quantify the expected savings from implementing those improvements
bull Create a culture of efficiency as team members from supervisors to floor workers be-come engaged in cutting waste
Adding Water Waste to Value Stream Maps Value stream maps depict all the activities in a value stream or a process along with key metrics that primarily relate to time Incorporating water considerations into a value stream mapping exer-cise is as simple as adding the amount of water used at each step onto the value stream map Figure 10 Adding Water Use to Value Stream Map Process Box shows a process data box with data on the water use by a particular process included Costs associated with the water used by each process or process step could also be added however to be fully representative these costs should include indirect costs such as those for support functions
Figure 10 Adding Water Use to Value Stream Map Process Box
CT = 4 min CO = 45 min Uptime = 61 Water Use = 9K gallonsday
2 people
Plating
Water use per day
35
Chapter 3 Finding Water Waste on the Factory Floor
Figure 11 Value Stream Map Incorporating Water Use Metrics shows an example of a current state value stream map that has been modified (with additions in blue) to include data on the amount of water used at each step Most activities that consume water are tracked in the map however note that this map does not include water loss as a result of leaks and evaporation or other losses that can occur between process steps
Figure 11 Value Stream Map Incorporating Water Use Metrics
Mar
ket F
orec
ast
Tota
l Lea
d Ti
me
= 68
day
sVa
lue
Adde
d Ti
me
= 15
min
Tota
l Wat
er U
se =
59K
gal
Cus
tom
erA
2 pe
ople
CT
= 4
min
CO
= 4
5 m
inU
ptim
e =
61
Wat
er U
se =
30K
gal
Dry
ing
2 pe
ople
Cle
anin
g
CT
= 2
min
CO
= 6
0 m
inU
ptim
e =
74
Wat
er U
se =
10K
gal
3 pe
ople
CT
= 7
min
CO
= 5
0 m
inU
ptim
e =
48
Wat
er U
se =
15K
gal
Rin
sing
I I
I 3
peop
le
Ship
ping
7 m
in4
min
2 m
in
15 d
ays
8 da
ys10
day
s 30
day
s
Prod
uctio
nC
ontr
ol
WK I
5 da
ys
D
I D
30 d
ays
WK
Rec
eivi
ng
CT
= 2
min
CO
= 3
0 m
inU
ptim
e =
93
Plat
ing
5 da
ys
2 m
in
Cus
tom
erB
Su
pplie
r1
Supp
lier
2
Lead
Tim
e
36
Chapter 3 Finding Water Waste on the Factory Floor
Many teams develop value stream maps using sticky notes to represent each step in a process This enables team members to move things around easily and helps them create the most accurate pic-ture of the process possible
To create a visual representation of the areas in the value stream map that use the most water try using different colors of sticky notes for high- and low-water using steps See Figure 12 for an example of the use of sticky notes to create a value stream map with water data added to several of the notes
Figure 12 Process Boxes Showing Water Waste
Another way to show water inputs and outputs associated with your facilityrsquos processes is by drawing lines into and out of each process data box on your value stream map In Figure 13 the red circles show where water and wastewater flows have been identified other waste streams are identified as well See EPArsquos Lean and Chemicals Toolkit for more information on this approach16
16 Value stream mapping is described in chapter 3 of the Lean and Chemicals Toolkit available at httpwwwepagovleanenvironmenttoolkitschemicalsch3htm
37
Chapter 3 Finding Water Waste on the Factory Floor
Figure 13 Water Inputs and Outputs Identified on a Value Stream Map
After creating a current state map your value stream mapping team will create a future state map that envisions ways to eliminate waste in the value stream and identifies areas for future process improvement projects such as kaizen events or just-do-its (described in the next chapter) With water data included on the current state value stream map your team will be able to easily identify opportunities for increased water efficiency and can work together to identify prioritize and develop an implementation plan for improvement projects that can meet both Lean and environmental goals Incorporating water waste into value stream mapping allows water efficiency projects to be combined with and considered together with other operational improvements
The implementation plan is a key product from the value stream mapping event Take care to de-velop an implementation plan that details the steps to carry out the improvements you have identi-fied being sure to assign responsibility for each step of the plan Consult with facility EHS staff and permitting authorities before making any changes that could affect facility emissions or wastewater discharges
For more information on adding environmental metrics to value stream maps see chapter 3 of EPArsquos Lean and Environment Toolkit17
17 Available on the EPA Lean Manufacturing and the Environment website at wwwepagovleanenvironment
38
Chapter 3 Finding Water Waste on the Factory Floor
Root Cause Analysis When you find a water waste in your facility whether during a gemba walk or a value stream map-ping exercise itrsquos important to ask ldquoWhy did this happenrdquo There is a set of Lean tools that can help you answer this question Root cause analysis is the process of identifying a problem and working through possible components to identify the most basic reason why the problem is occurring Once the cause of the problem is identified you can prevent its recurrence Two tools of root cause analy-sis include fishbone diagrams and the ldquo5 whysrdquo approach
Explore water waste yoursquove found in a Fishbone Diagram (also known as an Ishikawa Diagram) which shows potential causes of a problem by grouping causes into major categories to identify the source of inefficiencies To investigate water waste using a fishbone diagram first identify the specific problem you wish to investigate perhaps a spike in water use at the facility or a leaky pipe or valve Write the primary problem you wish to investigate in the head of the diagram usually on the right side The ldquobonesrdquo of the diagram represent groupings of potential causes of the problem common categories include the following
bull Measurements
bull Material
bull Man (or Personnel)
bull Methods
bull Machines
bull Environment
Along each grouping many detailed sub-causes are listed Figure 14 on the next page Fishbone Diagram of Excessive Water Use shows an example of a fishbone diagram that one facility used to assess its water use
Another root cause analysis tool is the ldquo5 whysrdquo technique The approach uses a systematic ques-tionnaire technique to search for root causes of a problem Simply ask ldquoWhyrdquo when considering the primary problem ldquoWhy is excessive water used hererdquo Follow up with additional ldquoWhyrdquo inquiries until you drill down to the root cause of the problem The goal of the exercise is to pursue further until the root of the problem is identified Be aware that there is sometimes more than one cause of a problem
39
Chapter 3 Finding Water Waste on the Factory Floor
Asking Why Five Times (Box 12)
1 Why are we using so much water The parts need to be cleaned before painting
2 Why do the parts need to be cleaned The parts fail quality checks if they arenrsquot cleaned before being painted
3 Why do painted parts fail quality checks The paint doesnrsquot adhere when part surfaces are not prepared properly
4 Why do the surfaces of the part need to be prepared The surfaces get contaminated by oils used in the previous process
5 Why are oils used in the previous process The oils are used to prevent corrosion during storage
Based on an example from Robert B Pojasek ldquoAsking lsquoWhyrsquo Five Timesrdquo Environmental Quality Management (Autumn 2000) 83
Figure 14 Fishbone Diagram of Excessive Water Use
Measurements Material Personnel
Environment Methods Machines
Excessive Water Use
No metrics
Budget baseline
Untreated water
Galvanized piping
Operator understanding
Obsolete article
Operator training
RCM
Notification procedures
Ineffective ventilation
No ventilation
No headers
Plugged pipesdisks
Eroded orifice disks
Failed controllers
Failed valves
Failed probes
Source Schulist Jason Lean Towards Sustainability How to Use Lean and Six Sigma Methods to Drive Your Sustainability Journey DTE Energy 2009
40
Chapter 3 Finding Water Waste on the Factory Floor
Completing a root cause analysis exercise should be a precursor to brainstorming potential solu-tions to water waste problems at your facility By using these tools you can ensure that you address the root cause of the problem first instead of merely treating the symptoms Chapter 4 explains how to take the knowledge about your facilityrsquos water use that you have gained through the tools listed in this chapter and apply that knowledge to reduce water use
To Consider
3 Where are the largest sources of water waste in your facility If you donrsquot know what steps will you take to find out
3 Are there processes or areas at your facility that could use non-potable or lower quality recycled water
3 What resources might be available in your area to help you conduct a water balance or water audit
3 Where in your facility might be a good target for a water-focused value stream mapping activity
41
CHAPTER 4
Lean and Water Efficiency Improvement Strategies
After yoursquove taken the important first steps to understand how your facility uses water there are a number of ways to reduce your water use through Lean and water efficiency efforts This chapter describes the following
bull Kaizen Events and Just-Do-Its to Reduce Water Use bull Integrate Water Efficiency into Everyday Lean Practices bull Lean and Water Applications for Facility Operations and Support Processes
Kaizen Events and Just-Do-Its to Reduce Water Use There are three key questions to ask to identify water-efficiency opportunities
Key Water-Efficiency Questions (Box 13)
3 Can we stop or prevent water losses (eg leaks)
3 Can we reduce water use (eg changing equipment plumbing processes andor behaviors)
3 Can we recycle or reuse water for another purpose (eg recirculating water within a process reusing process water for another application capturing rainwater etc)
Leanrsquos implementation-based methods of kaizen events and just-do-its are powerful strategies for putting water efficiency into practicemdashjust-do-its for easy changes and kaizen events for more in-volved projects A kaizen eventmdashalso known as a rapid process improvement eventmdashis a 2ndash5 day period when a cross-functional team examines a process and makes rapid changes to improve it
Before initiating significant process changes remember to consult with your local utility or environmental agency to make sure that all facility permitting requirements are met EHS staff at your facility can provide guidance on which changes may trigger regulatory or worker health and safety issues
42
Chapter 4 Lean and Water Efficiency Improvement Strategies
Water Kaizen Event Examples (Box 14)
GE conducted week-long water kaizen events at three of its largest water-consuming sites in 2009 including monitoring and assessing water use facility-wide and developing water-reduction projects with associated financial benefits
3 These kaizen efforts combined with flow monitoring and water-conservation efforts at the largest water-consuming site helped GE reduce water use 30 percent from 153 billion gallons in 2006 to 107 billion gallons in 2009
Through an environment health amp safety kaizen event at one site United Technologies Corporation eliminated 40000 gallons of wastewater per year and saved $50000 per year by changing how the facility managed test cells an underground storage tank and its waste streams
3 The facility no longer sends water to the storage tank and waste fluids from the process (eg oils) are collected separately to allow for reuse recycling or reclamation
3 These efforts are expected to further reduce wastes up to a total savings of 75000 gallons and $150000 per year
GE ldquoEcomagination 2009 Annual Reportrdquo pp 16-17 httpgeecomaginationcomreporthtml World Business Council for Sustainable Development (WBCSD) ldquoEco-efficiency Gains Ground United Technologies Corporation (UTC)rdquo WBCSD Case Study August 10005 available from wwwwbcsdorg
Two types of kaizen events to reduce water use include
bull Water Kaizen Events Consider conducting some kaizen events that are specifically designed to find and implement water efficiency opportunities (see Box 14 for examples) Good places to target include processes or areas of facility operations that use significant amounts of water Some companies such as GE use kaizen events to look for water-efficiency opportunities across a single facility Water balances and value stream maps with water data can provide good ideas for where to focus water kaizen implementation activities
bull Kaizen Events on Water-Using Processes Even if the main objective of a kaizen event is not water efficiency itrsquos helpful to keep an eye out for water-efficiency opportunities There may be opportunities to reduce water use such as by adjusting equipment or reusing water while also improving other aspects of the process Use the Key Water-Efficiency Questions in Box 13 above to identify water-savings opportunities
Often when yoursquore looking for water waste perhaps while using strategies described in the last chapter yoursquoll find easy solutions that can be implemented right away These are good things to address with ldquojust-do-itrdquo Lean activities Just-do-its or ldquoquick winsrdquo are actions that individuals can take immediately to improve a process or operation Many actions to stop water losses (such as fixing leaks or shutting off water that shouldnrsquot be running) or simple equipment adjustments to conserve water (such as reducing water flow) fall in this category
43
Chapter 4 Lean and Water Efficiency Improvement Strategies
Water Efficiency Strategies Ways to reduce water use range from simple strategies such as adjusting the flow of water or install-ing water-saving devices on equipment to more involved options such as reusing water or changing to a low-water or waterless process There are five general types of water-saving strategies (see Fig-ure 15) Consider these strategies as you brainstorm improvement ideas in kaizen events and other Lean efforts Key things to keep in mind include
bull Consider water efficiency improvements in the context of other process improvements and Lean performance goals in order to get the best results
bull Evaluate how the process changes might affect wastewater volume or quality or have other environmental impacts (For example switching from a water-based lubricant to an oil-based lubricant or solvent could have implications for worker health andor the environment)
bull Consider which water-efficiency best management practices and technologies make sense for your facility
bull Adopt visual controls ldquomistake proofrdquo devices on equipment (eg automatic shut offs) andor procedures to help ensure that process changes are effective and can be easily maintained
bull After testing potential solutions making changes and evaluating actual performance be sure to develop or update the standard work for the activity so that workers can eas-ily identify the current best way to perform an activity (Standard work is also further discussed below)
Figure 15 Five Water-Savings Strategies
Mor
e D
ifficu
ltBi
gger
Impa
ct 3 Adjust water flow
3 Modify existing equipment or install water-saving devices
3 Change to more water-efficient equipment
3 Reuse or recycle water (treat if needed)
3 Shift to a low-water or waterless process
When evaluating water reuse opportunities itrsquos important to consider both water quality and water quantity Not all processes need the cleanest highest-quality water In many cases you may be able to reuse the ldquowasterdquo water from one process or operation as an input to another process or for another use at your facility (eg air handling condensate reverse osmosis reject water etc) as long as you match the quality of water needed for its intended use You may need to do some testing
Chapter 4 Lean and Water Efficiency Improvement Strategies
and additional treatment of the process water to make sure it is acceptable for the next use When evaluating the feasibility of using process water for irrigation or other outdoor uses check with your local utility or water pollution control agency about restrictions on water reuse applica-tions The water may require testing to ensure it meets pollutant limits
Waterless Cleaning of GatoraderegBottles (Box 15)
PepsiCo switched from cleaning Gatoradereg bottles with water to a new method of cleaning with purified air The new cleaning process works so well that it is being adopted by bottling facilities around the world achieving a 20 percent reduction in water consumption throughout the process and saving billions of gallons of water
You can use the Table for Evaluating Water Reuse Potential below as a simple guide to identify possible ways to reuse water to meet the water quality and quantity needs of processes You may also want to consider using reclaimed municipal water or water from another facility for certain uses For more information on water reuse strategies consult EPArsquos Guidelines for Water Reuse (wwwepagovnrmrlpubs625r04108625r04108pdf)
Table 6 Table for Evaluating Water Reuse Potential
Process Operation
Water Need Water Discharge
Volume Quality Volume Quality
Cooling
Boilers
Restrooms
Kitchen
Landscape
Process A
Process B
Process C
It may be possible for your facilityrsquos water to be reused by another industry or business Look for these potentially symbiotic relationships with other facilities in order to stretch the value of your water even further for the community
44
45
Chapter 4 Lean and Water Efficiency Improvement Strategies
Integrate Water Efficiency into Everyday Lean Practices A variety of Lean toolsmdashincluding standard work visual controls 5S and total productive main-tenance (TPM)mdashhelp workers identify and eliminate waste in their daily activities as described further below Along with other wastes these Lean tools can reinforce and promote strategies to reduce unnecessary water use
Waste Elimination Culture You can integrate water efficiency into the ldquoculture of Leanrdquo at your facility developing the capac-ity of your employees to identify water waste in their normal work practices and find solutions that help meet your facilityrsquos Lean and water goals When your workers are passionate about improving the way your facility uses water the gains you achieve can become self-sustaining into the future
Lean is built around the framework of eliminating waste and striving for perfection or ldquoTrue Northrdquo as discussed in chapter 1 It is most successful when employees are fully engaged in driv-ing out waste and identifying improvement opportunities In the long run developing people to be effective problem solvers is more important than implementing specific tools It is critical therefore to train employees on how to identify water waste and to encourage and motivate them to work towards your organizationrsquos water efficiency goals The use of goals or targets combined with incentives and support resources can be a powerful way to drive change and performance improve-ment Frito-Layrsquos ldquoGallon per Pound Challengerdquo Program described in Box 16 provides an example of a successful water efficiency program anchored by metrics and employee engagement
Figure 16 Sign to Encourage Water Conservation
46
Chapter 4 Lean and Water Efficiency Improvement Strategies
Frito-Lay Engaging Employees in Water Efficiency (Box 16)
Frito-Layrsquos ldquoGallon per Pound Challengerdquo established a water efficiency pro-gram for all manufacturing sites to exceed 95 percent water use efficiency The program creates a culture of conservation through awareness trainingand accountability
3Through mid-year 2007 the sitesrsquo collective water efficiency has improved to over 80 percent which translates to a reduction in water use of over 1 billion gallons per year
3 Achieving the goal of 95 percent minimum efficiency for all sites will result in an additional water savings of approximately 800 million gallons per year
3 Frito-Lay earned a 2007 Water Efficiency Leader Award from EPA for these water-efficiency efforts
The Challenge is anchored by a water efficiency scorecard which is emailed to a wide array of stakeholders monthly
3Water efficiency is calculated by dividing standard water consumption by the actual water consumption reported by the site If a site uses more water than the standard an efficiency score of less than 100 percent will result
3The scorecard includes monetary savings opportunities for sites operating below 100 percent efficiency as well as savings associated with improve-ments
3Periodically a ldquodid you knowrdquo section with best practices is distributed with the scorecard to help raise awareness
Frito-Layrsquos utility wall program involves an event held at each site each day where a cross-functional team of technicians and workers gather to compare actual water consumption over the prior 24-hours to standard consumption and the sitersquos goals
3Utility walls enable teams to identify excessive water use and develop ac-tion plans to find and correct sources of variance
3Teams identify areas where flow measurement and control devices can drive conservation and ensure that viable water-efficiency projects are com-pleted and working optimally
Standard Work Standard work refers to an agreed-upon set of work procedures (sometimes referred to as standard operating procedures) that establish the best and most reliable method of performing a task or operation Standard work helps sustain previous Lean improvements as well as serves as the founda-tion for future continuous improvement (kaizen) efforts Incorporating water-efficient practices into
47
Chapter 4 Lean and Water Efficiency Improvement Strategies
standard work for processes helps to make them common practice
Whenever you change operational practices to reduce water use or install new equipment that requires different operations be sure to update the standard work for those operations Water-efficiency strategies include both behavior changes and technological changes but even technology-based changes may involve a behavior component For example workers need to properly operate and maintain new water-efficient equipment Use standard work to reinforce desired behaviors
Visual Controls Often used as part of standard work visual controls support standardized procedures and display the status of an activity so every employee can see it and take appropriate action Visual controls make it easier to perform actions the correct way and notice when there are problems
Visual controls are essential for supporting behavior-based water Figure 17 Dual Flush efficiency strategies Examples of visual controls to encourage Toilet Visual Control water efficiency include
bull Signs to encourage employees to use less water
bull Placards on water-using equipment showing proper operation (eg could include optimum water flow level)
bull Water meters or sub-meters on high water using processes or equipment (see discussion in chapter 3)
bull Displays of facility water use and water-use reduc-tion goals on production control boards along with other performance metrics (cost quality timesafety environmental etc)
5S Another way to incorporate water efficiency into Lean is through 5S 5S is a systematic five-step pro-cess used to create and maintain a clean orderly work environment Many organizations add a sixth ldquoSrdquo for safety creating 6S (5S + Safety) The six pillars of 6S consist of
bull Safety (Respect workplace and employee) Create a safe place to work by removing workplace hazards
bull Sort (Get rid of it) Separate items that are not needed in the work area
bull Set in order (Organize) Organize the items that remain in the work area
bull Shine (Clean and solve) Clean and inspect equipment and the work area
48
Chapter 4 Lean and Water Efficiency Improvement Strategies
bull Standardize (Make consistent) Standardize cleaning inspection and safety practices
bull Sustain (Keep it up) Maintain a clean orderly and safe work area
Figure 18 Six Pillars of 6S (5S + Safety)
Source Adapted from Productivity Press Development Team 5S for Operators 5 Pillars of the Visual Workplace Productivity Press 1996
49
Chapter 4 Lean and Water Efficiency Improvement Strategies
One key step that is relevant to reducing water use is ldquoShinerdquo since water is often used in cleaning and rinsing Many industrial and manufacturing businesses use large amounts of water to flush lines rinse parts and tanks and clean equipment floors and other areas These cleaning and rins-ing practices often are large sources of wasteful water use and therefore opportunities for water savings Educate employees on how to do the ldquoShinerdquo step using less water considering some of the Water-Efficient Cleaning Strategies in Box 17 below
Since employees work attentively to maintain a clean and neat work environment in 5S it presents a good opportunity to spot water waste In daily 5S shop floor sweeps encourage employees to check for water leaks in pipes hoses plumbing fixtures and equipment as well as turn off water that shouldnrsquot be running Add checking for leaks to 5S checklists and other approaches implemented under ldquoStandardizerdquo and ldquoSustainrdquo steps so it becomes standard practice
Water considerations are also relevant to ldquoSafetyrdquo Preventing water from being on the shop floor and walkways can eliminate slipping hazards Repairing hot water and steam leaks can prevent burns
Water-Efficient Cleaning Strategies (Box 17)
Dry Clean-up First
3Use brooms brushes squeegees andor other tools to remove materi-als and debris in dry form before using water for secondary cleaning (This saves water reduces wastewater and enables recovery of process materi-als)
Eliminate Unnecessary Water Use for Floor Washing
3 Sweep or use a water broom instead of hosing floors
3 Spot mop if necessary
ldquoMistake-Proofrdquo Your Equipment
3 Use hoses that have automatic shut-off nozzles
3 Use efficient spray nozzles high-pressure washers andor flow restrictors to clean efficiently while reducing water use (High-pressure low-volume sprays generally work better than low-pressure high-volume sprays)
Use Efficient Spray Washing and Rinsing Techniques
3 Use water wisely and turn off water when not in use
3 Do not use a hose as a broom doing so wastes time water and energy
3 Optimize spray and rinsing techniques and document the best practices in the standard work for the process
For more suggestions see North Carolina Department of Environment and Natural Resources ldquoWater Efficiency Manual for Commercial Industrial and Institutional Facilitiesrdquo May 2009 wwwp2paysorgref0100692pdf
50
Chapter 4 Lean and Water Efficiency Improvement Strategies
Total Productive Maintenance As a key strategy for finding and preventing water losses as well as other equipment failures Total Productive Maintenance (TPM) is also relevant to water efficiency TPM is a Lean method that focuses on optimizing the effectiveness of manufacturing equipment TPM focuses on team-based maintenance that involves employees at every level and function
A key practice in TPM is to maintain equipment in a manner that enables workers to quickly iden-tify and correct problems that may result in leaks or spills Since many facility operations use water not just production processes itrsquos important to extend the preventative maintenance practices of TPM to non-production areas (eg restrooms and irrigation) when looking for water issues Box 18 outlines Proactive Maintenance Tips to Reduce Water Use that can be incorporated into a TPM program For more tips and suggestions see EPArsquos ldquoWaterSense at Work Best Management Practices for Commercial and Institutional Facilitiesrdquo available at wwwepagovwatersense
Proactive Maintenance Tips to Reduce Water Use (Box 18)
3Adopt a user-friendly system for reporting water leaks and fix leaksimmediately
3Inspect hot and cold water lines steam lines and traps water-using equip-ment and plumbing fixtures routinely to identify potential problems and keep them operating properly
3When performing maintenance on water-using equipment replace worn parts and check to make sure that water-saving features (eg automatic shut-off valves) are operating properly
3Shut off water supply to equipment in areas that are not in use
Lean and Water Applications for Facility Operations and Support Processes As noted earlier the most water-consuming aspects of your facility may not be production pro-cesses other facility water uses include cooling towers (which are often the largest water end use) boilers support processes restrooms kitchens and irrigation Water balances value stream maps and other strategies in chapter 3 describe how to identify the largest sources of water waste at your facility These represent good targets for kaizen events to reduce water use Consider the Questions to Identify Water-Savings Opportunities in Facility Operations and Support Processes in Box 19 to identify initial opportunities
51
Chapter 4 Lean and Water Efficiency Improvement Strategies
Questions to Identify Water-Savings Opportunities in FacilityOperations and Support Processes (Box 19)
Cleaning
3Can process cleaning or facility cleaning be accomplished without using water (ie using pressurized air to clean products or containers sweeping debris off the floor)
Process Equipment
3Can process equipment reuse water (closed loop) or use reclaimed water from other parts of the facility
Cooling and Heating
3 Has your facility replaced once-through cooling systems with a multi-pass cooling tower or closed systems
3 Can you optimize the blow-downbleed-off controls on boilers and cooling towers
3 Have you considered switching to air-cooled equipment instead of water-cooled equipment
3 Does your facility reuse condensate water
Restrooms and Kitchens
3 Do restrooms have water-efficient fixtures (eg WaterSense labeled toilets and urinals faucet aerators and showerheads)
3 Do kitchens use new water- and energy-efficient dishwashers (eg ENERGY STAR qualified models)
Landscaping and Irrigation
3 Has your facility designed its landscape to consider the local climate and grouped plans by similar watering needs
3 Does your facility use drip irrigation low-flow sprinklers and optimized watering schedules to minimize water use
Leaks
3Have you identified and repaired leaks throughout your facility
Appendix D Water Efficiency Opportunity Checklist is a more extensive checklist for identifying water-savings opportunities throughout your facility
52
Chapter 4 Lean and Water Efficiency Improvement Strategies
Along with the questions in Box 19 and Appendix D a wide array of resources are available that provide information on low-cost water-efficiency measures for common components of facility operations as well as resources that provide guidance and examples relevant to specific industries Consider these water-efficiency strategies in your Lean improvement projects Examples of resources with guidance for specific operations andor industries include
bull ldquoWater Efficiency Manual for Commercial Industrial and Institutional Facilitiesrdquo by the North Carolina Department of Environment and Natural Resources httpsavewaterncorgbushomephp
bull ldquoWaterSmart Guidebookrdquo by the East Bay Municipal Utility District of Oakland California wwwebmudcomfor-customersconservation-rebates-and-services commercialwatersmart-guidebook
bull ldquoWaterSense at Work Best Management Practices for Commercial and Institutional Facilitiesrdquo by EPA Office of Water wwwepagovwatersense
bull ldquoFacility Managerrsquos Guide to Water Managementrdquo by the Arizona Municipal Water Users Association amwuaorgpdfsfacility_managers_guidepdf
See Appendix A for details about these and other water efficiency resources
To Consider
3 What just-do-it actions can you identify to reduce water use
3 What processes or operations would you consider for kaizen events fo-cused on water efficiency
3 What water-reuse options might there be at your facility What steps will you take to learn more about those opportunities
3 What ideas do you have for adding water-efficiency practices into everyday Lean practices (eg through Lean training use of metrics incentive pro-grams standard work visual controls 5S TPM on water-using equipment or other means)
3 What other ideas do you have for reducing water use with Lean or other process improvement efforts
53
CHAPTER 5
Lean and Water Beyond the Factory Floor
Looking beyond your facility operationsmdashsuch as your supply chain interactions with your com-munity and how you design productsmdashcan allow you to uncover new ways to reduce water use and risks while adding value and improving business operating conditions and market opportunities This chapter examines
bull Lean and Water Efforts in Your Supply Chain bull Engaging with the Community bull Lean Product Design
Lean and Water Efforts in Your Supply Chain Depending on your industry sector the greatest opportunities for water use reduction may be in your supply chain rather than your facilityrsquos own operations As discussed in chapter 1 compa-nies whose suppliers have water-intensive operations may feel pressures from customers or other stakeholders to reduce water use within their supply chain It is important for your business to understand water use and risks throughout the value chainmdashincluding upstream in supplier opera-tions and downstream in customer activities In particular the water needed to extract and process raw materials may be significant in some sectors while other stages such as product-use are more important for others
Some water impacts in the supply chain can be addressed by engaging your suppliers in your Lean and water efforts The techniques in this toolkit can be applied at both large and small companies Here are some ideas to get started
bull Ask suppliers about their water use and their water efficiency efforts
bull Invite customers andor suppliers to participate in a Lean and water value stream map-ping event water gemba walk or water kaizen event at your facility to learn from your experience and share their perspectives
bull Offer to participate in your customerrsquos andor supplierrsquos Lean events if your business has relevant expertise
bull Share training materials yoursquove developed best practices and success stories of your Lean and water efforts to educate suppliers on these efforts
bull Invite suppliers to participate in training sessions with your employees For example the furniture manufacturer Steelcase invites its suppliers to attend workshops covering Lean and environment topics at its ldquoSteelcase Universityrdquo
54
Chapter 5 Lean and Water Beyond the Factory Floor
bull Start a dialog with your suppliers about Lean and water projects to initiate together
bull Encourage suppliers to develop and share short- and long-term water reduction goals and report progress against the goals
bull Provide incentives recognition andor financial support for suppliers to conduct Lean and environmental improvement efforts andor for suppliers that help you meet your water efficiency goals
bull Consider focusing first on suppliers that are located in water-scarce areas where reduc-ing water consumption can have the greatest positive impact on community relations
For some smaller companies working with your supply chain may be more challenging than is the case for larger companies One option for smaller facilities is to inform your suppliers that they may access resources available through local utilities such as technology rebates or free or subsidized water audits
Dubois Chemical and Steelcase An Innovative LeanWater Supplier Partnership (Box 20)
Furniture manufacturer Steelcase worked with Dubois Chemical on a demon-stration project exploring an alternative pretreatment washing process on one of Steelcasersquos finishing lines
3The team analyzed the total cost of ownership (for energy labor watersew-age and process chemicals) in the current and future state process maps and relied on water recycling and other strategies to save time energy water and chemicals
Due to the projectrsquos success Steelcase has deployed it on seven powder coat-ing lines Results include
3 Saved $1 million per year
3 Eliminated phosphates from pretreatment discharge
3 Met 2007 emergency water-reduction requirements in Atlanta
3 Reduced water use by 80 percent chemical volume used by 20-30 percent and waste discharged by 85-95 percent
3 Saved 45 million gallons of water per year Sources SteelcaseDubois info from Mary Ellen Mika and Keith Lane ldquoJoint Case Study Reducing Your Water Foot-printrdquo presentation at 23 September 2008 Corporate Climate Response Conference Mary Ellen Mika et al ldquoE3 and GSN Learning Evolving and Expandingrdquo presentation at 2011 Manufacturing Innovations Conference
55
Chapter 5 Lean and Water Beyond the Factory Floor
Some companies participate in Lean supply chain initiatives that focus on environmental objectives such as water use reduction For example in the US Green Suppliers Network Program Lean ser-vice providers at Manufacturing Extension Partnership centers partner with environmental special-ists to deliver ldquoLean and Cleanrdquo process assessments for companies in the supply chains of larger organizations on a fee-for-service basis (see Box 21) The assessments use value stream mapping with an added focus on environmental metrics and costs to identify opportunities for improvements in resource use Many of the assessments include support for implementation A similar program called E3 (Economy Energy and Environment) incorporates Lean environmental and energy technical assistance and also involves local utilities as partners19 Companies should encourage their suppliers to consult their local water and energy utilities to find rebates or incentives for efficient technologies and process improvements
Green Suppliers Network Lean and Water Successes (Box 21)
Southwire and Pacific Gas amp Electric (PGampE)
3 Southwire a manufacturer of wire and cable products and a key supplier of PGampE participated in a Green Suppliers Network review in 2008 at its Car-rollton Georgia plant
3 Based on the value stream map-based review and the teamrsquos recommenda-tions the facility implemented a water-looping system that recycled water without affecting product quality
3 These efforts cut facility water use by more than 9 million gallons (over 90 percent) and saved more than $70000 annually
McNeil PPC and Johnson amp Johnson
3 McNeil-PPC Inc which manufactures Listerinereg products for Johnson amp Johnson participated in a Green Suppliers Network review project in 2007 with the support of Johnson amp Johnson
3 With value stream mapping the team found that 450 gallons of Listerinereg and 60 gallons of water were wasted per line change
3The team recommended solutions to minimize changeover wastes These recommendations have significantly reduced the amount of water that the facility would otherwise use
3With changes such as reusing water for boilers using flavors instead of water to clean equipment sequencing flavors from light to dark switching to waterless conveyor belts and using closed-loop cooling the facility has cut wastewater discharge by 25-30 percent
Sources Green Suppliers Network wwwgreensuppliersgovresultssuccesshtml and information provided by Char-lie Souders Johnson amp JohnsonMcNeil Consumer Healthcare June 29 2011
19 For more information on the Green Suppliers Network see wwwgreensuppliersgov and for more information on the E3 initiative see wwwepagovgreensupplierse3html
56
Chapter 5 Lean and Water Beyond the Factory Floor
Another way that companies can influence supplier actions is through policies and programs that encourage water efficiency Examples include
bull Procter amp Gamble (PampG) has adopted a Supplier Environmental Sustainability Score-card which produces annual supplier sustainability performance ratings for suppliers based on environmental data and qualitative assessments the suppliers provide which include data on water use Suppliers receive higher ratings for contributing to PampGrsquos environmental initiatives and PampG recognizes suppliers receiving the highest rating in the process20
bull PepsiCo has a Supplier Sustainability Outreach Program in which suppliers regularly submit metrics to track their progress toward short-term and long-term goals in energy water and waste efficiency The program prepares suppliers to join ENERGY STAR which is required for all US-based suppliers Suppliers gain access to PepsiCo resourc-es training tools and an invitation to the Global Environmental Sustainability Sum-mit Fuel electricity and water savings from the program totaled $12 million as of the third quarter of 2010 Forty co-packers and suppliers across 102 manufacturing sites participate and the program continues to expand in the United States and globally
bull Levi Strauss amp Co is adjusting its policies to allow more water recycling and reuse at contract finishing facilitiesmdashit now allows reclaimed water to be used at finishing facilities through onsite treatment internal recycling or from a nearby treatment facil-ity Uses for reclaimed water include landscaping toilets and heating ventilation and cooling systems
bull Wal-Mart provided over 100000 suppliers with a sustainability survey to collect infor-mation about their environmental performance The survey includes questions on the total water use of facilities that produce products for Wal-Mart as well as guidelines for conducting a water footprint and improving water efficiency at facilities Future phases of Wal-Martrsquos ldquoSustainability Indexrdquo project include the development of a database of information on product lifecycles and a tool to help merchants and customers under-stand the sustainability of products21
Consider the following five strategies to promote Lean and water efficiency efforts with your suppli-ers keeping in mind that some of these might be less feasible or applicable for small facilities
bull Require reporting from suppliers Requests for reporting on water use and effi-ciency efforts sends a message to supply chain businesses that the company cares about water It may also help you understand business risks and opportunities to assist suppli-ers in reducing water use or risk Benchmarking of water metrics (eg water intensity
20 For more information about PampGrsquos sustainability work with suppliers see wwwpgcomen_USsustainabilityenvironmental_sus-tainabilityoperations_supplierssupplier_engagementshtml
21 For more information on Wal-Martrsquos Sustainability Index see httpwalmartstorescomSustainability9292aspx
57
Chapter 5 Lean and Water Beyond the Factory Floor
ratios that relate water use to production levels) may be useful to set goals and perfor-mance targets Companies can encourage suppliers to utilize ENERGY STARrsquos Portfolio Manager or other tools to track environmental performance
bull Examine product specifications Evaluate how procurement requirements affect the amount of water required to produce or transport the product to facilities Some com-panies may be able to reduce the water used in their supply chains by changing their sourcing specifications
bull Provide recognition awards andor incentives Recognizing supply-chain water and environmental initiatives can raise awareness of and encourage water use reduc-tion and best-practice sharing among suppliers Stories of water-saving efforts may also be of interest to customers
bull Consider supplier requirements It may be appropriate to consider water-related performance in the selection of suppliers particularly in water-intensive parts of your supply chain Performance targets or certification requirements (eg ISO 14001) could also be incorporated into procurement requirements or partnership agreements Consider developing sector-specific standards to reduce overall environmental impacts (eg the Business and Institutional Furniture Manufacturersrsquo Association Sustainability Standard)22
bull Provide subsidize or make referrals for technical assistance Companies can provide technical assistance or training on Lean and water approaches to supply chain partners Alternatively encourage participation of supply chain partners in ldquocommuni-ties of practicerdquo to share information on water efficiency and environmental improve-ment opportunities Manufacturing Extension Partnership centers provide support for Lean training and can help you integrate water efficiency considerations into your sup-ply chain Organizations can also make suppliers aware of water efficiency resources and services available from local utilities and other sources
bull Collaborate on joint Lean and water projects Collaborate with your suppliers and or your customers to develop approaches to reduce water use and risks or to capture new market opportunities Consider using the ideas strategies and tools in this toolkit as a starting point for a discussion about Lean and water opportunities to pursue
22 This standard is available at wwwbifmaorgpublicSusFurnStdhtml
58
Chapter 5 Lean and Water Beyond the Factory Floor
Levi Strauss amp Co and the Better Cotton Initiative (Box 22)
Levi Strauss amp Co completed a third-party lifecycle assessment to understand the environmental impact of an iconic product Levirsquosreg 501reg jeans The com-pany discovered that
3 Forty-nine percent of water consumption for Levirsquosreg 501reg jeans occurs in cotton production while another 45 percent occurs after consumers take the products home
3 The remaining water use is divided among fabric production (2 percent) finishing (3 percent) and retail (1 percent)
Recognizing the importance of the cotton production stage Levi Strauss amp Co joined the Better Cotton Initiative (wwwbettercottonorg) in 2008 to change the way it grew cotton
3 The Better Cotton Initiative seeks to make global cotton production better for the people who produce it better for the environment and better for the apparel sectorrsquos future
3 Pilot projects in countries such as Brazil India Mali and Pakistan work to reduce the environmental impacts from cotton production while supporting local economies
3 In Pakistan participating farms cut water use by over 30 percent 117 bil-lion cubic meters of irrigation water in 2010
Source Levi Strauss amp Co ldquoCEO Water Mandate Communication on Progress 2010rdquo wwwlevistrausscomsites
defaultfileslibrarydocument201012lsco-ceo-water-mandate-cop-2010pdf
Engaging with the Community In many cases water stewardship is a key component of a facilityrsquos ability to operate in a communi-ty Depending on where your facility is located your business and the surrounding community may face different types of water resource challengesmdashsuch as water scarcity infrastructure or pollution concerns Especially in water-scarce regions or during droughts people in the community may have an increased interest in what your facility is doing to reduce its impacts on local water resources Indeed community engagement is recognized as a key pillar of water resource management by the United Nations CEO Water Mandate which assists companies in developing and implement-ing sustainable water policies and practices23 Engaging proactively with your community on water conservation can be an effective way to mitigate water-related business risks as well as reduce your organizationrsquos overall water footprint
23 The UN CEO Water Mandate is available at wwwunglobalcompactorgIssuesEnvironmentCEO_Water_Mandate
59
Chapter 5 Lean and Water Beyond the Factory Floor
Two key strategies for effective community engagement include
bull Educate and engage your employees in water-efficiency efforts at your facility and encourage them to adopt similar practices at home (eg check for leaks use efficient appliances and faucets turn off water when not in use etc) Build the capacity of employees to spot water waste and problem solve throughout their daily activities on the job and off
bull Partner with community members and local organizations to conduct projects that improve water use water quality andor water infrastructure resources in the com-munity Consider using Lean methodsmdashsuch as a waste walk kaizen event or even a Lean design eventmdashto rapidly brainstorm and test improvement ideas for projects and include community stakeholders in those efforts
Along with the value of community engagement these strategies can have the benefit of partially or fully ldquooffsettingrdquo impacts the facility may have on local water resources That is a facility can sup-port efforts that replenish the local water supply by at least the amount of water the business uses directly In India PepsiCo has achieved a positive net water balance in this way (see Box 23)
PepsiCorsquos Positive Water Balance Project in India (Box 23)
At its facilities in India PepsiCo achieved a ldquopositive water balancerdquomdashwhere businesses contributed more water to the communities than they consumedmdash in 2009 and 2010
3 Savings of over 3 billion liters of water in 2009 and over 4 billion liters in 2010 have been verified externally by Deloitte LLP
As part of these efforts PepsiCo India has
3 Reduced water usage in manufacturing by 45 percent since 2005
3 Partnered with government agencies and local organizations to increase peoplersquos access to clean water
3 Worked with agricultural universities to promote ldquodirect seedingrdquo of rice paddies which allows seeds to be directly planted into the soil (without the need for a nursery) and avoids the need for flood irrigation (This reduces water use by up to 30 percent)
3 Saved over 5 billion liters of water from 6500 acres of direct-seeded paddy fields
3 In 2010 PepsiCo began working with the Nature Conservancy to explore ways to credibly achieve a positive water impact across its global operations
Source PepsiCo ldquoReplenishing Water Conserving the worldrsquos most precious asset Waterrdquo httppepsicoindiacoin
purposeenvironmental-sustainabilityreplenishing-waterhtml accessed 28 July 2011
60
Chapter 5 Lean and Water Beyond the Factory Floor
Businesses can use Lean tools to engage with communities in collaborative problem solving to achieve social economic and environmental goals such as water efficiency For example DTE Energymdasha Detroit Michigan based electric utilitymdashhas used tools including gemba walks value stream maps and ldquocritical-to-sustainabilityrdquo trees (a modification of ldquocritical-to-qualityrdquo trees) with Detroit area businesses and community members to tackle the following projects
bull Partnered with a non-profit to manage combined sewer overflows by planting thou-sands of trees to reduce the stormwater runoff in Detroit
bull Found a new use for the buffer land around substations as community gardens with thousands of pounds of produce harvested at each substation and donated to food pantries
bull Created a community-supported agriculture business model based on a gemba walk with the community that identified issues such as urban blight meaningful work neighborhood connectivity and healthy living
In areas where water scarcity and drought are issues facilities can engage with communities to share knowledge work toward solutions and build goodwill Here are two examples of companies who engaged in collaborative dialogue with their communities in response to problems with water scarcity in areas where their operations were located
bull Coca-Cola partnered with the United Nations Development Programme and Chinese government representatives to improve water efficiency in response to a severe drought threatening sugarcane growers The first phase will be completed in 2011 and will focus on improving infrastructural facilities that support the farmersrsquo work and life directly such as optimizing irrigation facilities and recycling treated wastewater from sugar plants to improve farm production and water use efficiency This first phase will provide approximately 500 million liters of water to rural residents and directly benefit 100000 rural sugarcane farmers in the region In future phases this collaboration will pursue improvements in water efficiency in business operations and will seek to ease pressure on local water supplies through continuing community water partnerships24
bull The chemical manufacturer Sasol identified water scarcity as a risk to its operations in South Africa and pro-actively approached the problem by organizing a joint dialogue with community stakeholders representatives of water-intensive industries in South Africa government and non-governmental institutions and local research institutions The dialogue promoted cooperation among the stakeholders and between Sasol and its surrounding community as the sharing of knowledge and experiences coalesced toward the formulation of several ideas for collective action toward improved water efficiency25
24 For more information about Coca-Colarsquos work with sugarcane growers in China see wwwthecoca-colacompanycomdynamic bullpress_center201103chinas-sustainable-sugarcane-initiativehtml
25 For more information see httpsasolsdrinvestoreportscomsasol_sdr_2008page_id=141
61
Chapter 5 Lean and Water Beyond the Factory Floor
Lean Product Design Lean design methods are a group of Lean tools and techniques that aim to
bull Design (or redesign) high-quality products that meet customer needs with the least amount of waste (aspects that do not add value) andor
bull Design (or redesign) processes and equipment that add value to products using the least amount of time material and capital resources
Taking a close look at the parts and processes that go into the creation of a product can help you to identify wastes including water waste and improve product quality reduce costs and potentially gain market advantage
Lean product design methods often rely on a set of criteria to evaluate the best alternatives Incor-porating efficient water use as a design criterion for product development can reduce water waste throughout the entire life cycle of the product Consider raw materials synthesis production customer use and the ultimate disposal or recyclingremanufacturing of the product when consid-ering water use
As with other aspects of Lean implementation product design is most effective when it incorporates ldquowhole systemsrdquo thinking focused on eliminating all forms of waste Be sure to consider traditional Lean goals for both the product and the manufacturing process such as product quality customer service cost and time when you incorporate water efficiency into the Lean product design pro-cess Improving water efficiency should not mean lowering the quality of your finished product or decreasing the productivity of your facility Note that sometimes design alternatives that improve water efficiency can present trade-offs in which decreasing water use results in increased en-ergy or chemical use such endeavors may not be worthwhile depending on the overall impacts You can help ensure that your product quality remains high by adhering to product quality design standards such as the US Green Building Councilrsquos LEED standards for buildings26 EPArsquos Water-Sense program standards for certain water-consuming products and appliances27 and sector-specific product standards
There are several Lean tools to help design (or redesign) a product in a way that reduces wastes Some of these tools are described in Table 7 below For more information about these tools and an explanation of which tools to use in various product design stages see chapter 6 of The Lean and Chemicals Toolkit28
26 The US Green Building Councilrsquos Leadership in Energy and Environmental Design (LEED) standards are available at wwwusgbc orgDisplayPageaspxCategoryID=19
27 For more information about the US EPA WaterSense Program see wwwepagovWaterSense 28 Available at wwwepagovleanenvironmenttoolkitschemicals
Chapter 5 Lean and Water Beyond the Factory Floor
Table 7 Methods Used in Lean Design29
Method Description
3P (Production Preparation Process or Pre-Production Planning)
An integrated and highly detailed approach to product andor process development which involves rapidly designing production processes and equipment to ensure capability built-in qual-ity productivity and flow 3P minimizes resource needs such as capital tooling space inventory and time
Design for Lean Six A method for designing processes that support Sigma Lean Six Sigma objectives such as reduced vari-
ability to improve yield reduce waste and accel-erate time-to-market
Design for Manufacturing amp Assembly
A simultaneous engineering process designed to optimize the relationship between design func-tion manufacturability and ease of assembly
Failure Mode amp Effects A design review methodology that focuses on Analysis identifying the potential failure modes of a prod-
uct and subsequently determining ways to miti-gate each risk of failure
Quality Function Deployment andldquoVoice of the Customerrdquo
An overall methodology that begins in the design process and attempts to map the customer-defined expectations and definition of quality into the processes and parameters that will fulfill them It integrates customer interview and market research techniques with internal cross-functional evaluations of the requirements
Value Engineering An organized methodology that identifies and selects the lowest lifecycle cost options in de-sign materials and processes that achieves the desired level of performance reliability and cus-tomer satisfaction It seeks to eliminate unneces-sary costs in the above areas and is often a joint effort with cross-functional internal teams and relevant suppliers
29 For additional information about many of these tools see Mascitelli Ronald The Lean Design Guidebook Technology Perspective Northridge CA 2004 See also EPArsquos webpage on 3P wwwepagovleanthinkingthreephtm
62
Chapter 5 Lean and Water Beyond the Factory Floor
Table 8 lists examples of questions to ask when evaluating product design alternatives to identify ways to reduce water waste during all phases of the product life cycle
Table 8 Questions to Ask During Lean Product Design
Life Cycle Phase Questions to Ask
Sourcing Materials 3 Will raw material production prior to manufacture and Inputs involve intensive use of water
3 Can you switch to materials that require less water in their production or work with suppliers to reduce water use
Production 3 Will water be used to manufacture the product Manufacturing Evaluate all new equipment and modifications
3 What steps can be taken to reduce the amount of water that will be used to manufacture the product (eg switch to water-less processes reuse water etc)
3 How can you design products to reuse water in multiple process steps (eg recovering rinses from cleaning counter-current flow or refiltering water)
Product Distribution 3 How much water will the product require during Use and Disposition use
3 What product design alternatives use less water (eg through reuse systems water-efficient fea-tures etc)
3 What steps can you take to ensure that product performance is maintained as you implement water efficiency improvements
3 How will the product design affect customer water use Can reductions in the product use phase be guaranteed
3 How can the design ensure customers will be satis-fied with product performance even with reduced water use
Some companies report that the ldquoseven waysrdquo method provides a useful means to identify a more diverse creative set of improvement options to address specific water-related needs This method is often used in the Lean design process This method typically involves brainstorming of seven alter-native approaches for addressing a specific improvement opportunity Sometimes teams are encour-
63
64
Chapter 5 Lean and Water Beyond the Factory Floor
aged to look at how similar tasks are accomplished in the natural world to spark creative thinking on alternatives The team then scores the seven alternatives using pre-established weighted criteria to select the preferred solution Consider incorporating water efficiency into these criteria (water used to manufacture andor full life-cycle water use) to ensure that product design alternatives are evaluated according to your Lean and water efficiency goals
Examples of Water Conservation through Product Design (Box 24)
GE used the 3P (Production Preparation Process) Lean strategy to launch a new water-saving product line
3Geospringtrade hybrid water heaters dishwashers and top-loading washing machines are being redesigned from scratch using Lean manufacturing techniques
3Production team members from engineers to technicians now work together in a cross-functional approach that involves everyone from design through production using scaled-down equipment and product mockups to visualize improvements
3This hands-on whole-team approach has allowed employees to make ad-justments in real-time allowing problems to be identified early and produc-ing dramatically simpler designs that cut total product development time
Levi Strauss amp Co examined the design of its popular blue jeans to identify ways to reduce the water used to manufacture the product
3 WaterltLesstrade jeans reduce water consumption by an average of 28 per-cent and up to 96 percent for some new products
3These water savings were accomplished by reducing washing cycles incor-porating ozone processing into washing and removing water from stone washing
3While the production of Levirsquosreg blue jeans like many products uses a sig-nificant amount of water in the supply chain as well as through consumer end use the company made significant progress by addressing water use in the manufacturing process
As described earlier in this chapter there is great potential for water savings throughout a productrsquos supply chain including the acquisition of resources and raw materials as well as the water that customers will use with the product or service However if you are just getting started with Lean consider focusing first on water use within your facility before branching into your supply chain and customer-use considerations
65
Chapter 5 Lean and Water Beyond the Factory Floor
To Consider
3What parts of the extended value chain of your enterprise use the most water If you donrsquot know how will you find out
3Have you talked with any of your suppliers about Lean and environmental improvement efforts
3What opportunities are there to offset water impacts and improve water resources for the local community
3What changes could you make to the design of your products to reduce water wastes
Lean and Water Toolkit
67
CHAPTER 6
Conclusion
This chapter includes the following sections bull Your Lean and Water Journey bull Concluding Thoughts
Your Lean and Water Journey We hope that this toolkit has provided you with practical ideas to leverage Lean methods to identify and eliminate water waste at your facility Learning to see water waste and to identify improvement opportunities using Lean tools will help you to save money and be a better partner to your com-munity by placing less of a burden on local water supply There are many tools and techniques to get started with using Lean to reduce water waste As described in more detail in chapter 1 here are three ways to get started with Lean and water efforts
bull Learn more about how your facility uses water Connect with environment and facilities personnel to discuss opportunities to reduce water waste with Lean Find water waste in your facility using tools like metering and water balances
bull Engage employees in lean and water improvement efforts Involve employees in teams to brainstorm ways to reduce water use encouraging their ideas to innovate improvement opportunities Try out some of the strategies for eliminating water waste that are described in this toolkit
bull Connect Lean and water efforts to sustainable water management strategies Use Lean tools to support a broader corporate water sustainability strategy Identify what the ldquoTrue Northrdquo goals and targets are for water use at your facility and track progress to inspire improvement and creative solutions Look beyond direct operations to engage your customers suppliers and communities
Many of the techniques in this toolkit can help you reduce water waste and identify savings rapidly however it is important to think about the bigger picture of how water is used across your organiza-tion Figure 2 repeated below from chapter 1 illustrates how the tools and techniques described in this toolkit can help you to address water use throughout your value chain
68
Chapter 6 Conclusion
Figure 2 Lean and Water Implementation Strategies
Understand Water Uses and Costs (Chapter 2)
Find Water Waste (Chapter 3)
Improve Operations and Processes with Lean and Water Strategies (Chapter 4)
Extend Lean and Water Efforts Throughout the Value Chain (Chapter 5)
Sourcing Materials and Inputs (Chapter5)
Production Manufacturing (Chapters 3 and 4)
Product Distribution Use and Disposition (Chapter 5)
Concluding Thoughts We hope this toolkit spurs creative thinking and energy within your organization and encourages you to explore these opportunities We aim to periodically release new versions of resources in EPArsquos Lean and Environment Toolkit series while working with partner companies and organizations to explore ways to improve efficiency using Lean We also hope to learn from your experiences using this toolkit Our goal is to refine the techniques presented provide examples and case studies to il-lustrate the possible benefits of these tools and present new techniques as they emerge We wish you success on your Lean and water journey
Your Thoughts on the Toolkit
Now that you have finished this toolkit reflect on what you read by answering these questions
3 What strategies and tools in the toolkit seemed particularly interesting Which ones were most applicable to your facility
3 What steps will you take next to advance Lean and water efforts at your facility
3 What other information and tools would help your organization to achieve your Lean and water goals
69
APPENDICES
Appendix A Water Efficiency Resources and Technical Assistance Providers This appendix describes resources and places to go for more information concerning the following topics
bull Water Conservation and Efficiency Resources bull Technical Assistance Providers
This appendix focuses on resources that are directly applicable to manufacturing and industrial facilities however some resources and tools may have broader relevance and contain information that will be useful to commercial institutional and residential water users as well as industrial water users
Water Efficiency and Conservation Resources At the Crest of a Wave A Proactive Approach to Corporate Water Strategy Pacific Institute wwwpacinstorgreportscrest_of_a_wave Making the case that businesses and industrial facilities must prepare for water trends this guide helps users to design and implement a two-stage water conservation strategy Case studies and success stories include those from companies such as Unilever Nestleacute Toyota General Motors Anheuser-Busch GE Proctor amp Gamble and more The steps presented help corporations to create a comprehensive approach to managing water risks and opportunities
Collecting the Drops A Water Sustainability Plannertrade Global Environmental Management Initiative (GEMI) wwwgemiorgwaterplanner This web-based tool and downloadable document provides step-by-step guidance and resources to help facilities conduct assessments of their water use and impacts on the water supply Facilities can then use this information to develop water sustainability strategies create action plans and take actions to improve water resource management in their operations and community The planner includes case examples of how GEMI member companies have engaged internal and external stake-holders and generated actions to improve water resource management and conservation Modules include
bull Module 1 Facility Water Use and Impact Assessment Program bull Module 2 Water Management Risk Assessment Questionnaire bull Module 3 Case Examples and Links
70
Appendix A Water Efficiency Resources and Technical Assistance Providers
Commercial Institutional and Industrial (CII) Water Users Manufacturing Introduction Alliance for Water Efficiency wwwallianceforwaterefficiencyorgManufacturing_Introductionaspx The Alliance for Water Efficiency Resource Library webpages offer information on CII water use and efficiency opportunities as well as links to the research and information about this end user catego-ry In manufacturing major uses and topics include cooling water process water steam generation and boilers sanitation irrigation food services and housekeeping The resource briefly discusses the need for and value of water audits for facilities and applying the strategies of reduce reuse and recycle for facility water consumption
Connecting the Drops Toward Creative Water Strategies A Water Sustainability Tooltrade GEMI wwwgemiorgwater This tool presents the business case for water efficiency and provides guidance and case studies on water assessment opportunity identification planning and implementation Five core analytic modules comprise a roadmap to help facilities identify specific steps that they can take to reduce their water use
bull Module 1 Water Use Impact and Source Assessment bull Module 2 Business Risk Assessment bull Module 3 Business Opportunity Assessment bull Module 4 Strategic Direction and Goal Setting bull Module 5 Strategy Development and Implementation
Cooling Towers Water Use Washington State Department of Ecology wwwecywagovtreeequipCThtml Cooling towers are a significant area of water use for many facilities and taking steps to assess and reduce water use in cooling towers can substantially lower a facilityrsquos overall water footprint The Washington State Department of Ecologyrsquos Technical Resources for Engineering Efficiency (TREE) Team created this succinct checklist of conservation suggestions questions to ask during a water use evaluation and suggested data to collect to identify opportunities for water savings from cooling towers
ENERGY STAR Portfolio Manager US Department of Energy and US Environmental Protection Agency wwwenergystargovindexcfmc=evaluate_performancebus_portfoliomanager This tool allows users to track and access information about their facilityrsquos water consumption inad-dition to data about energy consumption Water and energy use and cost data can be managed across multiple facilities in a secure online interface The tool allows you to track multiple water meters for each facility identify meters with customized names and key information benchmark your facili-ties relative to past performance monitor costs and share data with others inside or outside of your organization By tracking energy and water metrics across facilities users can identify opportunities for efficiency improvements and can receive EPA recognition for superior performance
71
Appendix A Water Efficiency Resources and Technical Assistance Providers
Facility Managerrsquos Guide to Water Management Arizona Municipal Water Users Association httpamwuaorgpdfsfacility_managers_guidepdf This guide is intended to help commercial industrial and institutional facilities to identify areas to improve water use efficiency within reasonable economic parameters The guide provides a step-by-step resource for creating a water management plan and includes worksheets on topics such as water consumption history and estimated water balances Several water end uses and options for reducing them are discussed including domestic water use cooling and heating systems landscape water uses and kitchen uses The guide provides planning and policy-setting options water man-agement options and guidance for empowering employees to effect changes to reduce water use
Federal Water Efficiency Best Management Practices US Department of Energy www1eereenergygovfempprogramwaterefficiency_bmphtml The Federal Energy Management Program developed Federal Water Efficiency Best Management Practices in response to an Executive Order requiring federal agencies to find cost-effective ways to reduce their water use in coordination with EPArsquos WaterSense Program Toward the goal of reduc-ing industrial landscaping and agricultural volumetric water consumption by 20 percent by 2020 (relative to a 2010 baseline) FEMP provides best practices for water management planning infor-mation and education programs water auditing and leak detection and reducing water in several end uses including
bull Boilers and steam systems bull Cooling towers bull Water-efficient irrigation bull Single-pass cooling equipment bull Toilets urinals faucets and showerheads
GEMI Local Water Tooltrade GEMI wwwgemiorgGEMIInteractiveToolsaspx By spring 2012 GEMI plans to release a new tool the GEMI Local Water Tooltrade which will be an interactive downloadable module that will help companies evaluate specific sites for water impacts and risks in order to devise site-specific sustainable water management strategies This tool is de-signed to complement the Global Water Tool (described below) which can help a company identify and prioritize risks to its competitive position based on the link between its operations and the external water landscape Companies can then employ the Local Water Tool to further evaluate the high water-risk locations and plan actions to manage those risks
Global Water Tool World Business Council for Sustainable Development wwwwbcsdorgpagesedocumentedocumentdetailsaspxid=221ampnosearchcontextkey=true In order for a facility to manage current and future risks related to its water use the Global Water Tool helps users map their water use and assess risks related to their global operations comparing water needs to local conditions The tool helps calculate water consumption and efficiency compar-ing water consumption data through time to help assess improvements and monitor progress
72
Appendix A Water Efficiency Resources and Technical Assistance Providers
Making Every Drop Work Increasing Water Efficiency in Californiarsquos Commercial In-dustrial and Institutional (CII) Sector National Resource Defense Council wwwnrdcorgwatercacii This guide provides practical suggestions for commercial industrial and institutional facilities to increase their water efficiency Both small-scale concrete steps to take and suggested higher-level strategic approaches toward water efficiency are described The guide includes a list and descrip-tions of available technologies for reducing water consumption by a variety of common end uses
Performing a Business or Industry Water Use and Conservation Audit New Hampshire Department of Environmental Services wwwdesstatenhusorganizationcommissionerpipfactsheetsdwgbdocumentsdwgb-26-16pdf This factsheet provides a short set of steps to audit water use in a business or industrial facility analyze feasibility of conservation measures and develop a conservation plan
Solutions for Sustainable Water Savings ndash A Guide to Water Efficiency General Electric Water amp Process Technologies wwwgewatercomwater_efficiencyindexjsp This guide provides a practical framework for site managers corporate officers engineering firms and water saving advocates to develop a water efficiency objective and meet this objective by ap-plying a variety of tools and metrics The manual covers baseline water footprinting identifying efficiency opportunities optimizing implementing and measuring
Waste Not Want Not The Potential for Urban Water Conservation in California Pacific Institute wwwpacinstorgreportsurban_usage This report presents a comprehensive assessment of water use and conservation potential in the state of California including industrial water use as well as commercial institutional and resi-dential It includes benchmarking data on water use for many industry sectors a description of the methodology for estimating cost and water savings from water conservation strategies and informa-tion on cost-effectiveness of various water conservation and efficiency improvements
A Water Conservation Guide for Commercial Industrial and Institutional Users New Mexico Office of the State Engineer wwwosestatenmuswater-infoconservationpdf-manualscii-users-guidepdf This guide presents the business case for water efficiency offers programmatic steps conservation strategies for indoor and outdoor use and process-specific and mechanical systems and illustrates potential opportunities with fifteen individual case studies
Water Efficiency Manual for Commercial Industrial and Institutional Facilities North Carolina Department of Environment and Natural Resources httpsavewaterncorgbushomephp This comprehensive manual provides sound principles of water conservation strategies for conduct-ing a successful water efficiency program auditing tools water management options and examples
73
Appendix A Water Efficiency Resources and Technical Assistance Providers
for three industry-specific processes textiles food and beverage and metal finishing Practical tools in the guide include assessment checklists step-by-step instructions for conducting a successful wa-ter efficiency program and explanations of approaches such as water balancing The manual details water management options for several common end uses including
bull Sanitary and Domestic Uses bull Cooling and Heating bull Boilers bull Kitchen and Food Preparation bull Commercial Laundries bull Cleaning Rinsing and In-process Reuse bull Reuse and Reclamation bull Landscaping
Water Efficient Equipment and Design A Guide for Non-Residential Construction and Development Austin Water Utility Water Conservation Division wwwallianceforwaterefficiencyorgWorkArealinkitaspxLinkIdentifier=idampItemID=1018 Equipment and design practices for the construction of new industrial and commercial facilities help to build lifecycle water savings into the design of these buildings Major renovations to exist-ing facilities as well as new construction should be undertaken with a careful assessment of ways to reduce the facilityrsquos lifetime water use This guide provides general guiding principles to ensure that facilities are constructed to maximize water conservation and efficiency as well as specific steps and guidelines to follow in all steps of design and construction
Water Footprint Manual Water Footprint Network wwwwaterfootprintorgpage=fileshome This guide provides a thorough description of the practice of water footprinting including practical steps for estimating a water footprint and instructions for assessing the difference between a direct and indirect water footprint This comprehensive guide to water footprinting instructs readers on estimating the footprint of a product as well as that of a business
WaterSense at Work Best Management Practices for Commercial and Institutional Fa-cilities US Environmental Protection Agency wwwepagovWaterSense The WaterSense Best Management Practices which EPArsquos Office of Water developed in coordination with the Federal Energy Management Program are a comprehensive set of recommendations and tips for how commercial and institutional facilities can improve their water efficiency EPArsquos Water-Sense Program helps water consumers identify best practices resources and tools to reduce their water use Commercial and institutional water users can take advantage of lists of water-efficient products to install in their facilities best management practices and other ways to improve water efficiency
74
Appendix A Water Efficiency Resources and Technical Assistance Providers
WaterSmart Guidebook East Bay Municipal Utility District Oakland California wwwebmudcomfor-customersconservation-rebates-and-servicescommercial watersmart-guidebook This extensive guidebook provides information on water-saving technologies currently available to commercial industrial and institutional businesses as well as specific water efficiency strategies and tips for different business types such as paper manufacturing and metal finishing Many water-using technologies such as process water are explored to show the areas in which the most water is used and where it can be saved
Technical Assistance Providers
Water Utility Incentive Programs Many utilities and local governments offer incentive programs to water utility customers to encour-age the efficiency of water use in the industrial commercial and institutional sectors Common approaches include a combination of water audits and rebates to help facilities realize water sav-ings Check with your local utility to see what incentives may be available Some notable programs include those sponsored by the following utilities and localities all of which saw significant reduc-tions of water use by facilities that they serve
bull City of Austin and Austin Water Utility wwwciaustintxuswaterconservation
bull Denver Water wwwdenverwaterorgConservationIncentivePrograms
bull East Bay Municipal Utilities District wwwebmudcomfor-customersfor-commercial-customerscommercial-conservation-rebates-and-services
bull Massachusetts Water Resources Authority wwwmwrastatemauscomsupportwaterconservationmainhtm
bull Metropolitan Water District of Southern California httpwwwbewaterwisecomicphtml
bull City of Phoenix phoenixgovwaterserviceswrcindexhtml
bull City of San Jose Environmental Services Department wwwsanjosecagovesdwater-conservationdefaultasp
bull Seattle Public Utilities wwwseattlegovutilServicesWaterFor_Commercial_CustomersWATER-CONS_200311261707523asp
75
Appendix A Water Efficiency Resources and Technical Assistance Providers
National Institute of Standards and Technology Hollings Manufacturing Extension Partnership wwwnistgovmep The National Institute of Standards and Technology (NIST) Hollings Manufacturing Extension Part-nership (MEP) is a network of manufacturing assistance centers that provide Lean manufacturing training Lean event facilitation and other services to small-to-medium sized businesses to make them more competitive Many MEP centers have experience providing integrated Lean and environ-mental services to businesses or have partnerships with environmental agencies to offer Lean and environment services
Pollution Prevention Resource Exchange (P2Rx) Consortium wwwp2rxorg The Pollution Prevention Resource Exchange (P2Rxtrade) is a consortium of regional pollution prevention information centers in the United States funded in part through grants from EPA These centers all provide pollution prevention information networking opportunities and technical assis-tance services to state agencies local governments businesses and technical assistance providers in their region Regional centers and contact information can be found on the P2Rxtrade website along with their collective information resources on Lean water efficiency and other topics
Appendix B Water Cost Calculator You can use this table to calculate costs associated with water use at your facility Write down the appropriate volumes units and unit costs and multiply volume by unit cost to find the dol-lars spent on each cost area Add these costs to find the total cost Note Unit costs for water may varydepending on the season andor based on water use (eg peak surcharges may apply above a certain level)30
Factor
Costs to Consider (Excluding Labor amp Maintenance
Costs)
Examples Description Vo
lum
e
Uni
ts(g
allo
ns)
Uni
t Cos
t ($
per
gal
lon)
Tota
l Cos
t (d
olla
rs)
Sup
ply
Base Purchase Price
Utility (eg 10 cents per gallon)
$ $
Peak Package Demand
(eg additional 1 cent per gallon for water supply over 10000 gallons)
$ $
Pumping costs (if self supplied)
Well-sourced $ $
Purchase of pre-treated water
Deionized dealkylized ultra-pure softened
$ $
Coo
ling
Energy Power to chillers towers etc re-ducing heat load of wastewater prior to release
$ $
Chemical For towers chill-ers coolants
$ $
30 Several resource tracking tools that may also be relevant These include Energy amp Materials Flow amp Cost Tracker from the North-east Waste Management Officialsrsquo Association wwwnewmoaorgpreventionemfact Water Conservation Tracking Tool (for water utilities) from Alliance for Water Efficiency wwwallianceforwaterefficiencyorgTracking-Toolaspx and Portfolio Manager (for energy and water use) from the ENERGY STAR Program wwwenergystargov
Total cost of water use should also include labor associated with operations maintenance accounting and legal associated with all items listed
76
Appendix B Water Cost Calculator
Factor
Costs to Consider (Excluding Labor amp Maintenance
Costs)
Examples Description Vo
lum
e
Uni
ts(g
allo
ns)
Uni
t Cos
t ($
per
gal
lon)
Tota
l Cos
t (d
olla
rs)
Trea
tmen
t(O
nsit
e)
Treatment chemicals
Softening de-alkalyzed
$ $
Filters mem-branes carbon
Purified deionized $ $
Sludge disposal Filtration $ $
Filter disposal Solid waste $ $
Was
tew
ater
Trea
tmen
t
Pretreatment chemicals
Neutralizers flocculants etc
$ $
Pretreatment energy
Evaporation Treatment plant operation
$ $
Sampling and testing kits (consumables)
pH TSS BOD COD
$ $
Was
tew
ater
Dis
posa
l
Sewer rate Utility $ $
Surcharges for pollutant exceeding
$
Permitting Permit renewals $
Septic system maintenance
$ $
Condensate or wastewater disposal if not sewered
$ $
Sludge disposal $ $
Total cost of water use should also include labor associated with operations maintenance accounting and legal associated with all items listed
77
Appendix B Water Cost Calculator
Factor
Costs to Consider (Excluding Labor amp Maintenance
Costs)
Examples Description Vo
lum
e
Uni
ts(g
allo
ns)
Uni
t Cos
t ($
per
gal
lon)
Tota
l Cos
t (d
olla
rs)
sses
Evaporative Cost of make-up water
$ $
Leaks Cost of make-up water
$ $
Treatment or Irrigation or $ $
Lo stormwater vehiclebuilding management washing runoff of runoff from exterior use of supplied water
Production $ $
Oth
er
process water use costs other facility costs
TOTAL $ $
Total cost of water use should also include labor associated with operations maintenance accounting and legal associated with all items listed
See Appendix C ldquoWater Unit Conversions and Calculationsrdquo for guidelines on calculating leak losses
78
Appendix C Water Unit Conversions and Calculations This appendix provides reference material on water unit conversions as well as guidance for esti-mating water use and potential water and cost savings
Water Unit Conversions31
Volume Unit Conversions
Units
Equivalent
Liters (lL)
Gallons (gal)
Cubic Feet (ft3)
Cubic Meters (m3)
Acre-Feet (ac-ft)
Liters 1 02642 3531 x 10-2 00001 8106 x 10-7
Gallons 3785 1 01337 3785 x 10-3 3068 x 10-6
Cubic Feet 2832 7481 1 2832 x 10-3 2296 x 10-5
Cubic Meters 1000 2642 3531 1 8106 x 10-4
Acre-Feet 1233 x 106 3259 x 105 4356 x 104 1233 1
Flow RateDischarge Unit Conversions
Units
Equivalent
Gallons per Minute
(gpm)
Liters per Second (Ls)
Acre-Feet per Day
(ac-ftday)
Cubic Feet per Second
(ft3s)
Cubic Meters per Day
(m3day)
Gallons per Minute
1 6309 x 10-2 4419 x 10-3 2228 x 10-3 545
Liters per Second
1585 1 7005 x 10-2
3351 x 10-2 864
Acre-Feet per Day
2263 1428 1 05042 1234
Cubic Feet per Second
4488 2832 1983 1 2447
Cubic Meters per Day
1369 x 109 864 x 107 6051 x 106 3051 x 106 1
31 GEMI ldquoUnit Conversionsrdquo Collecting the Drops A Water Sustainability PlannerTM available at wwwgemiorgwaterplannerunit-conversionhtm
79
80
Appendix C Water Unit Conversions and Calculations
Calculations and ldquoRules of Thumbrdquo for Estimating Water Use32
Use these guidelines and calculations to estimate water use in your facility The information in this section draws primarily from GEMIrsquos Collecting the Drops A Water Sustainability Plannertrade available at wwwgemiorgwaterplanner
Cooling Tower Usage
Cooling Tower Water Usage Calculations
Tower Evaporation Rate
C x ∆T1000
C = tower recirculation rate in the units of pounds of water
per minute
T = temperature difference across the cooling tower in
degrees Fahrenheit
Cooling Tower Blow Down Rate
[Windage Rate x (Cycles of Concentration -1) -
Tower Evaporation Rate] (1- Cycles of Concentration)
Cycles of Concentration = conductivity or chloride level
in the cooling tower blow-downconductivity or chloride
level in the cooling tower makeup water
bull Windage Loss from Cooling Towers (Water Lost from Friction Between Wind and the Surface of the Water in Cooling Towers)
bull Commonly 01 to 03 of the Recirculation Rate
bull The tower recirculation rate can be obtained from the manufacturerrsquos literature andor head versus flow curve for the pump
Cooling Tower Usage
Boiler Water Usage Calculations
Boiler Make Up Boiler Steam Rate - Condensate Return + Boiler Blow Down
Boiler Blow Down Range of 4 to 8 of Boiler Makeup
Sanitary Water Usage
bull 10ndash25 gallons per person per shift in industrial settings (based on estimates in GEMIrsquos Collecting the Drops A Water Sustainability Plannertrade 2007)
bull The lower value is used where there are just toilets A higher value is used where there are toilets showers and full kitchen services (that is food preparation and dish washing)
32 ldquoCalculationsrdquo and ldquoRules of Thumbrdquo from GEMI Collecting the Drops A Water Sustainability PlannerTM available at wwwgemi orgwaterplannercalculationshtm and wwwgemiorgwaterplannerrules-of-thumbhtm
81
Appendix C Water Unit Conversions and Calculations
bull 20-35 gallons per employee per day for domestic demands (not including kitchens) in commercialindustrial settings (based on estimates in the North Carolina Water Effi-ciency Manual 200933)
bull Savings of 25-35 percent in this domestic usage are readily achievable
Irrigation Usage
bull Number of sprinkler heads x the flow capacity per head (eg 25 gpm x the duration [minutes] of water application)
bull Inspect the irrigation system during operation to determine if there are leaks from broken sprinkler heads and from water distribution lines
Wastewater Streams from Water Treatment Operations
bull Reverse Osmosis Reject Flow
bull Reject stream generally ranges from 10 to 50 of the feed to the system depending on the salinity and the desired purity
bull Reject flow can be higher than the indicated range Reverse osmosis reject streams can be used as cooling tower makeup if the water is softened prior to the reverse osmosis system
Other Uses
bull Slab Washing
bull 5 galmin for each hose
bull 1 dripsecond
bull 10000 Lyear or 2642 galyear
bull Water Flow Estimation
bull Use a bucket and stop watch
Water Losses from Leaks
bull Estimate leaks based on the size of the hole and the water pressure (see Leak Water Loss Guide below) or measure directly using a bucket and stop watch
33 North Carolina Department of Environment and Natural Resources Water Efficiency Manual for Commercial Industrial and Institutional Facilities 2009 available at httpsavewaterncorgbushomephp
82
Appendix C Water Unit Conversions and Calculations
Leak Water Loss Guide (Water Loss in Gallons at 50 PSI)
Leak this Size Loss per Day Loss per Month Loss per Year
bullbull 120 3600 43200
360 10800 129600
693 20790 249480
1200 36000 432000bullbullbull bull 1920 57600 691200
3096 92880 1114560
4296 128880 1546560
6640 199200 2390400bullbullbull 6984 209520 2514240
Source Washington State Department of Health Office of Drinking Water available at wwwdohwagovehpdwwater_usewater_use_efficiencyhtm
Guidelines for Estimating Cost and Water Savings
It can be useful to estimate the potential long-term water and cost savings that will result from implementing water efficiency improvements in your facility This section provides guidelines on producing estimates of these savings after implementing improvements to a process at your facility
83
Appendix C Water Unit Conversions and Calculations
Current Water Use
First to estimate the current water use of an entire process at your facility identify the following information and use Equation 1 below
bull Average volume of water used during a full process or technology cycle
bull This may be provided by the product manufacturer through product literature or the manufacturerrsquos website or by using the guidelines and calculations in the previous section of this Appendix The water efficiency will be dependent upon the flow rate of each process cycle duration of each cycle and the number of cycles If the water use from the full process is not available from the manufacturer sum the water use from each part of cycle to determine the water use from the full process cycle
bull Average number of cycles per day
bull Days of facility operation per year
Water Use after Replacement or Retrofit
To estimate the water use of a more efficient technology or process change use Equation 1 but substitute the average volume of water used during an improved process cycle
Water Savings
To calculate water savings that can be achieved from a technology or process change identify the following information and use Equation 2 below
bull Current water use as calculated using Equation 1
bull Water use after replacement or retrofit as calculated using Equation 1
Equation 1
Water Use of a Technology or Process Cycle (gallonsyear) = Cycle Water Use (gallons) Number of Cycles (per day) Days of Facility Operation (daysyear)
Equation 2
Water Savings (gallonsyear) = Current Water use (gallonsyear) ndash Water Use After Improvements (gallonsyear)
84
Appendix C Water Unit Conversions and Calculations
Payback
To calculate the simple payback from a technology or process change identify the following infor-mation and use Equation 3 below
bull Equipment and installation cost of the replacement or retrofit
bull Water savings as calculated using Equation 2
bull Facility-specific cost of water and wastewater
Return on Investment
To calculate the return on investment of a technology or process change calculate the amount of cost savings as compared to the initial investment using Equation 4
General Calculations and On-Line Calculators
GEMIrsquos Collecting the Drops A Water Sustainability Plannertrade has several on-line and download-able calculators for measuring data related to water use and flows (see wwwgemiorgwaterplanner calculatorsasp) These include
bull Flow rate calculator
bull Friction loss and flow calculator
bull Pump hydraulic horsepower calculator
bull Water balance template and calculator
Equation 3
Payback (years) = Equipment and Installation Cost (dollars) [Water Savings (gallonsyear) Cost of Water and Wastewater (dollarsgallon)]
Equation 4
Return on Investment = [(Water Savings (gallonsyear) Cost of Water and Wastewater (dollarsgallon)] ndash Equipment and Installation Cost (dollars)
Appendix DWater Efficiency Opportunity Checklist
Water Efficiency Opportunity Checklist
FacilityBuilding Date Prepared
Prepared by Reviewed by
Water Efficiency Practice Yes No
1 Organizational Water Efficiency Practices
a Have you set water use reduction goals and targets for your facility
b Are water meters installed on high water using processes and are they working properly
c Do you have easy ways for employees to suggest ideas for water efficiency improvements (eg suggestion boxes)
2 Cooling and Heating
a Has once-through cooling water been eliminated with the use of chillers cooling towers or air-cooled equipment
b Has blow-downbleed-off control on cooling towers and boil-ers been optimized
c Is condensate being reused
d Is treated wastewater (or other sources of water for cooling tower make-up) reused where possible
e Are cycles of concentration for cooling towers maximized through efficient water treatment
f Is a conductivity controller installed on each cooling tower
g Have cooling towers been equipped with overflow alarms
h Are high-efficiency drift eliminators in use
3 Restrooms and Kitchens
a Are water-efficient fixtures installed (eg WaterSense labeled faucets toilets urinals and showerheads) Are there signs on dual-flush toilets showing people how to use them
b Have you installed metered or spring-loaded faucets or fau-cets with sensors
85
Appendix D Water Efficiency Opportunity Checklist
Water Efficiency Practice Yes No
c Have you adjusted plumbing to use the minimum amount of water that is functional
4 Process Use
a Have you installed timers to automatically shut off water flow when water is not required such as at the end of a produc-tion cycle
b Are solenoids and automatic shut-off valves checked regu-larly to ensure that they are working properly
c Is equipment set to the minimum flow rates recommended by the manufacturer
d Have pressure-reducing devices been installed on equipment that does not require high pressure
e Can process equipment reuse water (closed loop) or use reclaimed water from other parts of the facility
f Have you replaced water-based transportation with either waterless techniques or recycled water
g Are signs posted near equipment encouraging employee awareness of water use and discouraging tampering with equipment flow rate
5 Cleaning and Sanitation
a Are all hoses equipped with an automatic shut-off nozzle
b Has process cleaning or facility cleaning been replaced with waterless techniques (ie using pressurized air to clean products or containers sweeping debris off the floor) where possible
c Are improved rinsing techniques used (counter-current systems sequential use from high to lower quality needs conductivity flow controls improved spray nozzlespressure rinsing fog rinsing etc)
d Is spent rinse-water being reclaimed and reused for lower-grade processes or for other facility applications
e Have steps been taken to reduce the water used by steam sterilizers such as jacket and chamber condensate cooling modification
86
Appendix D Water Efficiency Opportunity Checklist
Water Efficiency Practice Yes No
f Are you using detergents that can easily be removed with little water
6 Landscaping and Irrigation
a Are low-flow sprinklers trickledrip irrigation and optimized watering schedules in use
b Are preventive maintenance techniques in place
c Has your facility designed its landscape to consider the local climate and grouped plants by similar watering needs
d Is grass planted only in places where it will provide optimal functional and aesthetic benefits
e Are systems in place to capture and reuse rain water and storm water for landscaping or for other uses (eg cooling tower make-up process water or dust suppression)
7 Leaks
a Are you conducting regular leak inspections
b Are leaky faucets faulty fittings and broken pipes and hoses identified and repaired promptly
c Are employees (including custodial crews) educated and em-powered to identify leaks and point them out for repair
d Is there a user-friendly method to report leaks
8 Comments
9 Recommended Follow-Up Actions34
34 For additional guidance see EPA Office of Water ldquoWaterSense at Work Best Management Practices for Commercial and Institu-tional Facilitiesrdquo wwwepagovwatersense North Carolina Department of Environment and Natural Resources Water Efficiency Manual for Commercial Industrial and Institutional Facilities wwwp2paysorgref0100692pdf East Bay Municipal Utility District of Oakland WaterSmart Guidebook wwwebmudcomfor-customersconservation-rebates-and-servicescommercial watersmart-guidebook and Arizona Municipal Water Users Association Facility Managerrsquos Guide to Water Management http amwuaorgpdfsfacility_managers_guidepdf
87
Appendix E Glossary of Water Terms Most of the definitions provided here are from the Alliance for Water Efficiencyrsquos water glossary available at wwwallianceforwaterefficiencyorgGlossaryaspx That glossary has a more extensive set of water-related terms and abbreviations
B
Best management practice (BMP)
Equipment or behavioral measure(s) established as the most practicable means of increasing water efficiency
Blowdown (or Bleed-off)
Draining off the water in a cooling tower reservoir or boiler to avoid the buildup of excess dissolved solids
E
End use A fixture appliance or other specific object or activity that uses water
M
Makeup water Fresh water introduced into a cooling tower or boiler to replace water lost to evaporation and blowdown
P
Peak use (demand)
The maximum demand occurring in a given period such as hourly or daily or annually Peak use can incur sur-charges above the normal base water cost charged by the utility
R
Reclaimed water Municipal wastewater effluent that is given additional treatment and distributed for reuse in certain applica-tions Also referred to as recycled water
Reverse osmosis A process to remove dissolved solids usually salts from water Salty water is forced through membranes at high pressure producing fresh water and a highly concentrat-ed brine
S
Source meter A meter that measures the quantity of water being sup-plied to a facility
88
89
Appendix E Glossary of Water Terms
Submeter A meter that measures usage for specific activities within a facility such as cooling towers process use or land-scape water use
W
Water audit An on-site survey of facility water use to measure equip-ment and management efficiency and generate recom-mendations to improve efficiency
Water balance A chart table or diagram that tracks water flow through a building or facility showing total inflows and total outflows (eg consumption irrigation evaporation leaks and losses)
Water conservation
1 Any beneficial reduction in the water loss waste or use
2 A reduction in water use accomplished by implemen-tation of water conservation or water-efficiency mea-sures
3 Improved water management practices that reduce or enhance the beneficial use of water
Water efficiency A measure of the amount of water used versus the mini-mum amount required to perform a task In irrigation the amount of water beneficially applied divided by the total water applied
Water footprint An analysis of the total volume of freshwater that is used directly and indirectly to run and support the business or to produce a product encompassing water use within an industrial facility throughout its supply chain and final disposition of the product
Lean and Water Toolkit
United States Environmental Protection Agencywwwepagovlean
October 2011EPA-100-K-11-003

How to Use This Toolkit This toolkit uses icons in the page margins to help you find and follow important information in each chapter
Identifies an important point to remember
Defines an important term or concept
Presents a technique or resource that helps capture communicate or apply new knowledge
Chapters also include one or more ldquoTo Considerrdquo text boxes that contain questions to help you explore how the information relates to your organization
This is one of a series of Lean and Environment publications from the US Environmental Protection Agency For more infor-mation visit the EPA Lean website at wwwepagovlean
Lean and Water Toolkit
AcknowledgmentsThe US Environmental Protection Agency (EPA) is grateful for the valuable assistance of the orga-nizations and individuals who helped develop this toolkit and who shared experiences tools and techniques for integrating Lean manufacturing and water efficiency EPArsquos Office of Policy sponsored and led the development of this toolkit while EPArsquos Office of Water provided considerable input
This toolkit has benefited from the collective expertise and ideas of many individuals In particular EPA would like to thank the following individuals for their thoughtful contributions
Michael Abouezzi Senior Director Lean Six Sigma and Total Productive Maintenance PepsiCo
Barruch Ben-Zekry Manager of Environmental Sustainability for Operations Levi Strauss amp Co
Scott Butler Vice President of Operations and Technical Services Del Monte Foods
Lynn Coleman Environmental Engineer Hazardous Waste and Toxics Reduction ProgramWashington State Department of Ecology
Rob Currie Director Environment Health and Safety Baxter International
Michelle Gaither Technical Research Lead Pacific Northwest Pollution Prevention Resource Center
Amy Goldman Director Global Environmental Management Initiative
Reza Hosseini Manager of Environmental Site and Compliance Assessment Levi Strauss amp Co
Bruce Karas Director Sustainability Environmental and Safety Coca-Cola North America
Deborah Kennedy Senior Principal Engineer Resource Conservation PepsiCo
Robert ter Kuile Senior Director Environmental Sustainability Global Public Policy PepsiCo
Jessica McGlyn Director World Business Council for Sustainable Development US Inc
Rob Meyers Director Environmental Sustainability Global Operations PepsiCo
John Radtke Water Resource Manager Coca-Cola North America
Jason Schulist Director of Program Office DTE Energy
Mike Sklar Continuous Improvement Manager DTE Energy
Charles Souders Manager Environmental Compliance Johnson amp JohnsonMcNeil Consumer Healthcare
David Walker Senior Director Environmental Sustainability PepsiCo
This toolkit was prepared for EPA by Ross amp Associates Environmental Consulting Ltd (wwwross-assoccom) in association with Industrial Economics Inc (EPA Contract EP-W-10-002)
Lean and Water Toolkit
Lean and Water Toolkit
Table of ContentsExecutive Summaryi
Preface iv
Chapter 1 Introduction 1
Importance of Water to Industry 1
Benefits of Addressing Water with Lean 2
Getting Started with Lean and Water 6
Chapter 2 Water Use and Water Waste at Industrial Facilities11
Definition of Water Waste 11
Industrial Water Use12
Water End Uses How Water Is Used at Facilities15
Measuring Facility Water Use Metering and Submetering17
Costs of Water Waste 20
Chapter 3 Finding Water Waste on the Factory Floor 25
Water Gemba Walks 25
Developing a Water Balance 28
Water Waste and Value Stream Mapping33
Root Cause Analysis 38
Chapter 4 Lean and Water Efficiency Improvement Strategies 41
Kaizen Events and Just-Do-Its to Reduce Water Use41
Integrate Water Efficiency into Everyday Lean Practices 45
Lean and Water Applications for Facility Operations and Support Processes50
Chapter 5 Lean and Water Beyond the Factory Floor 53
Lean and Water Efforts in Your Supply Chain 53
Engaging with the Community 58
Lean Product Design61
Chapter 6 Conclusion 67
Your Lean and Water Journey67
Concluding Thoughts 68
Appendices 69Appendix A Water Efficiency Resources and Technical Assistance Providers 69
Appendix B Water Cost Calculator76
Appendix C Water Unit Conversions and Calculations 79
Appendix D Water Efficiency Opportunity Checklist85
Appendix E Glossary of Water Terms88
Lean and Water Toolkit
Boxes Key Benefits of Addressing Water with Lean (Box 1) 2
Example Results From Lean and Water Efforts (Box 2) 3
Learning to See Water Waste and Costs (Box 3) 4
Types of Water-Related Business Risks (Box 4)5
Water Metrics (Box 5) 7
Water-Intensive Industries (Box 6)12
Common Costs Associated with Water Use (Box 7) 21
Steps to Take During a Gemba Walk (Box 8)26
Examples of Water Gemba Walk Success (Box 9)28
Information to Collect for a Water Balance (Box 10)32
Water Footprinting Tips (Box 11)33
Asking Why Five Times (Box 12)39
Key Water-Efficiency Questions (Box 13)41
Water Kaizen Event Examples (Box 14)42
Waterless Cleaning of Gatoradereg Bottles (Box 15) 44
Frito-Lay Engaging Employees in Water Efficiency (Box 16)46
Water-Efficient Cleaning Strategies (Box 17)49
Proactive Maintenance Tips to Reduce Water Use (Box 18)50
Questions to Identify Water-Savings Opportunitiesin Facility Operations and Support Processes (Box 19) 51
Dubois Chemical and Steelcase An Innovative Lean Water Supplier Partnership (Box 20) 54
Green Suppliers Network Lean and Water Successes (Box 21) 55
Levi Strauss amp Co and the Better Cotton Initiative (Box 22) 58
PepsiCorsquos Positive Water Balance Project in India (Box 23) 59
Examples of Water Conservation through Product Design (Box 24)64
Figures Figure 1 Impact-Difficulty Matrix 8
Figure 2 Lean and Water Implementation Strategies 10
Figure 3 Water Scarcity Map of the World13
Figure 4 Breakdown of Water Uses in Two Industries 16
Figure 5 Example Water End Uses at an Industrial Facility 17
Figure 6 Portable Water Meter18
Figure 7 Costs Associated with Water Use20
Figure 8 Typical Water Balance Calculation 29
Figure 9 Simplified Elements of a Water Balance30
Figure 10 Adding Water Use to Value Stream Map Process Box 34
Figure 11 Value Stream Map Incorporating Water Use Metrics35
Figure 12 Process Boxes Showing Water Waste36
Lean and Water Toolkit
Figure 13 Water Inputs and Outputs Identified on a Value Stream Map 37
Figure 14 Fishbone Diagram of Excessive Water Use 39
Figure 15 Five Water-Savings Strategies43
Figure 16 Sign to Encourage Water Conservation 45
Figure 17 Dual Flush Toilet Visual Control 47
Figure 18 Six Pillars of 6S (5S + Safety)48
Tables Table 1 Typical Water Use Per Ton of Product 14
Table 2 High-Impact Water Use Sectors 14
Table 3 Costs Associated with Water Used in an Industrial Process 22
Table 4 Key Areas to Check During a Water Gemba Walk 27
Table 5 Example Water Balance Summary 31
Table 6 Table for Evaluating Water Reuse Potential44
Table 7 Methods Used in Lean Design62
Table 8 Questions to Ask During Lean Product Design 63
Lean and Water Toolkit
Lean and Water Toolkit
Acronyms and Abbreviations 3P Production Preparation Process or Pre-Production Planning
5S Sort Set in order Shine Standardize Sustain
BMP Best management practice
CO Changeover time
CT Cycle time
E3 Economy Energy and Environment
EHS Environmental Health and Safety
EPA Environmental Protection Agency
GEMI Global Environmental Management Institute
gpf Gallons per flush
gpm Gallons per minute
LEED Leadership in Energy and Environmental Design
MEP Manufacturing Extension Partnership
NIST National Institute of Standards and Technology
psi Pounds per square inch
TPM Total Productive Maintenance
Lean and Water Toolkit
i
Executive Summary
Executive SummaryThis Lean and Water Toolkit describes practical strategies for using Lean manufacturingmdashthe production system developed by Toyotamdashto reduce water use while improving operational per-formance Drawing from the experiences and best practices of multiple industry and government partners this toolkit explores opportunities to identify and eliminate ldquowater wasterdquo including
bull Water losses and leaks
bull Non-value added or inefficient use of water
bull Missed opportunities to reuse water
bull Wastewater discharges
bull Unnecessary water use and risks throughout the supply chain
bull Missed opportunities to address customersrsquo water-efficiency goals
This toolkit is a supplement to EPArsquos Lean and Environment Toolkit (wwwepagovleantoolkit) which addresses all types of environmental wastes and improvement opportunities
Why Address Water Using Lean Companies recognize water use and availability as a critical business concern While direct water costs may be low many indirect costs associated with water use can make the full cost of water substantial Community concerns about water and the risk of water supply disruptions can increase pressures on companies to reduce water use Incorporating water use reduction into Lean initiatives provides an efficient and effective means to
1 Uncover cost savings and operational improvements
2 Reduce water-related business risks
3 Deliver value for customers and employees
Facilities already using Lean can often easily incorporate water considerations into value stream maps and other Lean efforts At the same time facilities conducting water efficiency initiatives may find that Lean tools provide a powerful means to drive effective implementation and results Con-necting Lean and water efforts can engage employees in powerful and rewarding ways that build capacity and momentum to solve problems and create value
Understand Water Uses and Costs The toolkit discusses common water end uses in industrial and manufacturing facilities and discuss-es costs associated with water use Costs of water include not only the cost of purchasing water but also costs associated with treatment heating conveyance and regulatory compliance Metering and sub-metering are important tools for understanding actual water use within a facility and tracking it over time
ii
Executive Summary
Find Water Waste The toolkit discusses several techniques to find water waste and opportunities at your facility in-cluding
bull Water Gemba Walks Have a team walk the factory floor together to observe and inventory inefficiencies related to water use
bull Water Balance Develop a diagram of your facilityrsquos water use that shows and quantifies the flows of water into and out of each process or operation in the facility
bull Value Stream Mapping Add information on water use andor costs to Lean value stream maps to help identify water waste and develop implementation plans for Lean and water efficiency improvement efforts
bull Root Cause Analysis Use root cause analysis methods to explore the underlying causes of water waste and inform improvements
Improve Operations and Processes with Lean and Water Strategies Solutions to reduce water waste can be identified during Lean events and in daily implementation of Lean principles and tools The toolkit discusses facility operations and support functions in which there may be specific improvement opportunities Strategies include
bull Waste Elimination Culture Encourage employees to identify water waste throughout their daily activities and create a culture in which they are empowered to continually im-prove the way your facility uses water
bull Kaizen Events and Just-Do-Its Pursue opportunities to address water waste during Lean kaizen events Consider focusing kaizen events specifically on water waste or water-intensive processes Also find quick opportunities for individuals to immediately improve a process or operation in just-do-it projects
bull Standard Work Embed water use management and efficiency tasks into standard operat-ing procedures to engage all employees in proactive water-efficiency activities
bull Visual Controls Use signs and visual controls to reinforce water waste reduction practices and standard work Clearly display information on water use and costs to raise awareness
bull 5S Incorporate water management and waste reduction activities into 5S housekeeping activities such as cleaning and inspections to engage all employees in identifying and eliminating water waste
bull Total Productive Maintenance Enable teams of workers to quickly identify and correct problems fix leaks and improve water efficiency while optimizing the effectiveness of your manufacturing equipment
iii
Executive Summary
These Lean tools can be used at a facility in concert with water-efficient best management practices (BMPs) that are often available from industry associations and government agencies1 Industrial facilities can target their efforts to the most effective solutions using these technology and process-based improvements
Extend Lean and Water Efforts throughout the Value Chain Looking beyond facility operations can allow you to uncover new ways to reduce water use and risks while adding value and improving business operating conditions and market opportunities Strategies include
bull Supply Chain Initiatives Work with your suppliers to improve understanding of water use costs and risks Provide incentives and technical support to help suppliers identify and eliminate water waste Collaborate with supply chain partners to address water-related op-portunities through joint Lean events and other initiatives
bull Engage Local Communities Educate and engage your employees in water-efficiency efforts at your facility and encourage them to adopt similar practices at home Partner with community members and local organizations to conduct projects or Lean events that improve water use andor quality in the community
bull Product Design Incorporate water efficiency and reuse as design criteria into Lean prod-uct and process design methods as a powerful means of reducing the water use of products throughout their lifecycle
Starting Your Lean and Water Journey There are many ways to get started with identifying and reducing water waste and improving busi-ness results using Lean Consider using the strategies and techniques in this toolkit to help you
1 Learn more about how your facility uses water
2 Engage employees in Lean and water improvement efforts
3 Connect Lean and water efforts to sustainable water management strategies
We hope the strategies and tools in this toolkit will help you on your Lean and water journeymdashen-abling you to reduce water waste and costs improve processes and foster positive relations with your customers and community
1 Appendix A provides information on water efficiency resources and technical assistance providers that offer helpful information on BMPs Also consider contacting your local water utility or the industry or trade association in your sector to inquire about water-related BMPs and resources
iv
Preface
Preface
Purpose of This ToolkitThe Lean and Water Toolkit offers Lean implementers practical strategies and techniques for improving common Lean results related to time cost and quality while also reducing water use costs and risk Environmental Health and Safety professionals will also find useful infor-mation in this toolkit for how to leverage Lean and Six Sigma business improvement methods to eliminate water waste Finally the toolkit introduces Lean practitioners to the wide array of water efficiency resources available from EPA and other organizations
The ldquoLeanrdquo methods discussed in this toolkit are organizational improvement methods pioneered in the Toyota Production System Lean production and Lean manufacturing refer to a customer-focused business model and collection of methods that focus on the elimination of waste (non-value added activity) while delivering quality products on time and at a low cost Six Sigma is a business model that focuses on improving quality by eliminating variation it is often combined with Lean The toolkit assumes that you are familiar with Lean methods For those who want to learn more about Lean see EPArsquos Lean and Environment website (wwwepagovlean)
Key Questions Addressed by This Toolkit Lean works well when it focuses on identifying and eliminating waste This toolkit contains strate-gies and techniques that can enable Lean practitioners to easily identify water waste and improve-ment opportunities alongside the myriad other wastes and improvement opportunities uncovered by Lean To accomplish this the toolkit aims to answer the following questions
What is water waste Water is required in substantial quantities to produce goods from food products to silicon chips Water waste is water that is used beyond the point at which it ceases to add value to the customer Excess water use often leads to wastewater which can harm human health and the environment through the pollutants it collects and overdrawing water resources in certain regions can exacer-bate water scarcity concerns Water can be wasted in the supply chain through facility operations and in product use and disposal This toolkit will help you to recognize water waste so that you can work to reduce it
Why should you address water waste with Lean Substantial water savings can ride the coattails of Lean improvement By eliminating manufactur-ing wastes such as unnecessary processing and cleaning businesses also reduce the water and associated labor and energy costs needed for cleaning conveyance cooling and heating Chapter 1 describes benefits of combining Lean and water efficiency efforts and discusses how to get started Chapter 2 provides an overview of industrial water use including information on water uses water metering and water costs
v
Preface
How do you know how much and where water is used in your facility A key step in effective Lean and water efforts is determining where to target water efficiency im-provement activities Chapter 3 discusses techniques for measuring water use and identifying op-portunities to reduce water use in the context of Lean Methods include gemba walks water balance value stream mapping and root cause analysis
How can you reduce water use with Lean methods Chapter 4 examines specific opportunities for using Lean methods to improve water efficiency including kaizen events standard work visual controls 5S and total productive maintenance These strategies present ways that you can integrate water efficiency principles and practices into the practical implementation-based tools of Lean manufacturing and the waste-elimination culture fostered by Lean
How can you use Lean to pursue water efficiency opportunities beyond your facilityrsquos operations For many companies water costs and risks may be driven by factors and activities beyond the facility fence-line Similarly opportunities to capture market value and win customers may require considerations upstream to manufacturing activities Chapter 5 explores strategies to leverage Lean initiatives and methods to reduce water risks in your supply chain and to engage the local commu-nity in water saving initiatives Chapter 5 also discusses how Lean product design methods can be used to improve water efficiency and add value by addressing customer water needs
Lean and Water Toolkit
1
CHAPTER 1
Introduction
Water is a crucial resource for the world economy Lean provides a framework in which organiza-tions can address water waste while saving costs reducing risks and adding customer value This chapter includes the following sections
bull Importance of Water to Industry bull Benefits of Addressing Water with Lean bull Getting Started with Lean and Water
Importance of Water to Industry Companies worldwide identify water issues as a critical business concern Water is essential for a range of industrial processes and support functions facility operations and as an ingredient for many products Water use is increasing much faster ldquoI am convinced that under present than population growth and regional and seasonal conditions and with the way water is differences in water availability can lead to short- being managed we will run out of ages and even water-related conflicts The World water long before we run out of fuelrdquo Economic Forum reports that 44 percent (28 billion) of people currently live in areas of the Peter Brabeck-Letmathe Chairman
world that are water stressed and if present trends Nestle Corporation
continue water scarcity will affect the livelihood of Source ldquoA water warning Peter Brabeck-Letmathe chairman of Nestleacute argues that water shortage is an even more urgent problem than climate changerdquo The Economist November 19 2008one-third of the worldrsquos population by 20252 wwweconomistcomnode12494630
Corporations are recognizing the important role they play in addressing water resource chal-lenges and companies are responding by engaging in efforts to measure report and reduce their water use In a survey conducted by the Carbon Disclosure Project of 302 of the worldrsquos largest 500 companies 89 percent of responding companies had developed specific water policies strategies and plans and 67 percent indicated that responsibility for water-related issues lies at the Board or Executive Committee level3 The United Nationsrsquo CEO Water Mandate launched in 2007 is designed to help companies develop implement and report on water sustainability policies and practices Industry-led associations such as the World Business Council for Sustainable Development and the Global Environmental Management Initiative also have major water initiatives
One key reason why companies choose to use water more efficiently is to improve their relationship with the communities that surround industrial facilities Water use is of paramount importance to a facilityrsquos relationship with its surrounding community Facilities that use less water in drought-
2 World Economic Forum ldquoThe Bubble Is Close to Bursting A Forecast of the Main Economic and Geopolitical Water Issues Likely to Arise in the World during the Next Two Decadesrdquo Draft Report for Discussion at World Economic Forum
3 Carbon Disclosure Project ldquoCDP Water Disclosure 2010 Global Reportrdquo available at wwwcdprojectnetCDPResultsCDP-2010-Water-Disclosure-Global-Reportpdf
2
Chapter 1 Introduction
prone areas leave more water available for residential use Some companies even risk being forced to withdraw from regions where water is a scarce resource a problem that is likely to recur as water scarcity increases in many regions around the globe In some cases communities around industrial facilities show much greater concern for the amount of water a facility uses than the amount of energy it uses
This toolkit provides strategies and tools for addressing water issues within the context of Lean manufacturing and other business process improvement methods
Benefits of Addressing Water with Lean Lean provides powerful tools for delivering value to customers in a manner that minimizes waste and risks from unnecessary water use Explicit consideration of water waste during Lean imple-mentation can create significant value for an organization helping to deliver quality products and services that customers want when they want them Research sponsored by EPA and others shows that some water use and waste reduction benefits typically ride the coattails of Lean efforts yet other opportunities to reduce wastes risks and non-value added activity associated with water may be overlooked There are three key benefits of addressing water with Lean as listed in Box 1 and further described below
Key Benefits of Addressing Water with Lean (Box 1)
1 Uncover cost savings and operational improvements
2 Reduce water-related business risks
3 Deliver value for customers and employee
Uncover Cost Savings and Operational Improvements Learning to see and eliminate waste is a cornerstone of Lean initiatives Water waste is often a sign of inefficient production and non-value added activity and it frequently indicates opportuni-ties for saving costs and time Lean and water strategies can help you to uncover cost savings and improvements in areas of your facilityrsquos operations that may not have received as much attention in your Lean efforts For production processes that are highly dependent on water or that have water-intensive support processes such as wastewater treatment the operational and environmental benefits from Lean and water efforts are even more significant
Learning to see water and other environmental waste during Lean efforts can reveal significant business improvement opportunities further strengthen Lean results and improve environmental performance Box 2 provides several examples of how companies have used Lean and Six Sigma methods to reduce water use save costs and improve their performance
3
Chapter 1 Introduction
Example Results From Lean and Water Efforts (Box 2)
3 IBM used Six Sigma tools to reduce water consumption and operating costs in wafer fabrication processes saving $3 million annually reducing water usage by 27 percent and increasing production by over 30 percent
3 GE combined high-tech water metering and other water efficiency prac-tices with its kaizen improvement methodology resulting in a 30 percent drop in water use since 2006
3 DTE Energy saved 20 million cubic feet of water (79 percent) and $700000 annually in a Lean Six Sigma project examining electric substa-tion water use
Sources IBM ldquoGreen Sigma Overviewrdquo Presentation to EPA June 2009 GE info cited in Carbon Disclosure Project ldquoCDP Water Disclosure 2010 Global Reportrdquo page 25 available at wwwcdprojectnetCDPResultsCDP-2010-Water-Disclosure-Global-Reportpdf and Jason Schulist DTE Energy ldquoLean Towards Sustainability How to Use Lean and Six Sigma Methods to Drive Your Sustainability Journeyrdquo Presentation at Green Six Sigma Conference May 19 2009
While many places have very low direct costs for water and wastewater there are also indirect costs to water use These costs can be significant yet they are often hidden in overhead or support cost centers (see Box 3 for examples of how facilities have uncovered water waste and costs) Examples of water costs include
bull Raw Material Costs Costs of measures to ensure that purchased water supply is of suf-ficient quality for use at a facility For example some facilities may bear costs for labor equipment and materials needed to improve water quality before use (eg when water is a key product ingredient) as well as for chemicals and other raw materials needed to treat and manage water at the facility and before discharging it Water treatment costs associated with deionized water and reverse osmosis can be substantial
bull Energy Costs for the energy required to heat and cool water pump or transfer water operate water-consuming equipment treat water and wastewater and other functions
bull Pollution Control Wastewater service costs paid to a utility andor industrial pretreat-ment costs for the energy labor materials equipment and chemicals needed to treat wastewater before discharging it from the facility
bull Regulatory Compliance Costs for regulatory compliance activities such as completing permit applications and tracking and reporting wastewater discharges to regulatory agencies In the United States industrial municipal and other facilities must obtain National Pollutant Discharge Elimination System permits if the facilities discharge water pollutants directly into US waters Pretreatment regulations govern industrial facilities that discharge into municipal sewer systems Also in some food and consumer product industries water use may be important to address Food and Drug Administra-tion sanitation requirements
4
Chapter 1 Introduction
Lean and water strategies such as those outlined in this toolkit help to reveal these costs and identify process improvement solutions The next chapter provides more information about water end uses and costs
Learning to See Water Waste and Costs (Box 3)
3A wood products company began metering water into two parallel process units and discovered one was using significantly more water than the other After some investigation the company identified and implemented mainte-nance practices that would substantially lower water use while also prevent-ing equipment failure and downtime
3A food processing company regarded the water supply from its groundwater well as essentially free While completing a facility water balance it me-tered the amount of hot water used for one process step Once the com-pany realized it was heating 25 gallons per minute of ground water from 55 degrees to boiling it began to think of opportunities to reduce and reuse the energy in the hot water rather than sending it down the drain
3A small high tech silicon wafer company was paying its city water utility $120 per hundred cubic feet of water After calculating the cost of pre-treating its process water and adding wastewater treatment and discharge expenses the company realized that the full cost of water was five times the initial cost of purchasing water These insights led the company to reuse rinse water in the process reducing total water use and demand for ultra pure water without affecting product quality
Reduce Water-Related Business Risks Lean provides an effective platform for reducing facility water use and the associated water-related business risks While the specific risks that individual facilities face vary examples of water-related risks include water shortages and reliability issues water quality issues that drive the need for additional water treatment increasing water costs and supply chain interruptions In some water-scarce regions there may be challenges with meeting basic human needs for clean water and sani-tation competition for scarce water resources may be intense between uses associated with public water supply agriculture industry and fisheries Climate change is predicted to exacerbate many of these water risksmdashincreasing global temperatures will likely lead to increases in water de-mand water scarcity more vulnerable ecosystems and more frequent extreme weather events4
How companies respond to water risks can also have important implications for how local commu-nities and customers perceive those companies 4 For more information on water and climate change see CERES and Pacific Institute ldquoWater Scarcity amp Climate Change Grow-
ing Risks for Businesses amp Investorsrdquo February 2009 available at wwwpacinstorgreportsbusiness_water_climatefull_report pdf For a discussion of business perspectives on the connections between water energy and climate change see World Business Council for Sustainable Development ldquoWater Energy and Climate Change A Contribution from the Business Communityrdquo March 2009 available at wwwwbcsdorg
5
Chapter 1 Introduction
Types of Water-Related Business Risks (Box 4)
Companies face a variety of risks related to water security including
3Business Interruption Risks that the supply of water may be disrupted in the supply chain production andor product use
3Reputation Risks related to public scrutiny of how companies respond to water resource challenges and engage with communities stakeholders and employees
3Regulatory Risks of increased government regulations or restrictions on water use and water pollution as well as the associated costs to respond to the requirements
3Access to Capital Risks of financial institutions adopting stricter lending and investment policies based on water uncertainties
Source World Economic Forum ldquoThe Bubble Is Close to Bursting A Forecast of the Main Economic and Geopolitical Water Issues Likely to Arise in the World during the Next Two Decadesrdquo Draft Report for Discussion at World Econom-ic Forum Annual Meeting 2009 January 2009 page 39 www3weforumorgdocsWEF_ManagingFutureWater20 Needs_DiscussionDocument_2009pdf
Reducing non-value added water use is a key strategy for mitigating water risks Integrated Lean and water strategies offer practical solutions that support multiple business objectives such as increased efficiency reduced costs improved customer responsiveness and decreased water and energy use By engaging employees in teams to identify and eliminate sources of water waste in your facilitymdashalongside other production wastes such as over processing defects and delays your facility can proactively reduce water risks while also supporting operational goals Proactively en-gaging with local utilities and communities to collaboratively address water resource challenges can provide additional opportunities to reduce business risks and increase value These efforts will make your facility less vulnerable to risks and better positioned to succeed given changes in water supply demand and quality
Deliver Value for Customers and Employees Reducing water use and risks through Lean Six Sigma and other process improvement meth-odologies can foster a competitive advantage for some businesses Customers and employees may view proactive environmental improvement efforts as an important attribute affecting customer loyalty and the ability to attract and retain employees In some market segments ldquogreenrdquo attributes are an important factor that can give a product or company competitive advantage People around the world view water issues as a key sustainability challenge For example more than 90 percent of the 32000 people polled in 15 countries for a GlobeScan and Circle of Blue survey in 2009 perceived ldquowater pollutionrdquo and ldquofreshwater shortagerdquo to be serious problems (70 percent considered them very serious problems)5 Some companies can tap into significant market niches by providing cus-tomers with water-efficient choices and solutions 5 GlobeScan and Circle of Blue ldquoWater Views Water Issues Researchrdquo August 19 2009
wwwcircleofblueorgwaternewswp-contentuploads200908circle_of_blue_globescanpdf
6
Chapter 1 Introduction
Participation in international or national water sustainability programs or local water efficiency efforts can provide businesses with public recognition and a competitive advantage for their wa-ter management achievements For businesses that manufacture water-using appliances parts or products companies can use design methods to make their products as water-efficient as possible throughout their lifecycles from manufacturing to use and disposal These methods can allow companies to cater to the steadily growing markets for green building and green products There are also awards and competitions that provide recognition and media publicity for water-related in-novations and efficiency accomplishments
Reducing your facilityrsquos water use and the water that your products require during use can add value for your ldquodownstreamrdquo customersmdashsaving them water and energy costs and helping them meet their water-efficiency goals Business interest in gathering and disclosing water use and risk information through initiatives such as the Global Reporting Initiative and the Carbon Disclo-sure Projectrsquos Water Disclosure Initiative may increase in the coming decade as water becomes a more critical business issue in some supply chains and industry sectors Chapter 5 discusses ideas for engaging with customers suppliers and communities on Lean and water efforts as well as incorporating water issues into Lean product design
Getting Started with Lean and Water There are many ways for a facility to get started with reducing water waste and finding Lean and water improvement opportunities While the possibilities can be daunting the important thing is to begin even if the effort is small Consider starting out with small steps such as tracking water use as a metric at your facility with the goal of reducing use This can be a great strategy for smaller facilities Here are some ideas for initiating a Lean and water effort
Learn More About How Your Facility Uses Water A key first step is learning how your facility uses water and identifying the process areas support functions and facility operations that have the greatest water waste and improvement opportunities Strategies include beginning to track water metrics as part of Lean and process improvement activi-ties and installing water meters on processes that use large amounts of water Box 5 lists examples of water metrics that facilities can use It is helpful for facility managers and Lean champions to track water usage regularly and to share this information with floor staff Regularly monitoring water use data can help you determine the impact of peak periods (eg during summer andor busier production months) and help you spot variations that could be signs of problems
7
Chapter 1 Introduction
Water Metrics (Box 5)
Facility-Wide Metrics
3 Volume of water used each month or other appropriate time period (eg gallonsmonth or gallonsshift)
3 Volume of wastewater (eg gallonsmonth or gallonsshift)
3 Water used for specific end uses (eg gallonsper month for outdoor ir-rigation cooling water evaporation heated process water bathrooms and kitchens etc)
Metrics Normalized to Production
3 Volume of water used per product (eg gallonspound of product gal-lonsproduct)
3 Volume of wastewater discharged per product (eg gallonspound of product or gallonsproduct)
Chapter 2 of this toolkit has more information on water end uses metering and costs
To be most effective in Lean and water implementation efforts Lean champions or operations man-agers should connect with environmental and facilities personnel early on to discuss plans for Lean and water efforts Environmental Health and Safety (EHS) personnel can assist with developing water balances and other assessments of facility and process water use including gathering data on water use and costs as well as helping prioritize Lean and water activities
After completing an initial water assessment managers can consider it in the context of other planned Lean events and prioritize opportunities for involving EHS personnel in value stream map-ping and kaizen events based on when their environmental expertise will add the most value
Engage Employees in Lean and Water Improvement Efforts Lean provides a solid framework to empower cross-disciplinary employee teams to identify and eliminate excess water use and other production waste thereby realizing both environmental and Lean gains Most likely your efforts to examine water use and waste will generate numerous ideas for process improvements and potential solutions Ideas could include water efficiency and reuse opportunities andor Lean events to improve water-intensive processes
bull Motivate employees and managers by communicating corporate sustainability goals and incorporating water efficiency into performance targets and incentives
bull Consider trying out some of the Lean and water improvement ideas in this toolkit but donrsquot limit employee teams to those ideasmdashencourage their creativity and initiative
bull Train employees on how to identify water waste and improvement opportunities building their capacity to problem solve and help meet your facilityrsquos water use reduction targets
8
Chapter 1 Introduction
bull Actively solicit employee suggestions for kaizen events or other improvement projects by inviting ideas in meetings and conversations andor by using a suggestions board or box
A significant benefit of involving employees throughout your facility in Lean efforts is the oppor-tunity to create a culture of continuous improvement When employees are engaged in identifying ways to improve water efficiency they are more likely to note these opportunities and areas of water waste throughout their normal day-to-day operations You might find that improved water efficiency becomes a continual trend at your facility and not just something that happens within the confines of a specific Lean exercise or event
Focus your facilityrsquos initial Lean and water efforts on high-impact easy-to-implement strategies in order to achieve the highest likelihood of success An Impact-Difficulty Matrix such as the one in Figure 1 can be useful for prioritizing among process improvement and implementation options Lean event participants can plot their ideas onto the four quadrants in the matrix based on whether or not an idea would have a large or small impact (either in terms of operational andor environ-mental objectives) and whether or not it would be difficult to implement This process lets people see visually which projects are most ldquoriperdquo for Lean
Connect Lean and Water Figure 1 Impact-Difficulty Matrix Efforts to Sustainable Water Management Strategies Lean and Six Sigma provide operational High tools that can support a broader corporate water sustainability strategy Leanrsquos focus on performance measurement continual improvement through employee engage-ment waste elimination improved ef- Low ficiency increased profits and customer satisfaction can be leveraged to support corporate water management efforts to Low High measure and report water use factor water
Difficulty into business decisions and implement the practical and effective solutions If your organization already has a sustainability policy andor specific water efficiency goals consider how Lean and water strategies could be used to enhance and accelerate those efforts
Risk-Based Water Sustainability Strategies
Depending on the importance of water to your business it may be worth developing a risk-based water sustainability strategy and then seeing how Lean and water efforts could support implementa-tion A number of resources can help you assess specific water-related risks determine the business case for water sustainability and develop implementation plans These include
Impact
9
Chapter 1 Introduction
bull Global Environmental Management Initiativersquos (GEMIrsquos) Connecting the Drops Toward Creative Water Strategies A Water Sustainability Tooltrade wwwgemiorgwater
bull World Business Council for Sustainable Developmentrsquos Global Water Tool wwwwbcsdorgwebwatertoolhtm
bull GEMIrsquos Local Water Tooltrade (scheduled to be released in spring 2012) wwwgemiorgGEMIInteractiveToolsaspx
This toolkit complements broader water sustainability strategy resources (such as those listed above) by exploring practical opportunities to leverage facility Lean and Six Sigma and similar process improvement initiatives to reduce water waste
True North Goals and Targets
Lean experts often extol the motivational power of setting goals and targets that represent the ldquoTrue Northrdquo for operations As noted by Lean expert Robert Hall of the Association of Manufacturing Excellence ldquoTrue North is what we should do not what we can do the ultimate ideal for the overall process and for every sub-process within itrdquo6 True North goals targets and metrics are powerful tools for inspiring and focusing employee attention and creativity to both continuously improve and find breakthrough solutions For example Nike Inc developed ldquoNorth Starrdquo goals and metrics to define what sustainable products and a sustainable company would look like which includes a focus on water stewardship7 Consider what the True North target is for water use in your facility For many facilities the True North targets may be zero wastewater and zero water use that is not incorporated into the product
Examining the Full Value Chain
To achieve sustainability goals itrsquos important to look beyond a facilityrsquos direct operations Lean methods can support water use and risk reduction efforts not only at areas within the direct control of a manufacturing or industrial facility but also throughout the lifecycle or extended value chain for a product or servicemdashfrom the extraction and processing of raw materials through production processes and onto product distribution use and disposition While the primary focus of this toolkit is on reducing water use at your facility Chapter 5 discusses opportunities to extend Lean and water techniques to other areas Figure 2 provides an illustration of how the content of the toolkit links to a value chain
6 Robert Hall ldquoThe Toyota Production System Seeks True Northrdquo Lean Directions e-Newsletter 2011 available at wwwsmeorgcgi-binget-newsletterplLEANamp20040709amp1amp
7 For more information on Nikersquos North Star see httpwwwnikebizcomcrreportcontentenvironment4-1-0-overviewphpcat=overview
10
Chapter 1 Introduction
Figure 2 Lean and Water Implementation Strategies
Understand Water Uses and Costs (Chapter 2)
Find Water Waste (Chapter 3)
Improve Operations and Processes with Lean and Water Strategies (Chapter 4)
Extend Lean and Water Efforts Throughout the Value Chain (Chapter 5)
Sourcing Materials and Inputs (Chapter5)
Production Manufacturing (Chapters 3 and 4)
Product Distribution Use and Disposition (Chapter 5)
To Consider
3Is water use responsible for major costs waste or risk at your organiza-tion If you donrsquot know how would you find out
3How has Lean affected your organizationrsquos use of water
3How could your organization benefit from efforts to reduce water waste us-ing Lean (Think about time and cost savings reduced risks and liabilities added value to customers etc)
3What ideas do you have for reducing water waste using Lean
11
CHAPTER 2
Water Use and Water Waste at Industrial Facilities
Understanding water use is an important first step in efforts to reduce water-related wastes costs and risks This chapter contains the following sections
bull Definition of Water Waste bull Industrial Water Use bull Water End Uses How Water Is Used at Facilities bull Measuring Facility Water Use Metering and Submetering bull Costs Associated with Water Use
Definition of Water Waste Water is one of the most critical resources in the world and is necessary for all types of industry Water is required in substantial quantities to create goods from food products to silicon chips In this toolkit the term ldquowater wasterdquo refers to use of water beyond the point that optimizes value to the customer This includes non-value-added water use throughout facility operations and support processes and from the supply chain through production product use and waste disposal Water waste can cause harm to health and well-being of people and ecosystems by diverting water from other needs and beneficial uses Reducing water waste can help ensure that present and future gen-erations have access to a sustainable water supply
Improve your facilityrsquos water efficiency by reducing water waste not only by reducing water intake but by finding creative ways to use water more efficiently Water efficiency as the term is used in this toolkit refers to reductions in the amount of water used per unit of production Water effi-ciency refers to the minimum amount of water needed to perform a task (Note that water-efficiency improvements do not necessarily mean that a facilityrsquos total water use is decreased since increases in production may offset water efficiency gains) Examples of water waste include
bull Loss of water through material failures such as leaky hose nozzles
bull Discarding water that could be reused such as treated rinse water
bull Wastewater discharges
bull Water used by high-flow appliances instead of more efficient alternatives
bull Use of water in excess of necessity such as the use of too much water for facility or parts cleaning
Understanding the many places where water waste occurs is an important first step for identifying areas for improvement
Chapter 2 Water Use and Water Waste at Industrial Facilities
Industrial Water UseThe use of water by industries both in the United States and throughout the world represents a significant portion of total water use US industrial water use is estimated to be more than 182 billion gallons per day (from direct water withdrawals not including water use from public water supply)8 While industrial water withdrawals account for just five percent of total water withdrawals in the United States thermoelectric power water withdrawals account for 49 percent Industrial and manufacturing businesses also use about 12 percent of the public water supply Industrial water us-ers include facilities involved in sectors such as chemicals food and beverage paper and associated products steel electronics and computers metal finishing petroleum refining and transportation equipment Overall two of the most water consuming sectors of the economy are agriculture and thermoelectric power although other industries may use a significant proportion of public water supplies in some areas
The share of industrial water use can be much greater in certain geographic areas and these areas can experience substantial supply pressures Figure 3 below shows a geographic distribution of wa-ter scarcity across the globe Areas prone to water scarcity will likely experience continued competi-tion for water resources which can impact your relationship with the surrounding community Be aware of your facilityrsquos location relative to potential water scarcity and consider water competi-tion when siting new facilities or building relationships with new suppliers In the United States the National Integrated Drought Information System maintains a user-friendly web portal(www droughtgov) with current information forecasts maps reports and resources addressing drought conditions and water scarcity
Industrial water use varies by sector as different activities require different inputs of water Box 6 lists eight industries that require substantial inputs of water
Water-Intensive Industries (Box 6)
3 Agriculture
3 Apparel
3 Beverages
3 Biotechnologypharmaceuticals
3 Electric power
3 Forest products
3 High-tech (including semiconductor manufacturing)
3 Metalsmining
8 Kenny Joan F et al Estimated Use of Water in the United States in 2005 USGS 2009 httppubsusgsgovcirc1344 The USGS data does not include industrial water use drawn from municipal water systems only direct withdrawals from surface and groundwater sources Actual industrial water use is likely greater For information on water use outside of the US see AQUASTAT Food and Agricul-ture Organization of the United Nations ldquoWater Withdrawal by Sector Around 2003rdquo data downloaded November 2010 wwwfaoorg nrwateraquastatmainindexstm Note that FAO data includes thermoelectric cooling water withdrawals in its industrial water totals
12
13
Chapter 2 Water Use and Water Waste at Industrial Facilities
Figure 3 Water Scarcity Map of the World
Source United Nations Environment Programme Map of Water Stress Indicator in Major Basins 2004 available at http mapsgridanogographicwater-scarcity-index
Water is a very important resource to many industries and as a result there are many opportuni-ties to reduce water use In the case of the high-tech industry which uses considerable quantities of water to manufacture semiconductors and other components water is vital to industry opera-tions Cleaning and rinsing silicon chips can require billions of gallons of water per year to produce a single chip can use up to 7900 gallons9 Apparel also ranks high in the list of water-intensive industries with cotton production and textile processing requiring substantial inputs of water Among industrial manufacturers the forest products sector is the third-largest consumer of water in the US requiring high volumes of water for pulp and paper manufacturing The electric power industry directly uses water extensively for cooling and emissions scrubbing fossil fuel plants and nuclear power plants require hundreds of liters of water for every kilowatt-hour of electricity that they produce10 Table 1 shows typical water quantities required to produce one ton of several manu-factured products
9 Uphadyay Sanjay ldquoMicroelectronics ndash Fostering Growth Opportunities in the Ultrapure Water Marketrdquo Frost amp Sullivan August 19 2011 available at wwwfrostcomprodservletmarket-insight-toppagdocid=240394448
10 CERES and Pacific Institute ldquoWater Scarcity amp Climate Change Growing Risks for Businesses amp Investorsrdquo February 2009 available at wwwpacinstorgreportsbusiness_water_climatefull_reportpdf
Chapter 2 Water Use and Water Waste at Industrial Facilities
Table 1 Typical Water Use Per Ton of Product
Paper 21000ndash528000 gallons
Beer 2113ndash6604 gallons
Sugar 792ndash105668 gallons
Steel 528ndash92460 gallons
Soap 264ndash9246 gallons
Gasoline 26ndash10566 gallons
Source United Nations World Water Assessment Programme United Nations World Water Development Report Water in a Changing World 2009 available at wwwunescoorgwaterwwapwwdrwwdr3
There is much variation among industrial sectors in relative water use and the need for water varies greatly across the stages of the product or service value chain from suppliers through production to product use It is important to know where in the value chain your industryrsquos water use is heavi-est so that you can appropriately target improvement efforts For example the apparel industry uses high volumes of water in raw material production whereas the biotech and pharmaceuticals industry uses most of its water resources in direct operations Table 2 shows the relative intensity of water impact (ranging from zero to three squares) in different segments of the value chain for several industry sectors
Table 2 High-Impact Water Use Sectors
Raw Material Production
Suppliers Direct Operations
Product Use End of Life
Apparel n n n n n
High-Tech Electronics
n n n
Beverage n n n n
FoodAgriculture n n n n n
Biotech Pharmaceuticals
n
Forest Products n n n
MetalsMining n n n n
Electric Power Energy
n n n n
Source CERES and Pacific Institute ldquoWater Scarcity amp Climate Change Growing Risks for Businesses amp Investorsrdquo February 2009 available at wwwpacinstorgreportsbusiness_water_climatefull_reportpdf
14
15
Chapter 2 Water Use and Water Waste at Industrial Facilities
Water End Uses How Water Is Used at Facilities In order to reduce water waste in industry it is important to understand the many ways that water is used within facilities Understanding water end uses is critical to identifying water savings opportunities While end uses of water vary by industry and by facility there are categories of water use that are present at most industrial facilities Water use in most industries can be classified into the following broad end uses
bull Production processing and in-product use
bull Auxiliary processes (eg pollution control labs and cleaning)
bull Cooling and heating (eg cooling towers and boilers)
bull Indoor domestic use (eg restrooms kitchens and laundry)
bull Landscape irrigation
These broad categories encompass many of the ways industrial facilities use water Among US industrial customers cooling operations (including cooling towers and open cooling systems) com-prise the single largest category of industrial water end use with more than 50 percent of industrial and commercial water demand combined going toward cooling11
The amount of water required for the various end uses differs by industry Service and manufactur-ing facilities require the most water for washing and processing while food and beverage facilities use most of their water intake in product preparation Figure 4 shows examples of water end uses in the computer and electronics manufacturing industry and the food processing industry
11 Vickers Amy Handbook of Water Use and Conservation WaterPlow Press 2001
16
Chapter 2 Water Use and Water Waste at Industrial Facilities
40
20
20
10
5 5
Figure 4 Breakdown of Water Uses in Two Industries
Rinsing
Cooling Systems
Fume Scrubbers
Water Purification
RestroomsOther
Landscaping
Computer and Electronics Manufacturers
3
42
14
13
9 Washing and Sanitation
Cooling and Heating
OneshyPass Cooling
Process
Domestic
OtherUnaccounted
Source Adapted from New Mexico Office of the State Engineer ldquoA Water Conservation Guide for Commercial Institutional and Industrial Usersrdquo July 1999 available at wwwosestatenmuswater-infoconservationpdf-manualscii-users-guidepdf
Major end uses of water often provide the greatest opportunities for water waste reduction and efficiency improvement For example in many food beverage and pharmaceutical companies cleaning process equipment can account for as much as 50 to 70 percent of a facilityrsquos total water use and represents a substantial opportunity to save water12 Figure 5 illustrates how water flows through several different end uses at an industrial facility note that this diagram does not incorpo-rate all reuse options Think of how a similar diagram would look that shows the water use at your facility
12 General Electric Company Water amp Process Technologies ldquoSolutions for Sustainable Water Savings A Guide to Water Efficiencyrdquo 2007 available at wwwgewatercompdfCapabilities20Brochures_CustAmericasEnglishBulletin1040enpdf
19
Food Processors
17
Chapter 2 Water Use and Water Waste at Industrial Facilities
Figure 5 Example Water End Uses at an Industrial Facility
Cooling amp Heating
Production Processes
Auxiliary Processes
Indoor Domestic Use
Landscape Irrigation
Treatment
Water Supply
Water in Products Wastewater Stormwater Losses Losses
Beyond these categories of water end use specific industries have processes that demand significant amounts of water For example in the textile industry a typical continuous fabric bleach range machine can consume 11000 gallons of water per hour13
Measuring Facility Water Use Metering and Submetering To gain a better understanding of water use patterns at your facility it is almost always helpful to use water meters Many Lean methods rely on the availability of timely and accurate information on key performance metrics By measuring water use and flows at the facility andor process level it becomes much easier to identify water efficiency opportunities As the saying goes you canrsquot manage what you donrsquot measure There are two types of water meters Source meters measure the amount of water being supplied to the facility while submeters measure usage for specific activities such as cooling towers process use or landscape water use
Water meters can be either portable or fixed on specific equipment Use portable water meters to measure water flows for processes or operations in your facility as part of Lean efforts such as gemba walks value stream mapping and kaizen events (strategies discussed in chapters 3-4) You can strap a hand-held acoustic water meter onto a pipe at a few places where you think there might be excessive water use Compare the water data from the master meter to the water flowing through the pipes in the process to confirm where there are potential water savings opportunities These data can help you develop a water balance (described in chapter 3) See Appendix B for resources to help you determine rates of water use including calculations and unit conversions
13 North Carolina Department of Environment and Natural Resources Water Efficiency Manual for Commercial Industrial and Institutional Facilities May 2009 available at wwwp2paysorgref0100692pdf
18
Chapter 2 Water Use and Water Waste at Industrial Facilities
Figure 6 Portable Water Meter
Source Eno Scientific wwwenoscientificcom
Accurately measuring water use can help you identify areas for targeted reductions and track progress from water-efficiency upgrades Submeters can also help identify leaks and indicate when equipment is malfunctioning In some cases it may also be useful to measure water pressure a drop in pressure can indicate the presence of a leak However especially for smaller facilities it will not necessarily make sense to use meters everywhere Consider using meters when you have a need to closely track data for example before and after a process improvement event on a water-inten-sive process You can use the data provided by the meters to compare water use and see how your efforts have improved your facilityrsquos water efficiency Larger facilities can also integrate meters into centralized building management systems making it easy to electronically track water usage gener-ate reports and trigger alerts when leaks or anomalies are found For additional advice on when to use water meters consult your local water utility or the resources in Appendix A
Installing the correct meter and ensuring it functions properly are critical to accurate water measurement There are many types and sizes of meters intended for different uses so it is impor-tant to choose the correct one Improper sizing or type of meter can cause problems For example
14 Smith Timothy A Plumbing Systems and Design Water-Meter Selection and Sizing 2008 wwwpark-usacomhomeaspxelid=71amparl=108
19
Chapter 2 Water Use and Water Waste at Industrial Facilities
an undersized water meter can cause excessive pressure loss reduced flow and noise Oversized me-ters are not economical and do not accurately measure minimal flow rates14 It is also important to ensure that water meters are properly calibrated according to the manufacturerrsquos recommendation and that appropriate maintenance practices are followed on metering equipment Most meters have internal mechanical parts and will begin to under-register the amount of water used as the meter gets older and the mechanical parts wear down When abnormal water measurements are detected check the metering equipment to ensure that the results are not due to metering equipment failures
By metering water use at the facility and process levels facility personnel can compile data to inform Lean improvement efforts Here are some practical tips for using water meters as a part of Lean efforts
bull Use flow meters and water quality or cleanliness standards to establish standard work for water usage flow and pressure levels taking into consideration ldquoset pointsrdquo recom-mended by equipment specifications and facility operating procedures These baseline levels give important context of what accounts for ldquonormalrdquo operating parameters against which improvements and new water losses can be assessed
bull Use data that meters provide to determine the appropriate frequency for aggregating and reporting water measures (eg hourly daily or weekly) that best meets your facil-ityrsquos needs
bull Show employees how to read and use water meters as part of Lean activities such as gemba walks value stream mapping and kaizen events so that they can identify water savings opportunities
bull Post water use reduction goals and water usage information on the factory floor on Lean production control boards or in other accessible places to raise awareness of water use and efficiency among employees
bull Track data from water meters over time Portfolio Manager an online building per-formance benchmarking tool available from the ENERGY STAR program can help you track and benchmark water consumption data For more information on the Portfolio Manager see Appendix A
20
Chapter 2 Water Use and Water Waste at Industrial Facilities
Costs of Water Waste As noted in chapter 1 costs associated with water use include more than the direct costs you pay for water supply but also the costs of water as it travels through processes and operations (see Figure 7) Box 7 provides examples of water costs such as energy pollution control regulatory compliance and raw material costs
Figure 7 Costs Associated with Water Use
Costs Associated with Water Use
Price of Incoming Water
Sewer Service Charge
Labor and other costs associated with water processing and treatment
Cost of energy and chemicals needed to process water
The ldquoprice on the water billrdquo
The cost of water use at a facility can be much greater than the amount on the water bill
Estimating the many components of total water cost for a facility can begin with the cost of water purchased from utilities but should also include the cost of steps required to process use and discharge the water These costs can amount to a good deal more than what appears on a utility bill When estimating water costs it is important to consider these and other indirect costs throughout all functions of a facility Be sure to use estimated future rates when assessing water costs in order to project the level of savings that will be possible when improvements are made
21
Chapter 2 Water Use and Water Waste at Industrial Facilities
Common Costs Associated with Water Use (Box 7)
Raw Material Costs
3 Water purchased from utilities marginal costs of purchasing additional wa-ter versus costs of conservation
3 Cost of water treatment filtering and softening before use
3 Costs for chemicals needed to treat and manage water
Energy Costs
3 Cost of energy to heat water
3 Cost of energy to pump water from its source or within the facility itself
3 Energy and labor costs for operating and maintaining water-using equip-ment
Pollution Control Costs
3 Wastewater and stormwater service rates including surcharges
3 Total cost of treating wastewater for disposal including labor energy chemi-cals equipment and residual disposal
3 Marginal costs of increasing effluent treatment capacity when water de-mand increases
Regulatory Compliance Costs
3Labor costs for regulatory compliance activities such as completing permit applications monitoring compliance and reporting wastewater discharges to regulatory agencies
Source Adapted from North Carolina Department of Environment and Natural Resources Water Efficiency Manual for Commercial Industrial and Institutional Facilities May 2009 available at wwwp2paysorgref0100692pdf
Full costs associated with water use often vastly outweigh the direct costs The direct cost of pur-chasing water from a utility may not seem significant enough alone to merit the effort to reduce water use but when the full cost of water is assessed the financial savings can be substantial Table 3 shows an example of the various costs of water in an industrial process In this example the esti-mated savings from implementing improvements using direct water and sewer costs alone is only 56 percent of the estimated savings using the full cost of water The flexible cost savings of conserved water is estimated to be 40 percent of total treatment cost Flexible treatment costs refer to expenses that vary according to the volume of water treated (eg energy used to pump and treat water treat-ment chemicals) fixed costs (eg capital equipment used for treatment) do not typically vary as wastewater throughput changes
Chapter 2 Water Use and Water Waste at Industrial Facilities
Table 3 Costs Associated with Water Used in an Industrial Process
Activity Unit Cost ($1000 Gallons)
City Water Purchase $355
Sewer Rate $399
Deionized using reverse osmosis
Equipment $057
Energy $120
Labor $143
Total deionized water $231
Deionized water (flexible cost) 40 x $231 = $092
Wastewater treatment
Sludge disposal $346
Treatment chemicals $244
Energy $032
Labor $625
Total wastewater treatment $1247
Wastewater treatment (flexible cost) 40 x $1247gallon = $498
Total cost of water $1344
Flexible cost savings of conserved water is estimated to be 40 percent of total treatment cost
Source Adapted from North Carolina Department of Environment and Natural Resources Water Efficiency Manual for CommercialIndustrial and Institutional Facilities May 2009 available at wwwp2paysorgref0100692pdf
22
23
Chapter 2 Water Use and Water Waste at Industrial Facilities
Appendix B contains a Water Cost Calculator that provides a template for calculating common costs associated with water use at industrial facilities It may also be useful to estimate the potential water and dollar savings that would result from implementing water efficiency measures at your facility see Appendix C for some equations that you can use to guide these estimates
In some water-stressed areas industrial facilities may face the possibility of an even greater water-related costmdashthat of lost revenue from the need to curtail production in the event of water supply disruptions Competition for water across residential agricultural industrial and environmental needs during periods of water scarcity may lead local water managers to impose limits on industrial water use Understanding the vulnerability to disruption of local water supplies can be an important consideration when assessing the true costs of water use when expanding or developing new facili-ties
The next chapter discusses strategies for understanding how water is used at your facility and iden-tifying opportunities to reduce water use and improve operations
To Consider
3 What are the primary water end uses at your facility
3 What processes and facility operations use the most water
3 What costs are associated with your facilityrsquos water use What indirect costs may be unaccounted for
Lean and Water Toolkit
25
CHAPTER 3
Finding Water Waste on the Factory Floor
Some of the most substantial reductions in water use can be found right on the factory floor This chapter describes several simple techniques to foster an understanding of where water goes in a facility and where it can be saved including the following
bull Water Gemba Walks bull Developing a Water Balance bull Water Waste and Value Stream Mapping bull Root Cause Analysis
While all of these techniques evaluate aspects of facility water use and can support your Lean efforts each has a different level of detail time and staff investment requiredmdashranging from a facility walk to a multi-day value stream mapping event Consider the level of effort desired before getting started to conduct the most effective analysis for your facilityrsquos needs
Water Gemba Walks A useful way to identify ways to reduce water consumption is a ldquogemba walkrdquo A water gemba walk is an exercise in which employees and managers walk the factory floor together to observe and inventory inefficiencies related to water use Gemba is a Japanese term meaning ldquothe real placerdquo in the context of Lean manufacturing gemba typically refers to the place where work happens (eg factory floor) Water gemba walks enable a team to quickly locate ldquolow-hanging fruitrdquo that save water at a small cost They help facilities to
bull Identify major sources of water loss such as leaks that can be repaired for significant savings
bull Acquire a more complete understanding of the major end uses of water and flows of water in the facility than can be achieved solely by analyzing water utility bills
bull Instill floor managers and workers with the importance of looking for and noticing leaks and inefficiencies helping to create a culture of water efficiency
Before you conduct your gemba walk first determine the purpose and scope of the walk How large an area will the walk cover and how long will it take How long will the team look at certain aspects of plant operations What information or data would equip the team to best see wastes and opportunities Second obtain copies of relevant documents and data including the last year of water utility bills or water consumption logs the floor plan of the facility if available and process diagrams for focus areas Third select the members of the gemba walk team A small team is best with approximately five to seven people constituting an ideal team size Include workers and man-agers familiar with the area outsiders new employees and veterans as well as an EHS representa-
26
Chapter 3 Finding Water Waste on the Factory Floor
tive in order to get a diversity of perspectives A brief training can orient your team to the purpose of a gemba walk and help them feel empowered to spot wastes throughout the walk
Once you have your team assembled use the Steps to Take During a Gemba Walk in Box 8 to find water waste and improvement opportunities at your facility
Steps to Take During a Gemba Walk (Box 8)
1 Identify all water-consuming equipment high-use areas and meterlocations
2Note all water losses evaporative losses and water incorporated in product excessive water pressure and leaks
3Observe shift clean-ups and process changeovers
4Quantify water flow rates and usage
5Note the water quality used in each process step
6Determine water quality needs for each process and quality of wastewater discharged
When employees are engaged and interested in finding wastes and identifying ways to improve water efficiency the benefits of your gemba walk can continue well beyond the exercise itself The training that your employees receive to conduct a gemba walk or other Lean exercises combined with immediate engagement in the exercises themselves can help to create a culture in which em-ployees routinely seek out ways to improve water efficiency
Consider conducting your gemba walk during a time when the facility is shut down as this can be a good time to find unexpected losses You can also collect data during your gemba walk on the nature of the water in use at various steps throughout each process knowing when treated water is necessary and when lower-quality water might be okay will help you identify reuse opportuni-ties later Table 4 Key Areas to Check During a Water Gemba Walk lists several common areas in industrial facilities in which water inefficiencies can be observed during a gemba walk
Chapter 3 Finding Water Waste on the Factory Floor
Table 4 Key Areas to Check During a Water Gemba Walk
Process and Equipment Use bull Cleaning Washing Rinsing bull Metal Finishing bull Painting bull Dyeing and Finishing bull Photo Processing bull Process Water Reuse bull Product Fluming (Water Transport) bull Pretreatmentfiltration systems bull Pump and Conveyor Lubrication bull Water Use in Products
Other Facility Support
bull Floor Washing bull Air Emission Wet Scrubbers bull Building Washing bull QAQC Testing bull Laboratories bull Landscaping and Irrigation bull Dust and Particulate Emission
Control bull Decorative Fountains and Ponds bull Vehicle Washing bull Cooling Water for Air Compres-
sors and Vacuum Pumps bull Hazardous Waste Storage and
Effluent
Cooling and Heating bull Single-Pass Cooling bull Cooling Towers bull Boilers Hot Water Steam Systems bull Air Washers bull Boiler Scrubbers
Sanitary and Domestic Kitchens bull Toilets bull Food Preparation and Cleaning bull Faucets bull Dishwashers bull Urinals bull Ice Machines bull Showers bull Faucets bull Wash-up Basins bull Food Disposals
Source Adapted from North Carolina Department of Environment and Natural Resources Water Efficiency Manual for Commercial Industrial and Institutional Facilities May 2009 available at wwwp2paysorgref0100692pdf
Leak detection during a gemba walk can be one of the best low-cost high-yield steps for reduc-ing water waste in a facility Leaks exist in all facilities and can result in water loss ranging from a fraction of a percent of a facilityrsquos total water use all the way up to a substantial portion Low water pressure dirty water and a high quantity of water that cannot be accounted for are all signs of a leak Bluing tablets or dyes can be used to easily check for leaks in tanks toilets or other water holding vessels Sonic or acoustic leak detection equipment can be used to check for leaks in under-ground pipes A simple drip gauge can help you conduct a basic estimate of how much water is lost due to a leak Many leaks can be repaired with simple measures such as tightening or replacing fit-tings15 In some cases it may be best to enlist the services of a professional leak-detection company to identify more complex leaks
15 North Carolina Department of Environment and Natural Resources Water Efficiency Manual for Commercial Industrial and Institutional Facilities May 2009 available at wwwp2paysorgref0100692pdf
27
28
Chapter 3 Finding Water Waste on the Factory Floor
Box 9 lists some examples of successful gemba walk and leak detection efforts
Examples of Water Gemba Walk Success (Box 9)
3Kirtland Air Force Base performed leak-detection gemba walks in which teams walked water lines with acoustic listening devices to find leaks sur-veying 90 percent of water distribution lines on the base The teams found that 31 leaks were dripping away nearly 16 percent of the basersquos water at a rate of 333 gallons lost per minute Repairs after the survey saved over 179 million gallons per year
3In one DTE Energy plant water pressure on the upper floors of the building was problematically low Observations on the factory floor revealed that an open valve on a new water treatment system was responsible for the low water pressure By installing a $3000 variable valve the company saved half a million dollars that it would have spent on a booster pump
3Del Monte Foods used a water gemba walk to identify potential water sav-ings in a recirculation line that was forked from eight inches to two four-inch pipes By combining the freshwater line with the main line the facility was able to save 300000 gallons per day
Sources US Department of Energy Federal Energy Management Program ldquoDistribution System Audits Leak Detec-tion and Repair Kirtland Air Force Base ndash Leak Detection and Repair Programrdquo 2009 information provided by Jason Schulist and Michael Sklar DTE Energy May 2011 and Scott Butler Del Monte Foods ldquoThe Del Monte Production System Lean to Green Integrative Futurerdquo Presentation at Green Six Sigma Summit Presentation May 2009
Developing a Water Balance While a gemba walk will help you identify potential water-savings opportunities developing a water balance will give you a more thorough picture of overall water use at your facility A water balance is a high-level simple assessment of the input and output of water in your facility that can help to identify opportunities for improving water efficiency A water balance might be appropriate for your facility especially if you are just beginning your journey with Lean and water and have not con-ducted a more detailed water audit
A water balance is a chart table or diagram of a facilityrsquos water use that shows the flows of water into and out of each process or operation in the facility It typically includes every water-consuming component on-site and all flows out of the facility A water balance can also include data on the cost of water Figure 8 illustrates the fundamental approach to developing a water balance Water bal-ances can also be developed as part of value stream maps
29
Chapter 3 Finding Water Waste on the Factory Floor
Figure 8 Typical Water Balance Calculation
Input (A)
Process Unit
A B C
Output (C)
A ndash (B+C) = Balance (or discrepancy)
Input is ProcessFacility Water Supply Water Losses (eg to air land and product) Output is Wastewater Discharge
Water Losses (B)
When creating a water balance make note of all water use in the facility and track water flows from the source through all operations at the facility to water losses and outputs including evaporative losses input to products and wastewater discharge All uses of water in a facility should be included in a water balance Common end uses of water are discussed in chapter 2 and include processing and auxiliary processing heating and cooling indoor domestic use and landscape irrigation The water balance should capture all of the flows into and out of each process at the facility and should verify that there is a balance between flows in and flows out Compare the estimated or measured total of end uses with the incoming metered amount Be sure to account for losses such as evaporation as well as wastewater discharge The Simplified Elements of a Water Balance figure (Figure 9) below shows an example of the components of a simple water balance for a facility while Table 5 Example Water Balance Summary presents overview information on water use by process from a water balance
30
Chapter 3 Finding Water Waste on the Factory Floor
Figure 9 Simplified Elements of a Water Balance
Pretreatment 950 gallons
Landscaping
Processing
Cooling Towers
Boilers 50 gallons
50 gallons
Losses
Wastewater
Losses
Wastewater
Water in Products
Stormwater
The process of putting together a water balance helps to capture a baseline of a facilityrsquos current water usage (see Box 10) A water balance will help you identify sources of risk such as leaks and compliance concerns Some companies choose to conduct water balances at varying levels of detail on a regular basis in an effort to locate ways to reduce water use and discover hidden water-savings dividends
Chapter 3 Finding Water Waste on the Factory Floor
Table 5 Example Water Balance Summary
Water Uses Input (GallonsYear)
Output (GallonsYear)
Loss (as a of Water Use)
Cooling tower make-up and boiler make-up
8484000 8248000 236000 (28)
Process use 6298000 6186000 112000 (18)
Cooling air compres-sors and pumps
7654000 7455000 199000 (26)
Landscaping 1675000 1533000 142000 (85)
General washing sanitation and maintenance
1101000 1095000 6000 (05)
Food preparation dishwasher
624000 613000 11000 (18)
Subtotal 26660000 25130000 1530000 (57)
Total Water Loss 1530000 GallonsYear
A spreadsheet developed by GEMI to help you create a water balance for your facility is available at wwwgemiorgwaterplannercalc-waterbalanceasp
Benefits of compiling a water balance include
bull Ability to identify processes that present the best targets for reducing water use
bull Establishment of baseline water use data from which improvements in efficiency can be benchmarked
bull Creation of a tool with which to compare different water-efficiency improvement strategies
31
32
Chapter 3 Finding Water Waste on the Factory Floor
Information to Collect for a Water Balance (Box 10)
To complete a water balance collect data on the volume of water flows for each process or operation in your facility including
3 Water and sewer bills from the previous one to three years
3 Numbers sizes and locations of water meters
3 Sources of incoming water
3 Diagrams of plumbing and water pipes as well as irrigation schematics
3 List of water-consuming processes
3 Information about unsewered wastewater (wastewater not discharged to municipal sewer systems such as through separate permitted discharges)
An outside expert could be the best option to help conduct a water balance for some facilities Contact your local water utility to ask whether it provides assistance for developing water balances some utilities provide this service (or related services) free of charge In many cases a water bal-ance can make it easy to identify steps to take to improve water efficiency If there is a discrepancy between the input and output of water in your facility that becomes apparent after preparing your water balance you might use that baseline to create a target future state that reduces the discrepan-cy by a set percentage Several of the resources in Appendix A provide information about developing water balances more involved assessments such as water footprints (see Box 11) and audits and benchmarking and tracking tools such as ENERGY STARrsquos Portfolio Manager
More Detailed Water Audits Water Assessments and Water Footprints
In the event that a more detailed assessment of water use and risks is desired an organization could consider conducting a water audit water source vulnerability assessment andor water footprint analysis While the results of these methods can inform the use of Lean to improve facility water efficiency they are typically conducted as stand-alone efforts that can require substantial effort and investment These methods are only described briefly below in this toolkit
bull A water audit typically involves a more comprehensive time-intensive facility-wide effort to as-sess a facilityrsquos water use and efficiency improvement opportunities A water audit may include activities described in this toolkit such as metering and baselining but it typically focuses on the full facility in a discrete brief period (eg during a 1ndash2 week effort) You may choose to follow specific standards when conducting the audits such as those of the American Society of Heating Refrigerating Cooling and Air-Conditioning Engineers
bull A water source vulnerability assessment generally looks outside of the facility at factors that have potential to affect the supply and cost of water that the facility and surrounding commu-nity relies upon This assessment can help a facility determine the risks of water supply disrup-tions or costs fluctuations and identify steps that may help to reduce these risks
33
Chapter 3 Finding Water Waste on the Factory Floor
bull Water footprinting analysis refers to the total volume of fresh water that is used directly and indirectly to run and support the business encompassing both water use within an industrial facility and throughout its supply chain You might consider conducting a water footprint to gain a more complete understanding of the places where water is used inefficiently throughout your supply chainmdashupstream among suppliers and downstream by users of the facilityrsquos output or products While a water footprint can be time-consuming and difficult to prepare it can be helpful in identifying improvement opportunities throughout the supply chain Box 11 provides tips for conducting water footprint analyses while chapter 5 discusses strategies for engaging suppliers to reduce water use and risks
Water Footprinting Tips (Box 11)
What information should water footprint analyses contain
3Track surface and groundwater sources rainwater stored in the soil and polluted water as inputs and outputs from a facility This can help address concerns about water scarcity and use
3 Include the geographical location of water withdrawals and discharges as well as direct and indirect water use
3 Work with suppliers to get data on water inputs and outputs from their operations often this is where the most water is used
3 Consider also estimating your productsrsquo end-use footprint which is any water used by consumers when they use the product
3 Note the scarcity and drought vulnerability of your suppliersmdasha water foot-print can be a valuable tool to identify business risks
3 Present the water footprint information in a clear and compelling manner such as a diagram showing water flows and quantities
For additional guidance on water footprinting see the Water Footprint Network website wwwwaterfootprintorg
Water Waste and Value Stream Mapping Like water balances value stream mapping can be a powerful tool for identifying water waste and savings opportunities Value stream mapping is a Lean method for creating a visual representation of the flows of information and materials across all the activities involved in producing a product for a customer In a value stream mapping event two maps are developed a map of the current state showing key data about existing processes and a future state map showing changes that can be made to reduce waste Value stream maps can be developed at the value-stream level (eg for a product family) or at the process level after your team has selected a process to investigate more closely
34
Chapter 3 Finding Water Waste on the Factory Floor
By adding water data to value stream maps value stream mapping can help you
bull Gain a better understanding of where the greatest water waste occurs
bull Identify areas where improvements can be made to reduce excess water use and other wastes
bull Develop an implementation plan for process improvements to reduce wastes in the value stream prioritizing water efficiency projects alongside other Lean and environ-mental projects
bull Quantify the expected savings from implementing those improvements
bull Create a culture of efficiency as team members from supervisors to floor workers be-come engaged in cutting waste
Adding Water Waste to Value Stream Maps Value stream maps depict all the activities in a value stream or a process along with key metrics that primarily relate to time Incorporating water considerations into a value stream mapping exer-cise is as simple as adding the amount of water used at each step onto the value stream map Figure 10 Adding Water Use to Value Stream Map Process Box shows a process data box with data on the water use by a particular process included Costs associated with the water used by each process or process step could also be added however to be fully representative these costs should include indirect costs such as those for support functions
Figure 10 Adding Water Use to Value Stream Map Process Box
CT = 4 min CO = 45 min Uptime = 61 Water Use = 9K gallonsday
2 people
Plating
Water use per day
35
Chapter 3 Finding Water Waste on the Factory Floor
Figure 11 Value Stream Map Incorporating Water Use Metrics shows an example of a current state value stream map that has been modified (with additions in blue) to include data on the amount of water used at each step Most activities that consume water are tracked in the map however note that this map does not include water loss as a result of leaks and evaporation or other losses that can occur between process steps
Figure 11 Value Stream Map Incorporating Water Use Metrics
Mar
ket F
orec
ast
Tota
l Lea
d Ti
me
= 68
day
sVa
lue
Adde
d Ti
me
= 15
min
Tota
l Wat
er U
se =
59K
gal
Cus
tom
erA
2 pe
ople
CT
= 4
min
CO
= 4
5 m
inU
ptim
e =
61
Wat
er U
se =
30K
gal
Dry
ing
2 pe
ople
Cle
anin
g
CT
= 2
min
CO
= 6
0 m
inU
ptim
e =
74
Wat
er U
se =
10K
gal
3 pe
ople
CT
= 7
min
CO
= 5
0 m
inU
ptim
e =
48
Wat
er U
se =
15K
gal
Rin
sing
I I
I 3
peop
le
Ship
ping
7 m
in4
min
2 m
in
15 d
ays
8 da
ys10
day
s 30
day
s
Prod
uctio
nC
ontr
ol
WK I
5 da
ys
D
I D
30 d
ays
WK
Rec
eivi
ng
CT
= 2
min
CO
= 3
0 m
inU
ptim
e =
93
Plat
ing
5 da
ys
2 m
in
Cus
tom
erB
Su
pplie
r1
Supp
lier
2
Lead
Tim
e
36
Chapter 3 Finding Water Waste on the Factory Floor
Many teams develop value stream maps using sticky notes to represent each step in a process This enables team members to move things around easily and helps them create the most accurate pic-ture of the process possible
To create a visual representation of the areas in the value stream map that use the most water try using different colors of sticky notes for high- and low-water using steps See Figure 12 for an example of the use of sticky notes to create a value stream map with water data added to several of the notes
Figure 12 Process Boxes Showing Water Waste
Another way to show water inputs and outputs associated with your facilityrsquos processes is by drawing lines into and out of each process data box on your value stream map In Figure 13 the red circles show where water and wastewater flows have been identified other waste streams are identified as well See EPArsquos Lean and Chemicals Toolkit for more information on this approach16
16 Value stream mapping is described in chapter 3 of the Lean and Chemicals Toolkit available at httpwwwepagovleanenvironmenttoolkitschemicalsch3htm
37
Chapter 3 Finding Water Waste on the Factory Floor
Figure 13 Water Inputs and Outputs Identified on a Value Stream Map
After creating a current state map your value stream mapping team will create a future state map that envisions ways to eliminate waste in the value stream and identifies areas for future process improvement projects such as kaizen events or just-do-its (described in the next chapter) With water data included on the current state value stream map your team will be able to easily identify opportunities for increased water efficiency and can work together to identify prioritize and develop an implementation plan for improvement projects that can meet both Lean and environmental goals Incorporating water waste into value stream mapping allows water efficiency projects to be combined with and considered together with other operational improvements
The implementation plan is a key product from the value stream mapping event Take care to de-velop an implementation plan that details the steps to carry out the improvements you have identi-fied being sure to assign responsibility for each step of the plan Consult with facility EHS staff and permitting authorities before making any changes that could affect facility emissions or wastewater discharges
For more information on adding environmental metrics to value stream maps see chapter 3 of EPArsquos Lean and Environment Toolkit17
17 Available on the EPA Lean Manufacturing and the Environment website at wwwepagovleanenvironment
38
Chapter 3 Finding Water Waste on the Factory Floor
Root Cause Analysis When you find a water waste in your facility whether during a gemba walk or a value stream map-ping exercise itrsquos important to ask ldquoWhy did this happenrdquo There is a set of Lean tools that can help you answer this question Root cause analysis is the process of identifying a problem and working through possible components to identify the most basic reason why the problem is occurring Once the cause of the problem is identified you can prevent its recurrence Two tools of root cause analy-sis include fishbone diagrams and the ldquo5 whysrdquo approach
Explore water waste yoursquove found in a Fishbone Diagram (also known as an Ishikawa Diagram) which shows potential causes of a problem by grouping causes into major categories to identify the source of inefficiencies To investigate water waste using a fishbone diagram first identify the specific problem you wish to investigate perhaps a spike in water use at the facility or a leaky pipe or valve Write the primary problem you wish to investigate in the head of the diagram usually on the right side The ldquobonesrdquo of the diagram represent groupings of potential causes of the problem common categories include the following
bull Measurements
bull Material
bull Man (or Personnel)
bull Methods
bull Machines
bull Environment
Along each grouping many detailed sub-causes are listed Figure 14 on the next page Fishbone Diagram of Excessive Water Use shows an example of a fishbone diagram that one facility used to assess its water use
Another root cause analysis tool is the ldquo5 whysrdquo technique The approach uses a systematic ques-tionnaire technique to search for root causes of a problem Simply ask ldquoWhyrdquo when considering the primary problem ldquoWhy is excessive water used hererdquo Follow up with additional ldquoWhyrdquo inquiries until you drill down to the root cause of the problem The goal of the exercise is to pursue further until the root of the problem is identified Be aware that there is sometimes more than one cause of a problem
39
Chapter 3 Finding Water Waste on the Factory Floor
Asking Why Five Times (Box 12)
1 Why are we using so much water The parts need to be cleaned before painting
2 Why do the parts need to be cleaned The parts fail quality checks if they arenrsquot cleaned before being painted
3 Why do painted parts fail quality checks The paint doesnrsquot adhere when part surfaces are not prepared properly
4 Why do the surfaces of the part need to be prepared The surfaces get contaminated by oils used in the previous process
5 Why are oils used in the previous process The oils are used to prevent corrosion during storage
Based on an example from Robert B Pojasek ldquoAsking lsquoWhyrsquo Five Timesrdquo Environmental Quality Management (Autumn 2000) 83
Figure 14 Fishbone Diagram of Excessive Water Use
Measurements Material Personnel
Environment Methods Machines
Excessive Water Use
No metrics
Budget baseline
Untreated water
Galvanized piping
Operator understanding
Obsolete article
Operator training
RCM
Notification procedures
Ineffective ventilation
No ventilation
No headers
Plugged pipesdisks
Eroded orifice disks
Failed controllers
Failed valves
Failed probes
Source Schulist Jason Lean Towards Sustainability How to Use Lean and Six Sigma Methods to Drive Your Sustainability Journey DTE Energy 2009
40
Chapter 3 Finding Water Waste on the Factory Floor
Completing a root cause analysis exercise should be a precursor to brainstorming potential solu-tions to water waste problems at your facility By using these tools you can ensure that you address the root cause of the problem first instead of merely treating the symptoms Chapter 4 explains how to take the knowledge about your facilityrsquos water use that you have gained through the tools listed in this chapter and apply that knowledge to reduce water use
To Consider
3 Where are the largest sources of water waste in your facility If you donrsquot know what steps will you take to find out
3 Are there processes or areas at your facility that could use non-potable or lower quality recycled water
3 What resources might be available in your area to help you conduct a water balance or water audit
3 Where in your facility might be a good target for a water-focused value stream mapping activity
41
CHAPTER 4
Lean and Water Efficiency Improvement Strategies
After yoursquove taken the important first steps to understand how your facility uses water there are a number of ways to reduce your water use through Lean and water efficiency efforts This chapter describes the following
bull Kaizen Events and Just-Do-Its to Reduce Water Use bull Integrate Water Efficiency into Everyday Lean Practices bull Lean and Water Applications for Facility Operations and Support Processes
Kaizen Events and Just-Do-Its to Reduce Water Use There are three key questions to ask to identify water-efficiency opportunities
Key Water-Efficiency Questions (Box 13)
3 Can we stop or prevent water losses (eg leaks)
3 Can we reduce water use (eg changing equipment plumbing processes andor behaviors)
3 Can we recycle or reuse water for another purpose (eg recirculating water within a process reusing process water for another application capturing rainwater etc)
Leanrsquos implementation-based methods of kaizen events and just-do-its are powerful strategies for putting water efficiency into practicemdashjust-do-its for easy changes and kaizen events for more in-volved projects A kaizen eventmdashalso known as a rapid process improvement eventmdashis a 2ndash5 day period when a cross-functional team examines a process and makes rapid changes to improve it
Before initiating significant process changes remember to consult with your local utility or environmental agency to make sure that all facility permitting requirements are met EHS staff at your facility can provide guidance on which changes may trigger regulatory or worker health and safety issues
42
Chapter 4 Lean and Water Efficiency Improvement Strategies
Water Kaizen Event Examples (Box 14)
GE conducted week-long water kaizen events at three of its largest water-consuming sites in 2009 including monitoring and assessing water use facility-wide and developing water-reduction projects with associated financial benefits
3 These kaizen efforts combined with flow monitoring and water-conservation efforts at the largest water-consuming site helped GE reduce water use 30 percent from 153 billion gallons in 2006 to 107 billion gallons in 2009
Through an environment health amp safety kaizen event at one site United Technologies Corporation eliminated 40000 gallons of wastewater per year and saved $50000 per year by changing how the facility managed test cells an underground storage tank and its waste streams
3 The facility no longer sends water to the storage tank and waste fluids from the process (eg oils) are collected separately to allow for reuse recycling or reclamation
3 These efforts are expected to further reduce wastes up to a total savings of 75000 gallons and $150000 per year
GE ldquoEcomagination 2009 Annual Reportrdquo pp 16-17 httpgeecomaginationcomreporthtml World Business Council for Sustainable Development (WBCSD) ldquoEco-efficiency Gains Ground United Technologies Corporation (UTC)rdquo WBCSD Case Study August 10005 available from wwwwbcsdorg
Two types of kaizen events to reduce water use include
bull Water Kaizen Events Consider conducting some kaizen events that are specifically designed to find and implement water efficiency opportunities (see Box 14 for examples) Good places to target include processes or areas of facility operations that use significant amounts of water Some companies such as GE use kaizen events to look for water-efficiency opportunities across a single facility Water balances and value stream maps with water data can provide good ideas for where to focus water kaizen implementation activities
bull Kaizen Events on Water-Using Processes Even if the main objective of a kaizen event is not water efficiency itrsquos helpful to keep an eye out for water-efficiency opportunities There may be opportunities to reduce water use such as by adjusting equipment or reusing water while also improving other aspects of the process Use the Key Water-Efficiency Questions in Box 13 above to identify water-savings opportunities
Often when yoursquore looking for water waste perhaps while using strategies described in the last chapter yoursquoll find easy solutions that can be implemented right away These are good things to address with ldquojust-do-itrdquo Lean activities Just-do-its or ldquoquick winsrdquo are actions that individuals can take immediately to improve a process or operation Many actions to stop water losses (such as fixing leaks or shutting off water that shouldnrsquot be running) or simple equipment adjustments to conserve water (such as reducing water flow) fall in this category
43
Chapter 4 Lean and Water Efficiency Improvement Strategies
Water Efficiency Strategies Ways to reduce water use range from simple strategies such as adjusting the flow of water or install-ing water-saving devices on equipment to more involved options such as reusing water or changing to a low-water or waterless process There are five general types of water-saving strategies (see Fig-ure 15) Consider these strategies as you brainstorm improvement ideas in kaizen events and other Lean efforts Key things to keep in mind include
bull Consider water efficiency improvements in the context of other process improvements and Lean performance goals in order to get the best results
bull Evaluate how the process changes might affect wastewater volume or quality or have other environmental impacts (For example switching from a water-based lubricant to an oil-based lubricant or solvent could have implications for worker health andor the environment)
bull Consider which water-efficiency best management practices and technologies make sense for your facility
bull Adopt visual controls ldquomistake proofrdquo devices on equipment (eg automatic shut offs) andor procedures to help ensure that process changes are effective and can be easily maintained
bull After testing potential solutions making changes and evaluating actual performance be sure to develop or update the standard work for the activity so that workers can eas-ily identify the current best way to perform an activity (Standard work is also further discussed below)
Figure 15 Five Water-Savings Strategies
Mor
e D
ifficu
ltBi
gger
Impa
ct 3 Adjust water flow
3 Modify existing equipment or install water-saving devices
3 Change to more water-efficient equipment
3 Reuse or recycle water (treat if needed)
3 Shift to a low-water or waterless process
When evaluating water reuse opportunities itrsquos important to consider both water quality and water quantity Not all processes need the cleanest highest-quality water In many cases you may be able to reuse the ldquowasterdquo water from one process or operation as an input to another process or for another use at your facility (eg air handling condensate reverse osmosis reject water etc) as long as you match the quality of water needed for its intended use You may need to do some testing
Chapter 4 Lean and Water Efficiency Improvement Strategies
and additional treatment of the process water to make sure it is acceptable for the next use When evaluating the feasibility of using process water for irrigation or other outdoor uses check with your local utility or water pollution control agency about restrictions on water reuse applica-tions The water may require testing to ensure it meets pollutant limits
Waterless Cleaning of GatoraderegBottles (Box 15)
PepsiCo switched from cleaning Gatoradereg bottles with water to a new method of cleaning with purified air The new cleaning process works so well that it is being adopted by bottling facilities around the world achieving a 20 percent reduction in water consumption throughout the process and saving billions of gallons of water
You can use the Table for Evaluating Water Reuse Potential below as a simple guide to identify possible ways to reuse water to meet the water quality and quantity needs of processes You may also want to consider using reclaimed municipal water or water from another facility for certain uses For more information on water reuse strategies consult EPArsquos Guidelines for Water Reuse (wwwepagovnrmrlpubs625r04108625r04108pdf)
Table 6 Table for Evaluating Water Reuse Potential
Process Operation
Water Need Water Discharge
Volume Quality Volume Quality
Cooling
Boilers
Restrooms
Kitchen
Landscape
Process A
Process B
Process C
It may be possible for your facilityrsquos water to be reused by another industry or business Look for these potentially symbiotic relationships with other facilities in order to stretch the value of your water even further for the community
44
45
Chapter 4 Lean and Water Efficiency Improvement Strategies
Integrate Water Efficiency into Everyday Lean Practices A variety of Lean toolsmdashincluding standard work visual controls 5S and total productive main-tenance (TPM)mdashhelp workers identify and eliminate waste in their daily activities as described further below Along with other wastes these Lean tools can reinforce and promote strategies to reduce unnecessary water use
Waste Elimination Culture You can integrate water efficiency into the ldquoculture of Leanrdquo at your facility developing the capac-ity of your employees to identify water waste in their normal work practices and find solutions that help meet your facilityrsquos Lean and water goals When your workers are passionate about improving the way your facility uses water the gains you achieve can become self-sustaining into the future
Lean is built around the framework of eliminating waste and striving for perfection or ldquoTrue Northrdquo as discussed in chapter 1 It is most successful when employees are fully engaged in driv-ing out waste and identifying improvement opportunities In the long run developing people to be effective problem solvers is more important than implementing specific tools It is critical therefore to train employees on how to identify water waste and to encourage and motivate them to work towards your organizationrsquos water efficiency goals The use of goals or targets combined with incentives and support resources can be a powerful way to drive change and performance improve-ment Frito-Layrsquos ldquoGallon per Pound Challengerdquo Program described in Box 16 provides an example of a successful water efficiency program anchored by metrics and employee engagement
Figure 16 Sign to Encourage Water Conservation
46
Chapter 4 Lean and Water Efficiency Improvement Strategies
Frito-Lay Engaging Employees in Water Efficiency (Box 16)
Frito-Layrsquos ldquoGallon per Pound Challengerdquo established a water efficiency pro-gram for all manufacturing sites to exceed 95 percent water use efficiency The program creates a culture of conservation through awareness trainingand accountability
3Through mid-year 2007 the sitesrsquo collective water efficiency has improved to over 80 percent which translates to a reduction in water use of over 1 billion gallons per year
3 Achieving the goal of 95 percent minimum efficiency for all sites will result in an additional water savings of approximately 800 million gallons per year
3 Frito-Lay earned a 2007 Water Efficiency Leader Award from EPA for these water-efficiency efforts
The Challenge is anchored by a water efficiency scorecard which is emailed to a wide array of stakeholders monthly
3Water efficiency is calculated by dividing standard water consumption by the actual water consumption reported by the site If a site uses more water than the standard an efficiency score of less than 100 percent will result
3The scorecard includes monetary savings opportunities for sites operating below 100 percent efficiency as well as savings associated with improve-ments
3Periodically a ldquodid you knowrdquo section with best practices is distributed with the scorecard to help raise awareness
Frito-Layrsquos utility wall program involves an event held at each site each day where a cross-functional team of technicians and workers gather to compare actual water consumption over the prior 24-hours to standard consumption and the sitersquos goals
3Utility walls enable teams to identify excessive water use and develop ac-tion plans to find and correct sources of variance
3Teams identify areas where flow measurement and control devices can drive conservation and ensure that viable water-efficiency projects are com-pleted and working optimally
Standard Work Standard work refers to an agreed-upon set of work procedures (sometimes referred to as standard operating procedures) that establish the best and most reliable method of performing a task or operation Standard work helps sustain previous Lean improvements as well as serves as the founda-tion for future continuous improvement (kaizen) efforts Incorporating water-efficient practices into
47
Chapter 4 Lean and Water Efficiency Improvement Strategies
standard work for processes helps to make them common practice
Whenever you change operational practices to reduce water use or install new equipment that requires different operations be sure to update the standard work for those operations Water-efficiency strategies include both behavior changes and technological changes but even technology-based changes may involve a behavior component For example workers need to properly operate and maintain new water-efficient equipment Use standard work to reinforce desired behaviors
Visual Controls Often used as part of standard work visual controls support standardized procedures and display the status of an activity so every employee can see it and take appropriate action Visual controls make it easier to perform actions the correct way and notice when there are problems
Visual controls are essential for supporting behavior-based water Figure 17 Dual Flush efficiency strategies Examples of visual controls to encourage Toilet Visual Control water efficiency include
bull Signs to encourage employees to use less water
bull Placards on water-using equipment showing proper operation (eg could include optimum water flow level)
bull Water meters or sub-meters on high water using processes or equipment (see discussion in chapter 3)
bull Displays of facility water use and water-use reduc-tion goals on production control boards along with other performance metrics (cost quality timesafety environmental etc)
5S Another way to incorporate water efficiency into Lean is through 5S 5S is a systematic five-step pro-cess used to create and maintain a clean orderly work environment Many organizations add a sixth ldquoSrdquo for safety creating 6S (5S + Safety) The six pillars of 6S consist of
bull Safety (Respect workplace and employee) Create a safe place to work by removing workplace hazards
bull Sort (Get rid of it) Separate items that are not needed in the work area
bull Set in order (Organize) Organize the items that remain in the work area
bull Shine (Clean and solve) Clean and inspect equipment and the work area
48
Chapter 4 Lean and Water Efficiency Improvement Strategies
bull Standardize (Make consistent) Standardize cleaning inspection and safety practices
bull Sustain (Keep it up) Maintain a clean orderly and safe work area
Figure 18 Six Pillars of 6S (5S + Safety)
Source Adapted from Productivity Press Development Team 5S for Operators 5 Pillars of the Visual Workplace Productivity Press 1996
49
Chapter 4 Lean and Water Efficiency Improvement Strategies
One key step that is relevant to reducing water use is ldquoShinerdquo since water is often used in cleaning and rinsing Many industrial and manufacturing businesses use large amounts of water to flush lines rinse parts and tanks and clean equipment floors and other areas These cleaning and rins-ing practices often are large sources of wasteful water use and therefore opportunities for water savings Educate employees on how to do the ldquoShinerdquo step using less water considering some of the Water-Efficient Cleaning Strategies in Box 17 below
Since employees work attentively to maintain a clean and neat work environment in 5S it presents a good opportunity to spot water waste In daily 5S shop floor sweeps encourage employees to check for water leaks in pipes hoses plumbing fixtures and equipment as well as turn off water that shouldnrsquot be running Add checking for leaks to 5S checklists and other approaches implemented under ldquoStandardizerdquo and ldquoSustainrdquo steps so it becomes standard practice
Water considerations are also relevant to ldquoSafetyrdquo Preventing water from being on the shop floor and walkways can eliminate slipping hazards Repairing hot water and steam leaks can prevent burns
Water-Efficient Cleaning Strategies (Box 17)
Dry Clean-up First
3Use brooms brushes squeegees andor other tools to remove materi-als and debris in dry form before using water for secondary cleaning (This saves water reduces wastewater and enables recovery of process materi-als)
Eliminate Unnecessary Water Use for Floor Washing
3 Sweep or use a water broom instead of hosing floors
3 Spot mop if necessary
ldquoMistake-Proofrdquo Your Equipment
3 Use hoses that have automatic shut-off nozzles
3 Use efficient spray nozzles high-pressure washers andor flow restrictors to clean efficiently while reducing water use (High-pressure low-volume sprays generally work better than low-pressure high-volume sprays)
Use Efficient Spray Washing and Rinsing Techniques
3 Use water wisely and turn off water when not in use
3 Do not use a hose as a broom doing so wastes time water and energy
3 Optimize spray and rinsing techniques and document the best practices in the standard work for the process
For more suggestions see North Carolina Department of Environment and Natural Resources ldquoWater Efficiency Manual for Commercial Industrial and Institutional Facilitiesrdquo May 2009 wwwp2paysorgref0100692pdf
50
Chapter 4 Lean and Water Efficiency Improvement Strategies
Total Productive Maintenance As a key strategy for finding and preventing water losses as well as other equipment failures Total Productive Maintenance (TPM) is also relevant to water efficiency TPM is a Lean method that focuses on optimizing the effectiveness of manufacturing equipment TPM focuses on team-based maintenance that involves employees at every level and function
A key practice in TPM is to maintain equipment in a manner that enables workers to quickly iden-tify and correct problems that may result in leaks or spills Since many facility operations use water not just production processes itrsquos important to extend the preventative maintenance practices of TPM to non-production areas (eg restrooms and irrigation) when looking for water issues Box 18 outlines Proactive Maintenance Tips to Reduce Water Use that can be incorporated into a TPM program For more tips and suggestions see EPArsquos ldquoWaterSense at Work Best Management Practices for Commercial and Institutional Facilitiesrdquo available at wwwepagovwatersense
Proactive Maintenance Tips to Reduce Water Use (Box 18)
3Adopt a user-friendly system for reporting water leaks and fix leaksimmediately
3Inspect hot and cold water lines steam lines and traps water-using equip-ment and plumbing fixtures routinely to identify potential problems and keep them operating properly
3When performing maintenance on water-using equipment replace worn parts and check to make sure that water-saving features (eg automatic shut-off valves) are operating properly
3Shut off water supply to equipment in areas that are not in use
Lean and Water Applications for Facility Operations and Support Processes As noted earlier the most water-consuming aspects of your facility may not be production pro-cesses other facility water uses include cooling towers (which are often the largest water end use) boilers support processes restrooms kitchens and irrigation Water balances value stream maps and other strategies in chapter 3 describe how to identify the largest sources of water waste at your facility These represent good targets for kaizen events to reduce water use Consider the Questions to Identify Water-Savings Opportunities in Facility Operations and Support Processes in Box 19 to identify initial opportunities
51
Chapter 4 Lean and Water Efficiency Improvement Strategies
Questions to Identify Water-Savings Opportunities in FacilityOperations and Support Processes (Box 19)
Cleaning
3Can process cleaning or facility cleaning be accomplished without using water (ie using pressurized air to clean products or containers sweeping debris off the floor)
Process Equipment
3Can process equipment reuse water (closed loop) or use reclaimed water from other parts of the facility
Cooling and Heating
3 Has your facility replaced once-through cooling systems with a multi-pass cooling tower or closed systems
3 Can you optimize the blow-downbleed-off controls on boilers and cooling towers
3 Have you considered switching to air-cooled equipment instead of water-cooled equipment
3 Does your facility reuse condensate water
Restrooms and Kitchens
3 Do restrooms have water-efficient fixtures (eg WaterSense labeled toilets and urinals faucet aerators and showerheads)
3 Do kitchens use new water- and energy-efficient dishwashers (eg ENERGY STAR qualified models)
Landscaping and Irrigation
3 Has your facility designed its landscape to consider the local climate and grouped plans by similar watering needs
3 Does your facility use drip irrigation low-flow sprinklers and optimized watering schedules to minimize water use
Leaks
3Have you identified and repaired leaks throughout your facility
Appendix D Water Efficiency Opportunity Checklist is a more extensive checklist for identifying water-savings opportunities throughout your facility
52
Chapter 4 Lean and Water Efficiency Improvement Strategies
Along with the questions in Box 19 and Appendix D a wide array of resources are available that provide information on low-cost water-efficiency measures for common components of facility operations as well as resources that provide guidance and examples relevant to specific industries Consider these water-efficiency strategies in your Lean improvement projects Examples of resources with guidance for specific operations andor industries include
bull ldquoWater Efficiency Manual for Commercial Industrial and Institutional Facilitiesrdquo by the North Carolina Department of Environment and Natural Resources httpsavewaterncorgbushomephp
bull ldquoWaterSmart Guidebookrdquo by the East Bay Municipal Utility District of Oakland California wwwebmudcomfor-customersconservation-rebates-and-services commercialwatersmart-guidebook
bull ldquoWaterSense at Work Best Management Practices for Commercial and Institutional Facilitiesrdquo by EPA Office of Water wwwepagovwatersense
bull ldquoFacility Managerrsquos Guide to Water Managementrdquo by the Arizona Municipal Water Users Association amwuaorgpdfsfacility_managers_guidepdf
See Appendix A for details about these and other water efficiency resources
To Consider
3 What just-do-it actions can you identify to reduce water use
3 What processes or operations would you consider for kaizen events fo-cused on water efficiency
3 What water-reuse options might there be at your facility What steps will you take to learn more about those opportunities
3 What ideas do you have for adding water-efficiency practices into everyday Lean practices (eg through Lean training use of metrics incentive pro-grams standard work visual controls 5S TPM on water-using equipment or other means)
3 What other ideas do you have for reducing water use with Lean or other process improvement efforts
53
CHAPTER 5
Lean and Water Beyond the Factory Floor
Looking beyond your facility operationsmdashsuch as your supply chain interactions with your com-munity and how you design productsmdashcan allow you to uncover new ways to reduce water use and risks while adding value and improving business operating conditions and market opportunities This chapter examines
bull Lean and Water Efforts in Your Supply Chain bull Engaging with the Community bull Lean Product Design
Lean and Water Efforts in Your Supply Chain Depending on your industry sector the greatest opportunities for water use reduction may be in your supply chain rather than your facilityrsquos own operations As discussed in chapter 1 compa-nies whose suppliers have water-intensive operations may feel pressures from customers or other stakeholders to reduce water use within their supply chain It is important for your business to understand water use and risks throughout the value chainmdashincluding upstream in supplier opera-tions and downstream in customer activities In particular the water needed to extract and process raw materials may be significant in some sectors while other stages such as product-use are more important for others
Some water impacts in the supply chain can be addressed by engaging your suppliers in your Lean and water efforts The techniques in this toolkit can be applied at both large and small companies Here are some ideas to get started
bull Ask suppliers about their water use and their water efficiency efforts
bull Invite customers andor suppliers to participate in a Lean and water value stream map-ping event water gemba walk or water kaizen event at your facility to learn from your experience and share their perspectives
bull Offer to participate in your customerrsquos andor supplierrsquos Lean events if your business has relevant expertise
bull Share training materials yoursquove developed best practices and success stories of your Lean and water efforts to educate suppliers on these efforts
bull Invite suppliers to participate in training sessions with your employees For example the furniture manufacturer Steelcase invites its suppliers to attend workshops covering Lean and environment topics at its ldquoSteelcase Universityrdquo
54
Chapter 5 Lean and Water Beyond the Factory Floor
bull Start a dialog with your suppliers about Lean and water projects to initiate together
bull Encourage suppliers to develop and share short- and long-term water reduction goals and report progress against the goals
bull Provide incentives recognition andor financial support for suppliers to conduct Lean and environmental improvement efforts andor for suppliers that help you meet your water efficiency goals
bull Consider focusing first on suppliers that are located in water-scarce areas where reduc-ing water consumption can have the greatest positive impact on community relations
For some smaller companies working with your supply chain may be more challenging than is the case for larger companies One option for smaller facilities is to inform your suppliers that they may access resources available through local utilities such as technology rebates or free or subsidized water audits
Dubois Chemical and Steelcase An Innovative LeanWater Supplier Partnership (Box 20)
Furniture manufacturer Steelcase worked with Dubois Chemical on a demon-stration project exploring an alternative pretreatment washing process on one of Steelcasersquos finishing lines
3The team analyzed the total cost of ownership (for energy labor watersew-age and process chemicals) in the current and future state process maps and relied on water recycling and other strategies to save time energy water and chemicals
Due to the projectrsquos success Steelcase has deployed it on seven powder coat-ing lines Results include
3 Saved $1 million per year
3 Eliminated phosphates from pretreatment discharge
3 Met 2007 emergency water-reduction requirements in Atlanta
3 Reduced water use by 80 percent chemical volume used by 20-30 percent and waste discharged by 85-95 percent
3 Saved 45 million gallons of water per year Sources SteelcaseDubois info from Mary Ellen Mika and Keith Lane ldquoJoint Case Study Reducing Your Water Foot-printrdquo presentation at 23 September 2008 Corporate Climate Response Conference Mary Ellen Mika et al ldquoE3 and GSN Learning Evolving and Expandingrdquo presentation at 2011 Manufacturing Innovations Conference
55
Chapter 5 Lean and Water Beyond the Factory Floor
Some companies participate in Lean supply chain initiatives that focus on environmental objectives such as water use reduction For example in the US Green Suppliers Network Program Lean ser-vice providers at Manufacturing Extension Partnership centers partner with environmental special-ists to deliver ldquoLean and Cleanrdquo process assessments for companies in the supply chains of larger organizations on a fee-for-service basis (see Box 21) The assessments use value stream mapping with an added focus on environmental metrics and costs to identify opportunities for improvements in resource use Many of the assessments include support for implementation A similar program called E3 (Economy Energy and Environment) incorporates Lean environmental and energy technical assistance and also involves local utilities as partners19 Companies should encourage their suppliers to consult their local water and energy utilities to find rebates or incentives for efficient technologies and process improvements
Green Suppliers Network Lean and Water Successes (Box 21)
Southwire and Pacific Gas amp Electric (PGampE)
3 Southwire a manufacturer of wire and cable products and a key supplier of PGampE participated in a Green Suppliers Network review in 2008 at its Car-rollton Georgia plant
3 Based on the value stream map-based review and the teamrsquos recommenda-tions the facility implemented a water-looping system that recycled water without affecting product quality
3 These efforts cut facility water use by more than 9 million gallons (over 90 percent) and saved more than $70000 annually
McNeil PPC and Johnson amp Johnson
3 McNeil-PPC Inc which manufactures Listerinereg products for Johnson amp Johnson participated in a Green Suppliers Network review project in 2007 with the support of Johnson amp Johnson
3 With value stream mapping the team found that 450 gallons of Listerinereg and 60 gallons of water were wasted per line change
3The team recommended solutions to minimize changeover wastes These recommendations have significantly reduced the amount of water that the facility would otherwise use
3With changes such as reusing water for boilers using flavors instead of water to clean equipment sequencing flavors from light to dark switching to waterless conveyor belts and using closed-loop cooling the facility has cut wastewater discharge by 25-30 percent
Sources Green Suppliers Network wwwgreensuppliersgovresultssuccesshtml and information provided by Char-lie Souders Johnson amp JohnsonMcNeil Consumer Healthcare June 29 2011
19 For more information on the Green Suppliers Network see wwwgreensuppliersgov and for more information on the E3 initiative see wwwepagovgreensupplierse3html
56
Chapter 5 Lean and Water Beyond the Factory Floor
Another way that companies can influence supplier actions is through policies and programs that encourage water efficiency Examples include
bull Procter amp Gamble (PampG) has adopted a Supplier Environmental Sustainability Score-card which produces annual supplier sustainability performance ratings for suppliers based on environmental data and qualitative assessments the suppliers provide which include data on water use Suppliers receive higher ratings for contributing to PampGrsquos environmental initiatives and PampG recognizes suppliers receiving the highest rating in the process20
bull PepsiCo has a Supplier Sustainability Outreach Program in which suppliers regularly submit metrics to track their progress toward short-term and long-term goals in energy water and waste efficiency The program prepares suppliers to join ENERGY STAR which is required for all US-based suppliers Suppliers gain access to PepsiCo resourc-es training tools and an invitation to the Global Environmental Sustainability Sum-mit Fuel electricity and water savings from the program totaled $12 million as of the third quarter of 2010 Forty co-packers and suppliers across 102 manufacturing sites participate and the program continues to expand in the United States and globally
bull Levi Strauss amp Co is adjusting its policies to allow more water recycling and reuse at contract finishing facilitiesmdashit now allows reclaimed water to be used at finishing facilities through onsite treatment internal recycling or from a nearby treatment facil-ity Uses for reclaimed water include landscaping toilets and heating ventilation and cooling systems
bull Wal-Mart provided over 100000 suppliers with a sustainability survey to collect infor-mation about their environmental performance The survey includes questions on the total water use of facilities that produce products for Wal-Mart as well as guidelines for conducting a water footprint and improving water efficiency at facilities Future phases of Wal-Martrsquos ldquoSustainability Indexrdquo project include the development of a database of information on product lifecycles and a tool to help merchants and customers under-stand the sustainability of products21
Consider the following five strategies to promote Lean and water efficiency efforts with your suppli-ers keeping in mind that some of these might be less feasible or applicable for small facilities
bull Require reporting from suppliers Requests for reporting on water use and effi-ciency efforts sends a message to supply chain businesses that the company cares about water It may also help you understand business risks and opportunities to assist suppli-ers in reducing water use or risk Benchmarking of water metrics (eg water intensity
20 For more information about PampGrsquos sustainability work with suppliers see wwwpgcomen_USsustainabilityenvironmental_sus-tainabilityoperations_supplierssupplier_engagementshtml
21 For more information on Wal-Martrsquos Sustainability Index see httpwalmartstorescomSustainability9292aspx
57
Chapter 5 Lean and Water Beyond the Factory Floor
ratios that relate water use to production levels) may be useful to set goals and perfor-mance targets Companies can encourage suppliers to utilize ENERGY STARrsquos Portfolio Manager or other tools to track environmental performance
bull Examine product specifications Evaluate how procurement requirements affect the amount of water required to produce or transport the product to facilities Some com-panies may be able to reduce the water used in their supply chains by changing their sourcing specifications
bull Provide recognition awards andor incentives Recognizing supply-chain water and environmental initiatives can raise awareness of and encourage water use reduc-tion and best-practice sharing among suppliers Stories of water-saving efforts may also be of interest to customers
bull Consider supplier requirements It may be appropriate to consider water-related performance in the selection of suppliers particularly in water-intensive parts of your supply chain Performance targets or certification requirements (eg ISO 14001) could also be incorporated into procurement requirements or partnership agreements Consider developing sector-specific standards to reduce overall environmental impacts (eg the Business and Institutional Furniture Manufacturersrsquo Association Sustainability Standard)22
bull Provide subsidize or make referrals for technical assistance Companies can provide technical assistance or training on Lean and water approaches to supply chain partners Alternatively encourage participation of supply chain partners in ldquocommuni-ties of practicerdquo to share information on water efficiency and environmental improve-ment opportunities Manufacturing Extension Partnership centers provide support for Lean training and can help you integrate water efficiency considerations into your sup-ply chain Organizations can also make suppliers aware of water efficiency resources and services available from local utilities and other sources
bull Collaborate on joint Lean and water projects Collaborate with your suppliers and or your customers to develop approaches to reduce water use and risks or to capture new market opportunities Consider using the ideas strategies and tools in this toolkit as a starting point for a discussion about Lean and water opportunities to pursue
22 This standard is available at wwwbifmaorgpublicSusFurnStdhtml
58
Chapter 5 Lean and Water Beyond the Factory Floor
Levi Strauss amp Co and the Better Cotton Initiative (Box 22)
Levi Strauss amp Co completed a third-party lifecycle assessment to understand the environmental impact of an iconic product Levirsquosreg 501reg jeans The com-pany discovered that
3 Forty-nine percent of water consumption for Levirsquosreg 501reg jeans occurs in cotton production while another 45 percent occurs after consumers take the products home
3 The remaining water use is divided among fabric production (2 percent) finishing (3 percent) and retail (1 percent)
Recognizing the importance of the cotton production stage Levi Strauss amp Co joined the Better Cotton Initiative (wwwbettercottonorg) in 2008 to change the way it grew cotton
3 The Better Cotton Initiative seeks to make global cotton production better for the people who produce it better for the environment and better for the apparel sectorrsquos future
3 Pilot projects in countries such as Brazil India Mali and Pakistan work to reduce the environmental impacts from cotton production while supporting local economies
3 In Pakistan participating farms cut water use by over 30 percent 117 bil-lion cubic meters of irrigation water in 2010
Source Levi Strauss amp Co ldquoCEO Water Mandate Communication on Progress 2010rdquo wwwlevistrausscomsites
defaultfileslibrarydocument201012lsco-ceo-water-mandate-cop-2010pdf
Engaging with the Community In many cases water stewardship is a key component of a facilityrsquos ability to operate in a communi-ty Depending on where your facility is located your business and the surrounding community may face different types of water resource challengesmdashsuch as water scarcity infrastructure or pollution concerns Especially in water-scarce regions or during droughts people in the community may have an increased interest in what your facility is doing to reduce its impacts on local water resources Indeed community engagement is recognized as a key pillar of water resource management by the United Nations CEO Water Mandate which assists companies in developing and implement-ing sustainable water policies and practices23 Engaging proactively with your community on water conservation can be an effective way to mitigate water-related business risks as well as reduce your organizationrsquos overall water footprint
23 The UN CEO Water Mandate is available at wwwunglobalcompactorgIssuesEnvironmentCEO_Water_Mandate
59
Chapter 5 Lean and Water Beyond the Factory Floor
Two key strategies for effective community engagement include
bull Educate and engage your employees in water-efficiency efforts at your facility and encourage them to adopt similar practices at home (eg check for leaks use efficient appliances and faucets turn off water when not in use etc) Build the capacity of employees to spot water waste and problem solve throughout their daily activities on the job and off
bull Partner with community members and local organizations to conduct projects that improve water use water quality andor water infrastructure resources in the com-munity Consider using Lean methodsmdashsuch as a waste walk kaizen event or even a Lean design eventmdashto rapidly brainstorm and test improvement ideas for projects and include community stakeholders in those efforts
Along with the value of community engagement these strategies can have the benefit of partially or fully ldquooffsettingrdquo impacts the facility may have on local water resources That is a facility can sup-port efforts that replenish the local water supply by at least the amount of water the business uses directly In India PepsiCo has achieved a positive net water balance in this way (see Box 23)
PepsiCorsquos Positive Water Balance Project in India (Box 23)
At its facilities in India PepsiCo achieved a ldquopositive water balancerdquomdashwhere businesses contributed more water to the communities than they consumedmdash in 2009 and 2010
3 Savings of over 3 billion liters of water in 2009 and over 4 billion liters in 2010 have been verified externally by Deloitte LLP
As part of these efforts PepsiCo India has
3 Reduced water usage in manufacturing by 45 percent since 2005
3 Partnered with government agencies and local organizations to increase peoplersquos access to clean water
3 Worked with agricultural universities to promote ldquodirect seedingrdquo of rice paddies which allows seeds to be directly planted into the soil (without the need for a nursery) and avoids the need for flood irrigation (This reduces water use by up to 30 percent)
3 Saved over 5 billion liters of water from 6500 acres of direct-seeded paddy fields
3 In 2010 PepsiCo began working with the Nature Conservancy to explore ways to credibly achieve a positive water impact across its global operations
Source PepsiCo ldquoReplenishing Water Conserving the worldrsquos most precious asset Waterrdquo httppepsicoindiacoin
purposeenvironmental-sustainabilityreplenishing-waterhtml accessed 28 July 2011
60
Chapter 5 Lean and Water Beyond the Factory Floor
Businesses can use Lean tools to engage with communities in collaborative problem solving to achieve social economic and environmental goals such as water efficiency For example DTE Energymdasha Detroit Michigan based electric utilitymdashhas used tools including gemba walks value stream maps and ldquocritical-to-sustainabilityrdquo trees (a modification of ldquocritical-to-qualityrdquo trees) with Detroit area businesses and community members to tackle the following projects
bull Partnered with a non-profit to manage combined sewer overflows by planting thou-sands of trees to reduce the stormwater runoff in Detroit
bull Found a new use for the buffer land around substations as community gardens with thousands of pounds of produce harvested at each substation and donated to food pantries
bull Created a community-supported agriculture business model based on a gemba walk with the community that identified issues such as urban blight meaningful work neighborhood connectivity and healthy living
In areas where water scarcity and drought are issues facilities can engage with communities to share knowledge work toward solutions and build goodwill Here are two examples of companies who engaged in collaborative dialogue with their communities in response to problems with water scarcity in areas where their operations were located
bull Coca-Cola partnered with the United Nations Development Programme and Chinese government representatives to improve water efficiency in response to a severe drought threatening sugarcane growers The first phase will be completed in 2011 and will focus on improving infrastructural facilities that support the farmersrsquo work and life directly such as optimizing irrigation facilities and recycling treated wastewater from sugar plants to improve farm production and water use efficiency This first phase will provide approximately 500 million liters of water to rural residents and directly benefit 100000 rural sugarcane farmers in the region In future phases this collaboration will pursue improvements in water efficiency in business operations and will seek to ease pressure on local water supplies through continuing community water partnerships24
bull The chemical manufacturer Sasol identified water scarcity as a risk to its operations in South Africa and pro-actively approached the problem by organizing a joint dialogue with community stakeholders representatives of water-intensive industries in South Africa government and non-governmental institutions and local research institutions The dialogue promoted cooperation among the stakeholders and between Sasol and its surrounding community as the sharing of knowledge and experiences coalesced toward the formulation of several ideas for collective action toward improved water efficiency25
24 For more information about Coca-Colarsquos work with sugarcane growers in China see wwwthecoca-colacompanycomdynamic bullpress_center201103chinas-sustainable-sugarcane-initiativehtml
25 For more information see httpsasolsdrinvestoreportscomsasol_sdr_2008page_id=141
61
Chapter 5 Lean and Water Beyond the Factory Floor
Lean Product Design Lean design methods are a group of Lean tools and techniques that aim to
bull Design (or redesign) high-quality products that meet customer needs with the least amount of waste (aspects that do not add value) andor
bull Design (or redesign) processes and equipment that add value to products using the least amount of time material and capital resources
Taking a close look at the parts and processes that go into the creation of a product can help you to identify wastes including water waste and improve product quality reduce costs and potentially gain market advantage
Lean product design methods often rely on a set of criteria to evaluate the best alternatives Incor-porating efficient water use as a design criterion for product development can reduce water waste throughout the entire life cycle of the product Consider raw materials synthesis production customer use and the ultimate disposal or recyclingremanufacturing of the product when consid-ering water use
As with other aspects of Lean implementation product design is most effective when it incorporates ldquowhole systemsrdquo thinking focused on eliminating all forms of waste Be sure to consider traditional Lean goals for both the product and the manufacturing process such as product quality customer service cost and time when you incorporate water efficiency into the Lean product design pro-cess Improving water efficiency should not mean lowering the quality of your finished product or decreasing the productivity of your facility Note that sometimes design alternatives that improve water efficiency can present trade-offs in which decreasing water use results in increased en-ergy or chemical use such endeavors may not be worthwhile depending on the overall impacts You can help ensure that your product quality remains high by adhering to product quality design standards such as the US Green Building Councilrsquos LEED standards for buildings26 EPArsquos Water-Sense program standards for certain water-consuming products and appliances27 and sector-specific product standards
There are several Lean tools to help design (or redesign) a product in a way that reduces wastes Some of these tools are described in Table 7 below For more information about these tools and an explanation of which tools to use in various product design stages see chapter 6 of The Lean and Chemicals Toolkit28
26 The US Green Building Councilrsquos Leadership in Energy and Environmental Design (LEED) standards are available at wwwusgbc orgDisplayPageaspxCategoryID=19
27 For more information about the US EPA WaterSense Program see wwwepagovWaterSense 28 Available at wwwepagovleanenvironmenttoolkitschemicals
Chapter 5 Lean and Water Beyond the Factory Floor
Table 7 Methods Used in Lean Design29
Method Description
3P (Production Preparation Process or Pre-Production Planning)
An integrated and highly detailed approach to product andor process development which involves rapidly designing production processes and equipment to ensure capability built-in qual-ity productivity and flow 3P minimizes resource needs such as capital tooling space inventory and time
Design for Lean Six A method for designing processes that support Sigma Lean Six Sigma objectives such as reduced vari-
ability to improve yield reduce waste and accel-erate time-to-market
Design for Manufacturing amp Assembly
A simultaneous engineering process designed to optimize the relationship between design func-tion manufacturability and ease of assembly
Failure Mode amp Effects A design review methodology that focuses on Analysis identifying the potential failure modes of a prod-
uct and subsequently determining ways to miti-gate each risk of failure
Quality Function Deployment andldquoVoice of the Customerrdquo
An overall methodology that begins in the design process and attempts to map the customer-defined expectations and definition of quality into the processes and parameters that will fulfill them It integrates customer interview and market research techniques with internal cross-functional evaluations of the requirements
Value Engineering An organized methodology that identifies and selects the lowest lifecycle cost options in de-sign materials and processes that achieves the desired level of performance reliability and cus-tomer satisfaction It seeks to eliminate unneces-sary costs in the above areas and is often a joint effort with cross-functional internal teams and relevant suppliers
29 For additional information about many of these tools see Mascitelli Ronald The Lean Design Guidebook Technology Perspective Northridge CA 2004 See also EPArsquos webpage on 3P wwwepagovleanthinkingthreephtm
62
Chapter 5 Lean and Water Beyond the Factory Floor
Table 8 lists examples of questions to ask when evaluating product design alternatives to identify ways to reduce water waste during all phases of the product life cycle
Table 8 Questions to Ask During Lean Product Design
Life Cycle Phase Questions to Ask
Sourcing Materials 3 Will raw material production prior to manufacture and Inputs involve intensive use of water
3 Can you switch to materials that require less water in their production or work with suppliers to reduce water use
Production 3 Will water be used to manufacture the product Manufacturing Evaluate all new equipment and modifications
3 What steps can be taken to reduce the amount of water that will be used to manufacture the product (eg switch to water-less processes reuse water etc)
3 How can you design products to reuse water in multiple process steps (eg recovering rinses from cleaning counter-current flow or refiltering water)
Product Distribution 3 How much water will the product require during Use and Disposition use
3 What product design alternatives use less water (eg through reuse systems water-efficient fea-tures etc)
3 What steps can you take to ensure that product performance is maintained as you implement water efficiency improvements
3 How will the product design affect customer water use Can reductions in the product use phase be guaranteed
3 How can the design ensure customers will be satis-fied with product performance even with reduced water use
Some companies report that the ldquoseven waysrdquo method provides a useful means to identify a more diverse creative set of improvement options to address specific water-related needs This method is often used in the Lean design process This method typically involves brainstorming of seven alter-native approaches for addressing a specific improvement opportunity Sometimes teams are encour-
63
64
Chapter 5 Lean and Water Beyond the Factory Floor
aged to look at how similar tasks are accomplished in the natural world to spark creative thinking on alternatives The team then scores the seven alternatives using pre-established weighted criteria to select the preferred solution Consider incorporating water efficiency into these criteria (water used to manufacture andor full life-cycle water use) to ensure that product design alternatives are evaluated according to your Lean and water efficiency goals
Examples of Water Conservation through Product Design (Box 24)
GE used the 3P (Production Preparation Process) Lean strategy to launch a new water-saving product line
3Geospringtrade hybrid water heaters dishwashers and top-loading washing machines are being redesigned from scratch using Lean manufacturing techniques
3Production team members from engineers to technicians now work together in a cross-functional approach that involves everyone from design through production using scaled-down equipment and product mockups to visualize improvements
3This hands-on whole-team approach has allowed employees to make ad-justments in real-time allowing problems to be identified early and produc-ing dramatically simpler designs that cut total product development time
Levi Strauss amp Co examined the design of its popular blue jeans to identify ways to reduce the water used to manufacture the product
3 WaterltLesstrade jeans reduce water consumption by an average of 28 per-cent and up to 96 percent for some new products
3These water savings were accomplished by reducing washing cycles incor-porating ozone processing into washing and removing water from stone washing
3While the production of Levirsquosreg blue jeans like many products uses a sig-nificant amount of water in the supply chain as well as through consumer end use the company made significant progress by addressing water use in the manufacturing process
As described earlier in this chapter there is great potential for water savings throughout a productrsquos supply chain including the acquisition of resources and raw materials as well as the water that customers will use with the product or service However if you are just getting started with Lean consider focusing first on water use within your facility before branching into your supply chain and customer-use considerations
65
Chapter 5 Lean and Water Beyond the Factory Floor
To Consider
3What parts of the extended value chain of your enterprise use the most water If you donrsquot know how will you find out
3Have you talked with any of your suppliers about Lean and environmental improvement efforts
3What opportunities are there to offset water impacts and improve water resources for the local community
3What changes could you make to the design of your products to reduce water wastes
Lean and Water Toolkit
67
CHAPTER 6
Conclusion
This chapter includes the following sections bull Your Lean and Water Journey bull Concluding Thoughts
Your Lean and Water Journey We hope that this toolkit has provided you with practical ideas to leverage Lean methods to identify and eliminate water waste at your facility Learning to see water waste and to identify improvement opportunities using Lean tools will help you to save money and be a better partner to your com-munity by placing less of a burden on local water supply There are many tools and techniques to get started with using Lean to reduce water waste As described in more detail in chapter 1 here are three ways to get started with Lean and water efforts
bull Learn more about how your facility uses water Connect with environment and facilities personnel to discuss opportunities to reduce water waste with Lean Find water waste in your facility using tools like metering and water balances
bull Engage employees in lean and water improvement efforts Involve employees in teams to brainstorm ways to reduce water use encouraging their ideas to innovate improvement opportunities Try out some of the strategies for eliminating water waste that are described in this toolkit
bull Connect Lean and water efforts to sustainable water management strategies Use Lean tools to support a broader corporate water sustainability strategy Identify what the ldquoTrue Northrdquo goals and targets are for water use at your facility and track progress to inspire improvement and creative solutions Look beyond direct operations to engage your customers suppliers and communities
Many of the techniques in this toolkit can help you reduce water waste and identify savings rapidly however it is important to think about the bigger picture of how water is used across your organiza-tion Figure 2 repeated below from chapter 1 illustrates how the tools and techniques described in this toolkit can help you to address water use throughout your value chain
68
Chapter 6 Conclusion
Figure 2 Lean and Water Implementation Strategies
Understand Water Uses and Costs (Chapter 2)
Find Water Waste (Chapter 3)
Improve Operations and Processes with Lean and Water Strategies (Chapter 4)
Extend Lean and Water Efforts Throughout the Value Chain (Chapter 5)
Sourcing Materials and Inputs (Chapter5)
Production Manufacturing (Chapters 3 and 4)
Product Distribution Use and Disposition (Chapter 5)
Concluding Thoughts We hope this toolkit spurs creative thinking and energy within your organization and encourages you to explore these opportunities We aim to periodically release new versions of resources in EPArsquos Lean and Environment Toolkit series while working with partner companies and organizations to explore ways to improve efficiency using Lean We also hope to learn from your experiences using this toolkit Our goal is to refine the techniques presented provide examples and case studies to il-lustrate the possible benefits of these tools and present new techniques as they emerge We wish you success on your Lean and water journey
Your Thoughts on the Toolkit
Now that you have finished this toolkit reflect on what you read by answering these questions
3 What strategies and tools in the toolkit seemed particularly interesting Which ones were most applicable to your facility
3 What steps will you take next to advance Lean and water efforts at your facility
3 What other information and tools would help your organization to achieve your Lean and water goals
69
APPENDICES
Appendix A Water Efficiency Resources and Technical Assistance Providers This appendix describes resources and places to go for more information concerning the following topics
bull Water Conservation and Efficiency Resources bull Technical Assistance Providers
This appendix focuses on resources that are directly applicable to manufacturing and industrial facilities however some resources and tools may have broader relevance and contain information that will be useful to commercial institutional and residential water users as well as industrial water users
Water Efficiency and Conservation Resources At the Crest of a Wave A Proactive Approach to Corporate Water Strategy Pacific Institute wwwpacinstorgreportscrest_of_a_wave Making the case that businesses and industrial facilities must prepare for water trends this guide helps users to design and implement a two-stage water conservation strategy Case studies and success stories include those from companies such as Unilever Nestleacute Toyota General Motors Anheuser-Busch GE Proctor amp Gamble and more The steps presented help corporations to create a comprehensive approach to managing water risks and opportunities
Collecting the Drops A Water Sustainability Plannertrade Global Environmental Management Initiative (GEMI) wwwgemiorgwaterplanner This web-based tool and downloadable document provides step-by-step guidance and resources to help facilities conduct assessments of their water use and impacts on the water supply Facilities can then use this information to develop water sustainability strategies create action plans and take actions to improve water resource management in their operations and community The planner includes case examples of how GEMI member companies have engaged internal and external stake-holders and generated actions to improve water resource management and conservation Modules include
bull Module 1 Facility Water Use and Impact Assessment Program bull Module 2 Water Management Risk Assessment Questionnaire bull Module 3 Case Examples and Links
70
Appendix A Water Efficiency Resources and Technical Assistance Providers
Commercial Institutional and Industrial (CII) Water Users Manufacturing Introduction Alliance for Water Efficiency wwwallianceforwaterefficiencyorgManufacturing_Introductionaspx The Alliance for Water Efficiency Resource Library webpages offer information on CII water use and efficiency opportunities as well as links to the research and information about this end user catego-ry In manufacturing major uses and topics include cooling water process water steam generation and boilers sanitation irrigation food services and housekeeping The resource briefly discusses the need for and value of water audits for facilities and applying the strategies of reduce reuse and recycle for facility water consumption
Connecting the Drops Toward Creative Water Strategies A Water Sustainability Tooltrade GEMI wwwgemiorgwater This tool presents the business case for water efficiency and provides guidance and case studies on water assessment opportunity identification planning and implementation Five core analytic modules comprise a roadmap to help facilities identify specific steps that they can take to reduce their water use
bull Module 1 Water Use Impact and Source Assessment bull Module 2 Business Risk Assessment bull Module 3 Business Opportunity Assessment bull Module 4 Strategic Direction and Goal Setting bull Module 5 Strategy Development and Implementation
Cooling Towers Water Use Washington State Department of Ecology wwwecywagovtreeequipCThtml Cooling towers are a significant area of water use for many facilities and taking steps to assess and reduce water use in cooling towers can substantially lower a facilityrsquos overall water footprint The Washington State Department of Ecologyrsquos Technical Resources for Engineering Efficiency (TREE) Team created this succinct checklist of conservation suggestions questions to ask during a water use evaluation and suggested data to collect to identify opportunities for water savings from cooling towers
ENERGY STAR Portfolio Manager US Department of Energy and US Environmental Protection Agency wwwenergystargovindexcfmc=evaluate_performancebus_portfoliomanager This tool allows users to track and access information about their facilityrsquos water consumption inad-dition to data about energy consumption Water and energy use and cost data can be managed across multiple facilities in a secure online interface The tool allows you to track multiple water meters for each facility identify meters with customized names and key information benchmark your facili-ties relative to past performance monitor costs and share data with others inside or outside of your organization By tracking energy and water metrics across facilities users can identify opportunities for efficiency improvements and can receive EPA recognition for superior performance
71
Appendix A Water Efficiency Resources and Technical Assistance Providers
Facility Managerrsquos Guide to Water Management Arizona Municipal Water Users Association httpamwuaorgpdfsfacility_managers_guidepdf This guide is intended to help commercial industrial and institutional facilities to identify areas to improve water use efficiency within reasonable economic parameters The guide provides a step-by-step resource for creating a water management plan and includes worksheets on topics such as water consumption history and estimated water balances Several water end uses and options for reducing them are discussed including domestic water use cooling and heating systems landscape water uses and kitchen uses The guide provides planning and policy-setting options water man-agement options and guidance for empowering employees to effect changes to reduce water use
Federal Water Efficiency Best Management Practices US Department of Energy www1eereenergygovfempprogramwaterefficiency_bmphtml The Federal Energy Management Program developed Federal Water Efficiency Best Management Practices in response to an Executive Order requiring federal agencies to find cost-effective ways to reduce their water use in coordination with EPArsquos WaterSense Program Toward the goal of reduc-ing industrial landscaping and agricultural volumetric water consumption by 20 percent by 2020 (relative to a 2010 baseline) FEMP provides best practices for water management planning infor-mation and education programs water auditing and leak detection and reducing water in several end uses including
bull Boilers and steam systems bull Cooling towers bull Water-efficient irrigation bull Single-pass cooling equipment bull Toilets urinals faucets and showerheads
GEMI Local Water Tooltrade GEMI wwwgemiorgGEMIInteractiveToolsaspx By spring 2012 GEMI plans to release a new tool the GEMI Local Water Tooltrade which will be an interactive downloadable module that will help companies evaluate specific sites for water impacts and risks in order to devise site-specific sustainable water management strategies This tool is de-signed to complement the Global Water Tool (described below) which can help a company identify and prioritize risks to its competitive position based on the link between its operations and the external water landscape Companies can then employ the Local Water Tool to further evaluate the high water-risk locations and plan actions to manage those risks
Global Water Tool World Business Council for Sustainable Development wwwwbcsdorgpagesedocumentedocumentdetailsaspxid=221ampnosearchcontextkey=true In order for a facility to manage current and future risks related to its water use the Global Water Tool helps users map their water use and assess risks related to their global operations comparing water needs to local conditions The tool helps calculate water consumption and efficiency compar-ing water consumption data through time to help assess improvements and monitor progress
72
Appendix A Water Efficiency Resources and Technical Assistance Providers
Making Every Drop Work Increasing Water Efficiency in Californiarsquos Commercial In-dustrial and Institutional (CII) Sector National Resource Defense Council wwwnrdcorgwatercacii This guide provides practical suggestions for commercial industrial and institutional facilities to increase their water efficiency Both small-scale concrete steps to take and suggested higher-level strategic approaches toward water efficiency are described The guide includes a list and descrip-tions of available technologies for reducing water consumption by a variety of common end uses
Performing a Business or Industry Water Use and Conservation Audit New Hampshire Department of Environmental Services wwwdesstatenhusorganizationcommissionerpipfactsheetsdwgbdocumentsdwgb-26-16pdf This factsheet provides a short set of steps to audit water use in a business or industrial facility analyze feasibility of conservation measures and develop a conservation plan
Solutions for Sustainable Water Savings ndash A Guide to Water Efficiency General Electric Water amp Process Technologies wwwgewatercomwater_efficiencyindexjsp This guide provides a practical framework for site managers corporate officers engineering firms and water saving advocates to develop a water efficiency objective and meet this objective by ap-plying a variety of tools and metrics The manual covers baseline water footprinting identifying efficiency opportunities optimizing implementing and measuring
Waste Not Want Not The Potential for Urban Water Conservation in California Pacific Institute wwwpacinstorgreportsurban_usage This report presents a comprehensive assessment of water use and conservation potential in the state of California including industrial water use as well as commercial institutional and resi-dential It includes benchmarking data on water use for many industry sectors a description of the methodology for estimating cost and water savings from water conservation strategies and informa-tion on cost-effectiveness of various water conservation and efficiency improvements
A Water Conservation Guide for Commercial Industrial and Institutional Users New Mexico Office of the State Engineer wwwosestatenmuswater-infoconservationpdf-manualscii-users-guidepdf This guide presents the business case for water efficiency offers programmatic steps conservation strategies for indoor and outdoor use and process-specific and mechanical systems and illustrates potential opportunities with fifteen individual case studies
Water Efficiency Manual for Commercial Industrial and Institutional Facilities North Carolina Department of Environment and Natural Resources httpsavewaterncorgbushomephp This comprehensive manual provides sound principles of water conservation strategies for conduct-ing a successful water efficiency program auditing tools water management options and examples
73
Appendix A Water Efficiency Resources and Technical Assistance Providers
for three industry-specific processes textiles food and beverage and metal finishing Practical tools in the guide include assessment checklists step-by-step instructions for conducting a successful wa-ter efficiency program and explanations of approaches such as water balancing The manual details water management options for several common end uses including
bull Sanitary and Domestic Uses bull Cooling and Heating bull Boilers bull Kitchen and Food Preparation bull Commercial Laundries bull Cleaning Rinsing and In-process Reuse bull Reuse and Reclamation bull Landscaping
Water Efficient Equipment and Design A Guide for Non-Residential Construction and Development Austin Water Utility Water Conservation Division wwwallianceforwaterefficiencyorgWorkArealinkitaspxLinkIdentifier=idampItemID=1018 Equipment and design practices for the construction of new industrial and commercial facilities help to build lifecycle water savings into the design of these buildings Major renovations to exist-ing facilities as well as new construction should be undertaken with a careful assessment of ways to reduce the facilityrsquos lifetime water use This guide provides general guiding principles to ensure that facilities are constructed to maximize water conservation and efficiency as well as specific steps and guidelines to follow in all steps of design and construction
Water Footprint Manual Water Footprint Network wwwwaterfootprintorgpage=fileshome This guide provides a thorough description of the practice of water footprinting including practical steps for estimating a water footprint and instructions for assessing the difference between a direct and indirect water footprint This comprehensive guide to water footprinting instructs readers on estimating the footprint of a product as well as that of a business
WaterSense at Work Best Management Practices for Commercial and Institutional Fa-cilities US Environmental Protection Agency wwwepagovWaterSense The WaterSense Best Management Practices which EPArsquos Office of Water developed in coordination with the Federal Energy Management Program are a comprehensive set of recommendations and tips for how commercial and institutional facilities can improve their water efficiency EPArsquos Water-Sense Program helps water consumers identify best practices resources and tools to reduce their water use Commercial and institutional water users can take advantage of lists of water-efficient products to install in their facilities best management practices and other ways to improve water efficiency
74
Appendix A Water Efficiency Resources and Technical Assistance Providers
WaterSmart Guidebook East Bay Municipal Utility District Oakland California wwwebmudcomfor-customersconservation-rebates-and-servicescommercial watersmart-guidebook This extensive guidebook provides information on water-saving technologies currently available to commercial industrial and institutional businesses as well as specific water efficiency strategies and tips for different business types such as paper manufacturing and metal finishing Many water-using technologies such as process water are explored to show the areas in which the most water is used and where it can be saved
Technical Assistance Providers
Water Utility Incentive Programs Many utilities and local governments offer incentive programs to water utility customers to encour-age the efficiency of water use in the industrial commercial and institutional sectors Common approaches include a combination of water audits and rebates to help facilities realize water sav-ings Check with your local utility to see what incentives may be available Some notable programs include those sponsored by the following utilities and localities all of which saw significant reduc-tions of water use by facilities that they serve
bull City of Austin and Austin Water Utility wwwciaustintxuswaterconservation
bull Denver Water wwwdenverwaterorgConservationIncentivePrograms
bull East Bay Municipal Utilities District wwwebmudcomfor-customersfor-commercial-customerscommercial-conservation-rebates-and-services
bull Massachusetts Water Resources Authority wwwmwrastatemauscomsupportwaterconservationmainhtm
bull Metropolitan Water District of Southern California httpwwwbewaterwisecomicphtml
bull City of Phoenix phoenixgovwaterserviceswrcindexhtml
bull City of San Jose Environmental Services Department wwwsanjosecagovesdwater-conservationdefaultasp
bull Seattle Public Utilities wwwseattlegovutilServicesWaterFor_Commercial_CustomersWATER-CONS_200311261707523asp
75
Appendix A Water Efficiency Resources and Technical Assistance Providers
National Institute of Standards and Technology Hollings Manufacturing Extension Partnership wwwnistgovmep The National Institute of Standards and Technology (NIST) Hollings Manufacturing Extension Part-nership (MEP) is a network of manufacturing assistance centers that provide Lean manufacturing training Lean event facilitation and other services to small-to-medium sized businesses to make them more competitive Many MEP centers have experience providing integrated Lean and environ-mental services to businesses or have partnerships with environmental agencies to offer Lean and environment services
Pollution Prevention Resource Exchange (P2Rx) Consortium wwwp2rxorg The Pollution Prevention Resource Exchange (P2Rxtrade) is a consortium of regional pollution prevention information centers in the United States funded in part through grants from EPA These centers all provide pollution prevention information networking opportunities and technical assis-tance services to state agencies local governments businesses and technical assistance providers in their region Regional centers and contact information can be found on the P2Rxtrade website along with their collective information resources on Lean water efficiency and other topics
Appendix B Water Cost Calculator You can use this table to calculate costs associated with water use at your facility Write down the appropriate volumes units and unit costs and multiply volume by unit cost to find the dol-lars spent on each cost area Add these costs to find the total cost Note Unit costs for water may varydepending on the season andor based on water use (eg peak surcharges may apply above a certain level)30
Factor
Costs to Consider (Excluding Labor amp Maintenance
Costs)
Examples Description Vo
lum
e
Uni
ts(g
allo
ns)
Uni
t Cos
t ($
per
gal
lon)
Tota
l Cos
t (d
olla
rs)
Sup
ply
Base Purchase Price
Utility (eg 10 cents per gallon)
$ $
Peak Package Demand
(eg additional 1 cent per gallon for water supply over 10000 gallons)
$ $
Pumping costs (if self supplied)
Well-sourced $ $
Purchase of pre-treated water
Deionized dealkylized ultra-pure softened
$ $
Coo
ling
Energy Power to chillers towers etc re-ducing heat load of wastewater prior to release
$ $
Chemical For towers chill-ers coolants
$ $
30 Several resource tracking tools that may also be relevant These include Energy amp Materials Flow amp Cost Tracker from the North-east Waste Management Officialsrsquo Association wwwnewmoaorgpreventionemfact Water Conservation Tracking Tool (for water utilities) from Alliance for Water Efficiency wwwallianceforwaterefficiencyorgTracking-Toolaspx and Portfolio Manager (for energy and water use) from the ENERGY STAR Program wwwenergystargov
Total cost of water use should also include labor associated with operations maintenance accounting and legal associated with all items listed
76
Appendix B Water Cost Calculator
Factor
Costs to Consider (Excluding Labor amp Maintenance
Costs)
Examples Description Vo
lum
e
Uni
ts(g
allo
ns)
Uni
t Cos
t ($
per
gal
lon)
Tota
l Cos
t (d
olla
rs)
Trea
tmen
t(O
nsit
e)
Treatment chemicals
Softening de-alkalyzed
$ $
Filters mem-branes carbon
Purified deionized $ $
Sludge disposal Filtration $ $
Filter disposal Solid waste $ $
Was
tew
ater
Trea
tmen
t
Pretreatment chemicals
Neutralizers flocculants etc
$ $
Pretreatment energy
Evaporation Treatment plant operation
$ $
Sampling and testing kits (consumables)
pH TSS BOD COD
$ $
Was
tew
ater
Dis
posa
l
Sewer rate Utility $ $
Surcharges for pollutant exceeding
$
Permitting Permit renewals $
Septic system maintenance
$ $
Condensate or wastewater disposal if not sewered
$ $
Sludge disposal $ $
Total cost of water use should also include labor associated with operations maintenance accounting and legal associated with all items listed
77
Appendix B Water Cost Calculator
Factor
Costs to Consider (Excluding Labor amp Maintenance
Costs)
Examples Description Vo
lum
e
Uni
ts(g
allo
ns)
Uni
t Cos
t ($
per
gal
lon)
Tota
l Cos
t (d
olla
rs)
sses
Evaporative Cost of make-up water
$ $
Leaks Cost of make-up water
$ $
Treatment or Irrigation or $ $
Lo stormwater vehiclebuilding management washing runoff of runoff from exterior use of supplied water
Production $ $
Oth
er
process water use costs other facility costs
TOTAL $ $
Total cost of water use should also include labor associated with operations maintenance accounting and legal associated with all items listed
See Appendix C ldquoWater Unit Conversions and Calculationsrdquo for guidelines on calculating leak losses
78
Appendix C Water Unit Conversions and Calculations This appendix provides reference material on water unit conversions as well as guidance for esti-mating water use and potential water and cost savings
Water Unit Conversions31
Volume Unit Conversions
Units
Equivalent
Liters (lL)
Gallons (gal)
Cubic Feet (ft3)
Cubic Meters (m3)
Acre-Feet (ac-ft)
Liters 1 02642 3531 x 10-2 00001 8106 x 10-7
Gallons 3785 1 01337 3785 x 10-3 3068 x 10-6
Cubic Feet 2832 7481 1 2832 x 10-3 2296 x 10-5
Cubic Meters 1000 2642 3531 1 8106 x 10-4
Acre-Feet 1233 x 106 3259 x 105 4356 x 104 1233 1
Flow RateDischarge Unit Conversions
Units
Equivalent
Gallons per Minute
(gpm)
Liters per Second (Ls)
Acre-Feet per Day
(ac-ftday)
Cubic Feet per Second
(ft3s)
Cubic Meters per Day
(m3day)
Gallons per Minute
1 6309 x 10-2 4419 x 10-3 2228 x 10-3 545
Liters per Second
1585 1 7005 x 10-2
3351 x 10-2 864
Acre-Feet per Day
2263 1428 1 05042 1234
Cubic Feet per Second
4488 2832 1983 1 2447
Cubic Meters per Day
1369 x 109 864 x 107 6051 x 106 3051 x 106 1
31 GEMI ldquoUnit Conversionsrdquo Collecting the Drops A Water Sustainability PlannerTM available at wwwgemiorgwaterplannerunit-conversionhtm
79
80
Appendix C Water Unit Conversions and Calculations
Calculations and ldquoRules of Thumbrdquo for Estimating Water Use32
Use these guidelines and calculations to estimate water use in your facility The information in this section draws primarily from GEMIrsquos Collecting the Drops A Water Sustainability Plannertrade available at wwwgemiorgwaterplanner
Cooling Tower Usage
Cooling Tower Water Usage Calculations
Tower Evaporation Rate
C x ∆T1000
C = tower recirculation rate in the units of pounds of water
per minute
T = temperature difference across the cooling tower in
degrees Fahrenheit
Cooling Tower Blow Down Rate
[Windage Rate x (Cycles of Concentration -1) -
Tower Evaporation Rate] (1- Cycles of Concentration)
Cycles of Concentration = conductivity or chloride level
in the cooling tower blow-downconductivity or chloride
level in the cooling tower makeup water
bull Windage Loss from Cooling Towers (Water Lost from Friction Between Wind and the Surface of the Water in Cooling Towers)
bull Commonly 01 to 03 of the Recirculation Rate
bull The tower recirculation rate can be obtained from the manufacturerrsquos literature andor head versus flow curve for the pump
Cooling Tower Usage
Boiler Water Usage Calculations
Boiler Make Up Boiler Steam Rate - Condensate Return + Boiler Blow Down
Boiler Blow Down Range of 4 to 8 of Boiler Makeup
Sanitary Water Usage
bull 10ndash25 gallons per person per shift in industrial settings (based on estimates in GEMIrsquos Collecting the Drops A Water Sustainability Plannertrade 2007)
bull The lower value is used where there are just toilets A higher value is used where there are toilets showers and full kitchen services (that is food preparation and dish washing)
32 ldquoCalculationsrdquo and ldquoRules of Thumbrdquo from GEMI Collecting the Drops A Water Sustainability PlannerTM available at wwwgemi orgwaterplannercalculationshtm and wwwgemiorgwaterplannerrules-of-thumbhtm
81
Appendix C Water Unit Conversions and Calculations
bull 20-35 gallons per employee per day for domestic demands (not including kitchens) in commercialindustrial settings (based on estimates in the North Carolina Water Effi-ciency Manual 200933)
bull Savings of 25-35 percent in this domestic usage are readily achievable
Irrigation Usage
bull Number of sprinkler heads x the flow capacity per head (eg 25 gpm x the duration [minutes] of water application)
bull Inspect the irrigation system during operation to determine if there are leaks from broken sprinkler heads and from water distribution lines
Wastewater Streams from Water Treatment Operations
bull Reverse Osmosis Reject Flow
bull Reject stream generally ranges from 10 to 50 of the feed to the system depending on the salinity and the desired purity
bull Reject flow can be higher than the indicated range Reverse osmosis reject streams can be used as cooling tower makeup if the water is softened prior to the reverse osmosis system
Other Uses
bull Slab Washing
bull 5 galmin for each hose
bull 1 dripsecond
bull 10000 Lyear or 2642 galyear
bull Water Flow Estimation
bull Use a bucket and stop watch
Water Losses from Leaks
bull Estimate leaks based on the size of the hole and the water pressure (see Leak Water Loss Guide below) or measure directly using a bucket and stop watch
33 North Carolina Department of Environment and Natural Resources Water Efficiency Manual for Commercial Industrial and Institutional Facilities 2009 available at httpsavewaterncorgbushomephp
82
Appendix C Water Unit Conversions and Calculations
Leak Water Loss Guide (Water Loss in Gallons at 50 PSI)
Leak this Size Loss per Day Loss per Month Loss per Year
bullbull 120 3600 43200
360 10800 129600
693 20790 249480
1200 36000 432000bullbullbull bull 1920 57600 691200
3096 92880 1114560
4296 128880 1546560
6640 199200 2390400bullbullbull 6984 209520 2514240
Source Washington State Department of Health Office of Drinking Water available at wwwdohwagovehpdwwater_usewater_use_efficiencyhtm
Guidelines for Estimating Cost and Water Savings
It can be useful to estimate the potential long-term water and cost savings that will result from implementing water efficiency improvements in your facility This section provides guidelines on producing estimates of these savings after implementing improvements to a process at your facility
83
Appendix C Water Unit Conversions and Calculations
Current Water Use
First to estimate the current water use of an entire process at your facility identify the following information and use Equation 1 below
bull Average volume of water used during a full process or technology cycle
bull This may be provided by the product manufacturer through product literature or the manufacturerrsquos website or by using the guidelines and calculations in the previous section of this Appendix The water efficiency will be dependent upon the flow rate of each process cycle duration of each cycle and the number of cycles If the water use from the full process is not available from the manufacturer sum the water use from each part of cycle to determine the water use from the full process cycle
bull Average number of cycles per day
bull Days of facility operation per year
Water Use after Replacement or Retrofit
To estimate the water use of a more efficient technology or process change use Equation 1 but substitute the average volume of water used during an improved process cycle
Water Savings
To calculate water savings that can be achieved from a technology or process change identify the following information and use Equation 2 below
bull Current water use as calculated using Equation 1
bull Water use after replacement or retrofit as calculated using Equation 1
Equation 1
Water Use of a Technology or Process Cycle (gallonsyear) = Cycle Water Use (gallons) Number of Cycles (per day) Days of Facility Operation (daysyear)
Equation 2
Water Savings (gallonsyear) = Current Water use (gallonsyear) ndash Water Use After Improvements (gallonsyear)
84
Appendix C Water Unit Conversions and Calculations
Payback
To calculate the simple payback from a technology or process change identify the following infor-mation and use Equation 3 below
bull Equipment and installation cost of the replacement or retrofit
bull Water savings as calculated using Equation 2
bull Facility-specific cost of water and wastewater
Return on Investment
To calculate the return on investment of a technology or process change calculate the amount of cost savings as compared to the initial investment using Equation 4
General Calculations and On-Line Calculators
GEMIrsquos Collecting the Drops A Water Sustainability Plannertrade has several on-line and download-able calculators for measuring data related to water use and flows (see wwwgemiorgwaterplanner calculatorsasp) These include
bull Flow rate calculator
bull Friction loss and flow calculator
bull Pump hydraulic horsepower calculator
bull Water balance template and calculator
Equation 3
Payback (years) = Equipment and Installation Cost (dollars) [Water Savings (gallonsyear) Cost of Water and Wastewater (dollarsgallon)]
Equation 4
Return on Investment = [(Water Savings (gallonsyear) Cost of Water and Wastewater (dollarsgallon)] ndash Equipment and Installation Cost (dollars)
Appendix DWater Efficiency Opportunity Checklist
Water Efficiency Opportunity Checklist
FacilityBuilding Date Prepared
Prepared by Reviewed by
Water Efficiency Practice Yes No
1 Organizational Water Efficiency Practices
a Have you set water use reduction goals and targets for your facility
b Are water meters installed on high water using processes and are they working properly
c Do you have easy ways for employees to suggest ideas for water efficiency improvements (eg suggestion boxes)
2 Cooling and Heating
a Has once-through cooling water been eliminated with the use of chillers cooling towers or air-cooled equipment
b Has blow-downbleed-off control on cooling towers and boil-ers been optimized
c Is condensate being reused
d Is treated wastewater (or other sources of water for cooling tower make-up) reused where possible
e Are cycles of concentration for cooling towers maximized through efficient water treatment
f Is a conductivity controller installed on each cooling tower
g Have cooling towers been equipped with overflow alarms
h Are high-efficiency drift eliminators in use
3 Restrooms and Kitchens
a Are water-efficient fixtures installed (eg WaterSense labeled faucets toilets urinals and showerheads) Are there signs on dual-flush toilets showing people how to use them
b Have you installed metered or spring-loaded faucets or fau-cets with sensors
85
Appendix D Water Efficiency Opportunity Checklist
Water Efficiency Practice Yes No
c Have you adjusted plumbing to use the minimum amount of water that is functional
4 Process Use
a Have you installed timers to automatically shut off water flow when water is not required such as at the end of a produc-tion cycle
b Are solenoids and automatic shut-off valves checked regu-larly to ensure that they are working properly
c Is equipment set to the minimum flow rates recommended by the manufacturer
d Have pressure-reducing devices been installed on equipment that does not require high pressure
e Can process equipment reuse water (closed loop) or use reclaimed water from other parts of the facility
f Have you replaced water-based transportation with either waterless techniques or recycled water
g Are signs posted near equipment encouraging employee awareness of water use and discouraging tampering with equipment flow rate
5 Cleaning and Sanitation
a Are all hoses equipped with an automatic shut-off nozzle
b Has process cleaning or facility cleaning been replaced with waterless techniques (ie using pressurized air to clean products or containers sweeping debris off the floor) where possible
c Are improved rinsing techniques used (counter-current systems sequential use from high to lower quality needs conductivity flow controls improved spray nozzlespressure rinsing fog rinsing etc)
d Is spent rinse-water being reclaimed and reused for lower-grade processes or for other facility applications
e Have steps been taken to reduce the water used by steam sterilizers such as jacket and chamber condensate cooling modification
86
Appendix D Water Efficiency Opportunity Checklist
Water Efficiency Practice Yes No
f Are you using detergents that can easily be removed with little water
6 Landscaping and Irrigation
a Are low-flow sprinklers trickledrip irrigation and optimized watering schedules in use
b Are preventive maintenance techniques in place
c Has your facility designed its landscape to consider the local climate and grouped plants by similar watering needs
d Is grass planted only in places where it will provide optimal functional and aesthetic benefits
e Are systems in place to capture and reuse rain water and storm water for landscaping or for other uses (eg cooling tower make-up process water or dust suppression)
7 Leaks
a Are you conducting regular leak inspections
b Are leaky faucets faulty fittings and broken pipes and hoses identified and repaired promptly
c Are employees (including custodial crews) educated and em-powered to identify leaks and point them out for repair
d Is there a user-friendly method to report leaks
8 Comments
9 Recommended Follow-Up Actions34
34 For additional guidance see EPA Office of Water ldquoWaterSense at Work Best Management Practices for Commercial and Institu-tional Facilitiesrdquo wwwepagovwatersense North Carolina Department of Environment and Natural Resources Water Efficiency Manual for Commercial Industrial and Institutional Facilities wwwp2paysorgref0100692pdf East Bay Municipal Utility District of Oakland WaterSmart Guidebook wwwebmudcomfor-customersconservation-rebates-and-servicescommercial watersmart-guidebook and Arizona Municipal Water Users Association Facility Managerrsquos Guide to Water Management http amwuaorgpdfsfacility_managers_guidepdf
87
Appendix E Glossary of Water Terms Most of the definitions provided here are from the Alliance for Water Efficiencyrsquos water glossary available at wwwallianceforwaterefficiencyorgGlossaryaspx That glossary has a more extensive set of water-related terms and abbreviations
B
Best management practice (BMP)
Equipment or behavioral measure(s) established as the most practicable means of increasing water efficiency
Blowdown (or Bleed-off)
Draining off the water in a cooling tower reservoir or boiler to avoid the buildup of excess dissolved solids
E
End use A fixture appliance or other specific object or activity that uses water
M
Makeup water Fresh water introduced into a cooling tower or boiler to replace water lost to evaporation and blowdown
P
Peak use (demand)
The maximum demand occurring in a given period such as hourly or daily or annually Peak use can incur sur-charges above the normal base water cost charged by the utility
R
Reclaimed water Municipal wastewater effluent that is given additional treatment and distributed for reuse in certain applica-tions Also referred to as recycled water
Reverse osmosis A process to remove dissolved solids usually salts from water Salty water is forced through membranes at high pressure producing fresh water and a highly concentrat-ed brine
S
Source meter A meter that measures the quantity of water being sup-plied to a facility
88
89
Appendix E Glossary of Water Terms
Submeter A meter that measures usage for specific activities within a facility such as cooling towers process use or land-scape water use
W
Water audit An on-site survey of facility water use to measure equip-ment and management efficiency and generate recom-mendations to improve efficiency
Water balance A chart table or diagram that tracks water flow through a building or facility showing total inflows and total outflows (eg consumption irrigation evaporation leaks and losses)
Water conservation
1 Any beneficial reduction in the water loss waste or use
2 A reduction in water use accomplished by implemen-tation of water conservation or water-efficiency mea-sures
3 Improved water management practices that reduce or enhance the beneficial use of water
Water efficiency A measure of the amount of water used versus the mini-mum amount required to perform a task In irrigation the amount of water beneficially applied divided by the total water applied
Water footprint An analysis of the total volume of freshwater that is used directly and indirectly to run and support the business or to produce a product encompassing water use within an industrial facility throughout its supply chain and final disposition of the product
Lean and Water Toolkit
United States Environmental Protection Agencywwwepagovlean
October 2011EPA-100-K-11-003

Lean and Water Toolkit
AcknowledgmentsThe US Environmental Protection Agency (EPA) is grateful for the valuable assistance of the orga-nizations and individuals who helped develop this toolkit and who shared experiences tools and techniques for integrating Lean manufacturing and water efficiency EPArsquos Office of Policy sponsored and led the development of this toolkit while EPArsquos Office of Water provided considerable input
This toolkit has benefited from the collective expertise and ideas of many individuals In particular EPA would like to thank the following individuals for their thoughtful contributions
Michael Abouezzi Senior Director Lean Six Sigma and Total Productive Maintenance PepsiCo
Barruch Ben-Zekry Manager of Environmental Sustainability for Operations Levi Strauss amp Co
Scott Butler Vice President of Operations and Technical Services Del Monte Foods
Lynn Coleman Environmental Engineer Hazardous Waste and Toxics Reduction ProgramWashington State Department of Ecology
Rob Currie Director Environment Health and Safety Baxter International
Michelle Gaither Technical Research Lead Pacific Northwest Pollution Prevention Resource Center
Amy Goldman Director Global Environmental Management Initiative
Reza Hosseini Manager of Environmental Site and Compliance Assessment Levi Strauss amp Co
Bruce Karas Director Sustainability Environmental and Safety Coca-Cola North America
Deborah Kennedy Senior Principal Engineer Resource Conservation PepsiCo
Robert ter Kuile Senior Director Environmental Sustainability Global Public Policy PepsiCo
Jessica McGlyn Director World Business Council for Sustainable Development US Inc
Rob Meyers Director Environmental Sustainability Global Operations PepsiCo
John Radtke Water Resource Manager Coca-Cola North America
Jason Schulist Director of Program Office DTE Energy
Mike Sklar Continuous Improvement Manager DTE Energy
Charles Souders Manager Environmental Compliance Johnson amp JohnsonMcNeil Consumer Healthcare
David Walker Senior Director Environmental Sustainability PepsiCo
This toolkit was prepared for EPA by Ross amp Associates Environmental Consulting Ltd (wwwross-assoccom) in association with Industrial Economics Inc (EPA Contract EP-W-10-002)
Lean and Water Toolkit
Lean and Water Toolkit
Table of ContentsExecutive Summaryi
Preface iv
Chapter 1 Introduction 1
Importance of Water to Industry 1
Benefits of Addressing Water with Lean 2
Getting Started with Lean and Water 6
Chapter 2 Water Use and Water Waste at Industrial Facilities11
Definition of Water Waste 11
Industrial Water Use12
Water End Uses How Water Is Used at Facilities15
Measuring Facility Water Use Metering and Submetering17
Costs of Water Waste 20
Chapter 3 Finding Water Waste on the Factory Floor 25
Water Gemba Walks 25
Developing a Water Balance 28
Water Waste and Value Stream Mapping33
Root Cause Analysis 38
Chapter 4 Lean and Water Efficiency Improvement Strategies 41
Kaizen Events and Just-Do-Its to Reduce Water Use41
Integrate Water Efficiency into Everyday Lean Practices 45
Lean and Water Applications for Facility Operations and Support Processes50
Chapter 5 Lean and Water Beyond the Factory Floor 53
Lean and Water Efforts in Your Supply Chain 53
Engaging with the Community 58
Lean Product Design61
Chapter 6 Conclusion 67
Your Lean and Water Journey67
Concluding Thoughts 68
Appendices 69Appendix A Water Efficiency Resources and Technical Assistance Providers 69
Appendix B Water Cost Calculator76
Appendix C Water Unit Conversions and Calculations 79
Appendix D Water Efficiency Opportunity Checklist85
Appendix E Glossary of Water Terms88
Lean and Water Toolkit
Boxes Key Benefits of Addressing Water with Lean (Box 1) 2
Example Results From Lean and Water Efforts (Box 2) 3
Learning to See Water Waste and Costs (Box 3) 4
Types of Water-Related Business Risks (Box 4)5
Water Metrics (Box 5) 7
Water-Intensive Industries (Box 6)12
Common Costs Associated with Water Use (Box 7) 21
Steps to Take During a Gemba Walk (Box 8)26
Examples of Water Gemba Walk Success (Box 9)28
Information to Collect for a Water Balance (Box 10)32
Water Footprinting Tips (Box 11)33
Asking Why Five Times (Box 12)39
Key Water-Efficiency Questions (Box 13)41
Water Kaizen Event Examples (Box 14)42
Waterless Cleaning of Gatoradereg Bottles (Box 15) 44
Frito-Lay Engaging Employees in Water Efficiency (Box 16)46
Water-Efficient Cleaning Strategies (Box 17)49
Proactive Maintenance Tips to Reduce Water Use (Box 18)50
Questions to Identify Water-Savings Opportunitiesin Facility Operations and Support Processes (Box 19) 51
Dubois Chemical and Steelcase An Innovative Lean Water Supplier Partnership (Box 20) 54
Green Suppliers Network Lean and Water Successes (Box 21) 55
Levi Strauss amp Co and the Better Cotton Initiative (Box 22) 58
PepsiCorsquos Positive Water Balance Project in India (Box 23) 59
Examples of Water Conservation through Product Design (Box 24)64
Figures Figure 1 Impact-Difficulty Matrix 8
Figure 2 Lean and Water Implementation Strategies 10
Figure 3 Water Scarcity Map of the World13
Figure 4 Breakdown of Water Uses in Two Industries 16
Figure 5 Example Water End Uses at an Industrial Facility 17
Figure 6 Portable Water Meter18
Figure 7 Costs Associated with Water Use20
Figure 8 Typical Water Balance Calculation 29
Figure 9 Simplified Elements of a Water Balance30
Figure 10 Adding Water Use to Value Stream Map Process Box 34
Figure 11 Value Stream Map Incorporating Water Use Metrics35
Figure 12 Process Boxes Showing Water Waste36
Lean and Water Toolkit
Figure 13 Water Inputs and Outputs Identified on a Value Stream Map 37
Figure 14 Fishbone Diagram of Excessive Water Use 39
Figure 15 Five Water-Savings Strategies43
Figure 16 Sign to Encourage Water Conservation 45
Figure 17 Dual Flush Toilet Visual Control 47
Figure 18 Six Pillars of 6S (5S + Safety)48
Tables Table 1 Typical Water Use Per Ton of Product 14
Table 2 High-Impact Water Use Sectors 14
Table 3 Costs Associated with Water Used in an Industrial Process 22
Table 4 Key Areas to Check During a Water Gemba Walk 27
Table 5 Example Water Balance Summary 31
Table 6 Table for Evaluating Water Reuse Potential44
Table 7 Methods Used in Lean Design62
Table 8 Questions to Ask During Lean Product Design 63
Lean and Water Toolkit
Lean and Water Toolkit
Acronyms and Abbreviations 3P Production Preparation Process or Pre-Production Planning
5S Sort Set in order Shine Standardize Sustain
BMP Best management practice
CO Changeover time
CT Cycle time
E3 Economy Energy and Environment
EHS Environmental Health and Safety
EPA Environmental Protection Agency
GEMI Global Environmental Management Institute
gpf Gallons per flush
gpm Gallons per minute
LEED Leadership in Energy and Environmental Design
MEP Manufacturing Extension Partnership
NIST National Institute of Standards and Technology
psi Pounds per square inch
TPM Total Productive Maintenance
Lean and Water Toolkit
i
Executive Summary
Executive SummaryThis Lean and Water Toolkit describes practical strategies for using Lean manufacturingmdashthe production system developed by Toyotamdashto reduce water use while improving operational per-formance Drawing from the experiences and best practices of multiple industry and government partners this toolkit explores opportunities to identify and eliminate ldquowater wasterdquo including
bull Water losses and leaks
bull Non-value added or inefficient use of water
bull Missed opportunities to reuse water
bull Wastewater discharges
bull Unnecessary water use and risks throughout the supply chain
bull Missed opportunities to address customersrsquo water-efficiency goals
This toolkit is a supplement to EPArsquos Lean and Environment Toolkit (wwwepagovleantoolkit) which addresses all types of environmental wastes and improvement opportunities
Why Address Water Using Lean Companies recognize water use and availability as a critical business concern While direct water costs may be low many indirect costs associated with water use can make the full cost of water substantial Community concerns about water and the risk of water supply disruptions can increase pressures on companies to reduce water use Incorporating water use reduction into Lean initiatives provides an efficient and effective means to
1 Uncover cost savings and operational improvements
2 Reduce water-related business risks
3 Deliver value for customers and employees
Facilities already using Lean can often easily incorporate water considerations into value stream maps and other Lean efforts At the same time facilities conducting water efficiency initiatives may find that Lean tools provide a powerful means to drive effective implementation and results Con-necting Lean and water efforts can engage employees in powerful and rewarding ways that build capacity and momentum to solve problems and create value
Understand Water Uses and Costs The toolkit discusses common water end uses in industrial and manufacturing facilities and discuss-es costs associated with water use Costs of water include not only the cost of purchasing water but also costs associated with treatment heating conveyance and regulatory compliance Metering and sub-metering are important tools for understanding actual water use within a facility and tracking it over time
ii
Executive Summary
Find Water Waste The toolkit discusses several techniques to find water waste and opportunities at your facility in-cluding
bull Water Gemba Walks Have a team walk the factory floor together to observe and inventory inefficiencies related to water use
bull Water Balance Develop a diagram of your facilityrsquos water use that shows and quantifies the flows of water into and out of each process or operation in the facility
bull Value Stream Mapping Add information on water use andor costs to Lean value stream maps to help identify water waste and develop implementation plans for Lean and water efficiency improvement efforts
bull Root Cause Analysis Use root cause analysis methods to explore the underlying causes of water waste and inform improvements
Improve Operations and Processes with Lean and Water Strategies Solutions to reduce water waste can be identified during Lean events and in daily implementation of Lean principles and tools The toolkit discusses facility operations and support functions in which there may be specific improvement opportunities Strategies include
bull Waste Elimination Culture Encourage employees to identify water waste throughout their daily activities and create a culture in which they are empowered to continually im-prove the way your facility uses water
bull Kaizen Events and Just-Do-Its Pursue opportunities to address water waste during Lean kaizen events Consider focusing kaizen events specifically on water waste or water-intensive processes Also find quick opportunities for individuals to immediately improve a process or operation in just-do-it projects
bull Standard Work Embed water use management and efficiency tasks into standard operat-ing procedures to engage all employees in proactive water-efficiency activities
bull Visual Controls Use signs and visual controls to reinforce water waste reduction practices and standard work Clearly display information on water use and costs to raise awareness
bull 5S Incorporate water management and waste reduction activities into 5S housekeeping activities such as cleaning and inspections to engage all employees in identifying and eliminating water waste
bull Total Productive Maintenance Enable teams of workers to quickly identify and correct problems fix leaks and improve water efficiency while optimizing the effectiveness of your manufacturing equipment
iii
Executive Summary
These Lean tools can be used at a facility in concert with water-efficient best management practices (BMPs) that are often available from industry associations and government agencies1 Industrial facilities can target their efforts to the most effective solutions using these technology and process-based improvements
Extend Lean and Water Efforts throughout the Value Chain Looking beyond facility operations can allow you to uncover new ways to reduce water use and risks while adding value and improving business operating conditions and market opportunities Strategies include
bull Supply Chain Initiatives Work with your suppliers to improve understanding of water use costs and risks Provide incentives and technical support to help suppliers identify and eliminate water waste Collaborate with supply chain partners to address water-related op-portunities through joint Lean events and other initiatives
bull Engage Local Communities Educate and engage your employees in water-efficiency efforts at your facility and encourage them to adopt similar practices at home Partner with community members and local organizations to conduct projects or Lean events that improve water use andor quality in the community
bull Product Design Incorporate water efficiency and reuse as design criteria into Lean prod-uct and process design methods as a powerful means of reducing the water use of products throughout their lifecycle
Starting Your Lean and Water Journey There are many ways to get started with identifying and reducing water waste and improving busi-ness results using Lean Consider using the strategies and techniques in this toolkit to help you
1 Learn more about how your facility uses water
2 Engage employees in Lean and water improvement efforts
3 Connect Lean and water efforts to sustainable water management strategies
We hope the strategies and tools in this toolkit will help you on your Lean and water journeymdashen-abling you to reduce water waste and costs improve processes and foster positive relations with your customers and community
1 Appendix A provides information on water efficiency resources and technical assistance providers that offer helpful information on BMPs Also consider contacting your local water utility or the industry or trade association in your sector to inquire about water-related BMPs and resources
iv
Preface
Preface
Purpose of This ToolkitThe Lean and Water Toolkit offers Lean implementers practical strategies and techniques for improving common Lean results related to time cost and quality while also reducing water use costs and risk Environmental Health and Safety professionals will also find useful infor-mation in this toolkit for how to leverage Lean and Six Sigma business improvement methods to eliminate water waste Finally the toolkit introduces Lean practitioners to the wide array of water efficiency resources available from EPA and other organizations
The ldquoLeanrdquo methods discussed in this toolkit are organizational improvement methods pioneered in the Toyota Production System Lean production and Lean manufacturing refer to a customer-focused business model and collection of methods that focus on the elimination of waste (non-value added activity) while delivering quality products on time and at a low cost Six Sigma is a business model that focuses on improving quality by eliminating variation it is often combined with Lean The toolkit assumes that you are familiar with Lean methods For those who want to learn more about Lean see EPArsquos Lean and Environment website (wwwepagovlean)
Key Questions Addressed by This Toolkit Lean works well when it focuses on identifying and eliminating waste This toolkit contains strate-gies and techniques that can enable Lean practitioners to easily identify water waste and improve-ment opportunities alongside the myriad other wastes and improvement opportunities uncovered by Lean To accomplish this the toolkit aims to answer the following questions
What is water waste Water is required in substantial quantities to produce goods from food products to silicon chips Water waste is water that is used beyond the point at which it ceases to add value to the customer Excess water use often leads to wastewater which can harm human health and the environment through the pollutants it collects and overdrawing water resources in certain regions can exacer-bate water scarcity concerns Water can be wasted in the supply chain through facility operations and in product use and disposal This toolkit will help you to recognize water waste so that you can work to reduce it
Why should you address water waste with Lean Substantial water savings can ride the coattails of Lean improvement By eliminating manufactur-ing wastes such as unnecessary processing and cleaning businesses also reduce the water and associated labor and energy costs needed for cleaning conveyance cooling and heating Chapter 1 describes benefits of combining Lean and water efficiency efforts and discusses how to get started Chapter 2 provides an overview of industrial water use including information on water uses water metering and water costs
v
Preface
How do you know how much and where water is used in your facility A key step in effective Lean and water efforts is determining where to target water efficiency im-provement activities Chapter 3 discusses techniques for measuring water use and identifying op-portunities to reduce water use in the context of Lean Methods include gemba walks water balance value stream mapping and root cause analysis
How can you reduce water use with Lean methods Chapter 4 examines specific opportunities for using Lean methods to improve water efficiency including kaizen events standard work visual controls 5S and total productive maintenance These strategies present ways that you can integrate water efficiency principles and practices into the practical implementation-based tools of Lean manufacturing and the waste-elimination culture fostered by Lean
How can you use Lean to pursue water efficiency opportunities beyond your facilityrsquos operations For many companies water costs and risks may be driven by factors and activities beyond the facility fence-line Similarly opportunities to capture market value and win customers may require considerations upstream to manufacturing activities Chapter 5 explores strategies to leverage Lean initiatives and methods to reduce water risks in your supply chain and to engage the local commu-nity in water saving initiatives Chapter 5 also discusses how Lean product design methods can be used to improve water efficiency and add value by addressing customer water needs
Lean and Water Toolkit
1
CHAPTER 1
Introduction
Water is a crucial resource for the world economy Lean provides a framework in which organiza-tions can address water waste while saving costs reducing risks and adding customer value This chapter includes the following sections
bull Importance of Water to Industry bull Benefits of Addressing Water with Lean bull Getting Started with Lean and Water
Importance of Water to Industry Companies worldwide identify water issues as a critical business concern Water is essential for a range of industrial processes and support functions facility operations and as an ingredient for many products Water use is increasing much faster ldquoI am convinced that under present than population growth and regional and seasonal conditions and with the way water is differences in water availability can lead to short- being managed we will run out of ages and even water-related conflicts The World water long before we run out of fuelrdquo Economic Forum reports that 44 percent (28 billion) of people currently live in areas of the Peter Brabeck-Letmathe Chairman
world that are water stressed and if present trends Nestle Corporation
continue water scarcity will affect the livelihood of Source ldquoA water warning Peter Brabeck-Letmathe chairman of Nestleacute argues that water shortage is an even more urgent problem than climate changerdquo The Economist November 19 2008one-third of the worldrsquos population by 20252 wwweconomistcomnode12494630
Corporations are recognizing the important role they play in addressing water resource chal-lenges and companies are responding by engaging in efforts to measure report and reduce their water use In a survey conducted by the Carbon Disclosure Project of 302 of the worldrsquos largest 500 companies 89 percent of responding companies had developed specific water policies strategies and plans and 67 percent indicated that responsibility for water-related issues lies at the Board or Executive Committee level3 The United Nationsrsquo CEO Water Mandate launched in 2007 is designed to help companies develop implement and report on water sustainability policies and practices Industry-led associations such as the World Business Council for Sustainable Development and the Global Environmental Management Initiative also have major water initiatives
One key reason why companies choose to use water more efficiently is to improve their relationship with the communities that surround industrial facilities Water use is of paramount importance to a facilityrsquos relationship with its surrounding community Facilities that use less water in drought-
2 World Economic Forum ldquoThe Bubble Is Close to Bursting A Forecast of the Main Economic and Geopolitical Water Issues Likely to Arise in the World during the Next Two Decadesrdquo Draft Report for Discussion at World Economic Forum
3 Carbon Disclosure Project ldquoCDP Water Disclosure 2010 Global Reportrdquo available at wwwcdprojectnetCDPResultsCDP-2010-Water-Disclosure-Global-Reportpdf
2
Chapter 1 Introduction
prone areas leave more water available for residential use Some companies even risk being forced to withdraw from regions where water is a scarce resource a problem that is likely to recur as water scarcity increases in many regions around the globe In some cases communities around industrial facilities show much greater concern for the amount of water a facility uses than the amount of energy it uses
This toolkit provides strategies and tools for addressing water issues within the context of Lean manufacturing and other business process improvement methods
Benefits of Addressing Water with Lean Lean provides powerful tools for delivering value to customers in a manner that minimizes waste and risks from unnecessary water use Explicit consideration of water waste during Lean imple-mentation can create significant value for an organization helping to deliver quality products and services that customers want when they want them Research sponsored by EPA and others shows that some water use and waste reduction benefits typically ride the coattails of Lean efforts yet other opportunities to reduce wastes risks and non-value added activity associated with water may be overlooked There are three key benefits of addressing water with Lean as listed in Box 1 and further described below
Key Benefits of Addressing Water with Lean (Box 1)
1 Uncover cost savings and operational improvements
2 Reduce water-related business risks
3 Deliver value for customers and employee
Uncover Cost Savings and Operational Improvements Learning to see and eliminate waste is a cornerstone of Lean initiatives Water waste is often a sign of inefficient production and non-value added activity and it frequently indicates opportuni-ties for saving costs and time Lean and water strategies can help you to uncover cost savings and improvements in areas of your facilityrsquos operations that may not have received as much attention in your Lean efforts For production processes that are highly dependent on water or that have water-intensive support processes such as wastewater treatment the operational and environmental benefits from Lean and water efforts are even more significant
Learning to see water and other environmental waste during Lean efforts can reveal significant business improvement opportunities further strengthen Lean results and improve environmental performance Box 2 provides several examples of how companies have used Lean and Six Sigma methods to reduce water use save costs and improve their performance
3
Chapter 1 Introduction
Example Results From Lean and Water Efforts (Box 2)
3 IBM used Six Sigma tools to reduce water consumption and operating costs in wafer fabrication processes saving $3 million annually reducing water usage by 27 percent and increasing production by over 30 percent
3 GE combined high-tech water metering and other water efficiency prac-tices with its kaizen improvement methodology resulting in a 30 percent drop in water use since 2006
3 DTE Energy saved 20 million cubic feet of water (79 percent) and $700000 annually in a Lean Six Sigma project examining electric substa-tion water use
Sources IBM ldquoGreen Sigma Overviewrdquo Presentation to EPA June 2009 GE info cited in Carbon Disclosure Project ldquoCDP Water Disclosure 2010 Global Reportrdquo page 25 available at wwwcdprojectnetCDPResultsCDP-2010-Water-Disclosure-Global-Reportpdf and Jason Schulist DTE Energy ldquoLean Towards Sustainability How to Use Lean and Six Sigma Methods to Drive Your Sustainability Journeyrdquo Presentation at Green Six Sigma Conference May 19 2009
While many places have very low direct costs for water and wastewater there are also indirect costs to water use These costs can be significant yet they are often hidden in overhead or support cost centers (see Box 3 for examples of how facilities have uncovered water waste and costs) Examples of water costs include
bull Raw Material Costs Costs of measures to ensure that purchased water supply is of suf-ficient quality for use at a facility For example some facilities may bear costs for labor equipment and materials needed to improve water quality before use (eg when water is a key product ingredient) as well as for chemicals and other raw materials needed to treat and manage water at the facility and before discharging it Water treatment costs associated with deionized water and reverse osmosis can be substantial
bull Energy Costs for the energy required to heat and cool water pump or transfer water operate water-consuming equipment treat water and wastewater and other functions
bull Pollution Control Wastewater service costs paid to a utility andor industrial pretreat-ment costs for the energy labor materials equipment and chemicals needed to treat wastewater before discharging it from the facility
bull Regulatory Compliance Costs for regulatory compliance activities such as completing permit applications and tracking and reporting wastewater discharges to regulatory agencies In the United States industrial municipal and other facilities must obtain National Pollutant Discharge Elimination System permits if the facilities discharge water pollutants directly into US waters Pretreatment regulations govern industrial facilities that discharge into municipal sewer systems Also in some food and consumer product industries water use may be important to address Food and Drug Administra-tion sanitation requirements
4
Chapter 1 Introduction
Lean and water strategies such as those outlined in this toolkit help to reveal these costs and identify process improvement solutions The next chapter provides more information about water end uses and costs
Learning to See Water Waste and Costs (Box 3)
3A wood products company began metering water into two parallel process units and discovered one was using significantly more water than the other After some investigation the company identified and implemented mainte-nance practices that would substantially lower water use while also prevent-ing equipment failure and downtime
3A food processing company regarded the water supply from its groundwater well as essentially free While completing a facility water balance it me-tered the amount of hot water used for one process step Once the com-pany realized it was heating 25 gallons per minute of ground water from 55 degrees to boiling it began to think of opportunities to reduce and reuse the energy in the hot water rather than sending it down the drain
3A small high tech silicon wafer company was paying its city water utility $120 per hundred cubic feet of water After calculating the cost of pre-treating its process water and adding wastewater treatment and discharge expenses the company realized that the full cost of water was five times the initial cost of purchasing water These insights led the company to reuse rinse water in the process reducing total water use and demand for ultra pure water without affecting product quality
Reduce Water-Related Business Risks Lean provides an effective platform for reducing facility water use and the associated water-related business risks While the specific risks that individual facilities face vary examples of water-related risks include water shortages and reliability issues water quality issues that drive the need for additional water treatment increasing water costs and supply chain interruptions In some water-scarce regions there may be challenges with meeting basic human needs for clean water and sani-tation competition for scarce water resources may be intense between uses associated with public water supply agriculture industry and fisheries Climate change is predicted to exacerbate many of these water risksmdashincreasing global temperatures will likely lead to increases in water de-mand water scarcity more vulnerable ecosystems and more frequent extreme weather events4
How companies respond to water risks can also have important implications for how local commu-nities and customers perceive those companies 4 For more information on water and climate change see CERES and Pacific Institute ldquoWater Scarcity amp Climate Change Grow-
ing Risks for Businesses amp Investorsrdquo February 2009 available at wwwpacinstorgreportsbusiness_water_climatefull_report pdf For a discussion of business perspectives on the connections between water energy and climate change see World Business Council for Sustainable Development ldquoWater Energy and Climate Change A Contribution from the Business Communityrdquo March 2009 available at wwwwbcsdorg
5
Chapter 1 Introduction
Types of Water-Related Business Risks (Box 4)
Companies face a variety of risks related to water security including
3Business Interruption Risks that the supply of water may be disrupted in the supply chain production andor product use
3Reputation Risks related to public scrutiny of how companies respond to water resource challenges and engage with communities stakeholders and employees
3Regulatory Risks of increased government regulations or restrictions on water use and water pollution as well as the associated costs to respond to the requirements
3Access to Capital Risks of financial institutions adopting stricter lending and investment policies based on water uncertainties
Source World Economic Forum ldquoThe Bubble Is Close to Bursting A Forecast of the Main Economic and Geopolitical Water Issues Likely to Arise in the World during the Next Two Decadesrdquo Draft Report for Discussion at World Econom-ic Forum Annual Meeting 2009 January 2009 page 39 www3weforumorgdocsWEF_ManagingFutureWater20 Needs_DiscussionDocument_2009pdf
Reducing non-value added water use is a key strategy for mitigating water risks Integrated Lean and water strategies offer practical solutions that support multiple business objectives such as increased efficiency reduced costs improved customer responsiveness and decreased water and energy use By engaging employees in teams to identify and eliminate sources of water waste in your facilitymdashalongside other production wastes such as over processing defects and delays your facility can proactively reduce water risks while also supporting operational goals Proactively en-gaging with local utilities and communities to collaboratively address water resource challenges can provide additional opportunities to reduce business risks and increase value These efforts will make your facility less vulnerable to risks and better positioned to succeed given changes in water supply demand and quality
Deliver Value for Customers and Employees Reducing water use and risks through Lean Six Sigma and other process improvement meth-odologies can foster a competitive advantage for some businesses Customers and employees may view proactive environmental improvement efforts as an important attribute affecting customer loyalty and the ability to attract and retain employees In some market segments ldquogreenrdquo attributes are an important factor that can give a product or company competitive advantage People around the world view water issues as a key sustainability challenge For example more than 90 percent of the 32000 people polled in 15 countries for a GlobeScan and Circle of Blue survey in 2009 perceived ldquowater pollutionrdquo and ldquofreshwater shortagerdquo to be serious problems (70 percent considered them very serious problems)5 Some companies can tap into significant market niches by providing cus-tomers with water-efficient choices and solutions 5 GlobeScan and Circle of Blue ldquoWater Views Water Issues Researchrdquo August 19 2009
wwwcircleofblueorgwaternewswp-contentuploads200908circle_of_blue_globescanpdf
6
Chapter 1 Introduction
Participation in international or national water sustainability programs or local water efficiency efforts can provide businesses with public recognition and a competitive advantage for their wa-ter management achievements For businesses that manufacture water-using appliances parts or products companies can use design methods to make their products as water-efficient as possible throughout their lifecycles from manufacturing to use and disposal These methods can allow companies to cater to the steadily growing markets for green building and green products There are also awards and competitions that provide recognition and media publicity for water-related in-novations and efficiency accomplishments
Reducing your facilityrsquos water use and the water that your products require during use can add value for your ldquodownstreamrdquo customersmdashsaving them water and energy costs and helping them meet their water-efficiency goals Business interest in gathering and disclosing water use and risk information through initiatives such as the Global Reporting Initiative and the Carbon Disclo-sure Projectrsquos Water Disclosure Initiative may increase in the coming decade as water becomes a more critical business issue in some supply chains and industry sectors Chapter 5 discusses ideas for engaging with customers suppliers and communities on Lean and water efforts as well as incorporating water issues into Lean product design
Getting Started with Lean and Water There are many ways for a facility to get started with reducing water waste and finding Lean and water improvement opportunities While the possibilities can be daunting the important thing is to begin even if the effort is small Consider starting out with small steps such as tracking water use as a metric at your facility with the goal of reducing use This can be a great strategy for smaller facilities Here are some ideas for initiating a Lean and water effort
Learn More About How Your Facility Uses Water A key first step is learning how your facility uses water and identifying the process areas support functions and facility operations that have the greatest water waste and improvement opportunities Strategies include beginning to track water metrics as part of Lean and process improvement activi-ties and installing water meters on processes that use large amounts of water Box 5 lists examples of water metrics that facilities can use It is helpful for facility managers and Lean champions to track water usage regularly and to share this information with floor staff Regularly monitoring water use data can help you determine the impact of peak periods (eg during summer andor busier production months) and help you spot variations that could be signs of problems
7
Chapter 1 Introduction
Water Metrics (Box 5)
Facility-Wide Metrics
3 Volume of water used each month or other appropriate time period (eg gallonsmonth or gallonsshift)
3 Volume of wastewater (eg gallonsmonth or gallonsshift)
3 Water used for specific end uses (eg gallonsper month for outdoor ir-rigation cooling water evaporation heated process water bathrooms and kitchens etc)
Metrics Normalized to Production
3 Volume of water used per product (eg gallonspound of product gal-lonsproduct)
3 Volume of wastewater discharged per product (eg gallonspound of product or gallonsproduct)
Chapter 2 of this toolkit has more information on water end uses metering and costs
To be most effective in Lean and water implementation efforts Lean champions or operations man-agers should connect with environmental and facilities personnel early on to discuss plans for Lean and water efforts Environmental Health and Safety (EHS) personnel can assist with developing water balances and other assessments of facility and process water use including gathering data on water use and costs as well as helping prioritize Lean and water activities
After completing an initial water assessment managers can consider it in the context of other planned Lean events and prioritize opportunities for involving EHS personnel in value stream map-ping and kaizen events based on when their environmental expertise will add the most value
Engage Employees in Lean and Water Improvement Efforts Lean provides a solid framework to empower cross-disciplinary employee teams to identify and eliminate excess water use and other production waste thereby realizing both environmental and Lean gains Most likely your efforts to examine water use and waste will generate numerous ideas for process improvements and potential solutions Ideas could include water efficiency and reuse opportunities andor Lean events to improve water-intensive processes
bull Motivate employees and managers by communicating corporate sustainability goals and incorporating water efficiency into performance targets and incentives
bull Consider trying out some of the Lean and water improvement ideas in this toolkit but donrsquot limit employee teams to those ideasmdashencourage their creativity and initiative
bull Train employees on how to identify water waste and improvement opportunities building their capacity to problem solve and help meet your facilityrsquos water use reduction targets
8
Chapter 1 Introduction
bull Actively solicit employee suggestions for kaizen events or other improvement projects by inviting ideas in meetings and conversations andor by using a suggestions board or box
A significant benefit of involving employees throughout your facility in Lean efforts is the oppor-tunity to create a culture of continuous improvement When employees are engaged in identifying ways to improve water efficiency they are more likely to note these opportunities and areas of water waste throughout their normal day-to-day operations You might find that improved water efficiency becomes a continual trend at your facility and not just something that happens within the confines of a specific Lean exercise or event
Focus your facilityrsquos initial Lean and water efforts on high-impact easy-to-implement strategies in order to achieve the highest likelihood of success An Impact-Difficulty Matrix such as the one in Figure 1 can be useful for prioritizing among process improvement and implementation options Lean event participants can plot their ideas onto the four quadrants in the matrix based on whether or not an idea would have a large or small impact (either in terms of operational andor environ-mental objectives) and whether or not it would be difficult to implement This process lets people see visually which projects are most ldquoriperdquo for Lean
Connect Lean and Water Figure 1 Impact-Difficulty Matrix Efforts to Sustainable Water Management Strategies Lean and Six Sigma provide operational High tools that can support a broader corporate water sustainability strategy Leanrsquos focus on performance measurement continual improvement through employee engage-ment waste elimination improved ef- Low ficiency increased profits and customer satisfaction can be leveraged to support corporate water management efforts to Low High measure and report water use factor water
Difficulty into business decisions and implement the practical and effective solutions If your organization already has a sustainability policy andor specific water efficiency goals consider how Lean and water strategies could be used to enhance and accelerate those efforts
Risk-Based Water Sustainability Strategies
Depending on the importance of water to your business it may be worth developing a risk-based water sustainability strategy and then seeing how Lean and water efforts could support implementa-tion A number of resources can help you assess specific water-related risks determine the business case for water sustainability and develop implementation plans These include
Impact
9
Chapter 1 Introduction
bull Global Environmental Management Initiativersquos (GEMIrsquos) Connecting the Drops Toward Creative Water Strategies A Water Sustainability Tooltrade wwwgemiorgwater
bull World Business Council for Sustainable Developmentrsquos Global Water Tool wwwwbcsdorgwebwatertoolhtm
bull GEMIrsquos Local Water Tooltrade (scheduled to be released in spring 2012) wwwgemiorgGEMIInteractiveToolsaspx
This toolkit complements broader water sustainability strategy resources (such as those listed above) by exploring practical opportunities to leverage facility Lean and Six Sigma and similar process improvement initiatives to reduce water waste
True North Goals and Targets
Lean experts often extol the motivational power of setting goals and targets that represent the ldquoTrue Northrdquo for operations As noted by Lean expert Robert Hall of the Association of Manufacturing Excellence ldquoTrue North is what we should do not what we can do the ultimate ideal for the overall process and for every sub-process within itrdquo6 True North goals targets and metrics are powerful tools for inspiring and focusing employee attention and creativity to both continuously improve and find breakthrough solutions For example Nike Inc developed ldquoNorth Starrdquo goals and metrics to define what sustainable products and a sustainable company would look like which includes a focus on water stewardship7 Consider what the True North target is for water use in your facility For many facilities the True North targets may be zero wastewater and zero water use that is not incorporated into the product
Examining the Full Value Chain
To achieve sustainability goals itrsquos important to look beyond a facilityrsquos direct operations Lean methods can support water use and risk reduction efforts not only at areas within the direct control of a manufacturing or industrial facility but also throughout the lifecycle or extended value chain for a product or servicemdashfrom the extraction and processing of raw materials through production processes and onto product distribution use and disposition While the primary focus of this toolkit is on reducing water use at your facility Chapter 5 discusses opportunities to extend Lean and water techniques to other areas Figure 2 provides an illustration of how the content of the toolkit links to a value chain
6 Robert Hall ldquoThe Toyota Production System Seeks True Northrdquo Lean Directions e-Newsletter 2011 available at wwwsmeorgcgi-binget-newsletterplLEANamp20040709amp1amp
7 For more information on Nikersquos North Star see httpwwwnikebizcomcrreportcontentenvironment4-1-0-overviewphpcat=overview
10
Chapter 1 Introduction
Figure 2 Lean and Water Implementation Strategies
Understand Water Uses and Costs (Chapter 2)
Find Water Waste (Chapter 3)
Improve Operations and Processes with Lean and Water Strategies (Chapter 4)
Extend Lean and Water Efforts Throughout the Value Chain (Chapter 5)
Sourcing Materials and Inputs (Chapter5)
Production Manufacturing (Chapters 3 and 4)
Product Distribution Use and Disposition (Chapter 5)
To Consider
3Is water use responsible for major costs waste or risk at your organiza-tion If you donrsquot know how would you find out
3How has Lean affected your organizationrsquos use of water
3How could your organization benefit from efforts to reduce water waste us-ing Lean (Think about time and cost savings reduced risks and liabilities added value to customers etc)
3What ideas do you have for reducing water waste using Lean
11
CHAPTER 2
Water Use and Water Waste at Industrial Facilities
Understanding water use is an important first step in efforts to reduce water-related wastes costs and risks This chapter contains the following sections
bull Definition of Water Waste bull Industrial Water Use bull Water End Uses How Water Is Used at Facilities bull Measuring Facility Water Use Metering and Submetering bull Costs Associated with Water Use
Definition of Water Waste Water is one of the most critical resources in the world and is necessary for all types of industry Water is required in substantial quantities to create goods from food products to silicon chips In this toolkit the term ldquowater wasterdquo refers to use of water beyond the point that optimizes value to the customer This includes non-value-added water use throughout facility operations and support processes and from the supply chain through production product use and waste disposal Water waste can cause harm to health and well-being of people and ecosystems by diverting water from other needs and beneficial uses Reducing water waste can help ensure that present and future gen-erations have access to a sustainable water supply
Improve your facilityrsquos water efficiency by reducing water waste not only by reducing water intake but by finding creative ways to use water more efficiently Water efficiency as the term is used in this toolkit refers to reductions in the amount of water used per unit of production Water effi-ciency refers to the minimum amount of water needed to perform a task (Note that water-efficiency improvements do not necessarily mean that a facilityrsquos total water use is decreased since increases in production may offset water efficiency gains) Examples of water waste include
bull Loss of water through material failures such as leaky hose nozzles
bull Discarding water that could be reused such as treated rinse water
bull Wastewater discharges
bull Water used by high-flow appliances instead of more efficient alternatives
bull Use of water in excess of necessity such as the use of too much water for facility or parts cleaning
Understanding the many places where water waste occurs is an important first step for identifying areas for improvement
Chapter 2 Water Use and Water Waste at Industrial Facilities
Industrial Water UseThe use of water by industries both in the United States and throughout the world represents a significant portion of total water use US industrial water use is estimated to be more than 182 billion gallons per day (from direct water withdrawals not including water use from public water supply)8 While industrial water withdrawals account for just five percent of total water withdrawals in the United States thermoelectric power water withdrawals account for 49 percent Industrial and manufacturing businesses also use about 12 percent of the public water supply Industrial water us-ers include facilities involved in sectors such as chemicals food and beverage paper and associated products steel electronics and computers metal finishing petroleum refining and transportation equipment Overall two of the most water consuming sectors of the economy are agriculture and thermoelectric power although other industries may use a significant proportion of public water supplies in some areas
The share of industrial water use can be much greater in certain geographic areas and these areas can experience substantial supply pressures Figure 3 below shows a geographic distribution of wa-ter scarcity across the globe Areas prone to water scarcity will likely experience continued competi-tion for water resources which can impact your relationship with the surrounding community Be aware of your facilityrsquos location relative to potential water scarcity and consider water competi-tion when siting new facilities or building relationships with new suppliers In the United States the National Integrated Drought Information System maintains a user-friendly web portal(www droughtgov) with current information forecasts maps reports and resources addressing drought conditions and water scarcity
Industrial water use varies by sector as different activities require different inputs of water Box 6 lists eight industries that require substantial inputs of water
Water-Intensive Industries (Box 6)
3 Agriculture
3 Apparel
3 Beverages
3 Biotechnologypharmaceuticals
3 Electric power
3 Forest products
3 High-tech (including semiconductor manufacturing)
3 Metalsmining
8 Kenny Joan F et al Estimated Use of Water in the United States in 2005 USGS 2009 httppubsusgsgovcirc1344 The USGS data does not include industrial water use drawn from municipal water systems only direct withdrawals from surface and groundwater sources Actual industrial water use is likely greater For information on water use outside of the US see AQUASTAT Food and Agricul-ture Organization of the United Nations ldquoWater Withdrawal by Sector Around 2003rdquo data downloaded November 2010 wwwfaoorg nrwateraquastatmainindexstm Note that FAO data includes thermoelectric cooling water withdrawals in its industrial water totals
12
13
Chapter 2 Water Use and Water Waste at Industrial Facilities
Figure 3 Water Scarcity Map of the World
Source United Nations Environment Programme Map of Water Stress Indicator in Major Basins 2004 available at http mapsgridanogographicwater-scarcity-index
Water is a very important resource to many industries and as a result there are many opportuni-ties to reduce water use In the case of the high-tech industry which uses considerable quantities of water to manufacture semiconductors and other components water is vital to industry opera-tions Cleaning and rinsing silicon chips can require billions of gallons of water per year to produce a single chip can use up to 7900 gallons9 Apparel also ranks high in the list of water-intensive industries with cotton production and textile processing requiring substantial inputs of water Among industrial manufacturers the forest products sector is the third-largest consumer of water in the US requiring high volumes of water for pulp and paper manufacturing The electric power industry directly uses water extensively for cooling and emissions scrubbing fossil fuel plants and nuclear power plants require hundreds of liters of water for every kilowatt-hour of electricity that they produce10 Table 1 shows typical water quantities required to produce one ton of several manu-factured products
9 Uphadyay Sanjay ldquoMicroelectronics ndash Fostering Growth Opportunities in the Ultrapure Water Marketrdquo Frost amp Sullivan August 19 2011 available at wwwfrostcomprodservletmarket-insight-toppagdocid=240394448
10 CERES and Pacific Institute ldquoWater Scarcity amp Climate Change Growing Risks for Businesses amp Investorsrdquo February 2009 available at wwwpacinstorgreportsbusiness_water_climatefull_reportpdf
Chapter 2 Water Use and Water Waste at Industrial Facilities
Table 1 Typical Water Use Per Ton of Product
Paper 21000ndash528000 gallons
Beer 2113ndash6604 gallons
Sugar 792ndash105668 gallons
Steel 528ndash92460 gallons
Soap 264ndash9246 gallons
Gasoline 26ndash10566 gallons
Source United Nations World Water Assessment Programme United Nations World Water Development Report Water in a Changing World 2009 available at wwwunescoorgwaterwwapwwdrwwdr3
There is much variation among industrial sectors in relative water use and the need for water varies greatly across the stages of the product or service value chain from suppliers through production to product use It is important to know where in the value chain your industryrsquos water use is heavi-est so that you can appropriately target improvement efforts For example the apparel industry uses high volumes of water in raw material production whereas the biotech and pharmaceuticals industry uses most of its water resources in direct operations Table 2 shows the relative intensity of water impact (ranging from zero to three squares) in different segments of the value chain for several industry sectors
Table 2 High-Impact Water Use Sectors
Raw Material Production
Suppliers Direct Operations
Product Use End of Life
Apparel n n n n n
High-Tech Electronics
n n n
Beverage n n n n
FoodAgriculture n n n n n
Biotech Pharmaceuticals
n
Forest Products n n n
MetalsMining n n n n
Electric Power Energy
n n n n
Source CERES and Pacific Institute ldquoWater Scarcity amp Climate Change Growing Risks for Businesses amp Investorsrdquo February 2009 available at wwwpacinstorgreportsbusiness_water_climatefull_reportpdf
14
15
Chapter 2 Water Use and Water Waste at Industrial Facilities
Water End Uses How Water Is Used at Facilities In order to reduce water waste in industry it is important to understand the many ways that water is used within facilities Understanding water end uses is critical to identifying water savings opportunities While end uses of water vary by industry and by facility there are categories of water use that are present at most industrial facilities Water use in most industries can be classified into the following broad end uses
bull Production processing and in-product use
bull Auxiliary processes (eg pollution control labs and cleaning)
bull Cooling and heating (eg cooling towers and boilers)
bull Indoor domestic use (eg restrooms kitchens and laundry)
bull Landscape irrigation
These broad categories encompass many of the ways industrial facilities use water Among US industrial customers cooling operations (including cooling towers and open cooling systems) com-prise the single largest category of industrial water end use with more than 50 percent of industrial and commercial water demand combined going toward cooling11
The amount of water required for the various end uses differs by industry Service and manufactur-ing facilities require the most water for washing and processing while food and beverage facilities use most of their water intake in product preparation Figure 4 shows examples of water end uses in the computer and electronics manufacturing industry and the food processing industry
11 Vickers Amy Handbook of Water Use and Conservation WaterPlow Press 2001
16
Chapter 2 Water Use and Water Waste at Industrial Facilities
40
20
20
10
5 5
Figure 4 Breakdown of Water Uses in Two Industries
Rinsing
Cooling Systems
Fume Scrubbers
Water Purification
RestroomsOther
Landscaping
Computer and Electronics Manufacturers
3
42
14
13
9 Washing and Sanitation
Cooling and Heating
OneshyPass Cooling
Process
Domestic
OtherUnaccounted
Source Adapted from New Mexico Office of the State Engineer ldquoA Water Conservation Guide for Commercial Institutional and Industrial Usersrdquo July 1999 available at wwwosestatenmuswater-infoconservationpdf-manualscii-users-guidepdf
Major end uses of water often provide the greatest opportunities for water waste reduction and efficiency improvement For example in many food beverage and pharmaceutical companies cleaning process equipment can account for as much as 50 to 70 percent of a facilityrsquos total water use and represents a substantial opportunity to save water12 Figure 5 illustrates how water flows through several different end uses at an industrial facility note that this diagram does not incorpo-rate all reuse options Think of how a similar diagram would look that shows the water use at your facility
12 General Electric Company Water amp Process Technologies ldquoSolutions for Sustainable Water Savings A Guide to Water Efficiencyrdquo 2007 available at wwwgewatercompdfCapabilities20Brochures_CustAmericasEnglishBulletin1040enpdf
19
Food Processors
17
Chapter 2 Water Use and Water Waste at Industrial Facilities
Figure 5 Example Water End Uses at an Industrial Facility
Cooling amp Heating
Production Processes
Auxiliary Processes
Indoor Domestic Use
Landscape Irrigation
Treatment
Water Supply
Water in Products Wastewater Stormwater Losses Losses
Beyond these categories of water end use specific industries have processes that demand significant amounts of water For example in the textile industry a typical continuous fabric bleach range machine can consume 11000 gallons of water per hour13
Measuring Facility Water Use Metering and Submetering To gain a better understanding of water use patterns at your facility it is almost always helpful to use water meters Many Lean methods rely on the availability of timely and accurate information on key performance metrics By measuring water use and flows at the facility andor process level it becomes much easier to identify water efficiency opportunities As the saying goes you canrsquot manage what you donrsquot measure There are two types of water meters Source meters measure the amount of water being supplied to the facility while submeters measure usage for specific activities such as cooling towers process use or landscape water use
Water meters can be either portable or fixed on specific equipment Use portable water meters to measure water flows for processes or operations in your facility as part of Lean efforts such as gemba walks value stream mapping and kaizen events (strategies discussed in chapters 3-4) You can strap a hand-held acoustic water meter onto a pipe at a few places where you think there might be excessive water use Compare the water data from the master meter to the water flowing through the pipes in the process to confirm where there are potential water savings opportunities These data can help you develop a water balance (described in chapter 3) See Appendix B for resources to help you determine rates of water use including calculations and unit conversions
13 North Carolina Department of Environment and Natural Resources Water Efficiency Manual for Commercial Industrial and Institutional Facilities May 2009 available at wwwp2paysorgref0100692pdf
18
Chapter 2 Water Use and Water Waste at Industrial Facilities
Figure 6 Portable Water Meter
Source Eno Scientific wwwenoscientificcom
Accurately measuring water use can help you identify areas for targeted reductions and track progress from water-efficiency upgrades Submeters can also help identify leaks and indicate when equipment is malfunctioning In some cases it may also be useful to measure water pressure a drop in pressure can indicate the presence of a leak However especially for smaller facilities it will not necessarily make sense to use meters everywhere Consider using meters when you have a need to closely track data for example before and after a process improvement event on a water-inten-sive process You can use the data provided by the meters to compare water use and see how your efforts have improved your facilityrsquos water efficiency Larger facilities can also integrate meters into centralized building management systems making it easy to electronically track water usage gener-ate reports and trigger alerts when leaks or anomalies are found For additional advice on when to use water meters consult your local water utility or the resources in Appendix A
Installing the correct meter and ensuring it functions properly are critical to accurate water measurement There are many types and sizes of meters intended for different uses so it is impor-tant to choose the correct one Improper sizing or type of meter can cause problems For example
14 Smith Timothy A Plumbing Systems and Design Water-Meter Selection and Sizing 2008 wwwpark-usacomhomeaspxelid=71amparl=108
19
Chapter 2 Water Use and Water Waste at Industrial Facilities
an undersized water meter can cause excessive pressure loss reduced flow and noise Oversized me-ters are not economical and do not accurately measure minimal flow rates14 It is also important to ensure that water meters are properly calibrated according to the manufacturerrsquos recommendation and that appropriate maintenance practices are followed on metering equipment Most meters have internal mechanical parts and will begin to under-register the amount of water used as the meter gets older and the mechanical parts wear down When abnormal water measurements are detected check the metering equipment to ensure that the results are not due to metering equipment failures
By metering water use at the facility and process levels facility personnel can compile data to inform Lean improvement efforts Here are some practical tips for using water meters as a part of Lean efforts
bull Use flow meters and water quality or cleanliness standards to establish standard work for water usage flow and pressure levels taking into consideration ldquoset pointsrdquo recom-mended by equipment specifications and facility operating procedures These baseline levels give important context of what accounts for ldquonormalrdquo operating parameters against which improvements and new water losses can be assessed
bull Use data that meters provide to determine the appropriate frequency for aggregating and reporting water measures (eg hourly daily or weekly) that best meets your facil-ityrsquos needs
bull Show employees how to read and use water meters as part of Lean activities such as gemba walks value stream mapping and kaizen events so that they can identify water savings opportunities
bull Post water use reduction goals and water usage information on the factory floor on Lean production control boards or in other accessible places to raise awareness of water use and efficiency among employees
bull Track data from water meters over time Portfolio Manager an online building per-formance benchmarking tool available from the ENERGY STAR program can help you track and benchmark water consumption data For more information on the Portfolio Manager see Appendix A
20
Chapter 2 Water Use and Water Waste at Industrial Facilities
Costs of Water Waste As noted in chapter 1 costs associated with water use include more than the direct costs you pay for water supply but also the costs of water as it travels through processes and operations (see Figure 7) Box 7 provides examples of water costs such as energy pollution control regulatory compliance and raw material costs
Figure 7 Costs Associated with Water Use
Costs Associated with Water Use
Price of Incoming Water
Sewer Service Charge
Labor and other costs associated with water processing and treatment
Cost of energy and chemicals needed to process water
The ldquoprice on the water billrdquo
The cost of water use at a facility can be much greater than the amount on the water bill
Estimating the many components of total water cost for a facility can begin with the cost of water purchased from utilities but should also include the cost of steps required to process use and discharge the water These costs can amount to a good deal more than what appears on a utility bill When estimating water costs it is important to consider these and other indirect costs throughout all functions of a facility Be sure to use estimated future rates when assessing water costs in order to project the level of savings that will be possible when improvements are made
21
Chapter 2 Water Use and Water Waste at Industrial Facilities
Common Costs Associated with Water Use (Box 7)
Raw Material Costs
3 Water purchased from utilities marginal costs of purchasing additional wa-ter versus costs of conservation
3 Cost of water treatment filtering and softening before use
3 Costs for chemicals needed to treat and manage water
Energy Costs
3 Cost of energy to heat water
3 Cost of energy to pump water from its source or within the facility itself
3 Energy and labor costs for operating and maintaining water-using equip-ment
Pollution Control Costs
3 Wastewater and stormwater service rates including surcharges
3 Total cost of treating wastewater for disposal including labor energy chemi-cals equipment and residual disposal
3 Marginal costs of increasing effluent treatment capacity when water de-mand increases
Regulatory Compliance Costs
3Labor costs for regulatory compliance activities such as completing permit applications monitoring compliance and reporting wastewater discharges to regulatory agencies
Source Adapted from North Carolina Department of Environment and Natural Resources Water Efficiency Manual for Commercial Industrial and Institutional Facilities May 2009 available at wwwp2paysorgref0100692pdf
Full costs associated with water use often vastly outweigh the direct costs The direct cost of pur-chasing water from a utility may not seem significant enough alone to merit the effort to reduce water use but when the full cost of water is assessed the financial savings can be substantial Table 3 shows an example of the various costs of water in an industrial process In this example the esti-mated savings from implementing improvements using direct water and sewer costs alone is only 56 percent of the estimated savings using the full cost of water The flexible cost savings of conserved water is estimated to be 40 percent of total treatment cost Flexible treatment costs refer to expenses that vary according to the volume of water treated (eg energy used to pump and treat water treat-ment chemicals) fixed costs (eg capital equipment used for treatment) do not typically vary as wastewater throughput changes
Chapter 2 Water Use and Water Waste at Industrial Facilities
Table 3 Costs Associated with Water Used in an Industrial Process
Activity Unit Cost ($1000 Gallons)
City Water Purchase $355
Sewer Rate $399
Deionized using reverse osmosis
Equipment $057
Energy $120
Labor $143
Total deionized water $231
Deionized water (flexible cost) 40 x $231 = $092
Wastewater treatment
Sludge disposal $346
Treatment chemicals $244
Energy $032
Labor $625
Total wastewater treatment $1247
Wastewater treatment (flexible cost) 40 x $1247gallon = $498
Total cost of water $1344
Flexible cost savings of conserved water is estimated to be 40 percent of total treatment cost
Source Adapted from North Carolina Department of Environment and Natural Resources Water Efficiency Manual for CommercialIndustrial and Institutional Facilities May 2009 available at wwwp2paysorgref0100692pdf
22
23
Chapter 2 Water Use and Water Waste at Industrial Facilities
Appendix B contains a Water Cost Calculator that provides a template for calculating common costs associated with water use at industrial facilities It may also be useful to estimate the potential water and dollar savings that would result from implementing water efficiency measures at your facility see Appendix C for some equations that you can use to guide these estimates
In some water-stressed areas industrial facilities may face the possibility of an even greater water-related costmdashthat of lost revenue from the need to curtail production in the event of water supply disruptions Competition for water across residential agricultural industrial and environmental needs during periods of water scarcity may lead local water managers to impose limits on industrial water use Understanding the vulnerability to disruption of local water supplies can be an important consideration when assessing the true costs of water use when expanding or developing new facili-ties
The next chapter discusses strategies for understanding how water is used at your facility and iden-tifying opportunities to reduce water use and improve operations
To Consider
3 What are the primary water end uses at your facility
3 What processes and facility operations use the most water
3 What costs are associated with your facilityrsquos water use What indirect costs may be unaccounted for
Lean and Water Toolkit
25
CHAPTER 3
Finding Water Waste on the Factory Floor
Some of the most substantial reductions in water use can be found right on the factory floor This chapter describes several simple techniques to foster an understanding of where water goes in a facility and where it can be saved including the following
bull Water Gemba Walks bull Developing a Water Balance bull Water Waste and Value Stream Mapping bull Root Cause Analysis
While all of these techniques evaluate aspects of facility water use and can support your Lean efforts each has a different level of detail time and staff investment requiredmdashranging from a facility walk to a multi-day value stream mapping event Consider the level of effort desired before getting started to conduct the most effective analysis for your facilityrsquos needs
Water Gemba Walks A useful way to identify ways to reduce water consumption is a ldquogemba walkrdquo A water gemba walk is an exercise in which employees and managers walk the factory floor together to observe and inventory inefficiencies related to water use Gemba is a Japanese term meaning ldquothe real placerdquo in the context of Lean manufacturing gemba typically refers to the place where work happens (eg factory floor) Water gemba walks enable a team to quickly locate ldquolow-hanging fruitrdquo that save water at a small cost They help facilities to
bull Identify major sources of water loss such as leaks that can be repaired for significant savings
bull Acquire a more complete understanding of the major end uses of water and flows of water in the facility than can be achieved solely by analyzing water utility bills
bull Instill floor managers and workers with the importance of looking for and noticing leaks and inefficiencies helping to create a culture of water efficiency
Before you conduct your gemba walk first determine the purpose and scope of the walk How large an area will the walk cover and how long will it take How long will the team look at certain aspects of plant operations What information or data would equip the team to best see wastes and opportunities Second obtain copies of relevant documents and data including the last year of water utility bills or water consumption logs the floor plan of the facility if available and process diagrams for focus areas Third select the members of the gemba walk team A small team is best with approximately five to seven people constituting an ideal team size Include workers and man-agers familiar with the area outsiders new employees and veterans as well as an EHS representa-
26
Chapter 3 Finding Water Waste on the Factory Floor
tive in order to get a diversity of perspectives A brief training can orient your team to the purpose of a gemba walk and help them feel empowered to spot wastes throughout the walk
Once you have your team assembled use the Steps to Take During a Gemba Walk in Box 8 to find water waste and improvement opportunities at your facility
Steps to Take During a Gemba Walk (Box 8)
1 Identify all water-consuming equipment high-use areas and meterlocations
2Note all water losses evaporative losses and water incorporated in product excessive water pressure and leaks
3Observe shift clean-ups and process changeovers
4Quantify water flow rates and usage
5Note the water quality used in each process step
6Determine water quality needs for each process and quality of wastewater discharged
When employees are engaged and interested in finding wastes and identifying ways to improve water efficiency the benefits of your gemba walk can continue well beyond the exercise itself The training that your employees receive to conduct a gemba walk or other Lean exercises combined with immediate engagement in the exercises themselves can help to create a culture in which em-ployees routinely seek out ways to improve water efficiency
Consider conducting your gemba walk during a time when the facility is shut down as this can be a good time to find unexpected losses You can also collect data during your gemba walk on the nature of the water in use at various steps throughout each process knowing when treated water is necessary and when lower-quality water might be okay will help you identify reuse opportuni-ties later Table 4 Key Areas to Check During a Water Gemba Walk lists several common areas in industrial facilities in which water inefficiencies can be observed during a gemba walk
Chapter 3 Finding Water Waste on the Factory Floor
Table 4 Key Areas to Check During a Water Gemba Walk
Process and Equipment Use bull Cleaning Washing Rinsing bull Metal Finishing bull Painting bull Dyeing and Finishing bull Photo Processing bull Process Water Reuse bull Product Fluming (Water Transport) bull Pretreatmentfiltration systems bull Pump and Conveyor Lubrication bull Water Use in Products
Other Facility Support
bull Floor Washing bull Air Emission Wet Scrubbers bull Building Washing bull QAQC Testing bull Laboratories bull Landscaping and Irrigation bull Dust and Particulate Emission
Control bull Decorative Fountains and Ponds bull Vehicle Washing bull Cooling Water for Air Compres-
sors and Vacuum Pumps bull Hazardous Waste Storage and
Effluent
Cooling and Heating bull Single-Pass Cooling bull Cooling Towers bull Boilers Hot Water Steam Systems bull Air Washers bull Boiler Scrubbers
Sanitary and Domestic Kitchens bull Toilets bull Food Preparation and Cleaning bull Faucets bull Dishwashers bull Urinals bull Ice Machines bull Showers bull Faucets bull Wash-up Basins bull Food Disposals
Source Adapted from North Carolina Department of Environment and Natural Resources Water Efficiency Manual for Commercial Industrial and Institutional Facilities May 2009 available at wwwp2paysorgref0100692pdf
Leak detection during a gemba walk can be one of the best low-cost high-yield steps for reduc-ing water waste in a facility Leaks exist in all facilities and can result in water loss ranging from a fraction of a percent of a facilityrsquos total water use all the way up to a substantial portion Low water pressure dirty water and a high quantity of water that cannot be accounted for are all signs of a leak Bluing tablets or dyes can be used to easily check for leaks in tanks toilets or other water holding vessels Sonic or acoustic leak detection equipment can be used to check for leaks in under-ground pipes A simple drip gauge can help you conduct a basic estimate of how much water is lost due to a leak Many leaks can be repaired with simple measures such as tightening or replacing fit-tings15 In some cases it may be best to enlist the services of a professional leak-detection company to identify more complex leaks
15 North Carolina Department of Environment and Natural Resources Water Efficiency Manual for Commercial Industrial and Institutional Facilities May 2009 available at wwwp2paysorgref0100692pdf
27
28
Chapter 3 Finding Water Waste on the Factory Floor
Box 9 lists some examples of successful gemba walk and leak detection efforts
Examples of Water Gemba Walk Success (Box 9)
3Kirtland Air Force Base performed leak-detection gemba walks in which teams walked water lines with acoustic listening devices to find leaks sur-veying 90 percent of water distribution lines on the base The teams found that 31 leaks were dripping away nearly 16 percent of the basersquos water at a rate of 333 gallons lost per minute Repairs after the survey saved over 179 million gallons per year
3In one DTE Energy plant water pressure on the upper floors of the building was problematically low Observations on the factory floor revealed that an open valve on a new water treatment system was responsible for the low water pressure By installing a $3000 variable valve the company saved half a million dollars that it would have spent on a booster pump
3Del Monte Foods used a water gemba walk to identify potential water sav-ings in a recirculation line that was forked from eight inches to two four-inch pipes By combining the freshwater line with the main line the facility was able to save 300000 gallons per day
Sources US Department of Energy Federal Energy Management Program ldquoDistribution System Audits Leak Detec-tion and Repair Kirtland Air Force Base ndash Leak Detection and Repair Programrdquo 2009 information provided by Jason Schulist and Michael Sklar DTE Energy May 2011 and Scott Butler Del Monte Foods ldquoThe Del Monte Production System Lean to Green Integrative Futurerdquo Presentation at Green Six Sigma Summit Presentation May 2009
Developing a Water Balance While a gemba walk will help you identify potential water-savings opportunities developing a water balance will give you a more thorough picture of overall water use at your facility A water balance is a high-level simple assessment of the input and output of water in your facility that can help to identify opportunities for improving water efficiency A water balance might be appropriate for your facility especially if you are just beginning your journey with Lean and water and have not con-ducted a more detailed water audit
A water balance is a chart table or diagram of a facilityrsquos water use that shows the flows of water into and out of each process or operation in the facility It typically includes every water-consuming component on-site and all flows out of the facility A water balance can also include data on the cost of water Figure 8 illustrates the fundamental approach to developing a water balance Water bal-ances can also be developed as part of value stream maps
29
Chapter 3 Finding Water Waste on the Factory Floor
Figure 8 Typical Water Balance Calculation
Input (A)
Process Unit
A B C
Output (C)
A ndash (B+C) = Balance (or discrepancy)
Input is ProcessFacility Water Supply Water Losses (eg to air land and product) Output is Wastewater Discharge
Water Losses (B)
When creating a water balance make note of all water use in the facility and track water flows from the source through all operations at the facility to water losses and outputs including evaporative losses input to products and wastewater discharge All uses of water in a facility should be included in a water balance Common end uses of water are discussed in chapter 2 and include processing and auxiliary processing heating and cooling indoor domestic use and landscape irrigation The water balance should capture all of the flows into and out of each process at the facility and should verify that there is a balance between flows in and flows out Compare the estimated or measured total of end uses with the incoming metered amount Be sure to account for losses such as evaporation as well as wastewater discharge The Simplified Elements of a Water Balance figure (Figure 9) below shows an example of the components of a simple water balance for a facility while Table 5 Example Water Balance Summary presents overview information on water use by process from a water balance
30
Chapter 3 Finding Water Waste on the Factory Floor
Figure 9 Simplified Elements of a Water Balance
Pretreatment 950 gallons
Landscaping
Processing
Cooling Towers
Boilers 50 gallons
50 gallons
Losses
Wastewater
Losses
Wastewater
Water in Products
Stormwater
The process of putting together a water balance helps to capture a baseline of a facilityrsquos current water usage (see Box 10) A water balance will help you identify sources of risk such as leaks and compliance concerns Some companies choose to conduct water balances at varying levels of detail on a regular basis in an effort to locate ways to reduce water use and discover hidden water-savings dividends
Chapter 3 Finding Water Waste on the Factory Floor
Table 5 Example Water Balance Summary
Water Uses Input (GallonsYear)
Output (GallonsYear)
Loss (as a of Water Use)
Cooling tower make-up and boiler make-up
8484000 8248000 236000 (28)
Process use 6298000 6186000 112000 (18)
Cooling air compres-sors and pumps
7654000 7455000 199000 (26)
Landscaping 1675000 1533000 142000 (85)
General washing sanitation and maintenance
1101000 1095000 6000 (05)
Food preparation dishwasher
624000 613000 11000 (18)
Subtotal 26660000 25130000 1530000 (57)
Total Water Loss 1530000 GallonsYear
A spreadsheet developed by GEMI to help you create a water balance for your facility is available at wwwgemiorgwaterplannercalc-waterbalanceasp
Benefits of compiling a water balance include
bull Ability to identify processes that present the best targets for reducing water use
bull Establishment of baseline water use data from which improvements in efficiency can be benchmarked
bull Creation of a tool with which to compare different water-efficiency improvement strategies
31
32
Chapter 3 Finding Water Waste on the Factory Floor
Information to Collect for a Water Balance (Box 10)
To complete a water balance collect data on the volume of water flows for each process or operation in your facility including
3 Water and sewer bills from the previous one to three years
3 Numbers sizes and locations of water meters
3 Sources of incoming water
3 Diagrams of plumbing and water pipes as well as irrigation schematics
3 List of water-consuming processes
3 Information about unsewered wastewater (wastewater not discharged to municipal sewer systems such as through separate permitted discharges)
An outside expert could be the best option to help conduct a water balance for some facilities Contact your local water utility to ask whether it provides assistance for developing water balances some utilities provide this service (or related services) free of charge In many cases a water bal-ance can make it easy to identify steps to take to improve water efficiency If there is a discrepancy between the input and output of water in your facility that becomes apparent after preparing your water balance you might use that baseline to create a target future state that reduces the discrepan-cy by a set percentage Several of the resources in Appendix A provide information about developing water balances more involved assessments such as water footprints (see Box 11) and audits and benchmarking and tracking tools such as ENERGY STARrsquos Portfolio Manager
More Detailed Water Audits Water Assessments and Water Footprints
In the event that a more detailed assessment of water use and risks is desired an organization could consider conducting a water audit water source vulnerability assessment andor water footprint analysis While the results of these methods can inform the use of Lean to improve facility water efficiency they are typically conducted as stand-alone efforts that can require substantial effort and investment These methods are only described briefly below in this toolkit
bull A water audit typically involves a more comprehensive time-intensive facility-wide effort to as-sess a facilityrsquos water use and efficiency improvement opportunities A water audit may include activities described in this toolkit such as metering and baselining but it typically focuses on the full facility in a discrete brief period (eg during a 1ndash2 week effort) You may choose to follow specific standards when conducting the audits such as those of the American Society of Heating Refrigerating Cooling and Air-Conditioning Engineers
bull A water source vulnerability assessment generally looks outside of the facility at factors that have potential to affect the supply and cost of water that the facility and surrounding commu-nity relies upon This assessment can help a facility determine the risks of water supply disrup-tions or costs fluctuations and identify steps that may help to reduce these risks
33
Chapter 3 Finding Water Waste on the Factory Floor
bull Water footprinting analysis refers to the total volume of fresh water that is used directly and indirectly to run and support the business encompassing both water use within an industrial facility and throughout its supply chain You might consider conducting a water footprint to gain a more complete understanding of the places where water is used inefficiently throughout your supply chainmdashupstream among suppliers and downstream by users of the facilityrsquos output or products While a water footprint can be time-consuming and difficult to prepare it can be helpful in identifying improvement opportunities throughout the supply chain Box 11 provides tips for conducting water footprint analyses while chapter 5 discusses strategies for engaging suppliers to reduce water use and risks
Water Footprinting Tips (Box 11)
What information should water footprint analyses contain
3Track surface and groundwater sources rainwater stored in the soil and polluted water as inputs and outputs from a facility This can help address concerns about water scarcity and use
3 Include the geographical location of water withdrawals and discharges as well as direct and indirect water use
3 Work with suppliers to get data on water inputs and outputs from their operations often this is where the most water is used
3 Consider also estimating your productsrsquo end-use footprint which is any water used by consumers when they use the product
3 Note the scarcity and drought vulnerability of your suppliersmdasha water foot-print can be a valuable tool to identify business risks
3 Present the water footprint information in a clear and compelling manner such as a diagram showing water flows and quantities
For additional guidance on water footprinting see the Water Footprint Network website wwwwaterfootprintorg
Water Waste and Value Stream Mapping Like water balances value stream mapping can be a powerful tool for identifying water waste and savings opportunities Value stream mapping is a Lean method for creating a visual representation of the flows of information and materials across all the activities involved in producing a product for a customer In a value stream mapping event two maps are developed a map of the current state showing key data about existing processes and a future state map showing changes that can be made to reduce waste Value stream maps can be developed at the value-stream level (eg for a product family) or at the process level after your team has selected a process to investigate more closely
34
Chapter 3 Finding Water Waste on the Factory Floor
By adding water data to value stream maps value stream mapping can help you
bull Gain a better understanding of where the greatest water waste occurs
bull Identify areas where improvements can be made to reduce excess water use and other wastes
bull Develop an implementation plan for process improvements to reduce wastes in the value stream prioritizing water efficiency projects alongside other Lean and environ-mental projects
bull Quantify the expected savings from implementing those improvements
bull Create a culture of efficiency as team members from supervisors to floor workers be-come engaged in cutting waste
Adding Water Waste to Value Stream Maps Value stream maps depict all the activities in a value stream or a process along with key metrics that primarily relate to time Incorporating water considerations into a value stream mapping exer-cise is as simple as adding the amount of water used at each step onto the value stream map Figure 10 Adding Water Use to Value Stream Map Process Box shows a process data box with data on the water use by a particular process included Costs associated with the water used by each process or process step could also be added however to be fully representative these costs should include indirect costs such as those for support functions
Figure 10 Adding Water Use to Value Stream Map Process Box
CT = 4 min CO = 45 min Uptime = 61 Water Use = 9K gallonsday
2 people
Plating
Water use per day
35
Chapter 3 Finding Water Waste on the Factory Floor
Figure 11 Value Stream Map Incorporating Water Use Metrics shows an example of a current state value stream map that has been modified (with additions in blue) to include data on the amount of water used at each step Most activities that consume water are tracked in the map however note that this map does not include water loss as a result of leaks and evaporation or other losses that can occur between process steps
Figure 11 Value Stream Map Incorporating Water Use Metrics
Mar
ket F
orec
ast
Tota
l Lea
d Ti
me
= 68
day
sVa
lue
Adde
d Ti
me
= 15
min
Tota
l Wat
er U
se =
59K
gal
Cus
tom
erA
2 pe
ople
CT
= 4
min
CO
= 4
5 m
inU
ptim
e =
61
Wat
er U
se =
30K
gal
Dry
ing
2 pe
ople
Cle
anin
g
CT
= 2
min
CO
= 6
0 m
inU
ptim
e =
74
Wat
er U
se =
10K
gal
3 pe
ople
CT
= 7
min
CO
= 5
0 m
inU
ptim
e =
48
Wat
er U
se =
15K
gal
Rin
sing
I I
I 3
peop
le
Ship
ping
7 m
in4
min
2 m
in
15 d
ays
8 da
ys10
day
s 30
day
s
Prod
uctio
nC
ontr
ol
WK I
5 da
ys
D
I D
30 d
ays
WK
Rec
eivi
ng
CT
= 2
min
CO
= 3
0 m
inU
ptim
e =
93
Plat
ing
5 da
ys
2 m
in
Cus
tom
erB
Su
pplie
r1
Supp
lier
2
Lead
Tim
e
36
Chapter 3 Finding Water Waste on the Factory Floor
Many teams develop value stream maps using sticky notes to represent each step in a process This enables team members to move things around easily and helps them create the most accurate pic-ture of the process possible
To create a visual representation of the areas in the value stream map that use the most water try using different colors of sticky notes for high- and low-water using steps See Figure 12 for an example of the use of sticky notes to create a value stream map with water data added to several of the notes
Figure 12 Process Boxes Showing Water Waste
Another way to show water inputs and outputs associated with your facilityrsquos processes is by drawing lines into and out of each process data box on your value stream map In Figure 13 the red circles show where water and wastewater flows have been identified other waste streams are identified as well See EPArsquos Lean and Chemicals Toolkit for more information on this approach16
16 Value stream mapping is described in chapter 3 of the Lean and Chemicals Toolkit available at httpwwwepagovleanenvironmenttoolkitschemicalsch3htm
37
Chapter 3 Finding Water Waste on the Factory Floor
Figure 13 Water Inputs and Outputs Identified on a Value Stream Map
After creating a current state map your value stream mapping team will create a future state map that envisions ways to eliminate waste in the value stream and identifies areas for future process improvement projects such as kaizen events or just-do-its (described in the next chapter) With water data included on the current state value stream map your team will be able to easily identify opportunities for increased water efficiency and can work together to identify prioritize and develop an implementation plan for improvement projects that can meet both Lean and environmental goals Incorporating water waste into value stream mapping allows water efficiency projects to be combined with and considered together with other operational improvements
The implementation plan is a key product from the value stream mapping event Take care to de-velop an implementation plan that details the steps to carry out the improvements you have identi-fied being sure to assign responsibility for each step of the plan Consult with facility EHS staff and permitting authorities before making any changes that could affect facility emissions or wastewater discharges
For more information on adding environmental metrics to value stream maps see chapter 3 of EPArsquos Lean and Environment Toolkit17
17 Available on the EPA Lean Manufacturing and the Environment website at wwwepagovleanenvironment
38
Chapter 3 Finding Water Waste on the Factory Floor
Root Cause Analysis When you find a water waste in your facility whether during a gemba walk or a value stream map-ping exercise itrsquos important to ask ldquoWhy did this happenrdquo There is a set of Lean tools that can help you answer this question Root cause analysis is the process of identifying a problem and working through possible components to identify the most basic reason why the problem is occurring Once the cause of the problem is identified you can prevent its recurrence Two tools of root cause analy-sis include fishbone diagrams and the ldquo5 whysrdquo approach
Explore water waste yoursquove found in a Fishbone Diagram (also known as an Ishikawa Diagram) which shows potential causes of a problem by grouping causes into major categories to identify the source of inefficiencies To investigate water waste using a fishbone diagram first identify the specific problem you wish to investigate perhaps a spike in water use at the facility or a leaky pipe or valve Write the primary problem you wish to investigate in the head of the diagram usually on the right side The ldquobonesrdquo of the diagram represent groupings of potential causes of the problem common categories include the following
bull Measurements
bull Material
bull Man (or Personnel)
bull Methods
bull Machines
bull Environment
Along each grouping many detailed sub-causes are listed Figure 14 on the next page Fishbone Diagram of Excessive Water Use shows an example of a fishbone diagram that one facility used to assess its water use
Another root cause analysis tool is the ldquo5 whysrdquo technique The approach uses a systematic ques-tionnaire technique to search for root causes of a problem Simply ask ldquoWhyrdquo when considering the primary problem ldquoWhy is excessive water used hererdquo Follow up with additional ldquoWhyrdquo inquiries until you drill down to the root cause of the problem The goal of the exercise is to pursue further until the root of the problem is identified Be aware that there is sometimes more than one cause of a problem
39
Chapter 3 Finding Water Waste on the Factory Floor
Asking Why Five Times (Box 12)
1 Why are we using so much water The parts need to be cleaned before painting
2 Why do the parts need to be cleaned The parts fail quality checks if they arenrsquot cleaned before being painted
3 Why do painted parts fail quality checks The paint doesnrsquot adhere when part surfaces are not prepared properly
4 Why do the surfaces of the part need to be prepared The surfaces get contaminated by oils used in the previous process
5 Why are oils used in the previous process The oils are used to prevent corrosion during storage
Based on an example from Robert B Pojasek ldquoAsking lsquoWhyrsquo Five Timesrdquo Environmental Quality Management (Autumn 2000) 83
Figure 14 Fishbone Diagram of Excessive Water Use
Measurements Material Personnel
Environment Methods Machines
Excessive Water Use
No metrics
Budget baseline
Untreated water
Galvanized piping
Operator understanding
Obsolete article
Operator training
RCM
Notification procedures
Ineffective ventilation
No ventilation
No headers
Plugged pipesdisks
Eroded orifice disks
Failed controllers
Failed valves
Failed probes
Source Schulist Jason Lean Towards Sustainability How to Use Lean and Six Sigma Methods to Drive Your Sustainability Journey DTE Energy 2009
40
Chapter 3 Finding Water Waste on the Factory Floor
Completing a root cause analysis exercise should be a precursor to brainstorming potential solu-tions to water waste problems at your facility By using these tools you can ensure that you address the root cause of the problem first instead of merely treating the symptoms Chapter 4 explains how to take the knowledge about your facilityrsquos water use that you have gained through the tools listed in this chapter and apply that knowledge to reduce water use
To Consider
3 Where are the largest sources of water waste in your facility If you donrsquot know what steps will you take to find out
3 Are there processes or areas at your facility that could use non-potable or lower quality recycled water
3 What resources might be available in your area to help you conduct a water balance or water audit
3 Where in your facility might be a good target for a water-focused value stream mapping activity
41
CHAPTER 4
Lean and Water Efficiency Improvement Strategies
After yoursquove taken the important first steps to understand how your facility uses water there are a number of ways to reduce your water use through Lean and water efficiency efforts This chapter describes the following
bull Kaizen Events and Just-Do-Its to Reduce Water Use bull Integrate Water Efficiency into Everyday Lean Practices bull Lean and Water Applications for Facility Operations and Support Processes
Kaizen Events and Just-Do-Its to Reduce Water Use There are three key questions to ask to identify water-efficiency opportunities
Key Water-Efficiency Questions (Box 13)
3 Can we stop or prevent water losses (eg leaks)
3 Can we reduce water use (eg changing equipment plumbing processes andor behaviors)
3 Can we recycle or reuse water for another purpose (eg recirculating water within a process reusing process water for another application capturing rainwater etc)
Leanrsquos implementation-based methods of kaizen events and just-do-its are powerful strategies for putting water efficiency into practicemdashjust-do-its for easy changes and kaizen events for more in-volved projects A kaizen eventmdashalso known as a rapid process improvement eventmdashis a 2ndash5 day period when a cross-functional team examines a process and makes rapid changes to improve it
Before initiating significant process changes remember to consult with your local utility or environmental agency to make sure that all facility permitting requirements are met EHS staff at your facility can provide guidance on which changes may trigger regulatory or worker health and safety issues
42
Chapter 4 Lean and Water Efficiency Improvement Strategies
Water Kaizen Event Examples (Box 14)
GE conducted week-long water kaizen events at three of its largest water-consuming sites in 2009 including monitoring and assessing water use facility-wide and developing water-reduction projects with associated financial benefits
3 These kaizen efforts combined with flow monitoring and water-conservation efforts at the largest water-consuming site helped GE reduce water use 30 percent from 153 billion gallons in 2006 to 107 billion gallons in 2009
Through an environment health amp safety kaizen event at one site United Technologies Corporation eliminated 40000 gallons of wastewater per year and saved $50000 per year by changing how the facility managed test cells an underground storage tank and its waste streams
3 The facility no longer sends water to the storage tank and waste fluids from the process (eg oils) are collected separately to allow for reuse recycling or reclamation
3 These efforts are expected to further reduce wastes up to a total savings of 75000 gallons and $150000 per year
GE ldquoEcomagination 2009 Annual Reportrdquo pp 16-17 httpgeecomaginationcomreporthtml World Business Council for Sustainable Development (WBCSD) ldquoEco-efficiency Gains Ground United Technologies Corporation (UTC)rdquo WBCSD Case Study August 10005 available from wwwwbcsdorg
Two types of kaizen events to reduce water use include
bull Water Kaizen Events Consider conducting some kaizen events that are specifically designed to find and implement water efficiency opportunities (see Box 14 for examples) Good places to target include processes or areas of facility operations that use significant amounts of water Some companies such as GE use kaizen events to look for water-efficiency opportunities across a single facility Water balances and value stream maps with water data can provide good ideas for where to focus water kaizen implementation activities
bull Kaizen Events on Water-Using Processes Even if the main objective of a kaizen event is not water efficiency itrsquos helpful to keep an eye out for water-efficiency opportunities There may be opportunities to reduce water use such as by adjusting equipment or reusing water while also improving other aspects of the process Use the Key Water-Efficiency Questions in Box 13 above to identify water-savings opportunities
Often when yoursquore looking for water waste perhaps while using strategies described in the last chapter yoursquoll find easy solutions that can be implemented right away These are good things to address with ldquojust-do-itrdquo Lean activities Just-do-its or ldquoquick winsrdquo are actions that individuals can take immediately to improve a process or operation Many actions to stop water losses (such as fixing leaks or shutting off water that shouldnrsquot be running) or simple equipment adjustments to conserve water (such as reducing water flow) fall in this category
43
Chapter 4 Lean and Water Efficiency Improvement Strategies
Water Efficiency Strategies Ways to reduce water use range from simple strategies such as adjusting the flow of water or install-ing water-saving devices on equipment to more involved options such as reusing water or changing to a low-water or waterless process There are five general types of water-saving strategies (see Fig-ure 15) Consider these strategies as you brainstorm improvement ideas in kaizen events and other Lean efforts Key things to keep in mind include
bull Consider water efficiency improvements in the context of other process improvements and Lean performance goals in order to get the best results
bull Evaluate how the process changes might affect wastewater volume or quality or have other environmental impacts (For example switching from a water-based lubricant to an oil-based lubricant or solvent could have implications for worker health andor the environment)
bull Consider which water-efficiency best management practices and technologies make sense for your facility
bull Adopt visual controls ldquomistake proofrdquo devices on equipment (eg automatic shut offs) andor procedures to help ensure that process changes are effective and can be easily maintained
bull After testing potential solutions making changes and evaluating actual performance be sure to develop or update the standard work for the activity so that workers can eas-ily identify the current best way to perform an activity (Standard work is also further discussed below)
Figure 15 Five Water-Savings Strategies
Mor
e D
ifficu
ltBi
gger
Impa
ct 3 Adjust water flow
3 Modify existing equipment or install water-saving devices
3 Change to more water-efficient equipment
3 Reuse or recycle water (treat if needed)
3 Shift to a low-water or waterless process
When evaluating water reuse opportunities itrsquos important to consider both water quality and water quantity Not all processes need the cleanest highest-quality water In many cases you may be able to reuse the ldquowasterdquo water from one process or operation as an input to another process or for another use at your facility (eg air handling condensate reverse osmosis reject water etc) as long as you match the quality of water needed for its intended use You may need to do some testing
Chapter 4 Lean and Water Efficiency Improvement Strategies
and additional treatment of the process water to make sure it is acceptable for the next use When evaluating the feasibility of using process water for irrigation or other outdoor uses check with your local utility or water pollution control agency about restrictions on water reuse applica-tions The water may require testing to ensure it meets pollutant limits
Waterless Cleaning of GatoraderegBottles (Box 15)
PepsiCo switched from cleaning Gatoradereg bottles with water to a new method of cleaning with purified air The new cleaning process works so well that it is being adopted by bottling facilities around the world achieving a 20 percent reduction in water consumption throughout the process and saving billions of gallons of water
You can use the Table for Evaluating Water Reuse Potential below as a simple guide to identify possible ways to reuse water to meet the water quality and quantity needs of processes You may also want to consider using reclaimed municipal water or water from another facility for certain uses For more information on water reuse strategies consult EPArsquos Guidelines for Water Reuse (wwwepagovnrmrlpubs625r04108625r04108pdf)
Table 6 Table for Evaluating Water Reuse Potential
Process Operation
Water Need Water Discharge
Volume Quality Volume Quality
Cooling
Boilers
Restrooms
Kitchen
Landscape
Process A
Process B
Process C
It may be possible for your facilityrsquos water to be reused by another industry or business Look for these potentially symbiotic relationships with other facilities in order to stretch the value of your water even further for the community
44
45
Chapter 4 Lean and Water Efficiency Improvement Strategies
Integrate Water Efficiency into Everyday Lean Practices A variety of Lean toolsmdashincluding standard work visual controls 5S and total productive main-tenance (TPM)mdashhelp workers identify and eliminate waste in their daily activities as described further below Along with other wastes these Lean tools can reinforce and promote strategies to reduce unnecessary water use
Waste Elimination Culture You can integrate water efficiency into the ldquoculture of Leanrdquo at your facility developing the capac-ity of your employees to identify water waste in their normal work practices and find solutions that help meet your facilityrsquos Lean and water goals When your workers are passionate about improving the way your facility uses water the gains you achieve can become self-sustaining into the future
Lean is built around the framework of eliminating waste and striving for perfection or ldquoTrue Northrdquo as discussed in chapter 1 It is most successful when employees are fully engaged in driv-ing out waste and identifying improvement opportunities In the long run developing people to be effective problem solvers is more important than implementing specific tools It is critical therefore to train employees on how to identify water waste and to encourage and motivate them to work towards your organizationrsquos water efficiency goals The use of goals or targets combined with incentives and support resources can be a powerful way to drive change and performance improve-ment Frito-Layrsquos ldquoGallon per Pound Challengerdquo Program described in Box 16 provides an example of a successful water efficiency program anchored by metrics and employee engagement
Figure 16 Sign to Encourage Water Conservation
46
Chapter 4 Lean and Water Efficiency Improvement Strategies
Frito-Lay Engaging Employees in Water Efficiency (Box 16)
Frito-Layrsquos ldquoGallon per Pound Challengerdquo established a water efficiency pro-gram for all manufacturing sites to exceed 95 percent water use efficiency The program creates a culture of conservation through awareness trainingand accountability
3Through mid-year 2007 the sitesrsquo collective water efficiency has improved to over 80 percent which translates to a reduction in water use of over 1 billion gallons per year
3 Achieving the goal of 95 percent minimum efficiency for all sites will result in an additional water savings of approximately 800 million gallons per year
3 Frito-Lay earned a 2007 Water Efficiency Leader Award from EPA for these water-efficiency efforts
The Challenge is anchored by a water efficiency scorecard which is emailed to a wide array of stakeholders monthly
3Water efficiency is calculated by dividing standard water consumption by the actual water consumption reported by the site If a site uses more water than the standard an efficiency score of less than 100 percent will result
3The scorecard includes monetary savings opportunities for sites operating below 100 percent efficiency as well as savings associated with improve-ments
3Periodically a ldquodid you knowrdquo section with best practices is distributed with the scorecard to help raise awareness
Frito-Layrsquos utility wall program involves an event held at each site each day where a cross-functional team of technicians and workers gather to compare actual water consumption over the prior 24-hours to standard consumption and the sitersquos goals
3Utility walls enable teams to identify excessive water use and develop ac-tion plans to find and correct sources of variance
3Teams identify areas where flow measurement and control devices can drive conservation and ensure that viable water-efficiency projects are com-pleted and working optimally
Standard Work Standard work refers to an agreed-upon set of work procedures (sometimes referred to as standard operating procedures) that establish the best and most reliable method of performing a task or operation Standard work helps sustain previous Lean improvements as well as serves as the founda-tion for future continuous improvement (kaizen) efforts Incorporating water-efficient practices into
47
Chapter 4 Lean and Water Efficiency Improvement Strategies
standard work for processes helps to make them common practice
Whenever you change operational practices to reduce water use or install new equipment that requires different operations be sure to update the standard work for those operations Water-efficiency strategies include both behavior changes and technological changes but even technology-based changes may involve a behavior component For example workers need to properly operate and maintain new water-efficient equipment Use standard work to reinforce desired behaviors
Visual Controls Often used as part of standard work visual controls support standardized procedures and display the status of an activity so every employee can see it and take appropriate action Visual controls make it easier to perform actions the correct way and notice when there are problems
Visual controls are essential for supporting behavior-based water Figure 17 Dual Flush efficiency strategies Examples of visual controls to encourage Toilet Visual Control water efficiency include
bull Signs to encourage employees to use less water
bull Placards on water-using equipment showing proper operation (eg could include optimum water flow level)
bull Water meters or sub-meters on high water using processes or equipment (see discussion in chapter 3)
bull Displays of facility water use and water-use reduc-tion goals on production control boards along with other performance metrics (cost quality timesafety environmental etc)
5S Another way to incorporate water efficiency into Lean is through 5S 5S is a systematic five-step pro-cess used to create and maintain a clean orderly work environment Many organizations add a sixth ldquoSrdquo for safety creating 6S (5S + Safety) The six pillars of 6S consist of
bull Safety (Respect workplace and employee) Create a safe place to work by removing workplace hazards
bull Sort (Get rid of it) Separate items that are not needed in the work area
bull Set in order (Organize) Organize the items that remain in the work area
bull Shine (Clean and solve) Clean and inspect equipment and the work area
48
Chapter 4 Lean and Water Efficiency Improvement Strategies
bull Standardize (Make consistent) Standardize cleaning inspection and safety practices
bull Sustain (Keep it up) Maintain a clean orderly and safe work area
Figure 18 Six Pillars of 6S (5S + Safety)
Source Adapted from Productivity Press Development Team 5S for Operators 5 Pillars of the Visual Workplace Productivity Press 1996
49
Chapter 4 Lean and Water Efficiency Improvement Strategies
One key step that is relevant to reducing water use is ldquoShinerdquo since water is often used in cleaning and rinsing Many industrial and manufacturing businesses use large amounts of water to flush lines rinse parts and tanks and clean equipment floors and other areas These cleaning and rins-ing practices often are large sources of wasteful water use and therefore opportunities for water savings Educate employees on how to do the ldquoShinerdquo step using less water considering some of the Water-Efficient Cleaning Strategies in Box 17 below
Since employees work attentively to maintain a clean and neat work environment in 5S it presents a good opportunity to spot water waste In daily 5S shop floor sweeps encourage employees to check for water leaks in pipes hoses plumbing fixtures and equipment as well as turn off water that shouldnrsquot be running Add checking for leaks to 5S checklists and other approaches implemented under ldquoStandardizerdquo and ldquoSustainrdquo steps so it becomes standard practice
Water considerations are also relevant to ldquoSafetyrdquo Preventing water from being on the shop floor and walkways can eliminate slipping hazards Repairing hot water and steam leaks can prevent burns
Water-Efficient Cleaning Strategies (Box 17)
Dry Clean-up First
3Use brooms brushes squeegees andor other tools to remove materi-als and debris in dry form before using water for secondary cleaning (This saves water reduces wastewater and enables recovery of process materi-als)
Eliminate Unnecessary Water Use for Floor Washing
3 Sweep or use a water broom instead of hosing floors
3 Spot mop if necessary
ldquoMistake-Proofrdquo Your Equipment
3 Use hoses that have automatic shut-off nozzles
3 Use efficient spray nozzles high-pressure washers andor flow restrictors to clean efficiently while reducing water use (High-pressure low-volume sprays generally work better than low-pressure high-volume sprays)
Use Efficient Spray Washing and Rinsing Techniques
3 Use water wisely and turn off water when not in use
3 Do not use a hose as a broom doing so wastes time water and energy
3 Optimize spray and rinsing techniques and document the best practices in the standard work for the process
For more suggestions see North Carolina Department of Environment and Natural Resources ldquoWater Efficiency Manual for Commercial Industrial and Institutional Facilitiesrdquo May 2009 wwwp2paysorgref0100692pdf
50
Chapter 4 Lean and Water Efficiency Improvement Strategies
Total Productive Maintenance As a key strategy for finding and preventing water losses as well as other equipment failures Total Productive Maintenance (TPM) is also relevant to water efficiency TPM is a Lean method that focuses on optimizing the effectiveness of manufacturing equipment TPM focuses on team-based maintenance that involves employees at every level and function
A key practice in TPM is to maintain equipment in a manner that enables workers to quickly iden-tify and correct problems that may result in leaks or spills Since many facility operations use water not just production processes itrsquos important to extend the preventative maintenance practices of TPM to non-production areas (eg restrooms and irrigation) when looking for water issues Box 18 outlines Proactive Maintenance Tips to Reduce Water Use that can be incorporated into a TPM program For more tips and suggestions see EPArsquos ldquoWaterSense at Work Best Management Practices for Commercial and Institutional Facilitiesrdquo available at wwwepagovwatersense
Proactive Maintenance Tips to Reduce Water Use (Box 18)
3Adopt a user-friendly system for reporting water leaks and fix leaksimmediately
3Inspect hot and cold water lines steam lines and traps water-using equip-ment and plumbing fixtures routinely to identify potential problems and keep them operating properly
3When performing maintenance on water-using equipment replace worn parts and check to make sure that water-saving features (eg automatic shut-off valves) are operating properly
3Shut off water supply to equipment in areas that are not in use
Lean and Water Applications for Facility Operations and Support Processes As noted earlier the most water-consuming aspects of your facility may not be production pro-cesses other facility water uses include cooling towers (which are often the largest water end use) boilers support processes restrooms kitchens and irrigation Water balances value stream maps and other strategies in chapter 3 describe how to identify the largest sources of water waste at your facility These represent good targets for kaizen events to reduce water use Consider the Questions to Identify Water-Savings Opportunities in Facility Operations and Support Processes in Box 19 to identify initial opportunities
51
Chapter 4 Lean and Water Efficiency Improvement Strategies
Questions to Identify Water-Savings Opportunities in FacilityOperations and Support Processes (Box 19)
Cleaning
3Can process cleaning or facility cleaning be accomplished without using water (ie using pressurized air to clean products or containers sweeping debris off the floor)
Process Equipment
3Can process equipment reuse water (closed loop) or use reclaimed water from other parts of the facility
Cooling and Heating
3 Has your facility replaced once-through cooling systems with a multi-pass cooling tower or closed systems
3 Can you optimize the blow-downbleed-off controls on boilers and cooling towers
3 Have you considered switching to air-cooled equipment instead of water-cooled equipment
3 Does your facility reuse condensate water
Restrooms and Kitchens
3 Do restrooms have water-efficient fixtures (eg WaterSense labeled toilets and urinals faucet aerators and showerheads)
3 Do kitchens use new water- and energy-efficient dishwashers (eg ENERGY STAR qualified models)
Landscaping and Irrigation
3 Has your facility designed its landscape to consider the local climate and grouped plans by similar watering needs
3 Does your facility use drip irrigation low-flow sprinklers and optimized watering schedules to minimize water use
Leaks
3Have you identified and repaired leaks throughout your facility
Appendix D Water Efficiency Opportunity Checklist is a more extensive checklist for identifying water-savings opportunities throughout your facility
52
Chapter 4 Lean and Water Efficiency Improvement Strategies
Along with the questions in Box 19 and Appendix D a wide array of resources are available that provide information on low-cost water-efficiency measures for common components of facility operations as well as resources that provide guidance and examples relevant to specific industries Consider these water-efficiency strategies in your Lean improvement projects Examples of resources with guidance for specific operations andor industries include
bull ldquoWater Efficiency Manual for Commercial Industrial and Institutional Facilitiesrdquo by the North Carolina Department of Environment and Natural Resources httpsavewaterncorgbushomephp
bull ldquoWaterSmart Guidebookrdquo by the East Bay Municipal Utility District of Oakland California wwwebmudcomfor-customersconservation-rebates-and-services commercialwatersmart-guidebook
bull ldquoWaterSense at Work Best Management Practices for Commercial and Institutional Facilitiesrdquo by EPA Office of Water wwwepagovwatersense
bull ldquoFacility Managerrsquos Guide to Water Managementrdquo by the Arizona Municipal Water Users Association amwuaorgpdfsfacility_managers_guidepdf
See Appendix A for details about these and other water efficiency resources
To Consider
3 What just-do-it actions can you identify to reduce water use
3 What processes or operations would you consider for kaizen events fo-cused on water efficiency
3 What water-reuse options might there be at your facility What steps will you take to learn more about those opportunities
3 What ideas do you have for adding water-efficiency practices into everyday Lean practices (eg through Lean training use of metrics incentive pro-grams standard work visual controls 5S TPM on water-using equipment or other means)
3 What other ideas do you have for reducing water use with Lean or other process improvement efforts
53
CHAPTER 5
Lean and Water Beyond the Factory Floor
Looking beyond your facility operationsmdashsuch as your supply chain interactions with your com-munity and how you design productsmdashcan allow you to uncover new ways to reduce water use and risks while adding value and improving business operating conditions and market opportunities This chapter examines
bull Lean and Water Efforts in Your Supply Chain bull Engaging with the Community bull Lean Product Design
Lean and Water Efforts in Your Supply Chain Depending on your industry sector the greatest opportunities for water use reduction may be in your supply chain rather than your facilityrsquos own operations As discussed in chapter 1 compa-nies whose suppliers have water-intensive operations may feel pressures from customers or other stakeholders to reduce water use within their supply chain It is important for your business to understand water use and risks throughout the value chainmdashincluding upstream in supplier opera-tions and downstream in customer activities In particular the water needed to extract and process raw materials may be significant in some sectors while other stages such as product-use are more important for others
Some water impacts in the supply chain can be addressed by engaging your suppliers in your Lean and water efforts The techniques in this toolkit can be applied at both large and small companies Here are some ideas to get started
bull Ask suppliers about their water use and their water efficiency efforts
bull Invite customers andor suppliers to participate in a Lean and water value stream map-ping event water gemba walk or water kaizen event at your facility to learn from your experience and share their perspectives
bull Offer to participate in your customerrsquos andor supplierrsquos Lean events if your business has relevant expertise
bull Share training materials yoursquove developed best practices and success stories of your Lean and water efforts to educate suppliers on these efforts
bull Invite suppliers to participate in training sessions with your employees For example the furniture manufacturer Steelcase invites its suppliers to attend workshops covering Lean and environment topics at its ldquoSteelcase Universityrdquo
54
Chapter 5 Lean and Water Beyond the Factory Floor
bull Start a dialog with your suppliers about Lean and water projects to initiate together
bull Encourage suppliers to develop and share short- and long-term water reduction goals and report progress against the goals
bull Provide incentives recognition andor financial support for suppliers to conduct Lean and environmental improvement efforts andor for suppliers that help you meet your water efficiency goals
bull Consider focusing first on suppliers that are located in water-scarce areas where reduc-ing water consumption can have the greatest positive impact on community relations
For some smaller companies working with your supply chain may be more challenging than is the case for larger companies One option for smaller facilities is to inform your suppliers that they may access resources available through local utilities such as technology rebates or free or subsidized water audits
Dubois Chemical and Steelcase An Innovative LeanWater Supplier Partnership (Box 20)
Furniture manufacturer Steelcase worked with Dubois Chemical on a demon-stration project exploring an alternative pretreatment washing process on one of Steelcasersquos finishing lines
3The team analyzed the total cost of ownership (for energy labor watersew-age and process chemicals) in the current and future state process maps and relied on water recycling and other strategies to save time energy water and chemicals
Due to the projectrsquos success Steelcase has deployed it on seven powder coat-ing lines Results include
3 Saved $1 million per year
3 Eliminated phosphates from pretreatment discharge
3 Met 2007 emergency water-reduction requirements in Atlanta
3 Reduced water use by 80 percent chemical volume used by 20-30 percent and waste discharged by 85-95 percent
3 Saved 45 million gallons of water per year Sources SteelcaseDubois info from Mary Ellen Mika and Keith Lane ldquoJoint Case Study Reducing Your Water Foot-printrdquo presentation at 23 September 2008 Corporate Climate Response Conference Mary Ellen Mika et al ldquoE3 and GSN Learning Evolving and Expandingrdquo presentation at 2011 Manufacturing Innovations Conference
55
Chapter 5 Lean and Water Beyond the Factory Floor
Some companies participate in Lean supply chain initiatives that focus on environmental objectives such as water use reduction For example in the US Green Suppliers Network Program Lean ser-vice providers at Manufacturing Extension Partnership centers partner with environmental special-ists to deliver ldquoLean and Cleanrdquo process assessments for companies in the supply chains of larger organizations on a fee-for-service basis (see Box 21) The assessments use value stream mapping with an added focus on environmental metrics and costs to identify opportunities for improvements in resource use Many of the assessments include support for implementation A similar program called E3 (Economy Energy and Environment) incorporates Lean environmental and energy technical assistance and also involves local utilities as partners19 Companies should encourage their suppliers to consult their local water and energy utilities to find rebates or incentives for efficient technologies and process improvements
Green Suppliers Network Lean and Water Successes (Box 21)
Southwire and Pacific Gas amp Electric (PGampE)
3 Southwire a manufacturer of wire and cable products and a key supplier of PGampE participated in a Green Suppliers Network review in 2008 at its Car-rollton Georgia plant
3 Based on the value stream map-based review and the teamrsquos recommenda-tions the facility implemented a water-looping system that recycled water without affecting product quality
3 These efforts cut facility water use by more than 9 million gallons (over 90 percent) and saved more than $70000 annually
McNeil PPC and Johnson amp Johnson
3 McNeil-PPC Inc which manufactures Listerinereg products for Johnson amp Johnson participated in a Green Suppliers Network review project in 2007 with the support of Johnson amp Johnson
3 With value stream mapping the team found that 450 gallons of Listerinereg and 60 gallons of water were wasted per line change
3The team recommended solutions to minimize changeover wastes These recommendations have significantly reduced the amount of water that the facility would otherwise use
3With changes such as reusing water for boilers using flavors instead of water to clean equipment sequencing flavors from light to dark switching to waterless conveyor belts and using closed-loop cooling the facility has cut wastewater discharge by 25-30 percent
Sources Green Suppliers Network wwwgreensuppliersgovresultssuccesshtml and information provided by Char-lie Souders Johnson amp JohnsonMcNeil Consumer Healthcare June 29 2011
19 For more information on the Green Suppliers Network see wwwgreensuppliersgov and for more information on the E3 initiative see wwwepagovgreensupplierse3html
56
Chapter 5 Lean and Water Beyond the Factory Floor
Another way that companies can influence supplier actions is through policies and programs that encourage water efficiency Examples include
bull Procter amp Gamble (PampG) has adopted a Supplier Environmental Sustainability Score-card which produces annual supplier sustainability performance ratings for suppliers based on environmental data and qualitative assessments the suppliers provide which include data on water use Suppliers receive higher ratings for contributing to PampGrsquos environmental initiatives and PampG recognizes suppliers receiving the highest rating in the process20
bull PepsiCo has a Supplier Sustainability Outreach Program in which suppliers regularly submit metrics to track their progress toward short-term and long-term goals in energy water and waste efficiency The program prepares suppliers to join ENERGY STAR which is required for all US-based suppliers Suppliers gain access to PepsiCo resourc-es training tools and an invitation to the Global Environmental Sustainability Sum-mit Fuel electricity and water savings from the program totaled $12 million as of the third quarter of 2010 Forty co-packers and suppliers across 102 manufacturing sites participate and the program continues to expand in the United States and globally
bull Levi Strauss amp Co is adjusting its policies to allow more water recycling and reuse at contract finishing facilitiesmdashit now allows reclaimed water to be used at finishing facilities through onsite treatment internal recycling or from a nearby treatment facil-ity Uses for reclaimed water include landscaping toilets and heating ventilation and cooling systems
bull Wal-Mart provided over 100000 suppliers with a sustainability survey to collect infor-mation about their environmental performance The survey includes questions on the total water use of facilities that produce products for Wal-Mart as well as guidelines for conducting a water footprint and improving water efficiency at facilities Future phases of Wal-Martrsquos ldquoSustainability Indexrdquo project include the development of a database of information on product lifecycles and a tool to help merchants and customers under-stand the sustainability of products21
Consider the following five strategies to promote Lean and water efficiency efforts with your suppli-ers keeping in mind that some of these might be less feasible or applicable for small facilities
bull Require reporting from suppliers Requests for reporting on water use and effi-ciency efforts sends a message to supply chain businesses that the company cares about water It may also help you understand business risks and opportunities to assist suppli-ers in reducing water use or risk Benchmarking of water metrics (eg water intensity
20 For more information about PampGrsquos sustainability work with suppliers see wwwpgcomen_USsustainabilityenvironmental_sus-tainabilityoperations_supplierssupplier_engagementshtml
21 For more information on Wal-Martrsquos Sustainability Index see httpwalmartstorescomSustainability9292aspx
57
Chapter 5 Lean and Water Beyond the Factory Floor
ratios that relate water use to production levels) may be useful to set goals and perfor-mance targets Companies can encourage suppliers to utilize ENERGY STARrsquos Portfolio Manager or other tools to track environmental performance
bull Examine product specifications Evaluate how procurement requirements affect the amount of water required to produce or transport the product to facilities Some com-panies may be able to reduce the water used in their supply chains by changing their sourcing specifications
bull Provide recognition awards andor incentives Recognizing supply-chain water and environmental initiatives can raise awareness of and encourage water use reduc-tion and best-practice sharing among suppliers Stories of water-saving efforts may also be of interest to customers
bull Consider supplier requirements It may be appropriate to consider water-related performance in the selection of suppliers particularly in water-intensive parts of your supply chain Performance targets or certification requirements (eg ISO 14001) could also be incorporated into procurement requirements or partnership agreements Consider developing sector-specific standards to reduce overall environmental impacts (eg the Business and Institutional Furniture Manufacturersrsquo Association Sustainability Standard)22
bull Provide subsidize or make referrals for technical assistance Companies can provide technical assistance or training on Lean and water approaches to supply chain partners Alternatively encourage participation of supply chain partners in ldquocommuni-ties of practicerdquo to share information on water efficiency and environmental improve-ment opportunities Manufacturing Extension Partnership centers provide support for Lean training and can help you integrate water efficiency considerations into your sup-ply chain Organizations can also make suppliers aware of water efficiency resources and services available from local utilities and other sources
bull Collaborate on joint Lean and water projects Collaborate with your suppliers and or your customers to develop approaches to reduce water use and risks or to capture new market opportunities Consider using the ideas strategies and tools in this toolkit as a starting point for a discussion about Lean and water opportunities to pursue
22 This standard is available at wwwbifmaorgpublicSusFurnStdhtml
58
Chapter 5 Lean and Water Beyond the Factory Floor
Levi Strauss amp Co and the Better Cotton Initiative (Box 22)
Levi Strauss amp Co completed a third-party lifecycle assessment to understand the environmental impact of an iconic product Levirsquosreg 501reg jeans The com-pany discovered that
3 Forty-nine percent of water consumption for Levirsquosreg 501reg jeans occurs in cotton production while another 45 percent occurs after consumers take the products home
3 The remaining water use is divided among fabric production (2 percent) finishing (3 percent) and retail (1 percent)
Recognizing the importance of the cotton production stage Levi Strauss amp Co joined the Better Cotton Initiative (wwwbettercottonorg) in 2008 to change the way it grew cotton
3 The Better Cotton Initiative seeks to make global cotton production better for the people who produce it better for the environment and better for the apparel sectorrsquos future
3 Pilot projects in countries such as Brazil India Mali and Pakistan work to reduce the environmental impacts from cotton production while supporting local economies
3 In Pakistan participating farms cut water use by over 30 percent 117 bil-lion cubic meters of irrigation water in 2010
Source Levi Strauss amp Co ldquoCEO Water Mandate Communication on Progress 2010rdquo wwwlevistrausscomsites
defaultfileslibrarydocument201012lsco-ceo-water-mandate-cop-2010pdf
Engaging with the Community In many cases water stewardship is a key component of a facilityrsquos ability to operate in a communi-ty Depending on where your facility is located your business and the surrounding community may face different types of water resource challengesmdashsuch as water scarcity infrastructure or pollution concerns Especially in water-scarce regions or during droughts people in the community may have an increased interest in what your facility is doing to reduce its impacts on local water resources Indeed community engagement is recognized as a key pillar of water resource management by the United Nations CEO Water Mandate which assists companies in developing and implement-ing sustainable water policies and practices23 Engaging proactively with your community on water conservation can be an effective way to mitigate water-related business risks as well as reduce your organizationrsquos overall water footprint
23 The UN CEO Water Mandate is available at wwwunglobalcompactorgIssuesEnvironmentCEO_Water_Mandate
59
Chapter 5 Lean and Water Beyond the Factory Floor
Two key strategies for effective community engagement include
bull Educate and engage your employees in water-efficiency efforts at your facility and encourage them to adopt similar practices at home (eg check for leaks use efficient appliances and faucets turn off water when not in use etc) Build the capacity of employees to spot water waste and problem solve throughout their daily activities on the job and off
bull Partner with community members and local organizations to conduct projects that improve water use water quality andor water infrastructure resources in the com-munity Consider using Lean methodsmdashsuch as a waste walk kaizen event or even a Lean design eventmdashto rapidly brainstorm and test improvement ideas for projects and include community stakeholders in those efforts
Along with the value of community engagement these strategies can have the benefit of partially or fully ldquooffsettingrdquo impacts the facility may have on local water resources That is a facility can sup-port efforts that replenish the local water supply by at least the amount of water the business uses directly In India PepsiCo has achieved a positive net water balance in this way (see Box 23)
PepsiCorsquos Positive Water Balance Project in India (Box 23)
At its facilities in India PepsiCo achieved a ldquopositive water balancerdquomdashwhere businesses contributed more water to the communities than they consumedmdash in 2009 and 2010
3 Savings of over 3 billion liters of water in 2009 and over 4 billion liters in 2010 have been verified externally by Deloitte LLP
As part of these efforts PepsiCo India has
3 Reduced water usage in manufacturing by 45 percent since 2005
3 Partnered with government agencies and local organizations to increase peoplersquos access to clean water
3 Worked with agricultural universities to promote ldquodirect seedingrdquo of rice paddies which allows seeds to be directly planted into the soil (without the need for a nursery) and avoids the need for flood irrigation (This reduces water use by up to 30 percent)
3 Saved over 5 billion liters of water from 6500 acres of direct-seeded paddy fields
3 In 2010 PepsiCo began working with the Nature Conservancy to explore ways to credibly achieve a positive water impact across its global operations
Source PepsiCo ldquoReplenishing Water Conserving the worldrsquos most precious asset Waterrdquo httppepsicoindiacoin
purposeenvironmental-sustainabilityreplenishing-waterhtml accessed 28 July 2011
60
Chapter 5 Lean and Water Beyond the Factory Floor
Businesses can use Lean tools to engage with communities in collaborative problem solving to achieve social economic and environmental goals such as water efficiency For example DTE Energymdasha Detroit Michigan based electric utilitymdashhas used tools including gemba walks value stream maps and ldquocritical-to-sustainabilityrdquo trees (a modification of ldquocritical-to-qualityrdquo trees) with Detroit area businesses and community members to tackle the following projects
bull Partnered with a non-profit to manage combined sewer overflows by planting thou-sands of trees to reduce the stormwater runoff in Detroit
bull Found a new use for the buffer land around substations as community gardens with thousands of pounds of produce harvested at each substation and donated to food pantries
bull Created a community-supported agriculture business model based on a gemba walk with the community that identified issues such as urban blight meaningful work neighborhood connectivity and healthy living
In areas where water scarcity and drought are issues facilities can engage with communities to share knowledge work toward solutions and build goodwill Here are two examples of companies who engaged in collaborative dialogue with their communities in response to problems with water scarcity in areas where their operations were located
bull Coca-Cola partnered with the United Nations Development Programme and Chinese government representatives to improve water efficiency in response to a severe drought threatening sugarcane growers The first phase will be completed in 2011 and will focus on improving infrastructural facilities that support the farmersrsquo work and life directly such as optimizing irrigation facilities and recycling treated wastewater from sugar plants to improve farm production and water use efficiency This first phase will provide approximately 500 million liters of water to rural residents and directly benefit 100000 rural sugarcane farmers in the region In future phases this collaboration will pursue improvements in water efficiency in business operations and will seek to ease pressure on local water supplies through continuing community water partnerships24
bull The chemical manufacturer Sasol identified water scarcity as a risk to its operations in South Africa and pro-actively approached the problem by organizing a joint dialogue with community stakeholders representatives of water-intensive industries in South Africa government and non-governmental institutions and local research institutions The dialogue promoted cooperation among the stakeholders and between Sasol and its surrounding community as the sharing of knowledge and experiences coalesced toward the formulation of several ideas for collective action toward improved water efficiency25
24 For more information about Coca-Colarsquos work with sugarcane growers in China see wwwthecoca-colacompanycomdynamic bullpress_center201103chinas-sustainable-sugarcane-initiativehtml
25 For more information see httpsasolsdrinvestoreportscomsasol_sdr_2008page_id=141
61
Chapter 5 Lean and Water Beyond the Factory Floor
Lean Product Design Lean design methods are a group of Lean tools and techniques that aim to
bull Design (or redesign) high-quality products that meet customer needs with the least amount of waste (aspects that do not add value) andor
bull Design (or redesign) processes and equipment that add value to products using the least amount of time material and capital resources
Taking a close look at the parts and processes that go into the creation of a product can help you to identify wastes including water waste and improve product quality reduce costs and potentially gain market advantage
Lean product design methods often rely on a set of criteria to evaluate the best alternatives Incor-porating efficient water use as a design criterion for product development can reduce water waste throughout the entire life cycle of the product Consider raw materials synthesis production customer use and the ultimate disposal or recyclingremanufacturing of the product when consid-ering water use
As with other aspects of Lean implementation product design is most effective when it incorporates ldquowhole systemsrdquo thinking focused on eliminating all forms of waste Be sure to consider traditional Lean goals for both the product and the manufacturing process such as product quality customer service cost and time when you incorporate water efficiency into the Lean product design pro-cess Improving water efficiency should not mean lowering the quality of your finished product or decreasing the productivity of your facility Note that sometimes design alternatives that improve water efficiency can present trade-offs in which decreasing water use results in increased en-ergy or chemical use such endeavors may not be worthwhile depending on the overall impacts You can help ensure that your product quality remains high by adhering to product quality design standards such as the US Green Building Councilrsquos LEED standards for buildings26 EPArsquos Water-Sense program standards for certain water-consuming products and appliances27 and sector-specific product standards
There are several Lean tools to help design (or redesign) a product in a way that reduces wastes Some of these tools are described in Table 7 below For more information about these tools and an explanation of which tools to use in various product design stages see chapter 6 of The Lean and Chemicals Toolkit28
26 The US Green Building Councilrsquos Leadership in Energy and Environmental Design (LEED) standards are available at wwwusgbc orgDisplayPageaspxCategoryID=19
27 For more information about the US EPA WaterSense Program see wwwepagovWaterSense 28 Available at wwwepagovleanenvironmenttoolkitschemicals
Chapter 5 Lean and Water Beyond the Factory Floor
Table 7 Methods Used in Lean Design29
Method Description
3P (Production Preparation Process or Pre-Production Planning)
An integrated and highly detailed approach to product andor process development which involves rapidly designing production processes and equipment to ensure capability built-in qual-ity productivity and flow 3P minimizes resource needs such as capital tooling space inventory and time
Design for Lean Six A method for designing processes that support Sigma Lean Six Sigma objectives such as reduced vari-
ability to improve yield reduce waste and accel-erate time-to-market
Design for Manufacturing amp Assembly
A simultaneous engineering process designed to optimize the relationship between design func-tion manufacturability and ease of assembly
Failure Mode amp Effects A design review methodology that focuses on Analysis identifying the potential failure modes of a prod-
uct and subsequently determining ways to miti-gate each risk of failure
Quality Function Deployment andldquoVoice of the Customerrdquo
An overall methodology that begins in the design process and attempts to map the customer-defined expectations and definition of quality into the processes and parameters that will fulfill them It integrates customer interview and market research techniques with internal cross-functional evaluations of the requirements
Value Engineering An organized methodology that identifies and selects the lowest lifecycle cost options in de-sign materials and processes that achieves the desired level of performance reliability and cus-tomer satisfaction It seeks to eliminate unneces-sary costs in the above areas and is often a joint effort with cross-functional internal teams and relevant suppliers
29 For additional information about many of these tools see Mascitelli Ronald The Lean Design Guidebook Technology Perspective Northridge CA 2004 See also EPArsquos webpage on 3P wwwepagovleanthinkingthreephtm
62
Chapter 5 Lean and Water Beyond the Factory Floor
Table 8 lists examples of questions to ask when evaluating product design alternatives to identify ways to reduce water waste during all phases of the product life cycle
Table 8 Questions to Ask During Lean Product Design
Life Cycle Phase Questions to Ask
Sourcing Materials 3 Will raw material production prior to manufacture and Inputs involve intensive use of water
3 Can you switch to materials that require less water in their production or work with suppliers to reduce water use
Production 3 Will water be used to manufacture the product Manufacturing Evaluate all new equipment and modifications
3 What steps can be taken to reduce the amount of water that will be used to manufacture the product (eg switch to water-less processes reuse water etc)
3 How can you design products to reuse water in multiple process steps (eg recovering rinses from cleaning counter-current flow or refiltering water)
Product Distribution 3 How much water will the product require during Use and Disposition use
3 What product design alternatives use less water (eg through reuse systems water-efficient fea-tures etc)
3 What steps can you take to ensure that product performance is maintained as you implement water efficiency improvements
3 How will the product design affect customer water use Can reductions in the product use phase be guaranteed
3 How can the design ensure customers will be satis-fied with product performance even with reduced water use
Some companies report that the ldquoseven waysrdquo method provides a useful means to identify a more diverse creative set of improvement options to address specific water-related needs This method is often used in the Lean design process This method typically involves brainstorming of seven alter-native approaches for addressing a specific improvement opportunity Sometimes teams are encour-
63
64
Chapter 5 Lean and Water Beyond the Factory Floor
aged to look at how similar tasks are accomplished in the natural world to spark creative thinking on alternatives The team then scores the seven alternatives using pre-established weighted criteria to select the preferred solution Consider incorporating water efficiency into these criteria (water used to manufacture andor full life-cycle water use) to ensure that product design alternatives are evaluated according to your Lean and water efficiency goals
Examples of Water Conservation through Product Design (Box 24)
GE used the 3P (Production Preparation Process) Lean strategy to launch a new water-saving product line
3Geospringtrade hybrid water heaters dishwashers and top-loading washing machines are being redesigned from scratch using Lean manufacturing techniques
3Production team members from engineers to technicians now work together in a cross-functional approach that involves everyone from design through production using scaled-down equipment and product mockups to visualize improvements
3This hands-on whole-team approach has allowed employees to make ad-justments in real-time allowing problems to be identified early and produc-ing dramatically simpler designs that cut total product development time
Levi Strauss amp Co examined the design of its popular blue jeans to identify ways to reduce the water used to manufacture the product
3 WaterltLesstrade jeans reduce water consumption by an average of 28 per-cent and up to 96 percent for some new products
3These water savings were accomplished by reducing washing cycles incor-porating ozone processing into washing and removing water from stone washing
3While the production of Levirsquosreg blue jeans like many products uses a sig-nificant amount of water in the supply chain as well as through consumer end use the company made significant progress by addressing water use in the manufacturing process
As described earlier in this chapter there is great potential for water savings throughout a productrsquos supply chain including the acquisition of resources and raw materials as well as the water that customers will use with the product or service However if you are just getting started with Lean consider focusing first on water use within your facility before branching into your supply chain and customer-use considerations
65
Chapter 5 Lean and Water Beyond the Factory Floor
To Consider
3What parts of the extended value chain of your enterprise use the most water If you donrsquot know how will you find out
3Have you talked with any of your suppliers about Lean and environmental improvement efforts
3What opportunities are there to offset water impacts and improve water resources for the local community
3What changes could you make to the design of your products to reduce water wastes
Lean and Water Toolkit
67
CHAPTER 6
Conclusion
This chapter includes the following sections bull Your Lean and Water Journey bull Concluding Thoughts
Your Lean and Water Journey We hope that this toolkit has provided you with practical ideas to leverage Lean methods to identify and eliminate water waste at your facility Learning to see water waste and to identify improvement opportunities using Lean tools will help you to save money and be a better partner to your com-munity by placing less of a burden on local water supply There are many tools and techniques to get started with using Lean to reduce water waste As described in more detail in chapter 1 here are three ways to get started with Lean and water efforts
bull Learn more about how your facility uses water Connect with environment and facilities personnel to discuss opportunities to reduce water waste with Lean Find water waste in your facility using tools like metering and water balances
bull Engage employees in lean and water improvement efforts Involve employees in teams to brainstorm ways to reduce water use encouraging their ideas to innovate improvement opportunities Try out some of the strategies for eliminating water waste that are described in this toolkit
bull Connect Lean and water efforts to sustainable water management strategies Use Lean tools to support a broader corporate water sustainability strategy Identify what the ldquoTrue Northrdquo goals and targets are for water use at your facility and track progress to inspire improvement and creative solutions Look beyond direct operations to engage your customers suppliers and communities
Many of the techniques in this toolkit can help you reduce water waste and identify savings rapidly however it is important to think about the bigger picture of how water is used across your organiza-tion Figure 2 repeated below from chapter 1 illustrates how the tools and techniques described in this toolkit can help you to address water use throughout your value chain
68
Chapter 6 Conclusion
Figure 2 Lean and Water Implementation Strategies
Understand Water Uses and Costs (Chapter 2)
Find Water Waste (Chapter 3)
Improve Operations and Processes with Lean and Water Strategies (Chapter 4)
Extend Lean and Water Efforts Throughout the Value Chain (Chapter 5)
Sourcing Materials and Inputs (Chapter5)
Production Manufacturing (Chapters 3 and 4)
Product Distribution Use and Disposition (Chapter 5)
Concluding Thoughts We hope this toolkit spurs creative thinking and energy within your organization and encourages you to explore these opportunities We aim to periodically release new versions of resources in EPArsquos Lean and Environment Toolkit series while working with partner companies and organizations to explore ways to improve efficiency using Lean We also hope to learn from your experiences using this toolkit Our goal is to refine the techniques presented provide examples and case studies to il-lustrate the possible benefits of these tools and present new techniques as they emerge We wish you success on your Lean and water journey
Your Thoughts on the Toolkit
Now that you have finished this toolkit reflect on what you read by answering these questions
3 What strategies and tools in the toolkit seemed particularly interesting Which ones were most applicable to your facility
3 What steps will you take next to advance Lean and water efforts at your facility
3 What other information and tools would help your organization to achieve your Lean and water goals
69
APPENDICES
Appendix A Water Efficiency Resources and Technical Assistance Providers This appendix describes resources and places to go for more information concerning the following topics
bull Water Conservation and Efficiency Resources bull Technical Assistance Providers
This appendix focuses on resources that are directly applicable to manufacturing and industrial facilities however some resources and tools may have broader relevance and contain information that will be useful to commercial institutional and residential water users as well as industrial water users
Water Efficiency and Conservation Resources At the Crest of a Wave A Proactive Approach to Corporate Water Strategy Pacific Institute wwwpacinstorgreportscrest_of_a_wave Making the case that businesses and industrial facilities must prepare for water trends this guide helps users to design and implement a two-stage water conservation strategy Case studies and success stories include those from companies such as Unilever Nestleacute Toyota General Motors Anheuser-Busch GE Proctor amp Gamble and more The steps presented help corporations to create a comprehensive approach to managing water risks and opportunities
Collecting the Drops A Water Sustainability Plannertrade Global Environmental Management Initiative (GEMI) wwwgemiorgwaterplanner This web-based tool and downloadable document provides step-by-step guidance and resources to help facilities conduct assessments of their water use and impacts on the water supply Facilities can then use this information to develop water sustainability strategies create action plans and take actions to improve water resource management in their operations and community The planner includes case examples of how GEMI member companies have engaged internal and external stake-holders and generated actions to improve water resource management and conservation Modules include
bull Module 1 Facility Water Use and Impact Assessment Program bull Module 2 Water Management Risk Assessment Questionnaire bull Module 3 Case Examples and Links
70
Appendix A Water Efficiency Resources and Technical Assistance Providers
Commercial Institutional and Industrial (CII) Water Users Manufacturing Introduction Alliance for Water Efficiency wwwallianceforwaterefficiencyorgManufacturing_Introductionaspx The Alliance for Water Efficiency Resource Library webpages offer information on CII water use and efficiency opportunities as well as links to the research and information about this end user catego-ry In manufacturing major uses and topics include cooling water process water steam generation and boilers sanitation irrigation food services and housekeeping The resource briefly discusses the need for and value of water audits for facilities and applying the strategies of reduce reuse and recycle for facility water consumption
Connecting the Drops Toward Creative Water Strategies A Water Sustainability Tooltrade GEMI wwwgemiorgwater This tool presents the business case for water efficiency and provides guidance and case studies on water assessment opportunity identification planning and implementation Five core analytic modules comprise a roadmap to help facilities identify specific steps that they can take to reduce their water use
bull Module 1 Water Use Impact and Source Assessment bull Module 2 Business Risk Assessment bull Module 3 Business Opportunity Assessment bull Module 4 Strategic Direction and Goal Setting bull Module 5 Strategy Development and Implementation
Cooling Towers Water Use Washington State Department of Ecology wwwecywagovtreeequipCThtml Cooling towers are a significant area of water use for many facilities and taking steps to assess and reduce water use in cooling towers can substantially lower a facilityrsquos overall water footprint The Washington State Department of Ecologyrsquos Technical Resources for Engineering Efficiency (TREE) Team created this succinct checklist of conservation suggestions questions to ask during a water use evaluation and suggested data to collect to identify opportunities for water savings from cooling towers
ENERGY STAR Portfolio Manager US Department of Energy and US Environmental Protection Agency wwwenergystargovindexcfmc=evaluate_performancebus_portfoliomanager This tool allows users to track and access information about their facilityrsquos water consumption inad-dition to data about energy consumption Water and energy use and cost data can be managed across multiple facilities in a secure online interface The tool allows you to track multiple water meters for each facility identify meters with customized names and key information benchmark your facili-ties relative to past performance monitor costs and share data with others inside or outside of your organization By tracking energy and water metrics across facilities users can identify opportunities for efficiency improvements and can receive EPA recognition for superior performance
71
Appendix A Water Efficiency Resources and Technical Assistance Providers
Facility Managerrsquos Guide to Water Management Arizona Municipal Water Users Association httpamwuaorgpdfsfacility_managers_guidepdf This guide is intended to help commercial industrial and institutional facilities to identify areas to improve water use efficiency within reasonable economic parameters The guide provides a step-by-step resource for creating a water management plan and includes worksheets on topics such as water consumption history and estimated water balances Several water end uses and options for reducing them are discussed including domestic water use cooling and heating systems landscape water uses and kitchen uses The guide provides planning and policy-setting options water man-agement options and guidance for empowering employees to effect changes to reduce water use
Federal Water Efficiency Best Management Practices US Department of Energy www1eereenergygovfempprogramwaterefficiency_bmphtml The Federal Energy Management Program developed Federal Water Efficiency Best Management Practices in response to an Executive Order requiring federal agencies to find cost-effective ways to reduce their water use in coordination with EPArsquos WaterSense Program Toward the goal of reduc-ing industrial landscaping and agricultural volumetric water consumption by 20 percent by 2020 (relative to a 2010 baseline) FEMP provides best practices for water management planning infor-mation and education programs water auditing and leak detection and reducing water in several end uses including
bull Boilers and steam systems bull Cooling towers bull Water-efficient irrigation bull Single-pass cooling equipment bull Toilets urinals faucets and showerheads
GEMI Local Water Tooltrade GEMI wwwgemiorgGEMIInteractiveToolsaspx By spring 2012 GEMI plans to release a new tool the GEMI Local Water Tooltrade which will be an interactive downloadable module that will help companies evaluate specific sites for water impacts and risks in order to devise site-specific sustainable water management strategies This tool is de-signed to complement the Global Water Tool (described below) which can help a company identify and prioritize risks to its competitive position based on the link between its operations and the external water landscape Companies can then employ the Local Water Tool to further evaluate the high water-risk locations and plan actions to manage those risks
Global Water Tool World Business Council for Sustainable Development wwwwbcsdorgpagesedocumentedocumentdetailsaspxid=221ampnosearchcontextkey=true In order for a facility to manage current and future risks related to its water use the Global Water Tool helps users map their water use and assess risks related to their global operations comparing water needs to local conditions The tool helps calculate water consumption and efficiency compar-ing water consumption data through time to help assess improvements and monitor progress
72
Appendix A Water Efficiency Resources and Technical Assistance Providers
Making Every Drop Work Increasing Water Efficiency in Californiarsquos Commercial In-dustrial and Institutional (CII) Sector National Resource Defense Council wwwnrdcorgwatercacii This guide provides practical suggestions for commercial industrial and institutional facilities to increase their water efficiency Both small-scale concrete steps to take and suggested higher-level strategic approaches toward water efficiency are described The guide includes a list and descrip-tions of available technologies for reducing water consumption by a variety of common end uses
Performing a Business or Industry Water Use and Conservation Audit New Hampshire Department of Environmental Services wwwdesstatenhusorganizationcommissionerpipfactsheetsdwgbdocumentsdwgb-26-16pdf This factsheet provides a short set of steps to audit water use in a business or industrial facility analyze feasibility of conservation measures and develop a conservation plan
Solutions for Sustainable Water Savings ndash A Guide to Water Efficiency General Electric Water amp Process Technologies wwwgewatercomwater_efficiencyindexjsp This guide provides a practical framework for site managers corporate officers engineering firms and water saving advocates to develop a water efficiency objective and meet this objective by ap-plying a variety of tools and metrics The manual covers baseline water footprinting identifying efficiency opportunities optimizing implementing and measuring
Waste Not Want Not The Potential for Urban Water Conservation in California Pacific Institute wwwpacinstorgreportsurban_usage This report presents a comprehensive assessment of water use and conservation potential in the state of California including industrial water use as well as commercial institutional and resi-dential It includes benchmarking data on water use for many industry sectors a description of the methodology for estimating cost and water savings from water conservation strategies and informa-tion on cost-effectiveness of various water conservation and efficiency improvements
A Water Conservation Guide for Commercial Industrial and Institutional Users New Mexico Office of the State Engineer wwwosestatenmuswater-infoconservationpdf-manualscii-users-guidepdf This guide presents the business case for water efficiency offers programmatic steps conservation strategies for indoor and outdoor use and process-specific and mechanical systems and illustrates potential opportunities with fifteen individual case studies
Water Efficiency Manual for Commercial Industrial and Institutional Facilities North Carolina Department of Environment and Natural Resources httpsavewaterncorgbushomephp This comprehensive manual provides sound principles of water conservation strategies for conduct-ing a successful water efficiency program auditing tools water management options and examples
73
Appendix A Water Efficiency Resources and Technical Assistance Providers
for three industry-specific processes textiles food and beverage and metal finishing Practical tools in the guide include assessment checklists step-by-step instructions for conducting a successful wa-ter efficiency program and explanations of approaches such as water balancing The manual details water management options for several common end uses including
bull Sanitary and Domestic Uses bull Cooling and Heating bull Boilers bull Kitchen and Food Preparation bull Commercial Laundries bull Cleaning Rinsing and In-process Reuse bull Reuse and Reclamation bull Landscaping
Water Efficient Equipment and Design A Guide for Non-Residential Construction and Development Austin Water Utility Water Conservation Division wwwallianceforwaterefficiencyorgWorkArealinkitaspxLinkIdentifier=idampItemID=1018 Equipment and design practices for the construction of new industrial and commercial facilities help to build lifecycle water savings into the design of these buildings Major renovations to exist-ing facilities as well as new construction should be undertaken with a careful assessment of ways to reduce the facilityrsquos lifetime water use This guide provides general guiding principles to ensure that facilities are constructed to maximize water conservation and efficiency as well as specific steps and guidelines to follow in all steps of design and construction
Water Footprint Manual Water Footprint Network wwwwaterfootprintorgpage=fileshome This guide provides a thorough description of the practice of water footprinting including practical steps for estimating a water footprint and instructions for assessing the difference between a direct and indirect water footprint This comprehensive guide to water footprinting instructs readers on estimating the footprint of a product as well as that of a business
WaterSense at Work Best Management Practices for Commercial and Institutional Fa-cilities US Environmental Protection Agency wwwepagovWaterSense The WaterSense Best Management Practices which EPArsquos Office of Water developed in coordination with the Federal Energy Management Program are a comprehensive set of recommendations and tips for how commercial and institutional facilities can improve their water efficiency EPArsquos Water-Sense Program helps water consumers identify best practices resources and tools to reduce their water use Commercial and institutional water users can take advantage of lists of water-efficient products to install in their facilities best management practices and other ways to improve water efficiency
74
Appendix A Water Efficiency Resources and Technical Assistance Providers
WaterSmart Guidebook East Bay Municipal Utility District Oakland California wwwebmudcomfor-customersconservation-rebates-and-servicescommercial watersmart-guidebook This extensive guidebook provides information on water-saving technologies currently available to commercial industrial and institutional businesses as well as specific water efficiency strategies and tips for different business types such as paper manufacturing and metal finishing Many water-using technologies such as process water are explored to show the areas in which the most water is used and where it can be saved
Technical Assistance Providers
Water Utility Incentive Programs Many utilities and local governments offer incentive programs to water utility customers to encour-age the efficiency of water use in the industrial commercial and institutional sectors Common approaches include a combination of water audits and rebates to help facilities realize water sav-ings Check with your local utility to see what incentives may be available Some notable programs include those sponsored by the following utilities and localities all of which saw significant reduc-tions of water use by facilities that they serve
bull City of Austin and Austin Water Utility wwwciaustintxuswaterconservation
bull Denver Water wwwdenverwaterorgConservationIncentivePrograms
bull East Bay Municipal Utilities District wwwebmudcomfor-customersfor-commercial-customerscommercial-conservation-rebates-and-services
bull Massachusetts Water Resources Authority wwwmwrastatemauscomsupportwaterconservationmainhtm
bull Metropolitan Water District of Southern California httpwwwbewaterwisecomicphtml
bull City of Phoenix phoenixgovwaterserviceswrcindexhtml
bull City of San Jose Environmental Services Department wwwsanjosecagovesdwater-conservationdefaultasp
bull Seattle Public Utilities wwwseattlegovutilServicesWaterFor_Commercial_CustomersWATER-CONS_200311261707523asp
75
Appendix A Water Efficiency Resources and Technical Assistance Providers
National Institute of Standards and Technology Hollings Manufacturing Extension Partnership wwwnistgovmep The National Institute of Standards and Technology (NIST) Hollings Manufacturing Extension Part-nership (MEP) is a network of manufacturing assistance centers that provide Lean manufacturing training Lean event facilitation and other services to small-to-medium sized businesses to make them more competitive Many MEP centers have experience providing integrated Lean and environ-mental services to businesses or have partnerships with environmental agencies to offer Lean and environment services
Pollution Prevention Resource Exchange (P2Rx) Consortium wwwp2rxorg The Pollution Prevention Resource Exchange (P2Rxtrade) is a consortium of regional pollution prevention information centers in the United States funded in part through grants from EPA These centers all provide pollution prevention information networking opportunities and technical assis-tance services to state agencies local governments businesses and technical assistance providers in their region Regional centers and contact information can be found on the P2Rxtrade website along with their collective information resources on Lean water efficiency and other topics
Appendix B Water Cost Calculator You can use this table to calculate costs associated with water use at your facility Write down the appropriate volumes units and unit costs and multiply volume by unit cost to find the dol-lars spent on each cost area Add these costs to find the total cost Note Unit costs for water may varydepending on the season andor based on water use (eg peak surcharges may apply above a certain level)30
Factor
Costs to Consider (Excluding Labor amp Maintenance
Costs)
Examples Description Vo
lum
e
Uni
ts(g
allo
ns)
Uni
t Cos
t ($
per
gal
lon)
Tota
l Cos
t (d
olla
rs)
Sup
ply
Base Purchase Price
Utility (eg 10 cents per gallon)
$ $
Peak Package Demand
(eg additional 1 cent per gallon for water supply over 10000 gallons)
$ $
Pumping costs (if self supplied)
Well-sourced $ $
Purchase of pre-treated water
Deionized dealkylized ultra-pure softened
$ $
Coo
ling
Energy Power to chillers towers etc re-ducing heat load of wastewater prior to release
$ $
Chemical For towers chill-ers coolants
$ $
30 Several resource tracking tools that may also be relevant These include Energy amp Materials Flow amp Cost Tracker from the North-east Waste Management Officialsrsquo Association wwwnewmoaorgpreventionemfact Water Conservation Tracking Tool (for water utilities) from Alliance for Water Efficiency wwwallianceforwaterefficiencyorgTracking-Toolaspx and Portfolio Manager (for energy and water use) from the ENERGY STAR Program wwwenergystargov
Total cost of water use should also include labor associated with operations maintenance accounting and legal associated with all items listed
76
Appendix B Water Cost Calculator
Factor
Costs to Consider (Excluding Labor amp Maintenance
Costs)
Examples Description Vo
lum
e
Uni
ts(g
allo
ns)
Uni
t Cos
t ($
per
gal
lon)
Tota
l Cos
t (d
olla
rs)
Trea
tmen
t(O
nsit
e)
Treatment chemicals
Softening de-alkalyzed
$ $
Filters mem-branes carbon
Purified deionized $ $
Sludge disposal Filtration $ $
Filter disposal Solid waste $ $
Was
tew
ater
Trea
tmen
t
Pretreatment chemicals
Neutralizers flocculants etc
$ $
Pretreatment energy
Evaporation Treatment plant operation
$ $
Sampling and testing kits (consumables)
pH TSS BOD COD
$ $
Was
tew
ater
Dis
posa
l
Sewer rate Utility $ $
Surcharges for pollutant exceeding
$
Permitting Permit renewals $
Septic system maintenance
$ $
Condensate or wastewater disposal if not sewered
$ $
Sludge disposal $ $
Total cost of water use should also include labor associated with operations maintenance accounting and legal associated with all items listed
77
Appendix B Water Cost Calculator
Factor
Costs to Consider (Excluding Labor amp Maintenance
Costs)
Examples Description Vo
lum
e
Uni
ts(g
allo
ns)
Uni
t Cos
t ($
per
gal
lon)
Tota
l Cos
t (d
olla
rs)
sses
Evaporative Cost of make-up water
$ $
Leaks Cost of make-up water
$ $
Treatment or Irrigation or $ $
Lo stormwater vehiclebuilding management washing runoff of runoff from exterior use of supplied water
Production $ $
Oth
er
process water use costs other facility costs
TOTAL $ $
Total cost of water use should also include labor associated with operations maintenance accounting and legal associated with all items listed
See Appendix C ldquoWater Unit Conversions and Calculationsrdquo for guidelines on calculating leak losses
78
Appendix C Water Unit Conversions and Calculations This appendix provides reference material on water unit conversions as well as guidance for esti-mating water use and potential water and cost savings
Water Unit Conversions31
Volume Unit Conversions
Units
Equivalent
Liters (lL)
Gallons (gal)
Cubic Feet (ft3)
Cubic Meters (m3)
Acre-Feet (ac-ft)
Liters 1 02642 3531 x 10-2 00001 8106 x 10-7
Gallons 3785 1 01337 3785 x 10-3 3068 x 10-6
Cubic Feet 2832 7481 1 2832 x 10-3 2296 x 10-5
Cubic Meters 1000 2642 3531 1 8106 x 10-4
Acre-Feet 1233 x 106 3259 x 105 4356 x 104 1233 1
Flow RateDischarge Unit Conversions
Units
Equivalent
Gallons per Minute
(gpm)
Liters per Second (Ls)
Acre-Feet per Day
(ac-ftday)
Cubic Feet per Second
(ft3s)
Cubic Meters per Day
(m3day)
Gallons per Minute
1 6309 x 10-2 4419 x 10-3 2228 x 10-3 545
Liters per Second
1585 1 7005 x 10-2
3351 x 10-2 864
Acre-Feet per Day
2263 1428 1 05042 1234
Cubic Feet per Second
4488 2832 1983 1 2447
Cubic Meters per Day
1369 x 109 864 x 107 6051 x 106 3051 x 106 1
31 GEMI ldquoUnit Conversionsrdquo Collecting the Drops A Water Sustainability PlannerTM available at wwwgemiorgwaterplannerunit-conversionhtm
79
80
Appendix C Water Unit Conversions and Calculations
Calculations and ldquoRules of Thumbrdquo for Estimating Water Use32
Use these guidelines and calculations to estimate water use in your facility The information in this section draws primarily from GEMIrsquos Collecting the Drops A Water Sustainability Plannertrade available at wwwgemiorgwaterplanner
Cooling Tower Usage
Cooling Tower Water Usage Calculations
Tower Evaporation Rate
C x ∆T1000
C = tower recirculation rate in the units of pounds of water
per minute
T = temperature difference across the cooling tower in
degrees Fahrenheit
Cooling Tower Blow Down Rate
[Windage Rate x (Cycles of Concentration -1) -
Tower Evaporation Rate] (1- Cycles of Concentration)
Cycles of Concentration = conductivity or chloride level
in the cooling tower blow-downconductivity or chloride
level in the cooling tower makeup water
bull Windage Loss from Cooling Towers (Water Lost from Friction Between Wind and the Surface of the Water in Cooling Towers)
bull Commonly 01 to 03 of the Recirculation Rate
bull The tower recirculation rate can be obtained from the manufacturerrsquos literature andor head versus flow curve for the pump
Cooling Tower Usage
Boiler Water Usage Calculations
Boiler Make Up Boiler Steam Rate - Condensate Return + Boiler Blow Down
Boiler Blow Down Range of 4 to 8 of Boiler Makeup
Sanitary Water Usage
bull 10ndash25 gallons per person per shift in industrial settings (based on estimates in GEMIrsquos Collecting the Drops A Water Sustainability Plannertrade 2007)
bull The lower value is used where there are just toilets A higher value is used where there are toilets showers and full kitchen services (that is food preparation and dish washing)
32 ldquoCalculationsrdquo and ldquoRules of Thumbrdquo from GEMI Collecting the Drops A Water Sustainability PlannerTM available at wwwgemi orgwaterplannercalculationshtm and wwwgemiorgwaterplannerrules-of-thumbhtm
81
Appendix C Water Unit Conversions and Calculations
bull 20-35 gallons per employee per day for domestic demands (not including kitchens) in commercialindustrial settings (based on estimates in the North Carolina Water Effi-ciency Manual 200933)
bull Savings of 25-35 percent in this domestic usage are readily achievable
Irrigation Usage
bull Number of sprinkler heads x the flow capacity per head (eg 25 gpm x the duration [minutes] of water application)
bull Inspect the irrigation system during operation to determine if there are leaks from broken sprinkler heads and from water distribution lines
Wastewater Streams from Water Treatment Operations
bull Reverse Osmosis Reject Flow
bull Reject stream generally ranges from 10 to 50 of the feed to the system depending on the salinity and the desired purity
bull Reject flow can be higher than the indicated range Reverse osmosis reject streams can be used as cooling tower makeup if the water is softened prior to the reverse osmosis system
Other Uses
bull Slab Washing
bull 5 galmin for each hose
bull 1 dripsecond
bull 10000 Lyear or 2642 galyear
bull Water Flow Estimation
bull Use a bucket and stop watch
Water Losses from Leaks
bull Estimate leaks based on the size of the hole and the water pressure (see Leak Water Loss Guide below) or measure directly using a bucket and stop watch
33 North Carolina Department of Environment and Natural Resources Water Efficiency Manual for Commercial Industrial and Institutional Facilities 2009 available at httpsavewaterncorgbushomephp
82
Appendix C Water Unit Conversions and Calculations
Leak Water Loss Guide (Water Loss in Gallons at 50 PSI)
Leak this Size Loss per Day Loss per Month Loss per Year
bullbull 120 3600 43200
360 10800 129600
693 20790 249480
1200 36000 432000bullbullbull bull 1920 57600 691200
3096 92880 1114560
4296 128880 1546560
6640 199200 2390400bullbullbull 6984 209520 2514240
Source Washington State Department of Health Office of Drinking Water available at wwwdohwagovehpdwwater_usewater_use_efficiencyhtm
Guidelines for Estimating Cost and Water Savings
It can be useful to estimate the potential long-term water and cost savings that will result from implementing water efficiency improvements in your facility This section provides guidelines on producing estimates of these savings after implementing improvements to a process at your facility
83
Appendix C Water Unit Conversions and Calculations
Current Water Use
First to estimate the current water use of an entire process at your facility identify the following information and use Equation 1 below
bull Average volume of water used during a full process or technology cycle
bull This may be provided by the product manufacturer through product literature or the manufacturerrsquos website or by using the guidelines and calculations in the previous section of this Appendix The water efficiency will be dependent upon the flow rate of each process cycle duration of each cycle and the number of cycles If the water use from the full process is not available from the manufacturer sum the water use from each part of cycle to determine the water use from the full process cycle
bull Average number of cycles per day
bull Days of facility operation per year
Water Use after Replacement or Retrofit
To estimate the water use of a more efficient technology or process change use Equation 1 but substitute the average volume of water used during an improved process cycle
Water Savings
To calculate water savings that can be achieved from a technology or process change identify the following information and use Equation 2 below
bull Current water use as calculated using Equation 1
bull Water use after replacement or retrofit as calculated using Equation 1
Equation 1
Water Use of a Technology or Process Cycle (gallonsyear) = Cycle Water Use (gallons) Number of Cycles (per day) Days of Facility Operation (daysyear)
Equation 2
Water Savings (gallonsyear) = Current Water use (gallonsyear) ndash Water Use After Improvements (gallonsyear)
84
Appendix C Water Unit Conversions and Calculations
Payback
To calculate the simple payback from a technology or process change identify the following infor-mation and use Equation 3 below
bull Equipment and installation cost of the replacement or retrofit
bull Water savings as calculated using Equation 2
bull Facility-specific cost of water and wastewater
Return on Investment
To calculate the return on investment of a technology or process change calculate the amount of cost savings as compared to the initial investment using Equation 4
General Calculations and On-Line Calculators
GEMIrsquos Collecting the Drops A Water Sustainability Plannertrade has several on-line and download-able calculators for measuring data related to water use and flows (see wwwgemiorgwaterplanner calculatorsasp) These include
bull Flow rate calculator
bull Friction loss and flow calculator
bull Pump hydraulic horsepower calculator
bull Water balance template and calculator
Equation 3
Payback (years) = Equipment and Installation Cost (dollars) [Water Savings (gallonsyear) Cost of Water and Wastewater (dollarsgallon)]
Equation 4
Return on Investment = [(Water Savings (gallonsyear) Cost of Water and Wastewater (dollarsgallon)] ndash Equipment and Installation Cost (dollars)
Appendix DWater Efficiency Opportunity Checklist
Water Efficiency Opportunity Checklist
FacilityBuilding Date Prepared
Prepared by Reviewed by
Water Efficiency Practice Yes No
1 Organizational Water Efficiency Practices
a Have you set water use reduction goals and targets for your facility
b Are water meters installed on high water using processes and are they working properly
c Do you have easy ways for employees to suggest ideas for water efficiency improvements (eg suggestion boxes)
2 Cooling and Heating
a Has once-through cooling water been eliminated with the use of chillers cooling towers or air-cooled equipment
b Has blow-downbleed-off control on cooling towers and boil-ers been optimized
c Is condensate being reused
d Is treated wastewater (or other sources of water for cooling tower make-up) reused where possible
e Are cycles of concentration for cooling towers maximized through efficient water treatment
f Is a conductivity controller installed on each cooling tower
g Have cooling towers been equipped with overflow alarms
h Are high-efficiency drift eliminators in use
3 Restrooms and Kitchens
a Are water-efficient fixtures installed (eg WaterSense labeled faucets toilets urinals and showerheads) Are there signs on dual-flush toilets showing people how to use them
b Have you installed metered or spring-loaded faucets or fau-cets with sensors
85
Appendix D Water Efficiency Opportunity Checklist
Water Efficiency Practice Yes No
c Have you adjusted plumbing to use the minimum amount of water that is functional
4 Process Use
a Have you installed timers to automatically shut off water flow when water is not required such as at the end of a produc-tion cycle
b Are solenoids and automatic shut-off valves checked regu-larly to ensure that they are working properly
c Is equipment set to the minimum flow rates recommended by the manufacturer
d Have pressure-reducing devices been installed on equipment that does not require high pressure
e Can process equipment reuse water (closed loop) or use reclaimed water from other parts of the facility
f Have you replaced water-based transportation with either waterless techniques or recycled water
g Are signs posted near equipment encouraging employee awareness of water use and discouraging tampering with equipment flow rate
5 Cleaning and Sanitation
a Are all hoses equipped with an automatic shut-off nozzle
b Has process cleaning or facility cleaning been replaced with waterless techniques (ie using pressurized air to clean products or containers sweeping debris off the floor) where possible
c Are improved rinsing techniques used (counter-current systems sequential use from high to lower quality needs conductivity flow controls improved spray nozzlespressure rinsing fog rinsing etc)
d Is spent rinse-water being reclaimed and reused for lower-grade processes or for other facility applications
e Have steps been taken to reduce the water used by steam sterilizers such as jacket and chamber condensate cooling modification
86
Appendix D Water Efficiency Opportunity Checklist
Water Efficiency Practice Yes No
f Are you using detergents that can easily be removed with little water
6 Landscaping and Irrigation
a Are low-flow sprinklers trickledrip irrigation and optimized watering schedules in use
b Are preventive maintenance techniques in place
c Has your facility designed its landscape to consider the local climate and grouped plants by similar watering needs
d Is grass planted only in places where it will provide optimal functional and aesthetic benefits
e Are systems in place to capture and reuse rain water and storm water for landscaping or for other uses (eg cooling tower make-up process water or dust suppression)
7 Leaks
a Are you conducting regular leak inspections
b Are leaky faucets faulty fittings and broken pipes and hoses identified and repaired promptly
c Are employees (including custodial crews) educated and em-powered to identify leaks and point them out for repair
d Is there a user-friendly method to report leaks
8 Comments
9 Recommended Follow-Up Actions34
34 For additional guidance see EPA Office of Water ldquoWaterSense at Work Best Management Practices for Commercial and Institu-tional Facilitiesrdquo wwwepagovwatersense North Carolina Department of Environment and Natural Resources Water Efficiency Manual for Commercial Industrial and Institutional Facilities wwwp2paysorgref0100692pdf East Bay Municipal Utility District of Oakland WaterSmart Guidebook wwwebmudcomfor-customersconservation-rebates-and-servicescommercial watersmart-guidebook and Arizona Municipal Water Users Association Facility Managerrsquos Guide to Water Management http amwuaorgpdfsfacility_managers_guidepdf
87
Appendix E Glossary of Water Terms Most of the definitions provided here are from the Alliance for Water Efficiencyrsquos water glossary available at wwwallianceforwaterefficiencyorgGlossaryaspx That glossary has a more extensive set of water-related terms and abbreviations
B
Best management practice (BMP)
Equipment or behavioral measure(s) established as the most practicable means of increasing water efficiency
Blowdown (or Bleed-off)
Draining off the water in a cooling tower reservoir or boiler to avoid the buildup of excess dissolved solids
E
End use A fixture appliance or other specific object or activity that uses water
M
Makeup water Fresh water introduced into a cooling tower or boiler to replace water lost to evaporation and blowdown
P
Peak use (demand)
The maximum demand occurring in a given period such as hourly or daily or annually Peak use can incur sur-charges above the normal base water cost charged by the utility
R
Reclaimed water Municipal wastewater effluent that is given additional treatment and distributed for reuse in certain applica-tions Also referred to as recycled water
Reverse osmosis A process to remove dissolved solids usually salts from water Salty water is forced through membranes at high pressure producing fresh water and a highly concentrat-ed brine
S
Source meter A meter that measures the quantity of water being sup-plied to a facility
88
89
Appendix E Glossary of Water Terms
Submeter A meter that measures usage for specific activities within a facility such as cooling towers process use or land-scape water use
W
Water audit An on-site survey of facility water use to measure equip-ment and management efficiency and generate recom-mendations to improve efficiency
Water balance A chart table or diagram that tracks water flow through a building or facility showing total inflows and total outflows (eg consumption irrigation evaporation leaks and losses)
Water conservation
1 Any beneficial reduction in the water loss waste or use
2 A reduction in water use accomplished by implemen-tation of water conservation or water-efficiency mea-sures
3 Improved water management practices that reduce or enhance the beneficial use of water
Water efficiency A measure of the amount of water used versus the mini-mum amount required to perform a task In irrigation the amount of water beneficially applied divided by the total water applied
Water footprint An analysis of the total volume of freshwater that is used directly and indirectly to run and support the business or to produce a product encompassing water use within an industrial facility throughout its supply chain and final disposition of the product
Lean and Water Toolkit
United States Environmental Protection Agencywwwepagovlean
October 2011EPA-100-K-11-003
Lean and Water Toolkit
Lean and Water Toolkit
Table of ContentsExecutive Summaryi
Preface iv
Chapter 1 Introduction 1
Importance of Water to Industry 1
Benefits of Addressing Water with Lean 2
Getting Started with Lean and Water 6
Chapter 2 Water Use and Water Waste at Industrial Facilities11
Definition of Water Waste 11
Industrial Water Use12
Water End Uses How Water Is Used at Facilities15
Measuring Facility Water Use Metering and Submetering17
Costs of Water Waste 20
Chapter 3 Finding Water Waste on the Factory Floor 25
Water Gemba Walks 25
Developing a Water Balance 28
Water Waste and Value Stream Mapping33
Root Cause Analysis 38
Chapter 4 Lean and Water Efficiency Improvement Strategies 41
Kaizen Events and Just-Do-Its to Reduce Water Use41
Integrate Water Efficiency into Everyday Lean Practices 45
Lean and Water Applications for Facility Operations and Support Processes50
Chapter 5 Lean and Water Beyond the Factory Floor 53
Lean and Water Efforts in Your Supply Chain 53
Engaging with the Community 58
Lean Product Design61
Chapter 6 Conclusion 67
Your Lean and Water Journey67
Concluding Thoughts 68
Appendices 69Appendix A Water Efficiency Resources and Technical Assistance Providers 69
Appendix B Water Cost Calculator76
Appendix C Water Unit Conversions and Calculations 79
Appendix D Water Efficiency Opportunity Checklist85
Appendix E Glossary of Water Terms88
Lean and Water Toolkit
Boxes Key Benefits of Addressing Water with Lean (Box 1) 2
Example Results From Lean and Water Efforts (Box 2) 3
Learning to See Water Waste and Costs (Box 3) 4
Types of Water-Related Business Risks (Box 4)5
Water Metrics (Box 5) 7
Water-Intensive Industries (Box 6)12
Common Costs Associated with Water Use (Box 7) 21
Steps to Take During a Gemba Walk (Box 8)26
Examples of Water Gemba Walk Success (Box 9)28
Information to Collect for a Water Balance (Box 10)32
Water Footprinting Tips (Box 11)33
Asking Why Five Times (Box 12)39
Key Water-Efficiency Questions (Box 13)41
Water Kaizen Event Examples (Box 14)42
Waterless Cleaning of Gatoradereg Bottles (Box 15) 44
Frito-Lay Engaging Employees in Water Efficiency (Box 16)46
Water-Efficient Cleaning Strategies (Box 17)49
Proactive Maintenance Tips to Reduce Water Use (Box 18)50
Questions to Identify Water-Savings Opportunitiesin Facility Operations and Support Processes (Box 19) 51
Dubois Chemical and Steelcase An Innovative Lean Water Supplier Partnership (Box 20) 54
Green Suppliers Network Lean and Water Successes (Box 21) 55
Levi Strauss amp Co and the Better Cotton Initiative (Box 22) 58
PepsiCorsquos Positive Water Balance Project in India (Box 23) 59
Examples of Water Conservation through Product Design (Box 24)64
Figures Figure 1 Impact-Difficulty Matrix 8
Figure 2 Lean and Water Implementation Strategies 10
Figure 3 Water Scarcity Map of the World13
Figure 4 Breakdown of Water Uses in Two Industries 16
Figure 5 Example Water End Uses at an Industrial Facility 17
Figure 6 Portable Water Meter18
Figure 7 Costs Associated with Water Use20
Figure 8 Typical Water Balance Calculation 29
Figure 9 Simplified Elements of a Water Balance30
Figure 10 Adding Water Use to Value Stream Map Process Box 34
Figure 11 Value Stream Map Incorporating Water Use Metrics35
Figure 12 Process Boxes Showing Water Waste36
Lean and Water Toolkit
Figure 13 Water Inputs and Outputs Identified on a Value Stream Map 37
Figure 14 Fishbone Diagram of Excessive Water Use 39
Figure 15 Five Water-Savings Strategies43
Figure 16 Sign to Encourage Water Conservation 45
Figure 17 Dual Flush Toilet Visual Control 47
Figure 18 Six Pillars of 6S (5S + Safety)48
Tables Table 1 Typical Water Use Per Ton of Product 14
Table 2 High-Impact Water Use Sectors 14
Table 3 Costs Associated with Water Used in an Industrial Process 22
Table 4 Key Areas to Check During a Water Gemba Walk 27
Table 5 Example Water Balance Summary 31
Table 6 Table for Evaluating Water Reuse Potential44
Table 7 Methods Used in Lean Design62
Table 8 Questions to Ask During Lean Product Design 63
Lean and Water Toolkit
Lean and Water Toolkit
Acronyms and Abbreviations 3P Production Preparation Process or Pre-Production Planning
5S Sort Set in order Shine Standardize Sustain
BMP Best management practice
CO Changeover time
CT Cycle time
E3 Economy Energy and Environment
EHS Environmental Health and Safety
EPA Environmental Protection Agency
GEMI Global Environmental Management Institute
gpf Gallons per flush
gpm Gallons per minute
LEED Leadership in Energy and Environmental Design
MEP Manufacturing Extension Partnership
NIST National Institute of Standards and Technology
psi Pounds per square inch
TPM Total Productive Maintenance
Lean and Water Toolkit
i
Executive Summary
Executive SummaryThis Lean and Water Toolkit describes practical strategies for using Lean manufacturingmdashthe production system developed by Toyotamdashto reduce water use while improving operational per-formance Drawing from the experiences and best practices of multiple industry and government partners this toolkit explores opportunities to identify and eliminate ldquowater wasterdquo including
bull Water losses and leaks
bull Non-value added or inefficient use of water
bull Missed opportunities to reuse water
bull Wastewater discharges
bull Unnecessary water use and risks throughout the supply chain
bull Missed opportunities to address customersrsquo water-efficiency goals
This toolkit is a supplement to EPArsquos Lean and Environment Toolkit (wwwepagovleantoolkit) which addresses all types of environmental wastes and improvement opportunities
Why Address Water Using Lean Companies recognize water use and availability as a critical business concern While direct water costs may be low many indirect costs associated with water use can make the full cost of water substantial Community concerns about water and the risk of water supply disruptions can increase pressures on companies to reduce water use Incorporating water use reduction into Lean initiatives provides an efficient and effective means to
1 Uncover cost savings and operational improvements
2 Reduce water-related business risks
3 Deliver value for customers and employees
Facilities already using Lean can often easily incorporate water considerations into value stream maps and other Lean efforts At the same time facilities conducting water efficiency initiatives may find that Lean tools provide a powerful means to drive effective implementation and results Con-necting Lean and water efforts can engage employees in powerful and rewarding ways that build capacity and momentum to solve problems and create value
Understand Water Uses and Costs The toolkit discusses common water end uses in industrial and manufacturing facilities and discuss-es costs associated with water use Costs of water include not only the cost of purchasing water but also costs associated with treatment heating conveyance and regulatory compliance Metering and sub-metering are important tools for understanding actual water use within a facility and tracking it over time
ii
Executive Summary
Find Water Waste The toolkit discusses several techniques to find water waste and opportunities at your facility in-cluding
bull Water Gemba Walks Have a team walk the factory floor together to observe and inventory inefficiencies related to water use
bull Water Balance Develop a diagram of your facilityrsquos water use that shows and quantifies the flows of water into and out of each process or operation in the facility
bull Value Stream Mapping Add information on water use andor costs to Lean value stream maps to help identify water waste and develop implementation plans for Lean and water efficiency improvement efforts
bull Root Cause Analysis Use root cause analysis methods to explore the underlying causes of water waste and inform improvements
Improve Operations and Processes with Lean and Water Strategies Solutions to reduce water waste can be identified during Lean events and in daily implementation of Lean principles and tools The toolkit discusses facility operations and support functions in which there may be specific improvement opportunities Strategies include
bull Waste Elimination Culture Encourage employees to identify water waste throughout their daily activities and create a culture in which they are empowered to continually im-prove the way your facility uses water
bull Kaizen Events and Just-Do-Its Pursue opportunities to address water waste during Lean kaizen events Consider focusing kaizen events specifically on water waste or water-intensive processes Also find quick opportunities for individuals to immediately improve a process or operation in just-do-it projects
bull Standard Work Embed water use management and efficiency tasks into standard operat-ing procedures to engage all employees in proactive water-efficiency activities
bull Visual Controls Use signs and visual controls to reinforce water waste reduction practices and standard work Clearly display information on water use and costs to raise awareness
bull 5S Incorporate water management and waste reduction activities into 5S housekeeping activities such as cleaning and inspections to engage all employees in identifying and eliminating water waste
bull Total Productive Maintenance Enable teams of workers to quickly identify and correct problems fix leaks and improve water efficiency while optimizing the effectiveness of your manufacturing equipment
iii
Executive Summary
These Lean tools can be used at a facility in concert with water-efficient best management practices (BMPs) that are often available from industry associations and government agencies1 Industrial facilities can target their efforts to the most effective solutions using these technology and process-based improvements
Extend Lean and Water Efforts throughout the Value Chain Looking beyond facility operations can allow you to uncover new ways to reduce water use and risks while adding value and improving business operating conditions and market opportunities Strategies include
bull Supply Chain Initiatives Work with your suppliers to improve understanding of water use costs and risks Provide incentives and technical support to help suppliers identify and eliminate water waste Collaborate with supply chain partners to address water-related op-portunities through joint Lean events and other initiatives
bull Engage Local Communities Educate and engage your employees in water-efficiency efforts at your facility and encourage them to adopt similar practices at home Partner with community members and local organizations to conduct projects or Lean events that improve water use andor quality in the community
bull Product Design Incorporate water efficiency and reuse as design criteria into Lean prod-uct and process design methods as a powerful means of reducing the water use of products throughout their lifecycle
Starting Your Lean and Water Journey There are many ways to get started with identifying and reducing water waste and improving busi-ness results using Lean Consider using the strategies and techniques in this toolkit to help you
1 Learn more about how your facility uses water
2 Engage employees in Lean and water improvement efforts
3 Connect Lean and water efforts to sustainable water management strategies
We hope the strategies and tools in this toolkit will help you on your Lean and water journeymdashen-abling you to reduce water waste and costs improve processes and foster positive relations with your customers and community
1 Appendix A provides information on water efficiency resources and technical assistance providers that offer helpful information on BMPs Also consider contacting your local water utility or the industry or trade association in your sector to inquire about water-related BMPs and resources
iv
Preface
Preface
Purpose of This ToolkitThe Lean and Water Toolkit offers Lean implementers practical strategies and techniques for improving common Lean results related to time cost and quality while also reducing water use costs and risk Environmental Health and Safety professionals will also find useful infor-mation in this toolkit for how to leverage Lean and Six Sigma business improvement methods to eliminate water waste Finally the toolkit introduces Lean practitioners to the wide array of water efficiency resources available from EPA and other organizations
The ldquoLeanrdquo methods discussed in this toolkit are organizational improvement methods pioneered in the Toyota Production System Lean production and Lean manufacturing refer to a customer-focused business model and collection of methods that focus on the elimination of waste (non-value added activity) while delivering quality products on time and at a low cost Six Sigma is a business model that focuses on improving quality by eliminating variation it is often combined with Lean The toolkit assumes that you are familiar with Lean methods For those who want to learn more about Lean see EPArsquos Lean and Environment website (wwwepagovlean)
Key Questions Addressed by This Toolkit Lean works well when it focuses on identifying and eliminating waste This toolkit contains strate-gies and techniques that can enable Lean practitioners to easily identify water waste and improve-ment opportunities alongside the myriad other wastes and improvement opportunities uncovered by Lean To accomplish this the toolkit aims to answer the following questions
What is water waste Water is required in substantial quantities to produce goods from food products to silicon chips Water waste is water that is used beyond the point at which it ceases to add value to the customer Excess water use often leads to wastewater which can harm human health and the environment through the pollutants it collects and overdrawing water resources in certain regions can exacer-bate water scarcity concerns Water can be wasted in the supply chain through facility operations and in product use and disposal This toolkit will help you to recognize water waste so that you can work to reduce it
Why should you address water waste with Lean Substantial water savings can ride the coattails of Lean improvement By eliminating manufactur-ing wastes such as unnecessary processing and cleaning businesses also reduce the water and associated labor and energy costs needed for cleaning conveyance cooling and heating Chapter 1 describes benefits of combining Lean and water efficiency efforts and discusses how to get started Chapter 2 provides an overview of industrial water use including information on water uses water metering and water costs
v
Preface
How do you know how much and where water is used in your facility A key step in effective Lean and water efforts is determining where to target water efficiency im-provement activities Chapter 3 discusses techniques for measuring water use and identifying op-portunities to reduce water use in the context of Lean Methods include gemba walks water balance value stream mapping and root cause analysis
How can you reduce water use with Lean methods Chapter 4 examines specific opportunities for using Lean methods to improve water efficiency including kaizen events standard work visual controls 5S and total productive maintenance These strategies present ways that you can integrate water efficiency principles and practices into the practical implementation-based tools of Lean manufacturing and the waste-elimination culture fostered by Lean
How can you use Lean to pursue water efficiency opportunities beyond your facilityrsquos operations For many companies water costs and risks may be driven by factors and activities beyond the facility fence-line Similarly opportunities to capture market value and win customers may require considerations upstream to manufacturing activities Chapter 5 explores strategies to leverage Lean initiatives and methods to reduce water risks in your supply chain and to engage the local commu-nity in water saving initiatives Chapter 5 also discusses how Lean product design methods can be used to improve water efficiency and add value by addressing customer water needs
Lean and Water Toolkit
1
CHAPTER 1
Introduction
Water is a crucial resource for the world economy Lean provides a framework in which organiza-tions can address water waste while saving costs reducing risks and adding customer value This chapter includes the following sections
bull Importance of Water to Industry bull Benefits of Addressing Water with Lean bull Getting Started with Lean and Water
Importance of Water to Industry Companies worldwide identify water issues as a critical business concern Water is essential for a range of industrial processes and support functions facility operations and as an ingredient for many products Water use is increasing much faster ldquoI am convinced that under present than population growth and regional and seasonal conditions and with the way water is differences in water availability can lead to short- being managed we will run out of ages and even water-related conflicts The World water long before we run out of fuelrdquo Economic Forum reports that 44 percent (28 billion) of people currently live in areas of the Peter Brabeck-Letmathe Chairman
world that are water stressed and if present trends Nestle Corporation
continue water scarcity will affect the livelihood of Source ldquoA water warning Peter Brabeck-Letmathe chairman of Nestleacute argues that water shortage is an even more urgent problem than climate changerdquo The Economist November 19 2008one-third of the worldrsquos population by 20252 wwweconomistcomnode12494630
Corporations are recognizing the important role they play in addressing water resource chal-lenges and companies are responding by engaging in efforts to measure report and reduce their water use In a survey conducted by the Carbon Disclosure Project of 302 of the worldrsquos largest 500 companies 89 percent of responding companies had developed specific water policies strategies and plans and 67 percent indicated that responsibility for water-related issues lies at the Board or Executive Committee level3 The United Nationsrsquo CEO Water Mandate launched in 2007 is designed to help companies develop implement and report on water sustainability policies and practices Industry-led associations such as the World Business Council for Sustainable Development and the Global Environmental Management Initiative also have major water initiatives
One key reason why companies choose to use water more efficiently is to improve their relationship with the communities that surround industrial facilities Water use is of paramount importance to a facilityrsquos relationship with its surrounding community Facilities that use less water in drought-
2 World Economic Forum ldquoThe Bubble Is Close to Bursting A Forecast of the Main Economic and Geopolitical Water Issues Likely to Arise in the World during the Next Two Decadesrdquo Draft Report for Discussion at World Economic Forum
3 Carbon Disclosure Project ldquoCDP Water Disclosure 2010 Global Reportrdquo available at wwwcdprojectnetCDPResultsCDP-2010-Water-Disclosure-Global-Reportpdf
2
Chapter 1 Introduction
prone areas leave more water available for residential use Some companies even risk being forced to withdraw from regions where water is a scarce resource a problem that is likely to recur as water scarcity increases in many regions around the globe In some cases communities around industrial facilities show much greater concern for the amount of water a facility uses than the amount of energy it uses
This toolkit provides strategies and tools for addressing water issues within the context of Lean manufacturing and other business process improvement methods
Benefits of Addressing Water with Lean Lean provides powerful tools for delivering value to customers in a manner that minimizes waste and risks from unnecessary water use Explicit consideration of water waste during Lean imple-mentation can create significant value for an organization helping to deliver quality products and services that customers want when they want them Research sponsored by EPA and others shows that some water use and waste reduction benefits typically ride the coattails of Lean efforts yet other opportunities to reduce wastes risks and non-value added activity associated with water may be overlooked There are three key benefits of addressing water with Lean as listed in Box 1 and further described below
Key Benefits of Addressing Water with Lean (Box 1)
1 Uncover cost savings and operational improvements
2 Reduce water-related business risks
3 Deliver value for customers and employee
Uncover Cost Savings and Operational Improvements Learning to see and eliminate waste is a cornerstone of Lean initiatives Water waste is often a sign of inefficient production and non-value added activity and it frequently indicates opportuni-ties for saving costs and time Lean and water strategies can help you to uncover cost savings and improvements in areas of your facilityrsquos operations that may not have received as much attention in your Lean efforts For production processes that are highly dependent on water or that have water-intensive support processes such as wastewater treatment the operational and environmental benefits from Lean and water efforts are even more significant
Learning to see water and other environmental waste during Lean efforts can reveal significant business improvement opportunities further strengthen Lean results and improve environmental performance Box 2 provides several examples of how companies have used Lean and Six Sigma methods to reduce water use save costs and improve their performance
3
Chapter 1 Introduction
Example Results From Lean and Water Efforts (Box 2)
3 IBM used Six Sigma tools to reduce water consumption and operating costs in wafer fabrication processes saving $3 million annually reducing water usage by 27 percent and increasing production by over 30 percent
3 GE combined high-tech water metering and other water efficiency prac-tices with its kaizen improvement methodology resulting in a 30 percent drop in water use since 2006
3 DTE Energy saved 20 million cubic feet of water (79 percent) and $700000 annually in a Lean Six Sigma project examining electric substa-tion water use
Sources IBM ldquoGreen Sigma Overviewrdquo Presentation to EPA June 2009 GE info cited in Carbon Disclosure Project ldquoCDP Water Disclosure 2010 Global Reportrdquo page 25 available at wwwcdprojectnetCDPResultsCDP-2010-Water-Disclosure-Global-Reportpdf and Jason Schulist DTE Energy ldquoLean Towards Sustainability How to Use Lean and Six Sigma Methods to Drive Your Sustainability Journeyrdquo Presentation at Green Six Sigma Conference May 19 2009
While many places have very low direct costs for water and wastewater there are also indirect costs to water use These costs can be significant yet they are often hidden in overhead or support cost centers (see Box 3 for examples of how facilities have uncovered water waste and costs) Examples of water costs include
bull Raw Material Costs Costs of measures to ensure that purchased water supply is of suf-ficient quality for use at a facility For example some facilities may bear costs for labor equipment and materials needed to improve water quality before use (eg when water is a key product ingredient) as well as for chemicals and other raw materials needed to treat and manage water at the facility and before discharging it Water treatment costs associated with deionized water and reverse osmosis can be substantial
bull Energy Costs for the energy required to heat and cool water pump or transfer water operate water-consuming equipment treat water and wastewater and other functions
bull Pollution Control Wastewater service costs paid to a utility andor industrial pretreat-ment costs for the energy labor materials equipment and chemicals needed to treat wastewater before discharging it from the facility
bull Regulatory Compliance Costs for regulatory compliance activities such as completing permit applications and tracking and reporting wastewater discharges to regulatory agencies In the United States industrial municipal and other facilities must obtain National Pollutant Discharge Elimination System permits if the facilities discharge water pollutants directly into US waters Pretreatment regulations govern industrial facilities that discharge into municipal sewer systems Also in some food and consumer product industries water use may be important to address Food and Drug Administra-tion sanitation requirements
4
Chapter 1 Introduction
Lean and water strategies such as those outlined in this toolkit help to reveal these costs and identify process improvement solutions The next chapter provides more information about water end uses and costs
Learning to See Water Waste and Costs (Box 3)
3A wood products company began metering water into two parallel process units and discovered one was using significantly more water than the other After some investigation the company identified and implemented mainte-nance practices that would substantially lower water use while also prevent-ing equipment failure and downtime
3A food processing company regarded the water supply from its groundwater well as essentially free While completing a facility water balance it me-tered the amount of hot water used for one process step Once the com-pany realized it was heating 25 gallons per minute of ground water from 55 degrees to boiling it began to think of opportunities to reduce and reuse the energy in the hot water rather than sending it down the drain
3A small high tech silicon wafer company was paying its city water utility $120 per hundred cubic feet of water After calculating the cost of pre-treating its process water and adding wastewater treatment and discharge expenses the company realized that the full cost of water was five times the initial cost of purchasing water These insights led the company to reuse rinse water in the process reducing total water use and demand for ultra pure water without affecting product quality
Reduce Water-Related Business Risks Lean provides an effective platform for reducing facility water use and the associated water-related business risks While the specific risks that individual facilities face vary examples of water-related risks include water shortages and reliability issues water quality issues that drive the need for additional water treatment increasing water costs and supply chain interruptions In some water-scarce regions there may be challenges with meeting basic human needs for clean water and sani-tation competition for scarce water resources may be intense between uses associated with public water supply agriculture industry and fisheries Climate change is predicted to exacerbate many of these water risksmdashincreasing global temperatures will likely lead to increases in water de-mand water scarcity more vulnerable ecosystems and more frequent extreme weather events4
How companies respond to water risks can also have important implications for how local commu-nities and customers perceive those companies 4 For more information on water and climate change see CERES and Pacific Institute ldquoWater Scarcity amp Climate Change Grow-
ing Risks for Businesses amp Investorsrdquo February 2009 available at wwwpacinstorgreportsbusiness_water_climatefull_report pdf For a discussion of business perspectives on the connections between water energy and climate change see World Business Council for Sustainable Development ldquoWater Energy and Climate Change A Contribution from the Business Communityrdquo March 2009 available at wwwwbcsdorg
5
Chapter 1 Introduction
Types of Water-Related Business Risks (Box 4)
Companies face a variety of risks related to water security including
3Business Interruption Risks that the supply of water may be disrupted in the supply chain production andor product use
3Reputation Risks related to public scrutiny of how companies respond to water resource challenges and engage with communities stakeholders and employees
3Regulatory Risks of increased government regulations or restrictions on water use and water pollution as well as the associated costs to respond to the requirements
3Access to Capital Risks of financial institutions adopting stricter lending and investment policies based on water uncertainties
Source World Economic Forum ldquoThe Bubble Is Close to Bursting A Forecast of the Main Economic and Geopolitical Water Issues Likely to Arise in the World during the Next Two Decadesrdquo Draft Report for Discussion at World Econom-ic Forum Annual Meeting 2009 January 2009 page 39 www3weforumorgdocsWEF_ManagingFutureWater20 Needs_DiscussionDocument_2009pdf
Reducing non-value added water use is a key strategy for mitigating water risks Integrated Lean and water strategies offer practical solutions that support multiple business objectives such as increased efficiency reduced costs improved customer responsiveness and decreased water and energy use By engaging employees in teams to identify and eliminate sources of water waste in your facilitymdashalongside other production wastes such as over processing defects and delays your facility can proactively reduce water risks while also supporting operational goals Proactively en-gaging with local utilities and communities to collaboratively address water resource challenges can provide additional opportunities to reduce business risks and increase value These efforts will make your facility less vulnerable to risks and better positioned to succeed given changes in water supply demand and quality
Deliver Value for Customers and Employees Reducing water use and risks through Lean Six Sigma and other process improvement meth-odologies can foster a competitive advantage for some businesses Customers and employees may view proactive environmental improvement efforts as an important attribute affecting customer loyalty and the ability to attract and retain employees In some market segments ldquogreenrdquo attributes are an important factor that can give a product or company competitive advantage People around the world view water issues as a key sustainability challenge For example more than 90 percent of the 32000 people polled in 15 countries for a GlobeScan and Circle of Blue survey in 2009 perceived ldquowater pollutionrdquo and ldquofreshwater shortagerdquo to be serious problems (70 percent considered them very serious problems)5 Some companies can tap into significant market niches by providing cus-tomers with water-efficient choices and solutions 5 GlobeScan and Circle of Blue ldquoWater Views Water Issues Researchrdquo August 19 2009
wwwcircleofblueorgwaternewswp-contentuploads200908circle_of_blue_globescanpdf
6
Chapter 1 Introduction
Participation in international or national water sustainability programs or local water efficiency efforts can provide businesses with public recognition and a competitive advantage for their wa-ter management achievements For businesses that manufacture water-using appliances parts or products companies can use design methods to make their products as water-efficient as possible throughout their lifecycles from manufacturing to use and disposal These methods can allow companies to cater to the steadily growing markets for green building and green products There are also awards and competitions that provide recognition and media publicity for water-related in-novations and efficiency accomplishments
Reducing your facilityrsquos water use and the water that your products require during use can add value for your ldquodownstreamrdquo customersmdashsaving them water and energy costs and helping them meet their water-efficiency goals Business interest in gathering and disclosing water use and risk information through initiatives such as the Global Reporting Initiative and the Carbon Disclo-sure Projectrsquos Water Disclosure Initiative may increase in the coming decade as water becomes a more critical business issue in some supply chains and industry sectors Chapter 5 discusses ideas for engaging with customers suppliers and communities on Lean and water efforts as well as incorporating water issues into Lean product design
Getting Started with Lean and Water There are many ways for a facility to get started with reducing water waste and finding Lean and water improvement opportunities While the possibilities can be daunting the important thing is to begin even if the effort is small Consider starting out with small steps such as tracking water use as a metric at your facility with the goal of reducing use This can be a great strategy for smaller facilities Here are some ideas for initiating a Lean and water effort
Learn More About How Your Facility Uses Water A key first step is learning how your facility uses water and identifying the process areas support functions and facility operations that have the greatest water waste and improvement opportunities Strategies include beginning to track water metrics as part of Lean and process improvement activi-ties and installing water meters on processes that use large amounts of water Box 5 lists examples of water metrics that facilities can use It is helpful for facility managers and Lean champions to track water usage regularly and to share this information with floor staff Regularly monitoring water use data can help you determine the impact of peak periods (eg during summer andor busier production months) and help you spot variations that could be signs of problems
7
Chapter 1 Introduction
Water Metrics (Box 5)
Facility-Wide Metrics
3 Volume of water used each month or other appropriate time period (eg gallonsmonth or gallonsshift)
3 Volume of wastewater (eg gallonsmonth or gallonsshift)
3 Water used for specific end uses (eg gallonsper month for outdoor ir-rigation cooling water evaporation heated process water bathrooms and kitchens etc)
Metrics Normalized to Production
3 Volume of water used per product (eg gallonspound of product gal-lonsproduct)
3 Volume of wastewater discharged per product (eg gallonspound of product or gallonsproduct)
Chapter 2 of this toolkit has more information on water end uses metering and costs
To be most effective in Lean and water implementation efforts Lean champions or operations man-agers should connect with environmental and facilities personnel early on to discuss plans for Lean and water efforts Environmental Health and Safety (EHS) personnel can assist with developing water balances and other assessments of facility and process water use including gathering data on water use and costs as well as helping prioritize Lean and water activities
After completing an initial water assessment managers can consider it in the context of other planned Lean events and prioritize opportunities for involving EHS personnel in value stream map-ping and kaizen events based on when their environmental expertise will add the most value
Engage Employees in Lean and Water Improvement Efforts Lean provides a solid framework to empower cross-disciplinary employee teams to identify and eliminate excess water use and other production waste thereby realizing both environmental and Lean gains Most likely your efforts to examine water use and waste will generate numerous ideas for process improvements and potential solutions Ideas could include water efficiency and reuse opportunities andor Lean events to improve water-intensive processes
bull Motivate employees and managers by communicating corporate sustainability goals and incorporating water efficiency into performance targets and incentives
bull Consider trying out some of the Lean and water improvement ideas in this toolkit but donrsquot limit employee teams to those ideasmdashencourage their creativity and initiative
bull Train employees on how to identify water waste and improvement opportunities building their capacity to problem solve and help meet your facilityrsquos water use reduction targets
8
Chapter 1 Introduction
bull Actively solicit employee suggestions for kaizen events or other improvement projects by inviting ideas in meetings and conversations andor by using a suggestions board or box
A significant benefit of involving employees throughout your facility in Lean efforts is the oppor-tunity to create a culture of continuous improvement When employees are engaged in identifying ways to improve water efficiency they are more likely to note these opportunities and areas of water waste throughout their normal day-to-day operations You might find that improved water efficiency becomes a continual trend at your facility and not just something that happens within the confines of a specific Lean exercise or event
Focus your facilityrsquos initial Lean and water efforts on high-impact easy-to-implement strategies in order to achieve the highest likelihood of success An Impact-Difficulty Matrix such as the one in Figure 1 can be useful for prioritizing among process improvement and implementation options Lean event participants can plot their ideas onto the four quadrants in the matrix based on whether or not an idea would have a large or small impact (either in terms of operational andor environ-mental objectives) and whether or not it would be difficult to implement This process lets people see visually which projects are most ldquoriperdquo for Lean
Connect Lean and Water Figure 1 Impact-Difficulty Matrix Efforts to Sustainable Water Management Strategies Lean and Six Sigma provide operational High tools that can support a broader corporate water sustainability strategy Leanrsquos focus on performance measurement continual improvement through employee engage-ment waste elimination improved ef- Low ficiency increased profits and customer satisfaction can be leveraged to support corporate water management efforts to Low High measure and report water use factor water
Difficulty into business decisions and implement the practical and effective solutions If your organization already has a sustainability policy andor specific water efficiency goals consider how Lean and water strategies could be used to enhance and accelerate those efforts
Risk-Based Water Sustainability Strategies
Depending on the importance of water to your business it may be worth developing a risk-based water sustainability strategy and then seeing how Lean and water efforts could support implementa-tion A number of resources can help you assess specific water-related risks determine the business case for water sustainability and develop implementation plans These include
Impact
9
Chapter 1 Introduction
bull Global Environmental Management Initiativersquos (GEMIrsquos) Connecting the Drops Toward Creative Water Strategies A Water Sustainability Tooltrade wwwgemiorgwater
bull World Business Council for Sustainable Developmentrsquos Global Water Tool wwwwbcsdorgwebwatertoolhtm
bull GEMIrsquos Local Water Tooltrade (scheduled to be released in spring 2012) wwwgemiorgGEMIInteractiveToolsaspx
This toolkit complements broader water sustainability strategy resources (such as those listed above) by exploring practical opportunities to leverage facility Lean and Six Sigma and similar process improvement initiatives to reduce water waste
True North Goals and Targets
Lean experts often extol the motivational power of setting goals and targets that represent the ldquoTrue Northrdquo for operations As noted by Lean expert Robert Hall of the Association of Manufacturing Excellence ldquoTrue North is what we should do not what we can do the ultimate ideal for the overall process and for every sub-process within itrdquo6 True North goals targets and metrics are powerful tools for inspiring and focusing employee attention and creativity to both continuously improve and find breakthrough solutions For example Nike Inc developed ldquoNorth Starrdquo goals and metrics to define what sustainable products and a sustainable company would look like which includes a focus on water stewardship7 Consider what the True North target is for water use in your facility For many facilities the True North targets may be zero wastewater and zero water use that is not incorporated into the product
Examining the Full Value Chain
To achieve sustainability goals itrsquos important to look beyond a facilityrsquos direct operations Lean methods can support water use and risk reduction efforts not only at areas within the direct control of a manufacturing or industrial facility but also throughout the lifecycle or extended value chain for a product or servicemdashfrom the extraction and processing of raw materials through production processes and onto product distribution use and disposition While the primary focus of this toolkit is on reducing water use at your facility Chapter 5 discusses opportunities to extend Lean and water techniques to other areas Figure 2 provides an illustration of how the content of the toolkit links to a value chain
6 Robert Hall ldquoThe Toyota Production System Seeks True Northrdquo Lean Directions e-Newsletter 2011 available at wwwsmeorgcgi-binget-newsletterplLEANamp20040709amp1amp
7 For more information on Nikersquos North Star see httpwwwnikebizcomcrreportcontentenvironment4-1-0-overviewphpcat=overview
10
Chapter 1 Introduction
Figure 2 Lean and Water Implementation Strategies
Understand Water Uses and Costs (Chapter 2)
Find Water Waste (Chapter 3)
Improve Operations and Processes with Lean and Water Strategies (Chapter 4)
Extend Lean and Water Efforts Throughout the Value Chain (Chapter 5)
Sourcing Materials and Inputs (Chapter5)
Production Manufacturing (Chapters 3 and 4)
Product Distribution Use and Disposition (Chapter 5)
To Consider
3Is water use responsible for major costs waste or risk at your organiza-tion If you donrsquot know how would you find out
3How has Lean affected your organizationrsquos use of water
3How could your organization benefit from efforts to reduce water waste us-ing Lean (Think about time and cost savings reduced risks and liabilities added value to customers etc)
3What ideas do you have for reducing water waste using Lean
11
CHAPTER 2
Water Use and Water Waste at Industrial Facilities
Understanding water use is an important first step in efforts to reduce water-related wastes costs and risks This chapter contains the following sections
bull Definition of Water Waste bull Industrial Water Use bull Water End Uses How Water Is Used at Facilities bull Measuring Facility Water Use Metering and Submetering bull Costs Associated with Water Use
Definition of Water Waste Water is one of the most critical resources in the world and is necessary for all types of industry Water is required in substantial quantities to create goods from food products to silicon chips In this toolkit the term ldquowater wasterdquo refers to use of water beyond the point that optimizes value to the customer This includes non-value-added water use throughout facility operations and support processes and from the supply chain through production product use and waste disposal Water waste can cause harm to health and well-being of people and ecosystems by diverting water from other needs and beneficial uses Reducing water waste can help ensure that present and future gen-erations have access to a sustainable water supply
Improve your facilityrsquos water efficiency by reducing water waste not only by reducing water intake but by finding creative ways to use water more efficiently Water efficiency as the term is used in this toolkit refers to reductions in the amount of water used per unit of production Water effi-ciency refers to the minimum amount of water needed to perform a task (Note that water-efficiency improvements do not necessarily mean that a facilityrsquos total water use is decreased since increases in production may offset water efficiency gains) Examples of water waste include
bull Loss of water through material failures such as leaky hose nozzles
bull Discarding water that could be reused such as treated rinse water
bull Wastewater discharges
bull Water used by high-flow appliances instead of more efficient alternatives
bull Use of water in excess of necessity such as the use of too much water for facility or parts cleaning
Understanding the many places where water waste occurs is an important first step for identifying areas for improvement
Chapter 2 Water Use and Water Waste at Industrial Facilities
Industrial Water UseThe use of water by industries both in the United States and throughout the world represents a significant portion of total water use US industrial water use is estimated to be more than 182 billion gallons per day (from direct water withdrawals not including water use from public water supply)8 While industrial water withdrawals account for just five percent of total water withdrawals in the United States thermoelectric power water withdrawals account for 49 percent Industrial and manufacturing businesses also use about 12 percent of the public water supply Industrial water us-ers include facilities involved in sectors such as chemicals food and beverage paper and associated products steel electronics and computers metal finishing petroleum refining and transportation equipment Overall two of the most water consuming sectors of the economy are agriculture and thermoelectric power although other industries may use a significant proportion of public water supplies in some areas
The share of industrial water use can be much greater in certain geographic areas and these areas can experience substantial supply pressures Figure 3 below shows a geographic distribution of wa-ter scarcity across the globe Areas prone to water scarcity will likely experience continued competi-tion for water resources which can impact your relationship with the surrounding community Be aware of your facilityrsquos location relative to potential water scarcity and consider water competi-tion when siting new facilities or building relationships with new suppliers In the United States the National Integrated Drought Information System maintains a user-friendly web portal(www droughtgov) with current information forecasts maps reports and resources addressing drought conditions and water scarcity
Industrial water use varies by sector as different activities require different inputs of water Box 6 lists eight industries that require substantial inputs of water
Water-Intensive Industries (Box 6)
3 Agriculture
3 Apparel
3 Beverages
3 Biotechnologypharmaceuticals
3 Electric power
3 Forest products
3 High-tech (including semiconductor manufacturing)
3 Metalsmining
8 Kenny Joan F et al Estimated Use of Water in the United States in 2005 USGS 2009 httppubsusgsgovcirc1344 The USGS data does not include industrial water use drawn from municipal water systems only direct withdrawals from surface and groundwater sources Actual industrial water use is likely greater For information on water use outside of the US see AQUASTAT Food and Agricul-ture Organization of the United Nations ldquoWater Withdrawal by Sector Around 2003rdquo data downloaded November 2010 wwwfaoorg nrwateraquastatmainindexstm Note that FAO data includes thermoelectric cooling water withdrawals in its industrial water totals
12
13
Chapter 2 Water Use and Water Waste at Industrial Facilities
Figure 3 Water Scarcity Map of the World
Source United Nations Environment Programme Map of Water Stress Indicator in Major Basins 2004 available at http mapsgridanogographicwater-scarcity-index
Water is a very important resource to many industries and as a result there are many opportuni-ties to reduce water use In the case of the high-tech industry which uses considerable quantities of water to manufacture semiconductors and other components water is vital to industry opera-tions Cleaning and rinsing silicon chips can require billions of gallons of water per year to produce a single chip can use up to 7900 gallons9 Apparel also ranks high in the list of water-intensive industries with cotton production and textile processing requiring substantial inputs of water Among industrial manufacturers the forest products sector is the third-largest consumer of water in the US requiring high volumes of water for pulp and paper manufacturing The electric power industry directly uses water extensively for cooling and emissions scrubbing fossil fuel plants and nuclear power plants require hundreds of liters of water for every kilowatt-hour of electricity that they produce10 Table 1 shows typical water quantities required to produce one ton of several manu-factured products
9 Uphadyay Sanjay ldquoMicroelectronics ndash Fostering Growth Opportunities in the Ultrapure Water Marketrdquo Frost amp Sullivan August 19 2011 available at wwwfrostcomprodservletmarket-insight-toppagdocid=240394448
10 CERES and Pacific Institute ldquoWater Scarcity amp Climate Change Growing Risks for Businesses amp Investorsrdquo February 2009 available at wwwpacinstorgreportsbusiness_water_climatefull_reportpdf
Chapter 2 Water Use and Water Waste at Industrial Facilities
Table 1 Typical Water Use Per Ton of Product
Paper 21000ndash528000 gallons
Beer 2113ndash6604 gallons
Sugar 792ndash105668 gallons
Steel 528ndash92460 gallons
Soap 264ndash9246 gallons
Gasoline 26ndash10566 gallons
Source United Nations World Water Assessment Programme United Nations World Water Development Report Water in a Changing World 2009 available at wwwunescoorgwaterwwapwwdrwwdr3
There is much variation among industrial sectors in relative water use and the need for water varies greatly across the stages of the product or service value chain from suppliers through production to product use It is important to know where in the value chain your industryrsquos water use is heavi-est so that you can appropriately target improvement efforts For example the apparel industry uses high volumes of water in raw material production whereas the biotech and pharmaceuticals industry uses most of its water resources in direct operations Table 2 shows the relative intensity of water impact (ranging from zero to three squares) in different segments of the value chain for several industry sectors
Table 2 High-Impact Water Use Sectors
Raw Material Production
Suppliers Direct Operations
Product Use End of Life
Apparel n n n n n
High-Tech Electronics
n n n
Beverage n n n n
FoodAgriculture n n n n n
Biotech Pharmaceuticals
n
Forest Products n n n
MetalsMining n n n n
Electric Power Energy
n n n n
Source CERES and Pacific Institute ldquoWater Scarcity amp Climate Change Growing Risks for Businesses amp Investorsrdquo February 2009 available at wwwpacinstorgreportsbusiness_water_climatefull_reportpdf
14
15
Chapter 2 Water Use and Water Waste at Industrial Facilities
Water End Uses How Water Is Used at Facilities In order to reduce water waste in industry it is important to understand the many ways that water is used within facilities Understanding water end uses is critical to identifying water savings opportunities While end uses of water vary by industry and by facility there are categories of water use that are present at most industrial facilities Water use in most industries can be classified into the following broad end uses
bull Production processing and in-product use
bull Auxiliary processes (eg pollution control labs and cleaning)
bull Cooling and heating (eg cooling towers and boilers)
bull Indoor domestic use (eg restrooms kitchens and laundry)
bull Landscape irrigation
These broad categories encompass many of the ways industrial facilities use water Among US industrial customers cooling operations (including cooling towers and open cooling systems) com-prise the single largest category of industrial water end use with more than 50 percent of industrial and commercial water demand combined going toward cooling11
The amount of water required for the various end uses differs by industry Service and manufactur-ing facilities require the most water for washing and processing while food and beverage facilities use most of their water intake in product preparation Figure 4 shows examples of water end uses in the computer and electronics manufacturing industry and the food processing industry
11 Vickers Amy Handbook of Water Use and Conservation WaterPlow Press 2001
16
Chapter 2 Water Use and Water Waste at Industrial Facilities
40
20
20
10
5 5
Figure 4 Breakdown of Water Uses in Two Industries
Rinsing
Cooling Systems
Fume Scrubbers
Water Purification
RestroomsOther
Landscaping
Computer and Electronics Manufacturers
3
42
14
13
9 Washing and Sanitation
Cooling and Heating
OneshyPass Cooling
Process
Domestic
OtherUnaccounted
Source Adapted from New Mexico Office of the State Engineer ldquoA Water Conservation Guide for Commercial Institutional and Industrial Usersrdquo July 1999 available at wwwosestatenmuswater-infoconservationpdf-manualscii-users-guidepdf
Major end uses of water often provide the greatest opportunities for water waste reduction and efficiency improvement For example in many food beverage and pharmaceutical companies cleaning process equipment can account for as much as 50 to 70 percent of a facilityrsquos total water use and represents a substantial opportunity to save water12 Figure 5 illustrates how water flows through several different end uses at an industrial facility note that this diagram does not incorpo-rate all reuse options Think of how a similar diagram would look that shows the water use at your facility
12 General Electric Company Water amp Process Technologies ldquoSolutions for Sustainable Water Savings A Guide to Water Efficiencyrdquo 2007 available at wwwgewatercompdfCapabilities20Brochures_CustAmericasEnglishBulletin1040enpdf
19
Food Processors
17
Chapter 2 Water Use and Water Waste at Industrial Facilities
Figure 5 Example Water End Uses at an Industrial Facility
Cooling amp Heating
Production Processes
Auxiliary Processes
Indoor Domestic Use
Landscape Irrigation
Treatment
Water Supply
Water in Products Wastewater Stormwater Losses Losses
Beyond these categories of water end use specific industries have processes that demand significant amounts of water For example in the textile industry a typical continuous fabric bleach range machine can consume 11000 gallons of water per hour13
Measuring Facility Water Use Metering and Submetering To gain a better understanding of water use patterns at your facility it is almost always helpful to use water meters Many Lean methods rely on the availability of timely and accurate information on key performance metrics By measuring water use and flows at the facility andor process level it becomes much easier to identify water efficiency opportunities As the saying goes you canrsquot manage what you donrsquot measure There are two types of water meters Source meters measure the amount of water being supplied to the facility while submeters measure usage for specific activities such as cooling towers process use or landscape water use
Water meters can be either portable or fixed on specific equipment Use portable water meters to measure water flows for processes or operations in your facility as part of Lean efforts such as gemba walks value stream mapping and kaizen events (strategies discussed in chapters 3-4) You can strap a hand-held acoustic water meter onto a pipe at a few places where you think there might be excessive water use Compare the water data from the master meter to the water flowing through the pipes in the process to confirm where there are potential water savings opportunities These data can help you develop a water balance (described in chapter 3) See Appendix B for resources to help you determine rates of water use including calculations and unit conversions
13 North Carolina Department of Environment and Natural Resources Water Efficiency Manual for Commercial Industrial and Institutional Facilities May 2009 available at wwwp2paysorgref0100692pdf
18
Chapter 2 Water Use and Water Waste at Industrial Facilities
Figure 6 Portable Water Meter
Source Eno Scientific wwwenoscientificcom
Accurately measuring water use can help you identify areas for targeted reductions and track progress from water-efficiency upgrades Submeters can also help identify leaks and indicate when equipment is malfunctioning In some cases it may also be useful to measure water pressure a drop in pressure can indicate the presence of a leak However especially for smaller facilities it will not necessarily make sense to use meters everywhere Consider using meters when you have a need to closely track data for example before and after a process improvement event on a water-inten-sive process You can use the data provided by the meters to compare water use and see how your efforts have improved your facilityrsquos water efficiency Larger facilities can also integrate meters into centralized building management systems making it easy to electronically track water usage gener-ate reports and trigger alerts when leaks or anomalies are found For additional advice on when to use water meters consult your local water utility or the resources in Appendix A
Installing the correct meter and ensuring it functions properly are critical to accurate water measurement There are many types and sizes of meters intended for different uses so it is impor-tant to choose the correct one Improper sizing or type of meter can cause problems For example
14 Smith Timothy A Plumbing Systems and Design Water-Meter Selection and Sizing 2008 wwwpark-usacomhomeaspxelid=71amparl=108
19
Chapter 2 Water Use and Water Waste at Industrial Facilities
an undersized water meter can cause excessive pressure loss reduced flow and noise Oversized me-ters are not economical and do not accurately measure minimal flow rates14 It is also important to ensure that water meters are properly calibrated according to the manufacturerrsquos recommendation and that appropriate maintenance practices are followed on metering equipment Most meters have internal mechanical parts and will begin to under-register the amount of water used as the meter gets older and the mechanical parts wear down When abnormal water measurements are detected check the metering equipment to ensure that the results are not due to metering equipment failures
By metering water use at the facility and process levels facility personnel can compile data to inform Lean improvement efforts Here are some practical tips for using water meters as a part of Lean efforts
bull Use flow meters and water quality or cleanliness standards to establish standard work for water usage flow and pressure levels taking into consideration ldquoset pointsrdquo recom-mended by equipment specifications and facility operating procedures These baseline levels give important context of what accounts for ldquonormalrdquo operating parameters against which improvements and new water losses can be assessed
bull Use data that meters provide to determine the appropriate frequency for aggregating and reporting water measures (eg hourly daily or weekly) that best meets your facil-ityrsquos needs
bull Show employees how to read and use water meters as part of Lean activities such as gemba walks value stream mapping and kaizen events so that they can identify water savings opportunities
bull Post water use reduction goals and water usage information on the factory floor on Lean production control boards or in other accessible places to raise awareness of water use and efficiency among employees
bull Track data from water meters over time Portfolio Manager an online building per-formance benchmarking tool available from the ENERGY STAR program can help you track and benchmark water consumption data For more information on the Portfolio Manager see Appendix A
20
Chapter 2 Water Use and Water Waste at Industrial Facilities
Costs of Water Waste As noted in chapter 1 costs associated with water use include more than the direct costs you pay for water supply but also the costs of water as it travels through processes and operations (see Figure 7) Box 7 provides examples of water costs such as energy pollution control regulatory compliance and raw material costs
Figure 7 Costs Associated with Water Use
Costs Associated with Water Use
Price of Incoming Water
Sewer Service Charge
Labor and other costs associated with water processing and treatment
Cost of energy and chemicals needed to process water
The ldquoprice on the water billrdquo
The cost of water use at a facility can be much greater than the amount on the water bill
Estimating the many components of total water cost for a facility can begin with the cost of water purchased from utilities but should also include the cost of steps required to process use and discharge the water These costs can amount to a good deal more than what appears on a utility bill When estimating water costs it is important to consider these and other indirect costs throughout all functions of a facility Be sure to use estimated future rates when assessing water costs in order to project the level of savings that will be possible when improvements are made
21
Chapter 2 Water Use and Water Waste at Industrial Facilities
Common Costs Associated with Water Use (Box 7)
Raw Material Costs
3 Water purchased from utilities marginal costs of purchasing additional wa-ter versus costs of conservation
3 Cost of water treatment filtering and softening before use
3 Costs for chemicals needed to treat and manage water
Energy Costs
3 Cost of energy to heat water
3 Cost of energy to pump water from its source or within the facility itself
3 Energy and labor costs for operating and maintaining water-using equip-ment
Pollution Control Costs
3 Wastewater and stormwater service rates including surcharges
3 Total cost of treating wastewater for disposal including labor energy chemi-cals equipment and residual disposal
3 Marginal costs of increasing effluent treatment capacity when water de-mand increases
Regulatory Compliance Costs
3Labor costs for regulatory compliance activities such as completing permit applications monitoring compliance and reporting wastewater discharges to regulatory agencies
Source Adapted from North Carolina Department of Environment and Natural Resources Water Efficiency Manual for Commercial Industrial and Institutional Facilities May 2009 available at wwwp2paysorgref0100692pdf
Full costs associated with water use often vastly outweigh the direct costs The direct cost of pur-chasing water from a utility may not seem significant enough alone to merit the effort to reduce water use but when the full cost of water is assessed the financial savings can be substantial Table 3 shows an example of the various costs of water in an industrial process In this example the esti-mated savings from implementing improvements using direct water and sewer costs alone is only 56 percent of the estimated savings using the full cost of water The flexible cost savings of conserved water is estimated to be 40 percent of total treatment cost Flexible treatment costs refer to expenses that vary according to the volume of water treated (eg energy used to pump and treat water treat-ment chemicals) fixed costs (eg capital equipment used for treatment) do not typically vary as wastewater throughput changes
Chapter 2 Water Use and Water Waste at Industrial Facilities
Table 3 Costs Associated with Water Used in an Industrial Process
Activity Unit Cost ($1000 Gallons)
City Water Purchase $355
Sewer Rate $399
Deionized using reverse osmosis
Equipment $057
Energy $120
Labor $143
Total deionized water $231
Deionized water (flexible cost) 40 x $231 = $092
Wastewater treatment
Sludge disposal $346
Treatment chemicals $244
Energy $032
Labor $625
Total wastewater treatment $1247
Wastewater treatment (flexible cost) 40 x $1247gallon = $498
Total cost of water $1344
Flexible cost savings of conserved water is estimated to be 40 percent of total treatment cost
Source Adapted from North Carolina Department of Environment and Natural Resources Water Efficiency Manual for CommercialIndustrial and Institutional Facilities May 2009 available at wwwp2paysorgref0100692pdf
22
23
Chapter 2 Water Use and Water Waste at Industrial Facilities
Appendix B contains a Water Cost Calculator that provides a template for calculating common costs associated with water use at industrial facilities It may also be useful to estimate the potential water and dollar savings that would result from implementing water efficiency measures at your facility see Appendix C for some equations that you can use to guide these estimates
In some water-stressed areas industrial facilities may face the possibility of an even greater water-related costmdashthat of lost revenue from the need to curtail production in the event of water supply disruptions Competition for water across residential agricultural industrial and environmental needs during periods of water scarcity may lead local water managers to impose limits on industrial water use Understanding the vulnerability to disruption of local water supplies can be an important consideration when assessing the true costs of water use when expanding or developing new facili-ties
The next chapter discusses strategies for understanding how water is used at your facility and iden-tifying opportunities to reduce water use and improve operations
To Consider
3 What are the primary water end uses at your facility
3 What processes and facility operations use the most water
3 What costs are associated with your facilityrsquos water use What indirect costs may be unaccounted for
Lean and Water Toolkit
25
CHAPTER 3
Finding Water Waste on the Factory Floor
Some of the most substantial reductions in water use can be found right on the factory floor This chapter describes several simple techniques to foster an understanding of where water goes in a facility and where it can be saved including the following
bull Water Gemba Walks bull Developing a Water Balance bull Water Waste and Value Stream Mapping bull Root Cause Analysis
While all of these techniques evaluate aspects of facility water use and can support your Lean efforts each has a different level of detail time and staff investment requiredmdashranging from a facility walk to a multi-day value stream mapping event Consider the level of effort desired before getting started to conduct the most effective analysis for your facilityrsquos needs
Water Gemba Walks A useful way to identify ways to reduce water consumption is a ldquogemba walkrdquo A water gemba walk is an exercise in which employees and managers walk the factory floor together to observe and inventory inefficiencies related to water use Gemba is a Japanese term meaning ldquothe real placerdquo in the context of Lean manufacturing gemba typically refers to the place where work happens (eg factory floor) Water gemba walks enable a team to quickly locate ldquolow-hanging fruitrdquo that save water at a small cost They help facilities to
bull Identify major sources of water loss such as leaks that can be repaired for significant savings
bull Acquire a more complete understanding of the major end uses of water and flows of water in the facility than can be achieved solely by analyzing water utility bills
bull Instill floor managers and workers with the importance of looking for and noticing leaks and inefficiencies helping to create a culture of water efficiency
Before you conduct your gemba walk first determine the purpose and scope of the walk How large an area will the walk cover and how long will it take How long will the team look at certain aspects of plant operations What information or data would equip the team to best see wastes and opportunities Second obtain copies of relevant documents and data including the last year of water utility bills or water consumption logs the floor plan of the facility if available and process diagrams for focus areas Third select the members of the gemba walk team A small team is best with approximately five to seven people constituting an ideal team size Include workers and man-agers familiar with the area outsiders new employees and veterans as well as an EHS representa-
26
Chapter 3 Finding Water Waste on the Factory Floor
tive in order to get a diversity of perspectives A brief training can orient your team to the purpose of a gemba walk and help them feel empowered to spot wastes throughout the walk
Once you have your team assembled use the Steps to Take During a Gemba Walk in Box 8 to find water waste and improvement opportunities at your facility
Steps to Take During a Gemba Walk (Box 8)
1 Identify all water-consuming equipment high-use areas and meterlocations
2Note all water losses evaporative losses and water incorporated in product excessive water pressure and leaks
3Observe shift clean-ups and process changeovers
4Quantify water flow rates and usage
5Note the water quality used in each process step
6Determine water quality needs for each process and quality of wastewater discharged
When employees are engaged and interested in finding wastes and identifying ways to improve water efficiency the benefits of your gemba walk can continue well beyond the exercise itself The training that your employees receive to conduct a gemba walk or other Lean exercises combined with immediate engagement in the exercises themselves can help to create a culture in which em-ployees routinely seek out ways to improve water efficiency
Consider conducting your gemba walk during a time when the facility is shut down as this can be a good time to find unexpected losses You can also collect data during your gemba walk on the nature of the water in use at various steps throughout each process knowing when treated water is necessary and when lower-quality water might be okay will help you identify reuse opportuni-ties later Table 4 Key Areas to Check During a Water Gemba Walk lists several common areas in industrial facilities in which water inefficiencies can be observed during a gemba walk
Chapter 3 Finding Water Waste on the Factory Floor
Table 4 Key Areas to Check During a Water Gemba Walk
Process and Equipment Use bull Cleaning Washing Rinsing bull Metal Finishing bull Painting bull Dyeing and Finishing bull Photo Processing bull Process Water Reuse bull Product Fluming (Water Transport) bull Pretreatmentfiltration systems bull Pump and Conveyor Lubrication bull Water Use in Products
Other Facility Support
bull Floor Washing bull Air Emission Wet Scrubbers bull Building Washing bull QAQC Testing bull Laboratories bull Landscaping and Irrigation bull Dust and Particulate Emission
Control bull Decorative Fountains and Ponds bull Vehicle Washing bull Cooling Water for Air Compres-
sors and Vacuum Pumps bull Hazardous Waste Storage and
Effluent
Cooling and Heating bull Single-Pass Cooling bull Cooling Towers bull Boilers Hot Water Steam Systems bull Air Washers bull Boiler Scrubbers
Sanitary and Domestic Kitchens bull Toilets bull Food Preparation and Cleaning bull Faucets bull Dishwashers bull Urinals bull Ice Machines bull Showers bull Faucets bull Wash-up Basins bull Food Disposals
Source Adapted from North Carolina Department of Environment and Natural Resources Water Efficiency Manual for Commercial Industrial and Institutional Facilities May 2009 available at wwwp2paysorgref0100692pdf
Leak detection during a gemba walk can be one of the best low-cost high-yield steps for reduc-ing water waste in a facility Leaks exist in all facilities and can result in water loss ranging from a fraction of a percent of a facilityrsquos total water use all the way up to a substantial portion Low water pressure dirty water and a high quantity of water that cannot be accounted for are all signs of a leak Bluing tablets or dyes can be used to easily check for leaks in tanks toilets or other water holding vessels Sonic or acoustic leak detection equipment can be used to check for leaks in under-ground pipes A simple drip gauge can help you conduct a basic estimate of how much water is lost due to a leak Many leaks can be repaired with simple measures such as tightening or replacing fit-tings15 In some cases it may be best to enlist the services of a professional leak-detection company to identify more complex leaks
15 North Carolina Department of Environment and Natural Resources Water Efficiency Manual for Commercial Industrial and Institutional Facilities May 2009 available at wwwp2paysorgref0100692pdf
27
28
Chapter 3 Finding Water Waste on the Factory Floor
Box 9 lists some examples of successful gemba walk and leak detection efforts
Examples of Water Gemba Walk Success (Box 9)
3Kirtland Air Force Base performed leak-detection gemba walks in which teams walked water lines with acoustic listening devices to find leaks sur-veying 90 percent of water distribution lines on the base The teams found that 31 leaks were dripping away nearly 16 percent of the basersquos water at a rate of 333 gallons lost per minute Repairs after the survey saved over 179 million gallons per year
3In one DTE Energy plant water pressure on the upper floors of the building was problematically low Observations on the factory floor revealed that an open valve on a new water treatment system was responsible for the low water pressure By installing a $3000 variable valve the company saved half a million dollars that it would have spent on a booster pump
3Del Monte Foods used a water gemba walk to identify potential water sav-ings in a recirculation line that was forked from eight inches to two four-inch pipes By combining the freshwater line with the main line the facility was able to save 300000 gallons per day
Sources US Department of Energy Federal Energy Management Program ldquoDistribution System Audits Leak Detec-tion and Repair Kirtland Air Force Base ndash Leak Detection and Repair Programrdquo 2009 information provided by Jason Schulist and Michael Sklar DTE Energy May 2011 and Scott Butler Del Monte Foods ldquoThe Del Monte Production System Lean to Green Integrative Futurerdquo Presentation at Green Six Sigma Summit Presentation May 2009
Developing a Water Balance While a gemba walk will help you identify potential water-savings opportunities developing a water balance will give you a more thorough picture of overall water use at your facility A water balance is a high-level simple assessment of the input and output of water in your facility that can help to identify opportunities for improving water efficiency A water balance might be appropriate for your facility especially if you are just beginning your journey with Lean and water and have not con-ducted a more detailed water audit
A water balance is a chart table or diagram of a facilityrsquos water use that shows the flows of water into and out of each process or operation in the facility It typically includes every water-consuming component on-site and all flows out of the facility A water balance can also include data on the cost of water Figure 8 illustrates the fundamental approach to developing a water balance Water bal-ances can also be developed as part of value stream maps
29
Chapter 3 Finding Water Waste on the Factory Floor
Figure 8 Typical Water Balance Calculation
Input (A)
Process Unit
A B C
Output (C)
A ndash (B+C) = Balance (or discrepancy)
Input is ProcessFacility Water Supply Water Losses (eg to air land and product) Output is Wastewater Discharge
Water Losses (B)
When creating a water balance make note of all water use in the facility and track water flows from the source through all operations at the facility to water losses and outputs including evaporative losses input to products and wastewater discharge All uses of water in a facility should be included in a water balance Common end uses of water are discussed in chapter 2 and include processing and auxiliary processing heating and cooling indoor domestic use and landscape irrigation The water balance should capture all of the flows into and out of each process at the facility and should verify that there is a balance between flows in and flows out Compare the estimated or measured total of end uses with the incoming metered amount Be sure to account for losses such as evaporation as well as wastewater discharge The Simplified Elements of a Water Balance figure (Figure 9) below shows an example of the components of a simple water balance for a facility while Table 5 Example Water Balance Summary presents overview information on water use by process from a water balance
30
Chapter 3 Finding Water Waste on the Factory Floor
Figure 9 Simplified Elements of a Water Balance
Pretreatment 950 gallons
Landscaping
Processing
Cooling Towers
Boilers 50 gallons
50 gallons
Losses
Wastewater
Losses
Wastewater
Water in Products
Stormwater
The process of putting together a water balance helps to capture a baseline of a facilityrsquos current water usage (see Box 10) A water balance will help you identify sources of risk such as leaks and compliance concerns Some companies choose to conduct water balances at varying levels of detail on a regular basis in an effort to locate ways to reduce water use and discover hidden water-savings dividends
Chapter 3 Finding Water Waste on the Factory Floor
Table 5 Example Water Balance Summary
Water Uses Input (GallonsYear)
Output (GallonsYear)
Loss (as a of Water Use)
Cooling tower make-up and boiler make-up
8484000 8248000 236000 (28)
Process use 6298000 6186000 112000 (18)
Cooling air compres-sors and pumps
7654000 7455000 199000 (26)
Landscaping 1675000 1533000 142000 (85)
General washing sanitation and maintenance
1101000 1095000 6000 (05)
Food preparation dishwasher
624000 613000 11000 (18)
Subtotal 26660000 25130000 1530000 (57)
Total Water Loss 1530000 GallonsYear
A spreadsheet developed by GEMI to help you create a water balance for your facility is available at wwwgemiorgwaterplannercalc-waterbalanceasp
Benefits of compiling a water balance include
bull Ability to identify processes that present the best targets for reducing water use
bull Establishment of baseline water use data from which improvements in efficiency can be benchmarked
bull Creation of a tool with which to compare different water-efficiency improvement strategies
31
32
Chapter 3 Finding Water Waste on the Factory Floor
Information to Collect for a Water Balance (Box 10)
To complete a water balance collect data on the volume of water flows for each process or operation in your facility including
3 Water and sewer bills from the previous one to three years
3 Numbers sizes and locations of water meters
3 Sources of incoming water
3 Diagrams of plumbing and water pipes as well as irrigation schematics
3 List of water-consuming processes
3 Information about unsewered wastewater (wastewater not discharged to municipal sewer systems such as through separate permitted discharges)
An outside expert could be the best option to help conduct a water balance for some facilities Contact your local water utility to ask whether it provides assistance for developing water balances some utilities provide this service (or related services) free of charge In many cases a water bal-ance can make it easy to identify steps to take to improve water efficiency If there is a discrepancy between the input and output of water in your facility that becomes apparent after preparing your water balance you might use that baseline to create a target future state that reduces the discrepan-cy by a set percentage Several of the resources in Appendix A provide information about developing water balances more involved assessments such as water footprints (see Box 11) and audits and benchmarking and tracking tools such as ENERGY STARrsquos Portfolio Manager
More Detailed Water Audits Water Assessments and Water Footprints
In the event that a more detailed assessment of water use and risks is desired an organization could consider conducting a water audit water source vulnerability assessment andor water footprint analysis While the results of these methods can inform the use of Lean to improve facility water efficiency they are typically conducted as stand-alone efforts that can require substantial effort and investment These methods are only described briefly below in this toolkit
bull A water audit typically involves a more comprehensive time-intensive facility-wide effort to as-sess a facilityrsquos water use and efficiency improvement opportunities A water audit may include activities described in this toolkit such as metering and baselining but it typically focuses on the full facility in a discrete brief period (eg during a 1ndash2 week effort) You may choose to follow specific standards when conducting the audits such as those of the American Society of Heating Refrigerating Cooling and Air-Conditioning Engineers
bull A water source vulnerability assessment generally looks outside of the facility at factors that have potential to affect the supply and cost of water that the facility and surrounding commu-nity relies upon This assessment can help a facility determine the risks of water supply disrup-tions or costs fluctuations and identify steps that may help to reduce these risks
33
Chapter 3 Finding Water Waste on the Factory Floor
bull Water footprinting analysis refers to the total volume of fresh water that is used directly and indirectly to run and support the business encompassing both water use within an industrial facility and throughout its supply chain You might consider conducting a water footprint to gain a more complete understanding of the places where water is used inefficiently throughout your supply chainmdashupstream among suppliers and downstream by users of the facilityrsquos output or products While a water footprint can be time-consuming and difficult to prepare it can be helpful in identifying improvement opportunities throughout the supply chain Box 11 provides tips for conducting water footprint analyses while chapter 5 discusses strategies for engaging suppliers to reduce water use and risks
Water Footprinting Tips (Box 11)
What information should water footprint analyses contain
3Track surface and groundwater sources rainwater stored in the soil and polluted water as inputs and outputs from a facility This can help address concerns about water scarcity and use
3 Include the geographical location of water withdrawals and discharges as well as direct and indirect water use
3 Work with suppliers to get data on water inputs and outputs from their operations often this is where the most water is used
3 Consider also estimating your productsrsquo end-use footprint which is any water used by consumers when they use the product
3 Note the scarcity and drought vulnerability of your suppliersmdasha water foot-print can be a valuable tool to identify business risks
3 Present the water footprint information in a clear and compelling manner such as a diagram showing water flows and quantities
For additional guidance on water footprinting see the Water Footprint Network website wwwwaterfootprintorg
Water Waste and Value Stream Mapping Like water balances value stream mapping can be a powerful tool for identifying water waste and savings opportunities Value stream mapping is a Lean method for creating a visual representation of the flows of information and materials across all the activities involved in producing a product for a customer In a value stream mapping event two maps are developed a map of the current state showing key data about existing processes and a future state map showing changes that can be made to reduce waste Value stream maps can be developed at the value-stream level (eg for a product family) or at the process level after your team has selected a process to investigate more closely
34
Chapter 3 Finding Water Waste on the Factory Floor
By adding water data to value stream maps value stream mapping can help you
bull Gain a better understanding of where the greatest water waste occurs
bull Identify areas where improvements can be made to reduce excess water use and other wastes
bull Develop an implementation plan for process improvements to reduce wastes in the value stream prioritizing water efficiency projects alongside other Lean and environ-mental projects
bull Quantify the expected savings from implementing those improvements
bull Create a culture of efficiency as team members from supervisors to floor workers be-come engaged in cutting waste
Adding Water Waste to Value Stream Maps Value stream maps depict all the activities in a value stream or a process along with key metrics that primarily relate to time Incorporating water considerations into a value stream mapping exer-cise is as simple as adding the amount of water used at each step onto the value stream map Figure 10 Adding Water Use to Value Stream Map Process Box shows a process data box with data on the water use by a particular process included Costs associated with the water used by each process or process step could also be added however to be fully representative these costs should include indirect costs such as those for support functions
Figure 10 Adding Water Use to Value Stream Map Process Box
CT = 4 min CO = 45 min Uptime = 61 Water Use = 9K gallonsday
2 people
Plating
Water use per day
35
Chapter 3 Finding Water Waste on the Factory Floor
Figure 11 Value Stream Map Incorporating Water Use Metrics shows an example of a current state value stream map that has been modified (with additions in blue) to include data on the amount of water used at each step Most activities that consume water are tracked in the map however note that this map does not include water loss as a result of leaks and evaporation or other losses that can occur between process steps
Figure 11 Value Stream Map Incorporating Water Use Metrics
Mar
ket F
orec
ast
Tota
l Lea
d Ti
me
= 68
day
sVa
lue
Adde
d Ti
me
= 15
min
Tota
l Wat
er U
se =
59K
gal
Cus
tom
erA
2 pe
ople
CT
= 4
min
CO
= 4
5 m
inU
ptim
e =
61
Wat
er U
se =
30K
gal
Dry
ing
2 pe
ople
Cle
anin
g
CT
= 2
min
CO
= 6
0 m
inU
ptim
e =
74
Wat
er U
se =
10K
gal
3 pe
ople
CT
= 7
min
CO
= 5
0 m
inU
ptim
e =
48
Wat
er U
se =
15K
gal
Rin
sing
I I
I 3
peop
le
Ship
ping
7 m
in4
min
2 m
in
15 d
ays
8 da
ys10
day
s 30
day
s
Prod
uctio
nC
ontr
ol
WK I
5 da
ys
D
I D
30 d
ays
WK
Rec
eivi
ng
CT
= 2
min
CO
= 3
0 m
inU
ptim
e =
93
Plat
ing
5 da
ys
2 m
in
Cus
tom
erB
Su
pplie
r1
Supp
lier
2
Lead
Tim
e
36
Chapter 3 Finding Water Waste on the Factory Floor
Many teams develop value stream maps using sticky notes to represent each step in a process This enables team members to move things around easily and helps them create the most accurate pic-ture of the process possible
To create a visual representation of the areas in the value stream map that use the most water try using different colors of sticky notes for high- and low-water using steps See Figure 12 for an example of the use of sticky notes to create a value stream map with water data added to several of the notes
Figure 12 Process Boxes Showing Water Waste
Another way to show water inputs and outputs associated with your facilityrsquos processes is by drawing lines into and out of each process data box on your value stream map In Figure 13 the red circles show where water and wastewater flows have been identified other waste streams are identified as well See EPArsquos Lean and Chemicals Toolkit for more information on this approach16
16 Value stream mapping is described in chapter 3 of the Lean and Chemicals Toolkit available at httpwwwepagovleanenvironmenttoolkitschemicalsch3htm
37
Chapter 3 Finding Water Waste on the Factory Floor
Figure 13 Water Inputs and Outputs Identified on a Value Stream Map
After creating a current state map your value stream mapping team will create a future state map that envisions ways to eliminate waste in the value stream and identifies areas for future process improvement projects such as kaizen events or just-do-its (described in the next chapter) With water data included on the current state value stream map your team will be able to easily identify opportunities for increased water efficiency and can work together to identify prioritize and develop an implementation plan for improvement projects that can meet both Lean and environmental goals Incorporating water waste into value stream mapping allows water efficiency projects to be combined with and considered together with other operational improvements
The implementation plan is a key product from the value stream mapping event Take care to de-velop an implementation plan that details the steps to carry out the improvements you have identi-fied being sure to assign responsibility for each step of the plan Consult with facility EHS staff and permitting authorities before making any changes that could affect facility emissions or wastewater discharges
For more information on adding environmental metrics to value stream maps see chapter 3 of EPArsquos Lean and Environment Toolkit17
17 Available on the EPA Lean Manufacturing and the Environment website at wwwepagovleanenvironment
38
Chapter 3 Finding Water Waste on the Factory Floor
Root Cause Analysis When you find a water waste in your facility whether during a gemba walk or a value stream map-ping exercise itrsquos important to ask ldquoWhy did this happenrdquo There is a set of Lean tools that can help you answer this question Root cause analysis is the process of identifying a problem and working through possible components to identify the most basic reason why the problem is occurring Once the cause of the problem is identified you can prevent its recurrence Two tools of root cause analy-sis include fishbone diagrams and the ldquo5 whysrdquo approach
Explore water waste yoursquove found in a Fishbone Diagram (also known as an Ishikawa Diagram) which shows potential causes of a problem by grouping causes into major categories to identify the source of inefficiencies To investigate water waste using a fishbone diagram first identify the specific problem you wish to investigate perhaps a spike in water use at the facility or a leaky pipe or valve Write the primary problem you wish to investigate in the head of the diagram usually on the right side The ldquobonesrdquo of the diagram represent groupings of potential causes of the problem common categories include the following
bull Measurements
bull Material
bull Man (or Personnel)
bull Methods
bull Machines
bull Environment
Along each grouping many detailed sub-causes are listed Figure 14 on the next page Fishbone Diagram of Excessive Water Use shows an example of a fishbone diagram that one facility used to assess its water use
Another root cause analysis tool is the ldquo5 whysrdquo technique The approach uses a systematic ques-tionnaire technique to search for root causes of a problem Simply ask ldquoWhyrdquo when considering the primary problem ldquoWhy is excessive water used hererdquo Follow up with additional ldquoWhyrdquo inquiries until you drill down to the root cause of the problem The goal of the exercise is to pursue further until the root of the problem is identified Be aware that there is sometimes more than one cause of a problem
39
Chapter 3 Finding Water Waste on the Factory Floor
Asking Why Five Times (Box 12)
1 Why are we using so much water The parts need to be cleaned before painting
2 Why do the parts need to be cleaned The parts fail quality checks if they arenrsquot cleaned before being painted
3 Why do painted parts fail quality checks The paint doesnrsquot adhere when part surfaces are not prepared properly
4 Why do the surfaces of the part need to be prepared The surfaces get contaminated by oils used in the previous process
5 Why are oils used in the previous process The oils are used to prevent corrosion during storage
Based on an example from Robert B Pojasek ldquoAsking lsquoWhyrsquo Five Timesrdquo Environmental Quality Management (Autumn 2000) 83
Figure 14 Fishbone Diagram of Excessive Water Use
Measurements Material Personnel
Environment Methods Machines
Excessive Water Use
No metrics
Budget baseline
Untreated water
Galvanized piping
Operator understanding
Obsolete article
Operator training
RCM
Notification procedures
Ineffective ventilation
No ventilation
No headers
Plugged pipesdisks
Eroded orifice disks
Failed controllers
Failed valves
Failed probes
Source Schulist Jason Lean Towards Sustainability How to Use Lean and Six Sigma Methods to Drive Your Sustainability Journey DTE Energy 2009
40
Chapter 3 Finding Water Waste on the Factory Floor
Completing a root cause analysis exercise should be a precursor to brainstorming potential solu-tions to water waste problems at your facility By using these tools you can ensure that you address the root cause of the problem first instead of merely treating the symptoms Chapter 4 explains how to take the knowledge about your facilityrsquos water use that you have gained through the tools listed in this chapter and apply that knowledge to reduce water use
To Consider
3 Where are the largest sources of water waste in your facility If you donrsquot know what steps will you take to find out
3 Are there processes or areas at your facility that could use non-potable or lower quality recycled water
3 What resources might be available in your area to help you conduct a water balance or water audit
3 Where in your facility might be a good target for a water-focused value stream mapping activity
41
CHAPTER 4
Lean and Water Efficiency Improvement Strategies
After yoursquove taken the important first steps to understand how your facility uses water there are a number of ways to reduce your water use through Lean and water efficiency efforts This chapter describes the following
bull Kaizen Events and Just-Do-Its to Reduce Water Use bull Integrate Water Efficiency into Everyday Lean Practices bull Lean and Water Applications for Facility Operations and Support Processes
Kaizen Events and Just-Do-Its to Reduce Water Use There are three key questions to ask to identify water-efficiency opportunities
Key Water-Efficiency Questions (Box 13)
3 Can we stop or prevent water losses (eg leaks)
3 Can we reduce water use (eg changing equipment plumbing processes andor behaviors)
3 Can we recycle or reuse water for another purpose (eg recirculating water within a process reusing process water for another application capturing rainwater etc)
Leanrsquos implementation-based methods of kaizen events and just-do-its are powerful strategies for putting water efficiency into practicemdashjust-do-its for easy changes and kaizen events for more in-volved projects A kaizen eventmdashalso known as a rapid process improvement eventmdashis a 2ndash5 day period when a cross-functional team examines a process and makes rapid changes to improve it
Before initiating significant process changes remember to consult with your local utility or environmental agency to make sure that all facility permitting requirements are met EHS staff at your facility can provide guidance on which changes may trigger regulatory or worker health and safety issues
42
Chapter 4 Lean and Water Efficiency Improvement Strategies
Water Kaizen Event Examples (Box 14)
GE conducted week-long water kaizen events at three of its largest water-consuming sites in 2009 including monitoring and assessing water use facility-wide and developing water-reduction projects with associated financial benefits
3 These kaizen efforts combined with flow monitoring and water-conservation efforts at the largest water-consuming site helped GE reduce water use 30 percent from 153 billion gallons in 2006 to 107 billion gallons in 2009
Through an environment health amp safety kaizen event at one site United Technologies Corporation eliminated 40000 gallons of wastewater per year and saved $50000 per year by changing how the facility managed test cells an underground storage tank and its waste streams
3 The facility no longer sends water to the storage tank and waste fluids from the process (eg oils) are collected separately to allow for reuse recycling or reclamation
3 These efforts are expected to further reduce wastes up to a total savings of 75000 gallons and $150000 per year
GE ldquoEcomagination 2009 Annual Reportrdquo pp 16-17 httpgeecomaginationcomreporthtml World Business Council for Sustainable Development (WBCSD) ldquoEco-efficiency Gains Ground United Technologies Corporation (UTC)rdquo WBCSD Case Study August 10005 available from wwwwbcsdorg
Two types of kaizen events to reduce water use include
bull Water Kaizen Events Consider conducting some kaizen events that are specifically designed to find and implement water efficiency opportunities (see Box 14 for examples) Good places to target include processes or areas of facility operations that use significant amounts of water Some companies such as GE use kaizen events to look for water-efficiency opportunities across a single facility Water balances and value stream maps with water data can provide good ideas for where to focus water kaizen implementation activities
bull Kaizen Events on Water-Using Processes Even if the main objective of a kaizen event is not water efficiency itrsquos helpful to keep an eye out for water-efficiency opportunities There may be opportunities to reduce water use such as by adjusting equipment or reusing water while also improving other aspects of the process Use the Key Water-Efficiency Questions in Box 13 above to identify water-savings opportunities
Often when yoursquore looking for water waste perhaps while using strategies described in the last chapter yoursquoll find easy solutions that can be implemented right away These are good things to address with ldquojust-do-itrdquo Lean activities Just-do-its or ldquoquick winsrdquo are actions that individuals can take immediately to improve a process or operation Many actions to stop water losses (such as fixing leaks or shutting off water that shouldnrsquot be running) or simple equipment adjustments to conserve water (such as reducing water flow) fall in this category
43
Chapter 4 Lean and Water Efficiency Improvement Strategies
Water Efficiency Strategies Ways to reduce water use range from simple strategies such as adjusting the flow of water or install-ing water-saving devices on equipment to more involved options such as reusing water or changing to a low-water or waterless process There are five general types of water-saving strategies (see Fig-ure 15) Consider these strategies as you brainstorm improvement ideas in kaizen events and other Lean efforts Key things to keep in mind include
bull Consider water efficiency improvements in the context of other process improvements and Lean performance goals in order to get the best results
bull Evaluate how the process changes might affect wastewater volume or quality or have other environmental impacts (For example switching from a water-based lubricant to an oil-based lubricant or solvent could have implications for worker health andor the environment)
bull Consider which water-efficiency best management practices and technologies make sense for your facility
bull Adopt visual controls ldquomistake proofrdquo devices on equipment (eg automatic shut offs) andor procedures to help ensure that process changes are effective and can be easily maintained
bull After testing potential solutions making changes and evaluating actual performance be sure to develop or update the standard work for the activity so that workers can eas-ily identify the current best way to perform an activity (Standard work is also further discussed below)
Figure 15 Five Water-Savings Strategies
Mor
e D
ifficu
ltBi
gger
Impa
ct 3 Adjust water flow
3 Modify existing equipment or install water-saving devices
3 Change to more water-efficient equipment
3 Reuse or recycle water (treat if needed)
3 Shift to a low-water or waterless process
When evaluating water reuse opportunities itrsquos important to consider both water quality and water quantity Not all processes need the cleanest highest-quality water In many cases you may be able to reuse the ldquowasterdquo water from one process or operation as an input to another process or for another use at your facility (eg air handling condensate reverse osmosis reject water etc) as long as you match the quality of water needed for its intended use You may need to do some testing
Chapter 4 Lean and Water Efficiency Improvement Strategies
and additional treatment of the process water to make sure it is acceptable for the next use When evaluating the feasibility of using process water for irrigation or other outdoor uses check with your local utility or water pollution control agency about restrictions on water reuse applica-tions The water may require testing to ensure it meets pollutant limits
Waterless Cleaning of GatoraderegBottles (Box 15)
PepsiCo switched from cleaning Gatoradereg bottles with water to a new method of cleaning with purified air The new cleaning process works so well that it is being adopted by bottling facilities around the world achieving a 20 percent reduction in water consumption throughout the process and saving billions of gallons of water
You can use the Table for Evaluating Water Reuse Potential below as a simple guide to identify possible ways to reuse water to meet the water quality and quantity needs of processes You may also want to consider using reclaimed municipal water or water from another facility for certain uses For more information on water reuse strategies consult EPArsquos Guidelines for Water Reuse (wwwepagovnrmrlpubs625r04108625r04108pdf)
Table 6 Table for Evaluating Water Reuse Potential
Process Operation
Water Need Water Discharge
Volume Quality Volume Quality
Cooling
Boilers
Restrooms
Kitchen
Landscape
Process A
Process B
Process C
It may be possible for your facilityrsquos water to be reused by another industry or business Look for these potentially symbiotic relationships with other facilities in order to stretch the value of your water even further for the community
44
45
Chapter 4 Lean and Water Efficiency Improvement Strategies
Integrate Water Efficiency into Everyday Lean Practices A variety of Lean toolsmdashincluding standard work visual controls 5S and total productive main-tenance (TPM)mdashhelp workers identify and eliminate waste in their daily activities as described further below Along with other wastes these Lean tools can reinforce and promote strategies to reduce unnecessary water use
Waste Elimination Culture You can integrate water efficiency into the ldquoculture of Leanrdquo at your facility developing the capac-ity of your employees to identify water waste in their normal work practices and find solutions that help meet your facilityrsquos Lean and water goals When your workers are passionate about improving the way your facility uses water the gains you achieve can become self-sustaining into the future
Lean is built around the framework of eliminating waste and striving for perfection or ldquoTrue Northrdquo as discussed in chapter 1 It is most successful when employees are fully engaged in driv-ing out waste and identifying improvement opportunities In the long run developing people to be effective problem solvers is more important than implementing specific tools It is critical therefore to train employees on how to identify water waste and to encourage and motivate them to work towards your organizationrsquos water efficiency goals The use of goals or targets combined with incentives and support resources can be a powerful way to drive change and performance improve-ment Frito-Layrsquos ldquoGallon per Pound Challengerdquo Program described in Box 16 provides an example of a successful water efficiency program anchored by metrics and employee engagement
Figure 16 Sign to Encourage Water Conservation
46
Chapter 4 Lean and Water Efficiency Improvement Strategies
Frito-Lay Engaging Employees in Water Efficiency (Box 16)
Frito-Layrsquos ldquoGallon per Pound Challengerdquo established a water efficiency pro-gram for all manufacturing sites to exceed 95 percent water use efficiency The program creates a culture of conservation through awareness trainingand accountability
3Through mid-year 2007 the sitesrsquo collective water efficiency has improved to over 80 percent which translates to a reduction in water use of over 1 billion gallons per year
3 Achieving the goal of 95 percent minimum efficiency for all sites will result in an additional water savings of approximately 800 million gallons per year
3 Frito-Lay earned a 2007 Water Efficiency Leader Award from EPA for these water-efficiency efforts
The Challenge is anchored by a water efficiency scorecard which is emailed to a wide array of stakeholders monthly
3Water efficiency is calculated by dividing standard water consumption by the actual water consumption reported by the site If a site uses more water than the standard an efficiency score of less than 100 percent will result
3The scorecard includes monetary savings opportunities for sites operating below 100 percent efficiency as well as savings associated with improve-ments
3Periodically a ldquodid you knowrdquo section with best practices is distributed with the scorecard to help raise awareness
Frito-Layrsquos utility wall program involves an event held at each site each day where a cross-functional team of technicians and workers gather to compare actual water consumption over the prior 24-hours to standard consumption and the sitersquos goals
3Utility walls enable teams to identify excessive water use and develop ac-tion plans to find and correct sources of variance
3Teams identify areas where flow measurement and control devices can drive conservation and ensure that viable water-efficiency projects are com-pleted and working optimally
Standard Work Standard work refers to an agreed-upon set of work procedures (sometimes referred to as standard operating procedures) that establish the best and most reliable method of performing a task or operation Standard work helps sustain previous Lean improvements as well as serves as the founda-tion for future continuous improvement (kaizen) efforts Incorporating water-efficient practices into
47
Chapter 4 Lean and Water Efficiency Improvement Strategies
standard work for processes helps to make them common practice
Whenever you change operational practices to reduce water use or install new equipment that requires different operations be sure to update the standard work for those operations Water-efficiency strategies include both behavior changes and technological changes but even technology-based changes may involve a behavior component For example workers need to properly operate and maintain new water-efficient equipment Use standard work to reinforce desired behaviors
Visual Controls Often used as part of standard work visual controls support standardized procedures and display the status of an activity so every employee can see it and take appropriate action Visual controls make it easier to perform actions the correct way and notice when there are problems
Visual controls are essential for supporting behavior-based water Figure 17 Dual Flush efficiency strategies Examples of visual controls to encourage Toilet Visual Control water efficiency include
bull Signs to encourage employees to use less water
bull Placards on water-using equipment showing proper operation (eg could include optimum water flow level)
bull Water meters or sub-meters on high water using processes or equipment (see discussion in chapter 3)
bull Displays of facility water use and water-use reduc-tion goals on production control boards along with other performance metrics (cost quality timesafety environmental etc)
5S Another way to incorporate water efficiency into Lean is through 5S 5S is a systematic five-step pro-cess used to create and maintain a clean orderly work environment Many organizations add a sixth ldquoSrdquo for safety creating 6S (5S + Safety) The six pillars of 6S consist of
bull Safety (Respect workplace and employee) Create a safe place to work by removing workplace hazards
bull Sort (Get rid of it) Separate items that are not needed in the work area
bull Set in order (Organize) Organize the items that remain in the work area
bull Shine (Clean and solve) Clean and inspect equipment and the work area
48
Chapter 4 Lean and Water Efficiency Improvement Strategies
bull Standardize (Make consistent) Standardize cleaning inspection and safety practices
bull Sustain (Keep it up) Maintain a clean orderly and safe work area
Figure 18 Six Pillars of 6S (5S + Safety)
Source Adapted from Productivity Press Development Team 5S for Operators 5 Pillars of the Visual Workplace Productivity Press 1996
49
Chapter 4 Lean and Water Efficiency Improvement Strategies
One key step that is relevant to reducing water use is ldquoShinerdquo since water is often used in cleaning and rinsing Many industrial and manufacturing businesses use large amounts of water to flush lines rinse parts and tanks and clean equipment floors and other areas These cleaning and rins-ing practices often are large sources of wasteful water use and therefore opportunities for water savings Educate employees on how to do the ldquoShinerdquo step using less water considering some of the Water-Efficient Cleaning Strategies in Box 17 below
Since employees work attentively to maintain a clean and neat work environment in 5S it presents a good opportunity to spot water waste In daily 5S shop floor sweeps encourage employees to check for water leaks in pipes hoses plumbing fixtures and equipment as well as turn off water that shouldnrsquot be running Add checking for leaks to 5S checklists and other approaches implemented under ldquoStandardizerdquo and ldquoSustainrdquo steps so it becomes standard practice
Water considerations are also relevant to ldquoSafetyrdquo Preventing water from being on the shop floor and walkways can eliminate slipping hazards Repairing hot water and steam leaks can prevent burns
Water-Efficient Cleaning Strategies (Box 17)
Dry Clean-up First
3Use brooms brushes squeegees andor other tools to remove materi-als and debris in dry form before using water for secondary cleaning (This saves water reduces wastewater and enables recovery of process materi-als)
Eliminate Unnecessary Water Use for Floor Washing
3 Sweep or use a water broom instead of hosing floors
3 Spot mop if necessary
ldquoMistake-Proofrdquo Your Equipment
3 Use hoses that have automatic shut-off nozzles
3 Use efficient spray nozzles high-pressure washers andor flow restrictors to clean efficiently while reducing water use (High-pressure low-volume sprays generally work better than low-pressure high-volume sprays)
Use Efficient Spray Washing and Rinsing Techniques
3 Use water wisely and turn off water when not in use
3 Do not use a hose as a broom doing so wastes time water and energy
3 Optimize spray and rinsing techniques and document the best practices in the standard work for the process
For more suggestions see North Carolina Department of Environment and Natural Resources ldquoWater Efficiency Manual for Commercial Industrial and Institutional Facilitiesrdquo May 2009 wwwp2paysorgref0100692pdf
50
Chapter 4 Lean and Water Efficiency Improvement Strategies
Total Productive Maintenance As a key strategy for finding and preventing water losses as well as other equipment failures Total Productive Maintenance (TPM) is also relevant to water efficiency TPM is a Lean method that focuses on optimizing the effectiveness of manufacturing equipment TPM focuses on team-based maintenance that involves employees at every level and function
A key practice in TPM is to maintain equipment in a manner that enables workers to quickly iden-tify and correct problems that may result in leaks or spills Since many facility operations use water not just production processes itrsquos important to extend the preventative maintenance practices of TPM to non-production areas (eg restrooms and irrigation) when looking for water issues Box 18 outlines Proactive Maintenance Tips to Reduce Water Use that can be incorporated into a TPM program For more tips and suggestions see EPArsquos ldquoWaterSense at Work Best Management Practices for Commercial and Institutional Facilitiesrdquo available at wwwepagovwatersense
Proactive Maintenance Tips to Reduce Water Use (Box 18)
3Adopt a user-friendly system for reporting water leaks and fix leaksimmediately
3Inspect hot and cold water lines steam lines and traps water-using equip-ment and plumbing fixtures routinely to identify potential problems and keep them operating properly
3When performing maintenance on water-using equipment replace worn parts and check to make sure that water-saving features (eg automatic shut-off valves) are operating properly
3Shut off water supply to equipment in areas that are not in use
Lean and Water Applications for Facility Operations and Support Processes As noted earlier the most water-consuming aspects of your facility may not be production pro-cesses other facility water uses include cooling towers (which are often the largest water end use) boilers support processes restrooms kitchens and irrigation Water balances value stream maps and other strategies in chapter 3 describe how to identify the largest sources of water waste at your facility These represent good targets for kaizen events to reduce water use Consider the Questions to Identify Water-Savings Opportunities in Facility Operations and Support Processes in Box 19 to identify initial opportunities
51
Chapter 4 Lean and Water Efficiency Improvement Strategies
Questions to Identify Water-Savings Opportunities in FacilityOperations and Support Processes (Box 19)
Cleaning
3Can process cleaning or facility cleaning be accomplished without using water (ie using pressurized air to clean products or containers sweeping debris off the floor)
Process Equipment
3Can process equipment reuse water (closed loop) or use reclaimed water from other parts of the facility
Cooling and Heating
3 Has your facility replaced once-through cooling systems with a multi-pass cooling tower or closed systems
3 Can you optimize the blow-downbleed-off controls on boilers and cooling towers
3 Have you considered switching to air-cooled equipment instead of water-cooled equipment
3 Does your facility reuse condensate water
Restrooms and Kitchens
3 Do restrooms have water-efficient fixtures (eg WaterSense labeled toilets and urinals faucet aerators and showerheads)
3 Do kitchens use new water- and energy-efficient dishwashers (eg ENERGY STAR qualified models)
Landscaping and Irrigation
3 Has your facility designed its landscape to consider the local climate and grouped plans by similar watering needs
3 Does your facility use drip irrigation low-flow sprinklers and optimized watering schedules to minimize water use
Leaks
3Have you identified and repaired leaks throughout your facility
Appendix D Water Efficiency Opportunity Checklist is a more extensive checklist for identifying water-savings opportunities throughout your facility
52
Chapter 4 Lean and Water Efficiency Improvement Strategies
Along with the questions in Box 19 and Appendix D a wide array of resources are available that provide information on low-cost water-efficiency measures for common components of facility operations as well as resources that provide guidance and examples relevant to specific industries Consider these water-efficiency strategies in your Lean improvement projects Examples of resources with guidance for specific operations andor industries include
bull ldquoWater Efficiency Manual for Commercial Industrial and Institutional Facilitiesrdquo by the North Carolina Department of Environment and Natural Resources httpsavewaterncorgbushomephp
bull ldquoWaterSmart Guidebookrdquo by the East Bay Municipal Utility District of Oakland California wwwebmudcomfor-customersconservation-rebates-and-services commercialwatersmart-guidebook
bull ldquoWaterSense at Work Best Management Practices for Commercial and Institutional Facilitiesrdquo by EPA Office of Water wwwepagovwatersense
bull ldquoFacility Managerrsquos Guide to Water Managementrdquo by the Arizona Municipal Water Users Association amwuaorgpdfsfacility_managers_guidepdf
See Appendix A for details about these and other water efficiency resources
To Consider
3 What just-do-it actions can you identify to reduce water use
3 What processes or operations would you consider for kaizen events fo-cused on water efficiency
3 What water-reuse options might there be at your facility What steps will you take to learn more about those opportunities
3 What ideas do you have for adding water-efficiency practices into everyday Lean practices (eg through Lean training use of metrics incentive pro-grams standard work visual controls 5S TPM on water-using equipment or other means)
3 What other ideas do you have for reducing water use with Lean or other process improvement efforts
53
CHAPTER 5
Lean and Water Beyond the Factory Floor
Looking beyond your facility operationsmdashsuch as your supply chain interactions with your com-munity and how you design productsmdashcan allow you to uncover new ways to reduce water use and risks while adding value and improving business operating conditions and market opportunities This chapter examines
bull Lean and Water Efforts in Your Supply Chain bull Engaging with the Community bull Lean Product Design
Lean and Water Efforts in Your Supply Chain Depending on your industry sector the greatest opportunities for water use reduction may be in your supply chain rather than your facilityrsquos own operations As discussed in chapter 1 compa-nies whose suppliers have water-intensive operations may feel pressures from customers or other stakeholders to reduce water use within their supply chain It is important for your business to understand water use and risks throughout the value chainmdashincluding upstream in supplier opera-tions and downstream in customer activities In particular the water needed to extract and process raw materials may be significant in some sectors while other stages such as product-use are more important for others
Some water impacts in the supply chain can be addressed by engaging your suppliers in your Lean and water efforts The techniques in this toolkit can be applied at both large and small companies Here are some ideas to get started
bull Ask suppliers about their water use and their water efficiency efforts
bull Invite customers andor suppliers to participate in a Lean and water value stream map-ping event water gemba walk or water kaizen event at your facility to learn from your experience and share their perspectives
bull Offer to participate in your customerrsquos andor supplierrsquos Lean events if your business has relevant expertise
bull Share training materials yoursquove developed best practices and success stories of your Lean and water efforts to educate suppliers on these efforts
bull Invite suppliers to participate in training sessions with your employees For example the furniture manufacturer Steelcase invites its suppliers to attend workshops covering Lean and environment topics at its ldquoSteelcase Universityrdquo
54
Chapter 5 Lean and Water Beyond the Factory Floor
bull Start a dialog with your suppliers about Lean and water projects to initiate together
bull Encourage suppliers to develop and share short- and long-term water reduction goals and report progress against the goals
bull Provide incentives recognition andor financial support for suppliers to conduct Lean and environmental improvement efforts andor for suppliers that help you meet your water efficiency goals
bull Consider focusing first on suppliers that are located in water-scarce areas where reduc-ing water consumption can have the greatest positive impact on community relations
For some smaller companies working with your supply chain may be more challenging than is the case for larger companies One option for smaller facilities is to inform your suppliers that they may access resources available through local utilities such as technology rebates or free or subsidized water audits
Dubois Chemical and Steelcase An Innovative LeanWater Supplier Partnership (Box 20)
Furniture manufacturer Steelcase worked with Dubois Chemical on a demon-stration project exploring an alternative pretreatment washing process on one of Steelcasersquos finishing lines
3The team analyzed the total cost of ownership (for energy labor watersew-age and process chemicals) in the current and future state process maps and relied on water recycling and other strategies to save time energy water and chemicals
Due to the projectrsquos success Steelcase has deployed it on seven powder coat-ing lines Results include
3 Saved $1 million per year
3 Eliminated phosphates from pretreatment discharge
3 Met 2007 emergency water-reduction requirements in Atlanta
3 Reduced water use by 80 percent chemical volume used by 20-30 percent and waste discharged by 85-95 percent
3 Saved 45 million gallons of water per year Sources SteelcaseDubois info from Mary Ellen Mika and Keith Lane ldquoJoint Case Study Reducing Your Water Foot-printrdquo presentation at 23 September 2008 Corporate Climate Response Conference Mary Ellen Mika et al ldquoE3 and GSN Learning Evolving and Expandingrdquo presentation at 2011 Manufacturing Innovations Conference
55
Chapter 5 Lean and Water Beyond the Factory Floor
Some companies participate in Lean supply chain initiatives that focus on environmental objectives such as water use reduction For example in the US Green Suppliers Network Program Lean ser-vice providers at Manufacturing Extension Partnership centers partner with environmental special-ists to deliver ldquoLean and Cleanrdquo process assessments for companies in the supply chains of larger organizations on a fee-for-service basis (see Box 21) The assessments use value stream mapping with an added focus on environmental metrics and costs to identify opportunities for improvements in resource use Many of the assessments include support for implementation A similar program called E3 (Economy Energy and Environment) incorporates Lean environmental and energy technical assistance and also involves local utilities as partners19 Companies should encourage their suppliers to consult their local water and energy utilities to find rebates or incentives for efficient technologies and process improvements
Green Suppliers Network Lean and Water Successes (Box 21)
Southwire and Pacific Gas amp Electric (PGampE)
3 Southwire a manufacturer of wire and cable products and a key supplier of PGampE participated in a Green Suppliers Network review in 2008 at its Car-rollton Georgia plant
3 Based on the value stream map-based review and the teamrsquos recommenda-tions the facility implemented a water-looping system that recycled water without affecting product quality
3 These efforts cut facility water use by more than 9 million gallons (over 90 percent) and saved more than $70000 annually
McNeil PPC and Johnson amp Johnson
3 McNeil-PPC Inc which manufactures Listerinereg products for Johnson amp Johnson participated in a Green Suppliers Network review project in 2007 with the support of Johnson amp Johnson
3 With value stream mapping the team found that 450 gallons of Listerinereg and 60 gallons of water were wasted per line change
3The team recommended solutions to minimize changeover wastes These recommendations have significantly reduced the amount of water that the facility would otherwise use
3With changes such as reusing water for boilers using flavors instead of water to clean equipment sequencing flavors from light to dark switching to waterless conveyor belts and using closed-loop cooling the facility has cut wastewater discharge by 25-30 percent
Sources Green Suppliers Network wwwgreensuppliersgovresultssuccesshtml and information provided by Char-lie Souders Johnson amp JohnsonMcNeil Consumer Healthcare June 29 2011
19 For more information on the Green Suppliers Network see wwwgreensuppliersgov and for more information on the E3 initiative see wwwepagovgreensupplierse3html
56
Chapter 5 Lean and Water Beyond the Factory Floor
Another way that companies can influence supplier actions is through policies and programs that encourage water efficiency Examples include
bull Procter amp Gamble (PampG) has adopted a Supplier Environmental Sustainability Score-card which produces annual supplier sustainability performance ratings for suppliers based on environmental data and qualitative assessments the suppliers provide which include data on water use Suppliers receive higher ratings for contributing to PampGrsquos environmental initiatives and PampG recognizes suppliers receiving the highest rating in the process20
bull PepsiCo has a Supplier Sustainability Outreach Program in which suppliers regularly submit metrics to track their progress toward short-term and long-term goals in energy water and waste efficiency The program prepares suppliers to join ENERGY STAR which is required for all US-based suppliers Suppliers gain access to PepsiCo resourc-es training tools and an invitation to the Global Environmental Sustainability Sum-mit Fuel electricity and water savings from the program totaled $12 million as of the third quarter of 2010 Forty co-packers and suppliers across 102 manufacturing sites participate and the program continues to expand in the United States and globally
bull Levi Strauss amp Co is adjusting its policies to allow more water recycling and reuse at contract finishing facilitiesmdashit now allows reclaimed water to be used at finishing facilities through onsite treatment internal recycling or from a nearby treatment facil-ity Uses for reclaimed water include landscaping toilets and heating ventilation and cooling systems
bull Wal-Mart provided over 100000 suppliers with a sustainability survey to collect infor-mation about their environmental performance The survey includes questions on the total water use of facilities that produce products for Wal-Mart as well as guidelines for conducting a water footprint and improving water efficiency at facilities Future phases of Wal-Martrsquos ldquoSustainability Indexrdquo project include the development of a database of information on product lifecycles and a tool to help merchants and customers under-stand the sustainability of products21
Consider the following five strategies to promote Lean and water efficiency efforts with your suppli-ers keeping in mind that some of these might be less feasible or applicable for small facilities
bull Require reporting from suppliers Requests for reporting on water use and effi-ciency efforts sends a message to supply chain businesses that the company cares about water It may also help you understand business risks and opportunities to assist suppli-ers in reducing water use or risk Benchmarking of water metrics (eg water intensity
20 For more information about PampGrsquos sustainability work with suppliers see wwwpgcomen_USsustainabilityenvironmental_sus-tainabilityoperations_supplierssupplier_engagementshtml
21 For more information on Wal-Martrsquos Sustainability Index see httpwalmartstorescomSustainability9292aspx
57
Chapter 5 Lean and Water Beyond the Factory Floor
ratios that relate water use to production levels) may be useful to set goals and perfor-mance targets Companies can encourage suppliers to utilize ENERGY STARrsquos Portfolio Manager or other tools to track environmental performance
bull Examine product specifications Evaluate how procurement requirements affect the amount of water required to produce or transport the product to facilities Some com-panies may be able to reduce the water used in their supply chains by changing their sourcing specifications
bull Provide recognition awards andor incentives Recognizing supply-chain water and environmental initiatives can raise awareness of and encourage water use reduc-tion and best-practice sharing among suppliers Stories of water-saving efforts may also be of interest to customers
bull Consider supplier requirements It may be appropriate to consider water-related performance in the selection of suppliers particularly in water-intensive parts of your supply chain Performance targets or certification requirements (eg ISO 14001) could also be incorporated into procurement requirements or partnership agreements Consider developing sector-specific standards to reduce overall environmental impacts (eg the Business and Institutional Furniture Manufacturersrsquo Association Sustainability Standard)22
bull Provide subsidize or make referrals for technical assistance Companies can provide technical assistance or training on Lean and water approaches to supply chain partners Alternatively encourage participation of supply chain partners in ldquocommuni-ties of practicerdquo to share information on water efficiency and environmental improve-ment opportunities Manufacturing Extension Partnership centers provide support for Lean training and can help you integrate water efficiency considerations into your sup-ply chain Organizations can also make suppliers aware of water efficiency resources and services available from local utilities and other sources
bull Collaborate on joint Lean and water projects Collaborate with your suppliers and or your customers to develop approaches to reduce water use and risks or to capture new market opportunities Consider using the ideas strategies and tools in this toolkit as a starting point for a discussion about Lean and water opportunities to pursue
22 This standard is available at wwwbifmaorgpublicSusFurnStdhtml
58
Chapter 5 Lean and Water Beyond the Factory Floor
Levi Strauss amp Co and the Better Cotton Initiative (Box 22)
Levi Strauss amp Co completed a third-party lifecycle assessment to understand the environmental impact of an iconic product Levirsquosreg 501reg jeans The com-pany discovered that
3 Forty-nine percent of water consumption for Levirsquosreg 501reg jeans occurs in cotton production while another 45 percent occurs after consumers take the products home
3 The remaining water use is divided among fabric production (2 percent) finishing (3 percent) and retail (1 percent)
Recognizing the importance of the cotton production stage Levi Strauss amp Co joined the Better Cotton Initiative (wwwbettercottonorg) in 2008 to change the way it grew cotton
3 The Better Cotton Initiative seeks to make global cotton production better for the people who produce it better for the environment and better for the apparel sectorrsquos future
3 Pilot projects in countries such as Brazil India Mali and Pakistan work to reduce the environmental impacts from cotton production while supporting local economies
3 In Pakistan participating farms cut water use by over 30 percent 117 bil-lion cubic meters of irrigation water in 2010
Source Levi Strauss amp Co ldquoCEO Water Mandate Communication on Progress 2010rdquo wwwlevistrausscomsites
defaultfileslibrarydocument201012lsco-ceo-water-mandate-cop-2010pdf
Engaging with the Community In many cases water stewardship is a key component of a facilityrsquos ability to operate in a communi-ty Depending on where your facility is located your business and the surrounding community may face different types of water resource challengesmdashsuch as water scarcity infrastructure or pollution concerns Especially in water-scarce regions or during droughts people in the community may have an increased interest in what your facility is doing to reduce its impacts on local water resources Indeed community engagement is recognized as a key pillar of water resource management by the United Nations CEO Water Mandate which assists companies in developing and implement-ing sustainable water policies and practices23 Engaging proactively with your community on water conservation can be an effective way to mitigate water-related business risks as well as reduce your organizationrsquos overall water footprint
23 The UN CEO Water Mandate is available at wwwunglobalcompactorgIssuesEnvironmentCEO_Water_Mandate
59
Chapter 5 Lean and Water Beyond the Factory Floor
Two key strategies for effective community engagement include
bull Educate and engage your employees in water-efficiency efforts at your facility and encourage them to adopt similar practices at home (eg check for leaks use efficient appliances and faucets turn off water when not in use etc) Build the capacity of employees to spot water waste and problem solve throughout their daily activities on the job and off
bull Partner with community members and local organizations to conduct projects that improve water use water quality andor water infrastructure resources in the com-munity Consider using Lean methodsmdashsuch as a waste walk kaizen event or even a Lean design eventmdashto rapidly brainstorm and test improvement ideas for projects and include community stakeholders in those efforts
Along with the value of community engagement these strategies can have the benefit of partially or fully ldquooffsettingrdquo impacts the facility may have on local water resources That is a facility can sup-port efforts that replenish the local water supply by at least the amount of water the business uses directly In India PepsiCo has achieved a positive net water balance in this way (see Box 23)
PepsiCorsquos Positive Water Balance Project in India (Box 23)
At its facilities in India PepsiCo achieved a ldquopositive water balancerdquomdashwhere businesses contributed more water to the communities than they consumedmdash in 2009 and 2010
3 Savings of over 3 billion liters of water in 2009 and over 4 billion liters in 2010 have been verified externally by Deloitte LLP
As part of these efforts PepsiCo India has
3 Reduced water usage in manufacturing by 45 percent since 2005
3 Partnered with government agencies and local organizations to increase peoplersquos access to clean water
3 Worked with agricultural universities to promote ldquodirect seedingrdquo of rice paddies which allows seeds to be directly planted into the soil (without the need for a nursery) and avoids the need for flood irrigation (This reduces water use by up to 30 percent)
3 Saved over 5 billion liters of water from 6500 acres of direct-seeded paddy fields
3 In 2010 PepsiCo began working with the Nature Conservancy to explore ways to credibly achieve a positive water impact across its global operations
Source PepsiCo ldquoReplenishing Water Conserving the worldrsquos most precious asset Waterrdquo httppepsicoindiacoin
purposeenvironmental-sustainabilityreplenishing-waterhtml accessed 28 July 2011
60
Chapter 5 Lean and Water Beyond the Factory Floor
Businesses can use Lean tools to engage with communities in collaborative problem solving to achieve social economic and environmental goals such as water efficiency For example DTE Energymdasha Detroit Michigan based electric utilitymdashhas used tools including gemba walks value stream maps and ldquocritical-to-sustainabilityrdquo trees (a modification of ldquocritical-to-qualityrdquo trees) with Detroit area businesses and community members to tackle the following projects
bull Partnered with a non-profit to manage combined sewer overflows by planting thou-sands of trees to reduce the stormwater runoff in Detroit
bull Found a new use for the buffer land around substations as community gardens with thousands of pounds of produce harvested at each substation and donated to food pantries
bull Created a community-supported agriculture business model based on a gemba walk with the community that identified issues such as urban blight meaningful work neighborhood connectivity and healthy living
In areas where water scarcity and drought are issues facilities can engage with communities to share knowledge work toward solutions and build goodwill Here are two examples of companies who engaged in collaborative dialogue with their communities in response to problems with water scarcity in areas where their operations were located
bull Coca-Cola partnered with the United Nations Development Programme and Chinese government representatives to improve water efficiency in response to a severe drought threatening sugarcane growers The first phase will be completed in 2011 and will focus on improving infrastructural facilities that support the farmersrsquo work and life directly such as optimizing irrigation facilities and recycling treated wastewater from sugar plants to improve farm production and water use efficiency This first phase will provide approximately 500 million liters of water to rural residents and directly benefit 100000 rural sugarcane farmers in the region In future phases this collaboration will pursue improvements in water efficiency in business operations and will seek to ease pressure on local water supplies through continuing community water partnerships24
bull The chemical manufacturer Sasol identified water scarcity as a risk to its operations in South Africa and pro-actively approached the problem by organizing a joint dialogue with community stakeholders representatives of water-intensive industries in South Africa government and non-governmental institutions and local research institutions The dialogue promoted cooperation among the stakeholders and between Sasol and its surrounding community as the sharing of knowledge and experiences coalesced toward the formulation of several ideas for collective action toward improved water efficiency25
24 For more information about Coca-Colarsquos work with sugarcane growers in China see wwwthecoca-colacompanycomdynamic bullpress_center201103chinas-sustainable-sugarcane-initiativehtml
25 For more information see httpsasolsdrinvestoreportscomsasol_sdr_2008page_id=141
61
Chapter 5 Lean and Water Beyond the Factory Floor
Lean Product Design Lean design methods are a group of Lean tools and techniques that aim to
bull Design (or redesign) high-quality products that meet customer needs with the least amount of waste (aspects that do not add value) andor
bull Design (or redesign) processes and equipment that add value to products using the least amount of time material and capital resources
Taking a close look at the parts and processes that go into the creation of a product can help you to identify wastes including water waste and improve product quality reduce costs and potentially gain market advantage
Lean product design methods often rely on a set of criteria to evaluate the best alternatives Incor-porating efficient water use as a design criterion for product development can reduce water waste throughout the entire life cycle of the product Consider raw materials synthesis production customer use and the ultimate disposal or recyclingremanufacturing of the product when consid-ering water use
As with other aspects of Lean implementation product design is most effective when it incorporates ldquowhole systemsrdquo thinking focused on eliminating all forms of waste Be sure to consider traditional Lean goals for both the product and the manufacturing process such as product quality customer service cost and time when you incorporate water efficiency into the Lean product design pro-cess Improving water efficiency should not mean lowering the quality of your finished product or decreasing the productivity of your facility Note that sometimes design alternatives that improve water efficiency can present trade-offs in which decreasing water use results in increased en-ergy or chemical use such endeavors may not be worthwhile depending on the overall impacts You can help ensure that your product quality remains high by adhering to product quality design standards such as the US Green Building Councilrsquos LEED standards for buildings26 EPArsquos Water-Sense program standards for certain water-consuming products and appliances27 and sector-specific product standards
There are several Lean tools to help design (or redesign) a product in a way that reduces wastes Some of these tools are described in Table 7 below For more information about these tools and an explanation of which tools to use in various product design stages see chapter 6 of The Lean and Chemicals Toolkit28
26 The US Green Building Councilrsquos Leadership in Energy and Environmental Design (LEED) standards are available at wwwusgbc orgDisplayPageaspxCategoryID=19
27 For more information about the US EPA WaterSense Program see wwwepagovWaterSense 28 Available at wwwepagovleanenvironmenttoolkitschemicals
Chapter 5 Lean and Water Beyond the Factory Floor
Table 7 Methods Used in Lean Design29
Method Description
3P (Production Preparation Process or Pre-Production Planning)
An integrated and highly detailed approach to product andor process development which involves rapidly designing production processes and equipment to ensure capability built-in qual-ity productivity and flow 3P minimizes resource needs such as capital tooling space inventory and time
Design for Lean Six A method for designing processes that support Sigma Lean Six Sigma objectives such as reduced vari-
ability to improve yield reduce waste and accel-erate time-to-market
Design for Manufacturing amp Assembly
A simultaneous engineering process designed to optimize the relationship between design func-tion manufacturability and ease of assembly
Failure Mode amp Effects A design review methodology that focuses on Analysis identifying the potential failure modes of a prod-
uct and subsequently determining ways to miti-gate each risk of failure
Quality Function Deployment andldquoVoice of the Customerrdquo
An overall methodology that begins in the design process and attempts to map the customer-defined expectations and definition of quality into the processes and parameters that will fulfill them It integrates customer interview and market research techniques with internal cross-functional evaluations of the requirements
Value Engineering An organized methodology that identifies and selects the lowest lifecycle cost options in de-sign materials and processes that achieves the desired level of performance reliability and cus-tomer satisfaction It seeks to eliminate unneces-sary costs in the above areas and is often a joint effort with cross-functional internal teams and relevant suppliers
29 For additional information about many of these tools see Mascitelli Ronald The Lean Design Guidebook Technology Perspective Northridge CA 2004 See also EPArsquos webpage on 3P wwwepagovleanthinkingthreephtm
62
Chapter 5 Lean and Water Beyond the Factory Floor
Table 8 lists examples of questions to ask when evaluating product design alternatives to identify ways to reduce water waste during all phases of the product life cycle
Table 8 Questions to Ask During Lean Product Design
Life Cycle Phase Questions to Ask
Sourcing Materials 3 Will raw material production prior to manufacture and Inputs involve intensive use of water
3 Can you switch to materials that require less water in their production or work with suppliers to reduce water use
Production 3 Will water be used to manufacture the product Manufacturing Evaluate all new equipment and modifications
3 What steps can be taken to reduce the amount of water that will be used to manufacture the product (eg switch to water-less processes reuse water etc)
3 How can you design products to reuse water in multiple process steps (eg recovering rinses from cleaning counter-current flow or refiltering water)
Product Distribution 3 How much water will the product require during Use and Disposition use
3 What product design alternatives use less water (eg through reuse systems water-efficient fea-tures etc)
3 What steps can you take to ensure that product performance is maintained as you implement water efficiency improvements
3 How will the product design affect customer water use Can reductions in the product use phase be guaranteed
3 How can the design ensure customers will be satis-fied with product performance even with reduced water use
Some companies report that the ldquoseven waysrdquo method provides a useful means to identify a more diverse creative set of improvement options to address specific water-related needs This method is often used in the Lean design process This method typically involves brainstorming of seven alter-native approaches for addressing a specific improvement opportunity Sometimes teams are encour-
63
64
Chapter 5 Lean and Water Beyond the Factory Floor
aged to look at how similar tasks are accomplished in the natural world to spark creative thinking on alternatives The team then scores the seven alternatives using pre-established weighted criteria to select the preferred solution Consider incorporating water efficiency into these criteria (water used to manufacture andor full life-cycle water use) to ensure that product design alternatives are evaluated according to your Lean and water efficiency goals
Examples of Water Conservation through Product Design (Box 24)
GE used the 3P (Production Preparation Process) Lean strategy to launch a new water-saving product line
3Geospringtrade hybrid water heaters dishwashers and top-loading washing machines are being redesigned from scratch using Lean manufacturing techniques
3Production team members from engineers to technicians now work together in a cross-functional approach that involves everyone from design through production using scaled-down equipment and product mockups to visualize improvements
3This hands-on whole-team approach has allowed employees to make ad-justments in real-time allowing problems to be identified early and produc-ing dramatically simpler designs that cut total product development time
Levi Strauss amp Co examined the design of its popular blue jeans to identify ways to reduce the water used to manufacture the product
3 WaterltLesstrade jeans reduce water consumption by an average of 28 per-cent and up to 96 percent for some new products
3These water savings were accomplished by reducing washing cycles incor-porating ozone processing into washing and removing water from stone washing
3While the production of Levirsquosreg blue jeans like many products uses a sig-nificant amount of water in the supply chain as well as through consumer end use the company made significant progress by addressing water use in the manufacturing process
As described earlier in this chapter there is great potential for water savings throughout a productrsquos supply chain including the acquisition of resources and raw materials as well as the water that customers will use with the product or service However if you are just getting started with Lean consider focusing first on water use within your facility before branching into your supply chain and customer-use considerations
65
Chapter 5 Lean and Water Beyond the Factory Floor
To Consider
3What parts of the extended value chain of your enterprise use the most water If you donrsquot know how will you find out
3Have you talked with any of your suppliers about Lean and environmental improvement efforts
3What opportunities are there to offset water impacts and improve water resources for the local community
3What changes could you make to the design of your products to reduce water wastes
Lean and Water Toolkit
67
CHAPTER 6
Conclusion
This chapter includes the following sections bull Your Lean and Water Journey bull Concluding Thoughts
Your Lean and Water Journey We hope that this toolkit has provided you with practical ideas to leverage Lean methods to identify and eliminate water waste at your facility Learning to see water waste and to identify improvement opportunities using Lean tools will help you to save money and be a better partner to your com-munity by placing less of a burden on local water supply There are many tools and techniques to get started with using Lean to reduce water waste As described in more detail in chapter 1 here are three ways to get started with Lean and water efforts
bull Learn more about how your facility uses water Connect with environment and facilities personnel to discuss opportunities to reduce water waste with Lean Find water waste in your facility using tools like metering and water balances
bull Engage employees in lean and water improvement efforts Involve employees in teams to brainstorm ways to reduce water use encouraging their ideas to innovate improvement opportunities Try out some of the strategies for eliminating water waste that are described in this toolkit
bull Connect Lean and water efforts to sustainable water management strategies Use Lean tools to support a broader corporate water sustainability strategy Identify what the ldquoTrue Northrdquo goals and targets are for water use at your facility and track progress to inspire improvement and creative solutions Look beyond direct operations to engage your customers suppliers and communities
Many of the techniques in this toolkit can help you reduce water waste and identify savings rapidly however it is important to think about the bigger picture of how water is used across your organiza-tion Figure 2 repeated below from chapter 1 illustrates how the tools and techniques described in this toolkit can help you to address water use throughout your value chain
68
Chapter 6 Conclusion
Figure 2 Lean and Water Implementation Strategies
Understand Water Uses and Costs (Chapter 2)
Find Water Waste (Chapter 3)
Improve Operations and Processes with Lean and Water Strategies (Chapter 4)
Extend Lean and Water Efforts Throughout the Value Chain (Chapter 5)
Sourcing Materials and Inputs (Chapter5)
Production Manufacturing (Chapters 3 and 4)
Product Distribution Use and Disposition (Chapter 5)
Concluding Thoughts We hope this toolkit spurs creative thinking and energy within your organization and encourages you to explore these opportunities We aim to periodically release new versions of resources in EPArsquos Lean and Environment Toolkit series while working with partner companies and organizations to explore ways to improve efficiency using Lean We also hope to learn from your experiences using this toolkit Our goal is to refine the techniques presented provide examples and case studies to il-lustrate the possible benefits of these tools and present new techniques as they emerge We wish you success on your Lean and water journey
Your Thoughts on the Toolkit
Now that you have finished this toolkit reflect on what you read by answering these questions
3 What strategies and tools in the toolkit seemed particularly interesting Which ones were most applicable to your facility
3 What steps will you take next to advance Lean and water efforts at your facility
3 What other information and tools would help your organization to achieve your Lean and water goals
69
APPENDICES
Appendix A Water Efficiency Resources and Technical Assistance Providers This appendix describes resources and places to go for more information concerning the following topics
bull Water Conservation and Efficiency Resources bull Technical Assistance Providers
This appendix focuses on resources that are directly applicable to manufacturing and industrial facilities however some resources and tools may have broader relevance and contain information that will be useful to commercial institutional and residential water users as well as industrial water users
Water Efficiency and Conservation Resources At the Crest of a Wave A Proactive Approach to Corporate Water Strategy Pacific Institute wwwpacinstorgreportscrest_of_a_wave Making the case that businesses and industrial facilities must prepare for water trends this guide helps users to design and implement a two-stage water conservation strategy Case studies and success stories include those from companies such as Unilever Nestleacute Toyota General Motors Anheuser-Busch GE Proctor amp Gamble and more The steps presented help corporations to create a comprehensive approach to managing water risks and opportunities
Collecting the Drops A Water Sustainability Plannertrade Global Environmental Management Initiative (GEMI) wwwgemiorgwaterplanner This web-based tool and downloadable document provides step-by-step guidance and resources to help facilities conduct assessments of their water use and impacts on the water supply Facilities can then use this information to develop water sustainability strategies create action plans and take actions to improve water resource management in their operations and community The planner includes case examples of how GEMI member companies have engaged internal and external stake-holders and generated actions to improve water resource management and conservation Modules include
bull Module 1 Facility Water Use and Impact Assessment Program bull Module 2 Water Management Risk Assessment Questionnaire bull Module 3 Case Examples and Links
70
Appendix A Water Efficiency Resources and Technical Assistance Providers
Commercial Institutional and Industrial (CII) Water Users Manufacturing Introduction Alliance for Water Efficiency wwwallianceforwaterefficiencyorgManufacturing_Introductionaspx The Alliance for Water Efficiency Resource Library webpages offer information on CII water use and efficiency opportunities as well as links to the research and information about this end user catego-ry In manufacturing major uses and topics include cooling water process water steam generation and boilers sanitation irrigation food services and housekeeping The resource briefly discusses the need for and value of water audits for facilities and applying the strategies of reduce reuse and recycle for facility water consumption
Connecting the Drops Toward Creative Water Strategies A Water Sustainability Tooltrade GEMI wwwgemiorgwater This tool presents the business case for water efficiency and provides guidance and case studies on water assessment opportunity identification planning and implementation Five core analytic modules comprise a roadmap to help facilities identify specific steps that they can take to reduce their water use
bull Module 1 Water Use Impact and Source Assessment bull Module 2 Business Risk Assessment bull Module 3 Business Opportunity Assessment bull Module 4 Strategic Direction and Goal Setting bull Module 5 Strategy Development and Implementation
Cooling Towers Water Use Washington State Department of Ecology wwwecywagovtreeequipCThtml Cooling towers are a significant area of water use for many facilities and taking steps to assess and reduce water use in cooling towers can substantially lower a facilityrsquos overall water footprint The Washington State Department of Ecologyrsquos Technical Resources for Engineering Efficiency (TREE) Team created this succinct checklist of conservation suggestions questions to ask during a water use evaluation and suggested data to collect to identify opportunities for water savings from cooling towers
ENERGY STAR Portfolio Manager US Department of Energy and US Environmental Protection Agency wwwenergystargovindexcfmc=evaluate_performancebus_portfoliomanager This tool allows users to track and access information about their facilityrsquos water consumption inad-dition to data about energy consumption Water and energy use and cost data can be managed across multiple facilities in a secure online interface The tool allows you to track multiple water meters for each facility identify meters with customized names and key information benchmark your facili-ties relative to past performance monitor costs and share data with others inside or outside of your organization By tracking energy and water metrics across facilities users can identify opportunities for efficiency improvements and can receive EPA recognition for superior performance
71
Appendix A Water Efficiency Resources and Technical Assistance Providers
Facility Managerrsquos Guide to Water Management Arizona Municipal Water Users Association httpamwuaorgpdfsfacility_managers_guidepdf This guide is intended to help commercial industrial and institutional facilities to identify areas to improve water use efficiency within reasonable economic parameters The guide provides a step-by-step resource for creating a water management plan and includes worksheets on topics such as water consumption history and estimated water balances Several water end uses and options for reducing them are discussed including domestic water use cooling and heating systems landscape water uses and kitchen uses The guide provides planning and policy-setting options water man-agement options and guidance for empowering employees to effect changes to reduce water use
Federal Water Efficiency Best Management Practices US Department of Energy www1eereenergygovfempprogramwaterefficiency_bmphtml The Federal Energy Management Program developed Federal Water Efficiency Best Management Practices in response to an Executive Order requiring federal agencies to find cost-effective ways to reduce their water use in coordination with EPArsquos WaterSense Program Toward the goal of reduc-ing industrial landscaping and agricultural volumetric water consumption by 20 percent by 2020 (relative to a 2010 baseline) FEMP provides best practices for water management planning infor-mation and education programs water auditing and leak detection and reducing water in several end uses including
bull Boilers and steam systems bull Cooling towers bull Water-efficient irrigation bull Single-pass cooling equipment bull Toilets urinals faucets and showerheads
GEMI Local Water Tooltrade GEMI wwwgemiorgGEMIInteractiveToolsaspx By spring 2012 GEMI plans to release a new tool the GEMI Local Water Tooltrade which will be an interactive downloadable module that will help companies evaluate specific sites for water impacts and risks in order to devise site-specific sustainable water management strategies This tool is de-signed to complement the Global Water Tool (described below) which can help a company identify and prioritize risks to its competitive position based on the link between its operations and the external water landscape Companies can then employ the Local Water Tool to further evaluate the high water-risk locations and plan actions to manage those risks
Global Water Tool World Business Council for Sustainable Development wwwwbcsdorgpagesedocumentedocumentdetailsaspxid=221ampnosearchcontextkey=true In order for a facility to manage current and future risks related to its water use the Global Water Tool helps users map their water use and assess risks related to their global operations comparing water needs to local conditions The tool helps calculate water consumption and efficiency compar-ing water consumption data through time to help assess improvements and monitor progress
72
Appendix A Water Efficiency Resources and Technical Assistance Providers
Making Every Drop Work Increasing Water Efficiency in Californiarsquos Commercial In-dustrial and Institutional (CII) Sector National Resource Defense Council wwwnrdcorgwatercacii This guide provides practical suggestions for commercial industrial and institutional facilities to increase their water efficiency Both small-scale concrete steps to take and suggested higher-level strategic approaches toward water efficiency are described The guide includes a list and descrip-tions of available technologies for reducing water consumption by a variety of common end uses
Performing a Business or Industry Water Use and Conservation Audit New Hampshire Department of Environmental Services wwwdesstatenhusorganizationcommissionerpipfactsheetsdwgbdocumentsdwgb-26-16pdf This factsheet provides a short set of steps to audit water use in a business or industrial facility analyze feasibility of conservation measures and develop a conservation plan
Solutions for Sustainable Water Savings ndash A Guide to Water Efficiency General Electric Water amp Process Technologies wwwgewatercomwater_efficiencyindexjsp This guide provides a practical framework for site managers corporate officers engineering firms and water saving advocates to develop a water efficiency objective and meet this objective by ap-plying a variety of tools and metrics The manual covers baseline water footprinting identifying efficiency opportunities optimizing implementing and measuring
Waste Not Want Not The Potential for Urban Water Conservation in California Pacific Institute wwwpacinstorgreportsurban_usage This report presents a comprehensive assessment of water use and conservation potential in the state of California including industrial water use as well as commercial institutional and resi-dential It includes benchmarking data on water use for many industry sectors a description of the methodology for estimating cost and water savings from water conservation strategies and informa-tion on cost-effectiveness of various water conservation and efficiency improvements
A Water Conservation Guide for Commercial Industrial and Institutional Users New Mexico Office of the State Engineer wwwosestatenmuswater-infoconservationpdf-manualscii-users-guidepdf This guide presents the business case for water efficiency offers programmatic steps conservation strategies for indoor and outdoor use and process-specific and mechanical systems and illustrates potential opportunities with fifteen individual case studies
Water Efficiency Manual for Commercial Industrial and Institutional Facilities North Carolina Department of Environment and Natural Resources httpsavewaterncorgbushomephp This comprehensive manual provides sound principles of water conservation strategies for conduct-ing a successful water efficiency program auditing tools water management options and examples
73
Appendix A Water Efficiency Resources and Technical Assistance Providers
for three industry-specific processes textiles food and beverage and metal finishing Practical tools in the guide include assessment checklists step-by-step instructions for conducting a successful wa-ter efficiency program and explanations of approaches such as water balancing The manual details water management options for several common end uses including
bull Sanitary and Domestic Uses bull Cooling and Heating bull Boilers bull Kitchen and Food Preparation bull Commercial Laundries bull Cleaning Rinsing and In-process Reuse bull Reuse and Reclamation bull Landscaping
Water Efficient Equipment and Design A Guide for Non-Residential Construction and Development Austin Water Utility Water Conservation Division wwwallianceforwaterefficiencyorgWorkArealinkitaspxLinkIdentifier=idampItemID=1018 Equipment and design practices for the construction of new industrial and commercial facilities help to build lifecycle water savings into the design of these buildings Major renovations to exist-ing facilities as well as new construction should be undertaken with a careful assessment of ways to reduce the facilityrsquos lifetime water use This guide provides general guiding principles to ensure that facilities are constructed to maximize water conservation and efficiency as well as specific steps and guidelines to follow in all steps of design and construction
Water Footprint Manual Water Footprint Network wwwwaterfootprintorgpage=fileshome This guide provides a thorough description of the practice of water footprinting including practical steps for estimating a water footprint and instructions for assessing the difference between a direct and indirect water footprint This comprehensive guide to water footprinting instructs readers on estimating the footprint of a product as well as that of a business
WaterSense at Work Best Management Practices for Commercial and Institutional Fa-cilities US Environmental Protection Agency wwwepagovWaterSense The WaterSense Best Management Practices which EPArsquos Office of Water developed in coordination with the Federal Energy Management Program are a comprehensive set of recommendations and tips for how commercial and institutional facilities can improve their water efficiency EPArsquos Water-Sense Program helps water consumers identify best practices resources and tools to reduce their water use Commercial and institutional water users can take advantage of lists of water-efficient products to install in their facilities best management practices and other ways to improve water efficiency
74
Appendix A Water Efficiency Resources and Technical Assistance Providers
WaterSmart Guidebook East Bay Municipal Utility District Oakland California wwwebmudcomfor-customersconservation-rebates-and-servicescommercial watersmart-guidebook This extensive guidebook provides information on water-saving technologies currently available to commercial industrial and institutional businesses as well as specific water efficiency strategies and tips for different business types such as paper manufacturing and metal finishing Many water-using technologies such as process water are explored to show the areas in which the most water is used and where it can be saved
Technical Assistance Providers
Water Utility Incentive Programs Many utilities and local governments offer incentive programs to water utility customers to encour-age the efficiency of water use in the industrial commercial and institutional sectors Common approaches include a combination of water audits and rebates to help facilities realize water sav-ings Check with your local utility to see what incentives may be available Some notable programs include those sponsored by the following utilities and localities all of which saw significant reduc-tions of water use by facilities that they serve
bull City of Austin and Austin Water Utility wwwciaustintxuswaterconservation
bull Denver Water wwwdenverwaterorgConservationIncentivePrograms
bull East Bay Municipal Utilities District wwwebmudcomfor-customersfor-commercial-customerscommercial-conservation-rebates-and-services
bull Massachusetts Water Resources Authority wwwmwrastatemauscomsupportwaterconservationmainhtm
bull Metropolitan Water District of Southern California httpwwwbewaterwisecomicphtml
bull City of Phoenix phoenixgovwaterserviceswrcindexhtml
bull City of San Jose Environmental Services Department wwwsanjosecagovesdwater-conservationdefaultasp
bull Seattle Public Utilities wwwseattlegovutilServicesWaterFor_Commercial_CustomersWATER-CONS_200311261707523asp
75
Appendix A Water Efficiency Resources and Technical Assistance Providers
National Institute of Standards and Technology Hollings Manufacturing Extension Partnership wwwnistgovmep The National Institute of Standards and Technology (NIST) Hollings Manufacturing Extension Part-nership (MEP) is a network of manufacturing assistance centers that provide Lean manufacturing training Lean event facilitation and other services to small-to-medium sized businesses to make them more competitive Many MEP centers have experience providing integrated Lean and environ-mental services to businesses or have partnerships with environmental agencies to offer Lean and environment services
Pollution Prevention Resource Exchange (P2Rx) Consortium wwwp2rxorg The Pollution Prevention Resource Exchange (P2Rxtrade) is a consortium of regional pollution prevention information centers in the United States funded in part through grants from EPA These centers all provide pollution prevention information networking opportunities and technical assis-tance services to state agencies local governments businesses and technical assistance providers in their region Regional centers and contact information can be found on the P2Rxtrade website along with their collective information resources on Lean water efficiency and other topics
Appendix B Water Cost Calculator You can use this table to calculate costs associated with water use at your facility Write down the appropriate volumes units and unit costs and multiply volume by unit cost to find the dol-lars spent on each cost area Add these costs to find the total cost Note Unit costs for water may varydepending on the season andor based on water use (eg peak surcharges may apply above a certain level)30
Factor
Costs to Consider (Excluding Labor amp Maintenance
Costs)
Examples Description Vo
lum
e
Uni
ts(g
allo
ns)
Uni
t Cos
t ($
per
gal
lon)
Tota
l Cos
t (d
olla
rs)
Sup
ply
Base Purchase Price
Utility (eg 10 cents per gallon)
$ $
Peak Package Demand
(eg additional 1 cent per gallon for water supply over 10000 gallons)
$ $
Pumping costs (if self supplied)
Well-sourced $ $
Purchase of pre-treated water
Deionized dealkylized ultra-pure softened
$ $
Coo
ling
Energy Power to chillers towers etc re-ducing heat load of wastewater prior to release
$ $
Chemical For towers chill-ers coolants
$ $
30 Several resource tracking tools that may also be relevant These include Energy amp Materials Flow amp Cost Tracker from the North-east Waste Management Officialsrsquo Association wwwnewmoaorgpreventionemfact Water Conservation Tracking Tool (for water utilities) from Alliance for Water Efficiency wwwallianceforwaterefficiencyorgTracking-Toolaspx and Portfolio Manager (for energy and water use) from the ENERGY STAR Program wwwenergystargov
Total cost of water use should also include labor associated with operations maintenance accounting and legal associated with all items listed
76
Appendix B Water Cost Calculator
Factor
Costs to Consider (Excluding Labor amp Maintenance
Costs)
Examples Description Vo
lum
e
Uni
ts(g
allo
ns)
Uni
t Cos
t ($
per
gal
lon)
Tota
l Cos
t (d
olla
rs)
Trea
tmen
t(O
nsit
e)
Treatment chemicals
Softening de-alkalyzed
$ $
Filters mem-branes carbon
Purified deionized $ $
Sludge disposal Filtration $ $
Filter disposal Solid waste $ $
Was
tew
ater
Trea
tmen
t
Pretreatment chemicals
Neutralizers flocculants etc
$ $
Pretreatment energy
Evaporation Treatment plant operation
$ $
Sampling and testing kits (consumables)
pH TSS BOD COD
$ $
Was
tew
ater
Dis
posa
l
Sewer rate Utility $ $
Surcharges for pollutant exceeding
$
Permitting Permit renewals $
Septic system maintenance
$ $
Condensate or wastewater disposal if not sewered
$ $
Sludge disposal $ $
Total cost of water use should also include labor associated with operations maintenance accounting and legal associated with all items listed
77
Appendix B Water Cost Calculator
Factor
Costs to Consider (Excluding Labor amp Maintenance
Costs)
Examples Description Vo
lum
e
Uni
ts(g
allo
ns)
Uni
t Cos
t ($
per
gal
lon)
Tota
l Cos
t (d
olla
rs)
sses
Evaporative Cost of make-up water
$ $
Leaks Cost of make-up water
$ $
Treatment or Irrigation or $ $
Lo stormwater vehiclebuilding management washing runoff of runoff from exterior use of supplied water
Production $ $
Oth
er
process water use costs other facility costs
TOTAL $ $
Total cost of water use should also include labor associated with operations maintenance accounting and legal associated with all items listed
See Appendix C ldquoWater Unit Conversions and Calculationsrdquo for guidelines on calculating leak losses
78
Appendix C Water Unit Conversions and Calculations This appendix provides reference material on water unit conversions as well as guidance for esti-mating water use and potential water and cost savings
Water Unit Conversions31
Volume Unit Conversions
Units
Equivalent
Liters (lL)
Gallons (gal)
Cubic Feet (ft3)
Cubic Meters (m3)
Acre-Feet (ac-ft)
Liters 1 02642 3531 x 10-2 00001 8106 x 10-7
Gallons 3785 1 01337 3785 x 10-3 3068 x 10-6
Cubic Feet 2832 7481 1 2832 x 10-3 2296 x 10-5
Cubic Meters 1000 2642 3531 1 8106 x 10-4
Acre-Feet 1233 x 106 3259 x 105 4356 x 104 1233 1
Flow RateDischarge Unit Conversions
Units
Equivalent
Gallons per Minute
(gpm)
Liters per Second (Ls)
Acre-Feet per Day
(ac-ftday)
Cubic Feet per Second
(ft3s)
Cubic Meters per Day
(m3day)
Gallons per Minute
1 6309 x 10-2 4419 x 10-3 2228 x 10-3 545
Liters per Second
1585 1 7005 x 10-2
3351 x 10-2 864
Acre-Feet per Day
2263 1428 1 05042 1234
Cubic Feet per Second
4488 2832 1983 1 2447
Cubic Meters per Day
1369 x 109 864 x 107 6051 x 106 3051 x 106 1
31 GEMI ldquoUnit Conversionsrdquo Collecting the Drops A Water Sustainability PlannerTM available at wwwgemiorgwaterplannerunit-conversionhtm
79
80
Appendix C Water Unit Conversions and Calculations
Calculations and ldquoRules of Thumbrdquo for Estimating Water Use32
Use these guidelines and calculations to estimate water use in your facility The information in this section draws primarily from GEMIrsquos Collecting the Drops A Water Sustainability Plannertrade available at wwwgemiorgwaterplanner
Cooling Tower Usage
Cooling Tower Water Usage Calculations
Tower Evaporation Rate
C x ∆T1000
C = tower recirculation rate in the units of pounds of water
per minute
T = temperature difference across the cooling tower in
degrees Fahrenheit
Cooling Tower Blow Down Rate
[Windage Rate x (Cycles of Concentration -1) -
Tower Evaporation Rate] (1- Cycles of Concentration)
Cycles of Concentration = conductivity or chloride level
in the cooling tower blow-downconductivity or chloride
level in the cooling tower makeup water
bull Windage Loss from Cooling Towers (Water Lost from Friction Between Wind and the Surface of the Water in Cooling Towers)
bull Commonly 01 to 03 of the Recirculation Rate
bull The tower recirculation rate can be obtained from the manufacturerrsquos literature andor head versus flow curve for the pump
Cooling Tower Usage
Boiler Water Usage Calculations
Boiler Make Up Boiler Steam Rate - Condensate Return + Boiler Blow Down
Boiler Blow Down Range of 4 to 8 of Boiler Makeup
Sanitary Water Usage
bull 10ndash25 gallons per person per shift in industrial settings (based on estimates in GEMIrsquos Collecting the Drops A Water Sustainability Plannertrade 2007)
bull The lower value is used where there are just toilets A higher value is used where there are toilets showers and full kitchen services (that is food preparation and dish washing)
32 ldquoCalculationsrdquo and ldquoRules of Thumbrdquo from GEMI Collecting the Drops A Water Sustainability PlannerTM available at wwwgemi orgwaterplannercalculationshtm and wwwgemiorgwaterplannerrules-of-thumbhtm
81
Appendix C Water Unit Conversions and Calculations
bull 20-35 gallons per employee per day for domestic demands (not including kitchens) in commercialindustrial settings (based on estimates in the North Carolina Water Effi-ciency Manual 200933)
bull Savings of 25-35 percent in this domestic usage are readily achievable
Irrigation Usage
bull Number of sprinkler heads x the flow capacity per head (eg 25 gpm x the duration [minutes] of water application)
bull Inspect the irrigation system during operation to determine if there are leaks from broken sprinkler heads and from water distribution lines
Wastewater Streams from Water Treatment Operations
bull Reverse Osmosis Reject Flow
bull Reject stream generally ranges from 10 to 50 of the feed to the system depending on the salinity and the desired purity
bull Reject flow can be higher than the indicated range Reverse osmosis reject streams can be used as cooling tower makeup if the water is softened prior to the reverse osmosis system
Other Uses
bull Slab Washing
bull 5 galmin for each hose
bull 1 dripsecond
bull 10000 Lyear or 2642 galyear
bull Water Flow Estimation
bull Use a bucket and stop watch
Water Losses from Leaks
bull Estimate leaks based on the size of the hole and the water pressure (see Leak Water Loss Guide below) or measure directly using a bucket and stop watch
33 North Carolina Department of Environment and Natural Resources Water Efficiency Manual for Commercial Industrial and Institutional Facilities 2009 available at httpsavewaterncorgbushomephp
82
Appendix C Water Unit Conversions and Calculations
Leak Water Loss Guide (Water Loss in Gallons at 50 PSI)
Leak this Size Loss per Day Loss per Month Loss per Year
bullbull 120 3600 43200
360 10800 129600
693 20790 249480
1200 36000 432000bullbullbull bull 1920 57600 691200
3096 92880 1114560
4296 128880 1546560
6640 199200 2390400bullbullbull 6984 209520 2514240
Source Washington State Department of Health Office of Drinking Water available at wwwdohwagovehpdwwater_usewater_use_efficiencyhtm
Guidelines for Estimating Cost and Water Savings
It can be useful to estimate the potential long-term water and cost savings that will result from implementing water efficiency improvements in your facility This section provides guidelines on producing estimates of these savings after implementing improvements to a process at your facility
83
Appendix C Water Unit Conversions and Calculations
Current Water Use
First to estimate the current water use of an entire process at your facility identify the following information and use Equation 1 below
bull Average volume of water used during a full process or technology cycle
bull This may be provided by the product manufacturer through product literature or the manufacturerrsquos website or by using the guidelines and calculations in the previous section of this Appendix The water efficiency will be dependent upon the flow rate of each process cycle duration of each cycle and the number of cycles If the water use from the full process is not available from the manufacturer sum the water use from each part of cycle to determine the water use from the full process cycle
bull Average number of cycles per day
bull Days of facility operation per year
Water Use after Replacement or Retrofit
To estimate the water use of a more efficient technology or process change use Equation 1 but substitute the average volume of water used during an improved process cycle
Water Savings
To calculate water savings that can be achieved from a technology or process change identify the following information and use Equation 2 below
bull Current water use as calculated using Equation 1
bull Water use after replacement or retrofit as calculated using Equation 1
Equation 1
Water Use of a Technology or Process Cycle (gallonsyear) = Cycle Water Use (gallons) Number of Cycles (per day) Days of Facility Operation (daysyear)
Equation 2
Water Savings (gallonsyear) = Current Water use (gallonsyear) ndash Water Use After Improvements (gallonsyear)
84
Appendix C Water Unit Conversions and Calculations
Payback
To calculate the simple payback from a technology or process change identify the following infor-mation and use Equation 3 below
bull Equipment and installation cost of the replacement or retrofit
bull Water savings as calculated using Equation 2
bull Facility-specific cost of water and wastewater
Return on Investment
To calculate the return on investment of a technology or process change calculate the amount of cost savings as compared to the initial investment using Equation 4
General Calculations and On-Line Calculators
GEMIrsquos Collecting the Drops A Water Sustainability Plannertrade has several on-line and download-able calculators for measuring data related to water use and flows (see wwwgemiorgwaterplanner calculatorsasp) These include
bull Flow rate calculator
bull Friction loss and flow calculator
bull Pump hydraulic horsepower calculator
bull Water balance template and calculator
Equation 3
Payback (years) = Equipment and Installation Cost (dollars) [Water Savings (gallonsyear) Cost of Water and Wastewater (dollarsgallon)]
Equation 4
Return on Investment = [(Water Savings (gallonsyear) Cost of Water and Wastewater (dollarsgallon)] ndash Equipment and Installation Cost (dollars)
Appendix DWater Efficiency Opportunity Checklist
Water Efficiency Opportunity Checklist
FacilityBuilding Date Prepared
Prepared by Reviewed by
Water Efficiency Practice Yes No
1 Organizational Water Efficiency Practices
a Have you set water use reduction goals and targets for your facility
b Are water meters installed on high water using processes and are they working properly
c Do you have easy ways for employees to suggest ideas for water efficiency improvements (eg suggestion boxes)
2 Cooling and Heating
a Has once-through cooling water been eliminated with the use of chillers cooling towers or air-cooled equipment
b Has blow-downbleed-off control on cooling towers and boil-ers been optimized
c Is condensate being reused
d Is treated wastewater (or other sources of water for cooling tower make-up) reused where possible
e Are cycles of concentration for cooling towers maximized through efficient water treatment
f Is a conductivity controller installed on each cooling tower
g Have cooling towers been equipped with overflow alarms
h Are high-efficiency drift eliminators in use
3 Restrooms and Kitchens
a Are water-efficient fixtures installed (eg WaterSense labeled faucets toilets urinals and showerheads) Are there signs on dual-flush toilets showing people how to use them
b Have you installed metered or spring-loaded faucets or fau-cets with sensors
85
Appendix D Water Efficiency Opportunity Checklist
Water Efficiency Practice Yes No
c Have you adjusted plumbing to use the minimum amount of water that is functional
4 Process Use
a Have you installed timers to automatically shut off water flow when water is not required such as at the end of a produc-tion cycle
b Are solenoids and automatic shut-off valves checked regu-larly to ensure that they are working properly
c Is equipment set to the minimum flow rates recommended by the manufacturer
d Have pressure-reducing devices been installed on equipment that does not require high pressure
e Can process equipment reuse water (closed loop) or use reclaimed water from other parts of the facility
f Have you replaced water-based transportation with either waterless techniques or recycled water
g Are signs posted near equipment encouraging employee awareness of water use and discouraging tampering with equipment flow rate
5 Cleaning and Sanitation
a Are all hoses equipped with an automatic shut-off nozzle
b Has process cleaning or facility cleaning been replaced with waterless techniques (ie using pressurized air to clean products or containers sweeping debris off the floor) where possible
c Are improved rinsing techniques used (counter-current systems sequential use from high to lower quality needs conductivity flow controls improved spray nozzlespressure rinsing fog rinsing etc)
d Is spent rinse-water being reclaimed and reused for lower-grade processes or for other facility applications
e Have steps been taken to reduce the water used by steam sterilizers such as jacket and chamber condensate cooling modification
86
Appendix D Water Efficiency Opportunity Checklist
Water Efficiency Practice Yes No
f Are you using detergents that can easily be removed with little water
6 Landscaping and Irrigation
a Are low-flow sprinklers trickledrip irrigation and optimized watering schedules in use
b Are preventive maintenance techniques in place
c Has your facility designed its landscape to consider the local climate and grouped plants by similar watering needs
d Is grass planted only in places where it will provide optimal functional and aesthetic benefits
e Are systems in place to capture and reuse rain water and storm water for landscaping or for other uses (eg cooling tower make-up process water or dust suppression)
7 Leaks
a Are you conducting regular leak inspections
b Are leaky faucets faulty fittings and broken pipes and hoses identified and repaired promptly
c Are employees (including custodial crews) educated and em-powered to identify leaks and point them out for repair
d Is there a user-friendly method to report leaks
8 Comments
9 Recommended Follow-Up Actions34
34 For additional guidance see EPA Office of Water ldquoWaterSense at Work Best Management Practices for Commercial and Institu-tional Facilitiesrdquo wwwepagovwatersense North Carolina Department of Environment and Natural Resources Water Efficiency Manual for Commercial Industrial and Institutional Facilities wwwp2paysorgref0100692pdf East Bay Municipal Utility District of Oakland WaterSmart Guidebook wwwebmudcomfor-customersconservation-rebates-and-servicescommercial watersmart-guidebook and Arizona Municipal Water Users Association Facility Managerrsquos Guide to Water Management http amwuaorgpdfsfacility_managers_guidepdf
87
Appendix E Glossary of Water Terms Most of the definitions provided here are from the Alliance for Water Efficiencyrsquos water glossary available at wwwallianceforwaterefficiencyorgGlossaryaspx That glossary has a more extensive set of water-related terms and abbreviations
B
Best management practice (BMP)
Equipment or behavioral measure(s) established as the most practicable means of increasing water efficiency
Blowdown (or Bleed-off)
Draining off the water in a cooling tower reservoir or boiler to avoid the buildup of excess dissolved solids
E
End use A fixture appliance or other specific object or activity that uses water
M
Makeup water Fresh water introduced into a cooling tower or boiler to replace water lost to evaporation and blowdown
P
Peak use (demand)
The maximum demand occurring in a given period such as hourly or daily or annually Peak use can incur sur-charges above the normal base water cost charged by the utility
R
Reclaimed water Municipal wastewater effluent that is given additional treatment and distributed for reuse in certain applica-tions Also referred to as recycled water
Reverse osmosis A process to remove dissolved solids usually salts from water Salty water is forced through membranes at high pressure producing fresh water and a highly concentrat-ed brine
S
Source meter A meter that measures the quantity of water being sup-plied to a facility
88
89
Appendix E Glossary of Water Terms
Submeter A meter that measures usage for specific activities within a facility such as cooling towers process use or land-scape water use
W
Water audit An on-site survey of facility water use to measure equip-ment and management efficiency and generate recom-mendations to improve efficiency
Water balance A chart table or diagram that tracks water flow through a building or facility showing total inflows and total outflows (eg consumption irrigation evaporation leaks and losses)
Water conservation
1 Any beneficial reduction in the water loss waste or use
2 A reduction in water use accomplished by implemen-tation of water conservation or water-efficiency mea-sures
3 Improved water management practices that reduce or enhance the beneficial use of water
Water efficiency A measure of the amount of water used versus the mini-mum amount required to perform a task In irrigation the amount of water beneficially applied divided by the total water applied
Water footprint An analysis of the total volume of freshwater that is used directly and indirectly to run and support the business or to produce a product encompassing water use within an industrial facility throughout its supply chain and final disposition of the product
Lean and Water Toolkit
United States Environmental Protection Agencywwwepagovlean
October 2011EPA-100-K-11-003

Lean and Water Toolkit
Lean and Water Toolkit
Acronyms and Abbreviations 3P Production Preparation Process or Pre-Production Planning
5S Sort Set in order Shine Standardize Sustain
BMP Best management practice
CO Changeover time
CT Cycle time
E3 Economy Energy and Environment
EHS Environmental Health and Safety
EPA Environmental Protection Agency
GEMI Global Environmental Management Institute
gpf Gallons per flush
gpm Gallons per minute
LEED Leadership in Energy and Environmental Design
MEP Manufacturing Extension Partnership
NIST National Institute of Standards and Technology
psi Pounds per square inch
TPM Total Productive Maintenance
Lean and Water Toolkit
i
Executive Summary
Executive SummaryThis Lean and Water Toolkit describes practical strategies for using Lean manufacturingmdashthe production system developed by Toyotamdashto reduce water use while improving operational per-formance Drawing from the experiences and best practices of multiple industry and government partners this toolkit explores opportunities to identify and eliminate ldquowater wasterdquo including
bull Water losses and leaks
bull Non-value added or inefficient use of water
bull Missed opportunities to reuse water
bull Wastewater discharges
bull Unnecessary water use and risks throughout the supply chain
bull Missed opportunities to address customersrsquo water-efficiency goals
This toolkit is a supplement to EPArsquos Lean and Environment Toolkit (wwwepagovleantoolkit) which addresses all types of environmental wastes and improvement opportunities
Why Address Water Using Lean Companies recognize water use and availability as a critical business concern While direct water costs may be low many indirect costs associated with water use can make the full cost of water substantial Community concerns about water and the risk of water supply disruptions can increase pressures on companies to reduce water use Incorporating water use reduction into Lean initiatives provides an efficient and effective means to
1 Uncover cost savings and operational improvements
2 Reduce water-related business risks
3 Deliver value for customers and employees
Facilities already using Lean can often easily incorporate water considerations into value stream maps and other Lean efforts At the same time facilities conducting water efficiency initiatives may find that Lean tools provide a powerful means to drive effective implementation and results Con-necting Lean and water efforts can engage employees in powerful and rewarding ways that build capacity and momentum to solve problems and create value
Understand Water Uses and Costs The toolkit discusses common water end uses in industrial and manufacturing facilities and discuss-es costs associated with water use Costs of water include not only the cost of purchasing water but also costs associated with treatment heating conveyance and regulatory compliance Metering and sub-metering are important tools for understanding actual water use within a facility and tracking it over time
ii
Executive Summary
Find Water Waste The toolkit discusses several techniques to find water waste and opportunities at your facility in-cluding
bull Water Gemba Walks Have a team walk the factory floor together to observe and inventory inefficiencies related to water use
bull Water Balance Develop a diagram of your facilityrsquos water use that shows and quantifies the flows of water into and out of each process or operation in the facility
bull Value Stream Mapping Add information on water use andor costs to Lean value stream maps to help identify water waste and develop implementation plans for Lean and water efficiency improvement efforts
bull Root Cause Analysis Use root cause analysis methods to explore the underlying causes of water waste and inform improvements
Improve Operations and Processes with Lean and Water Strategies Solutions to reduce water waste can be identified during Lean events and in daily implementation of Lean principles and tools The toolkit discusses facility operations and support functions in which there may be specific improvement opportunities Strategies include
bull Waste Elimination Culture Encourage employees to identify water waste throughout their daily activities and create a culture in which they are empowered to continually im-prove the way your facility uses water
bull Kaizen Events and Just-Do-Its Pursue opportunities to address water waste during Lean kaizen events Consider focusing kaizen events specifically on water waste or water-intensive processes Also find quick opportunities for individuals to immediately improve a process or operation in just-do-it projects
bull Standard Work Embed water use management and efficiency tasks into standard operat-ing procedures to engage all employees in proactive water-efficiency activities
bull Visual Controls Use signs and visual controls to reinforce water waste reduction practices and standard work Clearly display information on water use and costs to raise awareness
bull 5S Incorporate water management and waste reduction activities into 5S housekeeping activities such as cleaning and inspections to engage all employees in identifying and eliminating water waste
bull Total Productive Maintenance Enable teams of workers to quickly identify and correct problems fix leaks and improve water efficiency while optimizing the effectiveness of your manufacturing equipment
iii
Executive Summary
These Lean tools can be used at a facility in concert with water-efficient best management practices (BMPs) that are often available from industry associations and government agencies1 Industrial facilities can target their efforts to the most effective solutions using these technology and process-based improvements
Extend Lean and Water Efforts throughout the Value Chain Looking beyond facility operations can allow you to uncover new ways to reduce water use and risks while adding value and improving business operating conditions and market opportunities Strategies include
bull Supply Chain Initiatives Work with your suppliers to improve understanding of water use costs and risks Provide incentives and technical support to help suppliers identify and eliminate water waste Collaborate with supply chain partners to address water-related op-portunities through joint Lean events and other initiatives
bull Engage Local Communities Educate and engage your employees in water-efficiency efforts at your facility and encourage them to adopt similar practices at home Partner with community members and local organizations to conduct projects or Lean events that improve water use andor quality in the community
bull Product Design Incorporate water efficiency and reuse as design criteria into Lean prod-uct and process design methods as a powerful means of reducing the water use of products throughout their lifecycle
Starting Your Lean and Water Journey There are many ways to get started with identifying and reducing water waste and improving busi-ness results using Lean Consider using the strategies and techniques in this toolkit to help you
1 Learn more about how your facility uses water
2 Engage employees in Lean and water improvement efforts
3 Connect Lean and water efforts to sustainable water management strategies
We hope the strategies and tools in this toolkit will help you on your Lean and water journeymdashen-abling you to reduce water waste and costs improve processes and foster positive relations with your customers and community
1 Appendix A provides information on water efficiency resources and technical assistance providers that offer helpful information on BMPs Also consider contacting your local water utility or the industry or trade association in your sector to inquire about water-related BMPs and resources
iv
Preface
Preface
Purpose of This ToolkitThe Lean and Water Toolkit offers Lean implementers practical strategies and techniques for improving common Lean results related to time cost and quality while also reducing water use costs and risk Environmental Health and Safety professionals will also find useful infor-mation in this toolkit for how to leverage Lean and Six Sigma business improvement methods to eliminate water waste Finally the toolkit introduces Lean practitioners to the wide array of water efficiency resources available from EPA and other organizations
The ldquoLeanrdquo methods discussed in this toolkit are organizational improvement methods pioneered in the Toyota Production System Lean production and Lean manufacturing refer to a customer-focused business model and collection of methods that focus on the elimination of waste (non-value added activity) while delivering quality products on time and at a low cost Six Sigma is a business model that focuses on improving quality by eliminating variation it is often combined with Lean The toolkit assumes that you are familiar with Lean methods For those who want to learn more about Lean see EPArsquos Lean and Environment website (wwwepagovlean)
Key Questions Addressed by This Toolkit Lean works well when it focuses on identifying and eliminating waste This toolkit contains strate-gies and techniques that can enable Lean practitioners to easily identify water waste and improve-ment opportunities alongside the myriad other wastes and improvement opportunities uncovered by Lean To accomplish this the toolkit aims to answer the following questions
What is water waste Water is required in substantial quantities to produce goods from food products to silicon chips Water waste is water that is used beyond the point at which it ceases to add value to the customer Excess water use often leads to wastewater which can harm human health and the environment through the pollutants it collects and overdrawing water resources in certain regions can exacer-bate water scarcity concerns Water can be wasted in the supply chain through facility operations and in product use and disposal This toolkit will help you to recognize water waste so that you can work to reduce it
Why should you address water waste with Lean Substantial water savings can ride the coattails of Lean improvement By eliminating manufactur-ing wastes such as unnecessary processing and cleaning businesses also reduce the water and associated labor and energy costs needed for cleaning conveyance cooling and heating Chapter 1 describes benefits of combining Lean and water efficiency efforts and discusses how to get started Chapter 2 provides an overview of industrial water use including information on water uses water metering and water costs
v
Preface
How do you know how much and where water is used in your facility A key step in effective Lean and water efforts is determining where to target water efficiency im-provement activities Chapter 3 discusses techniques for measuring water use and identifying op-portunities to reduce water use in the context of Lean Methods include gemba walks water balance value stream mapping and root cause analysis
How can you reduce water use with Lean methods Chapter 4 examines specific opportunities for using Lean methods to improve water efficiency including kaizen events standard work visual controls 5S and total productive maintenance These strategies present ways that you can integrate water efficiency principles and practices into the practical implementation-based tools of Lean manufacturing and the waste-elimination culture fostered by Lean
How can you use Lean to pursue water efficiency opportunities beyond your facilityrsquos operations For many companies water costs and risks may be driven by factors and activities beyond the facility fence-line Similarly opportunities to capture market value and win customers may require considerations upstream to manufacturing activities Chapter 5 explores strategies to leverage Lean initiatives and methods to reduce water risks in your supply chain and to engage the local commu-nity in water saving initiatives Chapter 5 also discusses how Lean product design methods can be used to improve water efficiency and add value by addressing customer water needs
Lean and Water Toolkit
1
CHAPTER 1
Introduction
Water is a crucial resource for the world economy Lean provides a framework in which organiza-tions can address water waste while saving costs reducing risks and adding customer value This chapter includes the following sections
bull Importance of Water to Industry bull Benefits of Addressing Water with Lean bull Getting Started with Lean and Water
Importance of Water to Industry Companies worldwide identify water issues as a critical business concern Water is essential for a range of industrial processes and support functions facility operations and as an ingredient for many products Water use is increasing much faster ldquoI am convinced that under present than population growth and regional and seasonal conditions and with the way water is differences in water availability can lead to short- being managed we will run out of ages and even water-related conflicts The World water long before we run out of fuelrdquo Economic Forum reports that 44 percent (28 billion) of people currently live in areas of the Peter Brabeck-Letmathe Chairman
world that are water stressed and if present trends Nestle Corporation
continue water scarcity will affect the livelihood of Source ldquoA water warning Peter Brabeck-Letmathe chairman of Nestleacute argues that water shortage is an even more urgent problem than climate changerdquo The Economist November 19 2008one-third of the worldrsquos population by 20252 wwweconomistcomnode12494630
Corporations are recognizing the important role they play in addressing water resource chal-lenges and companies are responding by engaging in efforts to measure report and reduce their water use In a survey conducted by the Carbon Disclosure Project of 302 of the worldrsquos largest 500 companies 89 percent of responding companies had developed specific water policies strategies and plans and 67 percent indicated that responsibility for water-related issues lies at the Board or Executive Committee level3 The United Nationsrsquo CEO Water Mandate launched in 2007 is designed to help companies develop implement and report on water sustainability policies and practices Industry-led associations such as the World Business Council for Sustainable Development and the Global Environmental Management Initiative also have major water initiatives
One key reason why companies choose to use water more efficiently is to improve their relationship with the communities that surround industrial facilities Water use is of paramount importance to a facilityrsquos relationship with its surrounding community Facilities that use less water in drought-
2 World Economic Forum ldquoThe Bubble Is Close to Bursting A Forecast of the Main Economic and Geopolitical Water Issues Likely to Arise in the World during the Next Two Decadesrdquo Draft Report for Discussion at World Economic Forum
3 Carbon Disclosure Project ldquoCDP Water Disclosure 2010 Global Reportrdquo available at wwwcdprojectnetCDPResultsCDP-2010-Water-Disclosure-Global-Reportpdf
2
Chapter 1 Introduction
prone areas leave more water available for residential use Some companies even risk being forced to withdraw from regions where water is a scarce resource a problem that is likely to recur as water scarcity increases in many regions around the globe In some cases communities around industrial facilities show much greater concern for the amount of water a facility uses than the amount of energy it uses
This toolkit provides strategies and tools for addressing water issues within the context of Lean manufacturing and other business process improvement methods
Benefits of Addressing Water with Lean Lean provides powerful tools for delivering value to customers in a manner that minimizes waste and risks from unnecessary water use Explicit consideration of water waste during Lean imple-mentation can create significant value for an organization helping to deliver quality products and services that customers want when they want them Research sponsored by EPA and others shows that some water use and waste reduction benefits typically ride the coattails of Lean efforts yet other opportunities to reduce wastes risks and non-value added activity associated with water may be overlooked There are three key benefits of addressing water with Lean as listed in Box 1 and further described below
Key Benefits of Addressing Water with Lean (Box 1)
1 Uncover cost savings and operational improvements
2 Reduce water-related business risks
3 Deliver value for customers and employee
Uncover Cost Savings and Operational Improvements Learning to see and eliminate waste is a cornerstone of Lean initiatives Water waste is often a sign of inefficient production and non-value added activity and it frequently indicates opportuni-ties for saving costs and time Lean and water strategies can help you to uncover cost savings and improvements in areas of your facilityrsquos operations that may not have received as much attention in your Lean efforts For production processes that are highly dependent on water or that have water-intensive support processes such as wastewater treatment the operational and environmental benefits from Lean and water efforts are even more significant
Learning to see water and other environmental waste during Lean efforts can reveal significant business improvement opportunities further strengthen Lean results and improve environmental performance Box 2 provides several examples of how companies have used Lean and Six Sigma methods to reduce water use save costs and improve their performance
3
Chapter 1 Introduction
Example Results From Lean and Water Efforts (Box 2)
3 IBM used Six Sigma tools to reduce water consumption and operating costs in wafer fabrication processes saving $3 million annually reducing water usage by 27 percent and increasing production by over 30 percent
3 GE combined high-tech water metering and other water efficiency prac-tices with its kaizen improvement methodology resulting in a 30 percent drop in water use since 2006
3 DTE Energy saved 20 million cubic feet of water (79 percent) and $700000 annually in a Lean Six Sigma project examining electric substa-tion water use
Sources IBM ldquoGreen Sigma Overviewrdquo Presentation to EPA June 2009 GE info cited in Carbon Disclosure Project ldquoCDP Water Disclosure 2010 Global Reportrdquo page 25 available at wwwcdprojectnetCDPResultsCDP-2010-Water-Disclosure-Global-Reportpdf and Jason Schulist DTE Energy ldquoLean Towards Sustainability How to Use Lean and Six Sigma Methods to Drive Your Sustainability Journeyrdquo Presentation at Green Six Sigma Conference May 19 2009
While many places have very low direct costs for water and wastewater there are also indirect costs to water use These costs can be significant yet they are often hidden in overhead or support cost centers (see Box 3 for examples of how facilities have uncovered water waste and costs) Examples of water costs include
bull Raw Material Costs Costs of measures to ensure that purchased water supply is of suf-ficient quality for use at a facility For example some facilities may bear costs for labor equipment and materials needed to improve water quality before use (eg when water is a key product ingredient) as well as for chemicals and other raw materials needed to treat and manage water at the facility and before discharging it Water treatment costs associated with deionized water and reverse osmosis can be substantial
bull Energy Costs for the energy required to heat and cool water pump or transfer water operate water-consuming equipment treat water and wastewater and other functions
bull Pollution Control Wastewater service costs paid to a utility andor industrial pretreat-ment costs for the energy labor materials equipment and chemicals needed to treat wastewater before discharging it from the facility
bull Regulatory Compliance Costs for regulatory compliance activities such as completing permit applications and tracking and reporting wastewater discharges to regulatory agencies In the United States industrial municipal and other facilities must obtain National Pollutant Discharge Elimination System permits if the facilities discharge water pollutants directly into US waters Pretreatment regulations govern industrial facilities that discharge into municipal sewer systems Also in some food and consumer product industries water use may be important to address Food and Drug Administra-tion sanitation requirements
4
Chapter 1 Introduction
Lean and water strategies such as those outlined in this toolkit help to reveal these costs and identify process improvement solutions The next chapter provides more information about water end uses and costs
Learning to See Water Waste and Costs (Box 3)
3A wood products company began metering water into two parallel process units and discovered one was using significantly more water than the other After some investigation the company identified and implemented mainte-nance practices that would substantially lower water use while also prevent-ing equipment failure and downtime
3A food processing company regarded the water supply from its groundwater well as essentially free While completing a facility water balance it me-tered the amount of hot water used for one process step Once the com-pany realized it was heating 25 gallons per minute of ground water from 55 degrees to boiling it began to think of opportunities to reduce and reuse the energy in the hot water rather than sending it down the drain
3A small high tech silicon wafer company was paying its city water utility $120 per hundred cubic feet of water After calculating the cost of pre-treating its process water and adding wastewater treatment and discharge expenses the company realized that the full cost of water was five times the initial cost of purchasing water These insights led the company to reuse rinse water in the process reducing total water use and demand for ultra pure water without affecting product quality
Reduce Water-Related Business Risks Lean provides an effective platform for reducing facility water use and the associated water-related business risks While the specific risks that individual facilities face vary examples of water-related risks include water shortages and reliability issues water quality issues that drive the need for additional water treatment increasing water costs and supply chain interruptions In some water-scarce regions there may be challenges with meeting basic human needs for clean water and sani-tation competition for scarce water resources may be intense between uses associated with public water supply agriculture industry and fisheries Climate change is predicted to exacerbate many of these water risksmdashincreasing global temperatures will likely lead to increases in water de-mand water scarcity more vulnerable ecosystems and more frequent extreme weather events4
How companies respond to water risks can also have important implications for how local commu-nities and customers perceive those companies 4 For more information on water and climate change see CERES and Pacific Institute ldquoWater Scarcity amp Climate Change Grow-
ing Risks for Businesses amp Investorsrdquo February 2009 available at wwwpacinstorgreportsbusiness_water_climatefull_report pdf For a discussion of business perspectives on the connections between water energy and climate change see World Business Council for Sustainable Development ldquoWater Energy and Climate Change A Contribution from the Business Communityrdquo March 2009 available at wwwwbcsdorg
5
Chapter 1 Introduction
Types of Water-Related Business Risks (Box 4)
Companies face a variety of risks related to water security including
3Business Interruption Risks that the supply of water may be disrupted in the supply chain production andor product use
3Reputation Risks related to public scrutiny of how companies respond to water resource challenges and engage with communities stakeholders and employees
3Regulatory Risks of increased government regulations or restrictions on water use and water pollution as well as the associated costs to respond to the requirements
3Access to Capital Risks of financial institutions adopting stricter lending and investment policies based on water uncertainties
Source World Economic Forum ldquoThe Bubble Is Close to Bursting A Forecast of the Main Economic and Geopolitical Water Issues Likely to Arise in the World during the Next Two Decadesrdquo Draft Report for Discussion at World Econom-ic Forum Annual Meeting 2009 January 2009 page 39 www3weforumorgdocsWEF_ManagingFutureWater20 Needs_DiscussionDocument_2009pdf
Reducing non-value added water use is a key strategy for mitigating water risks Integrated Lean and water strategies offer practical solutions that support multiple business objectives such as increased efficiency reduced costs improved customer responsiveness and decreased water and energy use By engaging employees in teams to identify and eliminate sources of water waste in your facilitymdashalongside other production wastes such as over processing defects and delays your facility can proactively reduce water risks while also supporting operational goals Proactively en-gaging with local utilities and communities to collaboratively address water resource challenges can provide additional opportunities to reduce business risks and increase value These efforts will make your facility less vulnerable to risks and better positioned to succeed given changes in water supply demand and quality
Deliver Value for Customers and Employees Reducing water use and risks through Lean Six Sigma and other process improvement meth-odologies can foster a competitive advantage for some businesses Customers and employees may view proactive environmental improvement efforts as an important attribute affecting customer loyalty and the ability to attract and retain employees In some market segments ldquogreenrdquo attributes are an important factor that can give a product or company competitive advantage People around the world view water issues as a key sustainability challenge For example more than 90 percent of the 32000 people polled in 15 countries for a GlobeScan and Circle of Blue survey in 2009 perceived ldquowater pollutionrdquo and ldquofreshwater shortagerdquo to be serious problems (70 percent considered them very serious problems)5 Some companies can tap into significant market niches by providing cus-tomers with water-efficient choices and solutions 5 GlobeScan and Circle of Blue ldquoWater Views Water Issues Researchrdquo August 19 2009
wwwcircleofblueorgwaternewswp-contentuploads200908circle_of_blue_globescanpdf
6
Chapter 1 Introduction
Participation in international or national water sustainability programs or local water efficiency efforts can provide businesses with public recognition and a competitive advantage for their wa-ter management achievements For businesses that manufacture water-using appliances parts or products companies can use design methods to make their products as water-efficient as possible throughout their lifecycles from manufacturing to use and disposal These methods can allow companies to cater to the steadily growing markets for green building and green products There are also awards and competitions that provide recognition and media publicity for water-related in-novations and efficiency accomplishments
Reducing your facilityrsquos water use and the water that your products require during use can add value for your ldquodownstreamrdquo customersmdashsaving them water and energy costs and helping them meet their water-efficiency goals Business interest in gathering and disclosing water use and risk information through initiatives such as the Global Reporting Initiative and the Carbon Disclo-sure Projectrsquos Water Disclosure Initiative may increase in the coming decade as water becomes a more critical business issue in some supply chains and industry sectors Chapter 5 discusses ideas for engaging with customers suppliers and communities on Lean and water efforts as well as incorporating water issues into Lean product design
Getting Started with Lean and Water There are many ways for a facility to get started with reducing water waste and finding Lean and water improvement opportunities While the possibilities can be daunting the important thing is to begin even if the effort is small Consider starting out with small steps such as tracking water use as a metric at your facility with the goal of reducing use This can be a great strategy for smaller facilities Here are some ideas for initiating a Lean and water effort
Learn More About How Your Facility Uses Water A key first step is learning how your facility uses water and identifying the process areas support functions and facility operations that have the greatest water waste and improvement opportunities Strategies include beginning to track water metrics as part of Lean and process improvement activi-ties and installing water meters on processes that use large amounts of water Box 5 lists examples of water metrics that facilities can use It is helpful for facility managers and Lean champions to track water usage regularly and to share this information with floor staff Regularly monitoring water use data can help you determine the impact of peak periods (eg during summer andor busier production months) and help you spot variations that could be signs of problems
7
Chapter 1 Introduction
Water Metrics (Box 5)
Facility-Wide Metrics
3 Volume of water used each month or other appropriate time period (eg gallonsmonth or gallonsshift)
3 Volume of wastewater (eg gallonsmonth or gallonsshift)
3 Water used for specific end uses (eg gallonsper month for outdoor ir-rigation cooling water evaporation heated process water bathrooms and kitchens etc)
Metrics Normalized to Production
3 Volume of water used per product (eg gallonspound of product gal-lonsproduct)
3 Volume of wastewater discharged per product (eg gallonspound of product or gallonsproduct)
Chapter 2 of this toolkit has more information on water end uses metering and costs
To be most effective in Lean and water implementation efforts Lean champions or operations man-agers should connect with environmental and facilities personnel early on to discuss plans for Lean and water efforts Environmental Health and Safety (EHS) personnel can assist with developing water balances and other assessments of facility and process water use including gathering data on water use and costs as well as helping prioritize Lean and water activities
After completing an initial water assessment managers can consider it in the context of other planned Lean events and prioritize opportunities for involving EHS personnel in value stream map-ping and kaizen events based on when their environmental expertise will add the most value
Engage Employees in Lean and Water Improvement Efforts Lean provides a solid framework to empower cross-disciplinary employee teams to identify and eliminate excess water use and other production waste thereby realizing both environmental and Lean gains Most likely your efforts to examine water use and waste will generate numerous ideas for process improvements and potential solutions Ideas could include water efficiency and reuse opportunities andor Lean events to improve water-intensive processes
bull Motivate employees and managers by communicating corporate sustainability goals and incorporating water efficiency into performance targets and incentives
bull Consider trying out some of the Lean and water improvement ideas in this toolkit but donrsquot limit employee teams to those ideasmdashencourage their creativity and initiative
bull Train employees on how to identify water waste and improvement opportunities building their capacity to problem solve and help meet your facilityrsquos water use reduction targets
8
Chapter 1 Introduction
bull Actively solicit employee suggestions for kaizen events or other improvement projects by inviting ideas in meetings and conversations andor by using a suggestions board or box
A significant benefit of involving employees throughout your facility in Lean efforts is the oppor-tunity to create a culture of continuous improvement When employees are engaged in identifying ways to improve water efficiency they are more likely to note these opportunities and areas of water waste throughout their normal day-to-day operations You might find that improved water efficiency becomes a continual trend at your facility and not just something that happens within the confines of a specific Lean exercise or event
Focus your facilityrsquos initial Lean and water efforts on high-impact easy-to-implement strategies in order to achieve the highest likelihood of success An Impact-Difficulty Matrix such as the one in Figure 1 can be useful for prioritizing among process improvement and implementation options Lean event participants can plot their ideas onto the four quadrants in the matrix based on whether or not an idea would have a large or small impact (either in terms of operational andor environ-mental objectives) and whether or not it would be difficult to implement This process lets people see visually which projects are most ldquoriperdquo for Lean
Connect Lean and Water Figure 1 Impact-Difficulty Matrix Efforts to Sustainable Water Management Strategies Lean and Six Sigma provide operational High tools that can support a broader corporate water sustainability strategy Leanrsquos focus on performance measurement continual improvement through employee engage-ment waste elimination improved ef- Low ficiency increased profits and customer satisfaction can be leveraged to support corporate water management efforts to Low High measure and report water use factor water
Difficulty into business decisions and implement the practical and effective solutions If your organization already has a sustainability policy andor specific water efficiency goals consider how Lean and water strategies could be used to enhance and accelerate those efforts
Risk-Based Water Sustainability Strategies
Depending on the importance of water to your business it may be worth developing a risk-based water sustainability strategy and then seeing how Lean and water efforts could support implementa-tion A number of resources can help you assess specific water-related risks determine the business case for water sustainability and develop implementation plans These include
Impact
9
Chapter 1 Introduction
bull Global Environmental Management Initiativersquos (GEMIrsquos) Connecting the Drops Toward Creative Water Strategies A Water Sustainability Tooltrade wwwgemiorgwater
bull World Business Council for Sustainable Developmentrsquos Global Water Tool wwwwbcsdorgwebwatertoolhtm
bull GEMIrsquos Local Water Tooltrade (scheduled to be released in spring 2012) wwwgemiorgGEMIInteractiveToolsaspx
This toolkit complements broader water sustainability strategy resources (such as those listed above) by exploring practical opportunities to leverage facility Lean and Six Sigma and similar process improvement initiatives to reduce water waste
True North Goals and Targets
Lean experts often extol the motivational power of setting goals and targets that represent the ldquoTrue Northrdquo for operations As noted by Lean expert Robert Hall of the Association of Manufacturing Excellence ldquoTrue North is what we should do not what we can do the ultimate ideal for the overall process and for every sub-process within itrdquo6 True North goals targets and metrics are powerful tools for inspiring and focusing employee attention and creativity to both continuously improve and find breakthrough solutions For example Nike Inc developed ldquoNorth Starrdquo goals and metrics to define what sustainable products and a sustainable company would look like which includes a focus on water stewardship7 Consider what the True North target is for water use in your facility For many facilities the True North targets may be zero wastewater and zero water use that is not incorporated into the product
Examining the Full Value Chain
To achieve sustainability goals itrsquos important to look beyond a facilityrsquos direct operations Lean methods can support water use and risk reduction efforts not only at areas within the direct control of a manufacturing or industrial facility but also throughout the lifecycle or extended value chain for a product or servicemdashfrom the extraction and processing of raw materials through production processes and onto product distribution use and disposition While the primary focus of this toolkit is on reducing water use at your facility Chapter 5 discusses opportunities to extend Lean and water techniques to other areas Figure 2 provides an illustration of how the content of the toolkit links to a value chain
6 Robert Hall ldquoThe Toyota Production System Seeks True Northrdquo Lean Directions e-Newsletter 2011 available at wwwsmeorgcgi-binget-newsletterplLEANamp20040709amp1amp
7 For more information on Nikersquos North Star see httpwwwnikebizcomcrreportcontentenvironment4-1-0-overviewphpcat=overview
10
Chapter 1 Introduction
Figure 2 Lean and Water Implementation Strategies
Understand Water Uses and Costs (Chapter 2)
Find Water Waste (Chapter 3)
Improve Operations and Processes with Lean and Water Strategies (Chapter 4)
Extend Lean and Water Efforts Throughout the Value Chain (Chapter 5)
Sourcing Materials and Inputs (Chapter5)
Production Manufacturing (Chapters 3 and 4)
Product Distribution Use and Disposition (Chapter 5)
To Consider
3Is water use responsible for major costs waste or risk at your organiza-tion If you donrsquot know how would you find out
3How has Lean affected your organizationrsquos use of water
3How could your organization benefit from efforts to reduce water waste us-ing Lean (Think about time and cost savings reduced risks and liabilities added value to customers etc)
3What ideas do you have for reducing water waste using Lean
11
CHAPTER 2
Water Use and Water Waste at Industrial Facilities
Understanding water use is an important first step in efforts to reduce water-related wastes costs and risks This chapter contains the following sections
bull Definition of Water Waste bull Industrial Water Use bull Water End Uses How Water Is Used at Facilities bull Measuring Facility Water Use Metering and Submetering bull Costs Associated with Water Use
Definition of Water Waste Water is one of the most critical resources in the world and is necessary for all types of industry Water is required in substantial quantities to create goods from food products to silicon chips In this toolkit the term ldquowater wasterdquo refers to use of water beyond the point that optimizes value to the customer This includes non-value-added water use throughout facility operations and support processes and from the supply chain through production product use and waste disposal Water waste can cause harm to health and well-being of people and ecosystems by diverting water from other needs and beneficial uses Reducing water waste can help ensure that present and future gen-erations have access to a sustainable water supply
Improve your facilityrsquos water efficiency by reducing water waste not only by reducing water intake but by finding creative ways to use water more efficiently Water efficiency as the term is used in this toolkit refers to reductions in the amount of water used per unit of production Water effi-ciency refers to the minimum amount of water needed to perform a task (Note that water-efficiency improvements do not necessarily mean that a facilityrsquos total water use is decreased since increases in production may offset water efficiency gains) Examples of water waste include
bull Loss of water through material failures such as leaky hose nozzles
bull Discarding water that could be reused such as treated rinse water
bull Wastewater discharges
bull Water used by high-flow appliances instead of more efficient alternatives
bull Use of water in excess of necessity such as the use of too much water for facility or parts cleaning
Understanding the many places where water waste occurs is an important first step for identifying areas for improvement
Chapter 2 Water Use and Water Waste at Industrial Facilities
Industrial Water UseThe use of water by industries both in the United States and throughout the world represents a significant portion of total water use US industrial water use is estimated to be more than 182 billion gallons per day (from direct water withdrawals not including water use from public water supply)8 While industrial water withdrawals account for just five percent of total water withdrawals in the United States thermoelectric power water withdrawals account for 49 percent Industrial and manufacturing businesses also use about 12 percent of the public water supply Industrial water us-ers include facilities involved in sectors such as chemicals food and beverage paper and associated products steel electronics and computers metal finishing petroleum refining and transportation equipment Overall two of the most water consuming sectors of the economy are agriculture and thermoelectric power although other industries may use a significant proportion of public water supplies in some areas
The share of industrial water use can be much greater in certain geographic areas and these areas can experience substantial supply pressures Figure 3 below shows a geographic distribution of wa-ter scarcity across the globe Areas prone to water scarcity will likely experience continued competi-tion for water resources which can impact your relationship with the surrounding community Be aware of your facilityrsquos location relative to potential water scarcity and consider water competi-tion when siting new facilities or building relationships with new suppliers In the United States the National Integrated Drought Information System maintains a user-friendly web portal(www droughtgov) with current information forecasts maps reports and resources addressing drought conditions and water scarcity
Industrial water use varies by sector as different activities require different inputs of water Box 6 lists eight industries that require substantial inputs of water
Water-Intensive Industries (Box 6)
3 Agriculture
3 Apparel
3 Beverages
3 Biotechnologypharmaceuticals
3 Electric power
3 Forest products
3 High-tech (including semiconductor manufacturing)
3 Metalsmining
8 Kenny Joan F et al Estimated Use of Water in the United States in 2005 USGS 2009 httppubsusgsgovcirc1344 The USGS data does not include industrial water use drawn from municipal water systems only direct withdrawals from surface and groundwater sources Actual industrial water use is likely greater For information on water use outside of the US see AQUASTAT Food and Agricul-ture Organization of the United Nations ldquoWater Withdrawal by Sector Around 2003rdquo data downloaded November 2010 wwwfaoorg nrwateraquastatmainindexstm Note that FAO data includes thermoelectric cooling water withdrawals in its industrial water totals
12
13
Chapter 2 Water Use and Water Waste at Industrial Facilities
Figure 3 Water Scarcity Map of the World
Source United Nations Environment Programme Map of Water Stress Indicator in Major Basins 2004 available at http mapsgridanogographicwater-scarcity-index
Water is a very important resource to many industries and as a result there are many opportuni-ties to reduce water use In the case of the high-tech industry which uses considerable quantities of water to manufacture semiconductors and other components water is vital to industry opera-tions Cleaning and rinsing silicon chips can require billions of gallons of water per year to produce a single chip can use up to 7900 gallons9 Apparel also ranks high in the list of water-intensive industries with cotton production and textile processing requiring substantial inputs of water Among industrial manufacturers the forest products sector is the third-largest consumer of water in the US requiring high volumes of water for pulp and paper manufacturing The electric power industry directly uses water extensively for cooling and emissions scrubbing fossil fuel plants and nuclear power plants require hundreds of liters of water for every kilowatt-hour of electricity that they produce10 Table 1 shows typical water quantities required to produce one ton of several manu-factured products
9 Uphadyay Sanjay ldquoMicroelectronics ndash Fostering Growth Opportunities in the Ultrapure Water Marketrdquo Frost amp Sullivan August 19 2011 available at wwwfrostcomprodservletmarket-insight-toppagdocid=240394448
10 CERES and Pacific Institute ldquoWater Scarcity amp Climate Change Growing Risks for Businesses amp Investorsrdquo February 2009 available at wwwpacinstorgreportsbusiness_water_climatefull_reportpdf
Chapter 2 Water Use and Water Waste at Industrial Facilities
Table 1 Typical Water Use Per Ton of Product
Paper 21000ndash528000 gallons
Beer 2113ndash6604 gallons
Sugar 792ndash105668 gallons
Steel 528ndash92460 gallons
Soap 264ndash9246 gallons
Gasoline 26ndash10566 gallons
Source United Nations World Water Assessment Programme United Nations World Water Development Report Water in a Changing World 2009 available at wwwunescoorgwaterwwapwwdrwwdr3
There is much variation among industrial sectors in relative water use and the need for water varies greatly across the stages of the product or service value chain from suppliers through production to product use It is important to know where in the value chain your industryrsquos water use is heavi-est so that you can appropriately target improvement efforts For example the apparel industry uses high volumes of water in raw material production whereas the biotech and pharmaceuticals industry uses most of its water resources in direct operations Table 2 shows the relative intensity of water impact (ranging from zero to three squares) in different segments of the value chain for several industry sectors
Table 2 High-Impact Water Use Sectors
Raw Material Production
Suppliers Direct Operations
Product Use End of Life
Apparel n n n n n
High-Tech Electronics
n n n
Beverage n n n n
FoodAgriculture n n n n n
Biotech Pharmaceuticals
n
Forest Products n n n
MetalsMining n n n n
Electric Power Energy
n n n n
Source CERES and Pacific Institute ldquoWater Scarcity amp Climate Change Growing Risks for Businesses amp Investorsrdquo February 2009 available at wwwpacinstorgreportsbusiness_water_climatefull_reportpdf
14
15
Chapter 2 Water Use and Water Waste at Industrial Facilities
Water End Uses How Water Is Used at Facilities In order to reduce water waste in industry it is important to understand the many ways that water is used within facilities Understanding water end uses is critical to identifying water savings opportunities While end uses of water vary by industry and by facility there are categories of water use that are present at most industrial facilities Water use in most industries can be classified into the following broad end uses
bull Production processing and in-product use
bull Auxiliary processes (eg pollution control labs and cleaning)
bull Cooling and heating (eg cooling towers and boilers)
bull Indoor domestic use (eg restrooms kitchens and laundry)
bull Landscape irrigation
These broad categories encompass many of the ways industrial facilities use water Among US industrial customers cooling operations (including cooling towers and open cooling systems) com-prise the single largest category of industrial water end use with more than 50 percent of industrial and commercial water demand combined going toward cooling11
The amount of water required for the various end uses differs by industry Service and manufactur-ing facilities require the most water for washing and processing while food and beverage facilities use most of their water intake in product preparation Figure 4 shows examples of water end uses in the computer and electronics manufacturing industry and the food processing industry
11 Vickers Amy Handbook of Water Use and Conservation WaterPlow Press 2001
16
Chapter 2 Water Use and Water Waste at Industrial Facilities
40
20
20
10
5 5
Figure 4 Breakdown of Water Uses in Two Industries
Rinsing
Cooling Systems
Fume Scrubbers
Water Purification
RestroomsOther
Landscaping
Computer and Electronics Manufacturers
3
42
14
13
9 Washing and Sanitation
Cooling and Heating
OneshyPass Cooling
Process
Domestic
OtherUnaccounted
Source Adapted from New Mexico Office of the State Engineer ldquoA Water Conservation Guide for Commercial Institutional and Industrial Usersrdquo July 1999 available at wwwosestatenmuswater-infoconservationpdf-manualscii-users-guidepdf
Major end uses of water often provide the greatest opportunities for water waste reduction and efficiency improvement For example in many food beverage and pharmaceutical companies cleaning process equipment can account for as much as 50 to 70 percent of a facilityrsquos total water use and represents a substantial opportunity to save water12 Figure 5 illustrates how water flows through several different end uses at an industrial facility note that this diagram does not incorpo-rate all reuse options Think of how a similar diagram would look that shows the water use at your facility
12 General Electric Company Water amp Process Technologies ldquoSolutions for Sustainable Water Savings A Guide to Water Efficiencyrdquo 2007 available at wwwgewatercompdfCapabilities20Brochures_CustAmericasEnglishBulletin1040enpdf
19
Food Processors
17
Chapter 2 Water Use and Water Waste at Industrial Facilities
Figure 5 Example Water End Uses at an Industrial Facility
Cooling amp Heating
Production Processes
Auxiliary Processes
Indoor Domestic Use
Landscape Irrigation
Treatment
Water Supply
Water in Products Wastewater Stormwater Losses Losses
Beyond these categories of water end use specific industries have processes that demand significant amounts of water For example in the textile industry a typical continuous fabric bleach range machine can consume 11000 gallons of water per hour13
Measuring Facility Water Use Metering and Submetering To gain a better understanding of water use patterns at your facility it is almost always helpful to use water meters Many Lean methods rely on the availability of timely and accurate information on key performance metrics By measuring water use and flows at the facility andor process level it becomes much easier to identify water efficiency opportunities As the saying goes you canrsquot manage what you donrsquot measure There are two types of water meters Source meters measure the amount of water being supplied to the facility while submeters measure usage for specific activities such as cooling towers process use or landscape water use
Water meters can be either portable or fixed on specific equipment Use portable water meters to measure water flows for processes or operations in your facility as part of Lean efforts such as gemba walks value stream mapping and kaizen events (strategies discussed in chapters 3-4) You can strap a hand-held acoustic water meter onto a pipe at a few places where you think there might be excessive water use Compare the water data from the master meter to the water flowing through the pipes in the process to confirm where there are potential water savings opportunities These data can help you develop a water balance (described in chapter 3) See Appendix B for resources to help you determine rates of water use including calculations and unit conversions
13 North Carolina Department of Environment and Natural Resources Water Efficiency Manual for Commercial Industrial and Institutional Facilities May 2009 available at wwwp2paysorgref0100692pdf
18
Chapter 2 Water Use and Water Waste at Industrial Facilities
Figure 6 Portable Water Meter
Source Eno Scientific wwwenoscientificcom
Accurately measuring water use can help you identify areas for targeted reductions and track progress from water-efficiency upgrades Submeters can also help identify leaks and indicate when equipment is malfunctioning In some cases it may also be useful to measure water pressure a drop in pressure can indicate the presence of a leak However especially for smaller facilities it will not necessarily make sense to use meters everywhere Consider using meters when you have a need to closely track data for example before and after a process improvement event on a water-inten-sive process You can use the data provided by the meters to compare water use and see how your efforts have improved your facilityrsquos water efficiency Larger facilities can also integrate meters into centralized building management systems making it easy to electronically track water usage gener-ate reports and trigger alerts when leaks or anomalies are found For additional advice on when to use water meters consult your local water utility or the resources in Appendix A
Installing the correct meter and ensuring it functions properly are critical to accurate water measurement There are many types and sizes of meters intended for different uses so it is impor-tant to choose the correct one Improper sizing or type of meter can cause problems For example
14 Smith Timothy A Plumbing Systems and Design Water-Meter Selection and Sizing 2008 wwwpark-usacomhomeaspxelid=71amparl=108
19
Chapter 2 Water Use and Water Waste at Industrial Facilities
an undersized water meter can cause excessive pressure loss reduced flow and noise Oversized me-ters are not economical and do not accurately measure minimal flow rates14 It is also important to ensure that water meters are properly calibrated according to the manufacturerrsquos recommendation and that appropriate maintenance practices are followed on metering equipment Most meters have internal mechanical parts and will begin to under-register the amount of water used as the meter gets older and the mechanical parts wear down When abnormal water measurements are detected check the metering equipment to ensure that the results are not due to metering equipment failures
By metering water use at the facility and process levels facility personnel can compile data to inform Lean improvement efforts Here are some practical tips for using water meters as a part of Lean efforts
bull Use flow meters and water quality or cleanliness standards to establish standard work for water usage flow and pressure levels taking into consideration ldquoset pointsrdquo recom-mended by equipment specifications and facility operating procedures These baseline levels give important context of what accounts for ldquonormalrdquo operating parameters against which improvements and new water losses can be assessed
bull Use data that meters provide to determine the appropriate frequency for aggregating and reporting water measures (eg hourly daily or weekly) that best meets your facil-ityrsquos needs
bull Show employees how to read and use water meters as part of Lean activities such as gemba walks value stream mapping and kaizen events so that they can identify water savings opportunities
bull Post water use reduction goals and water usage information on the factory floor on Lean production control boards or in other accessible places to raise awareness of water use and efficiency among employees
bull Track data from water meters over time Portfolio Manager an online building per-formance benchmarking tool available from the ENERGY STAR program can help you track and benchmark water consumption data For more information on the Portfolio Manager see Appendix A
20
Chapter 2 Water Use and Water Waste at Industrial Facilities
Costs of Water Waste As noted in chapter 1 costs associated with water use include more than the direct costs you pay for water supply but also the costs of water as it travels through processes and operations (see Figure 7) Box 7 provides examples of water costs such as energy pollution control regulatory compliance and raw material costs
Figure 7 Costs Associated with Water Use
Costs Associated with Water Use
Price of Incoming Water
Sewer Service Charge
Labor and other costs associated with water processing and treatment
Cost of energy and chemicals needed to process water
The ldquoprice on the water billrdquo
The cost of water use at a facility can be much greater than the amount on the water bill
Estimating the many components of total water cost for a facility can begin with the cost of water purchased from utilities but should also include the cost of steps required to process use and discharge the water These costs can amount to a good deal more than what appears on a utility bill When estimating water costs it is important to consider these and other indirect costs throughout all functions of a facility Be sure to use estimated future rates when assessing water costs in order to project the level of savings that will be possible when improvements are made
21
Chapter 2 Water Use and Water Waste at Industrial Facilities
Common Costs Associated with Water Use (Box 7)
Raw Material Costs
3 Water purchased from utilities marginal costs of purchasing additional wa-ter versus costs of conservation
3 Cost of water treatment filtering and softening before use
3 Costs for chemicals needed to treat and manage water
Energy Costs
3 Cost of energy to heat water
3 Cost of energy to pump water from its source or within the facility itself
3 Energy and labor costs for operating and maintaining water-using equip-ment
Pollution Control Costs
3 Wastewater and stormwater service rates including surcharges
3 Total cost of treating wastewater for disposal including labor energy chemi-cals equipment and residual disposal
3 Marginal costs of increasing effluent treatment capacity when water de-mand increases
Regulatory Compliance Costs
3Labor costs for regulatory compliance activities such as completing permit applications monitoring compliance and reporting wastewater discharges to regulatory agencies
Source Adapted from North Carolina Department of Environment and Natural Resources Water Efficiency Manual for Commercial Industrial and Institutional Facilities May 2009 available at wwwp2paysorgref0100692pdf
Full costs associated with water use often vastly outweigh the direct costs The direct cost of pur-chasing water from a utility may not seem significant enough alone to merit the effort to reduce water use but when the full cost of water is assessed the financial savings can be substantial Table 3 shows an example of the various costs of water in an industrial process In this example the esti-mated savings from implementing improvements using direct water and sewer costs alone is only 56 percent of the estimated savings using the full cost of water The flexible cost savings of conserved water is estimated to be 40 percent of total treatment cost Flexible treatment costs refer to expenses that vary according to the volume of water treated (eg energy used to pump and treat water treat-ment chemicals) fixed costs (eg capital equipment used for treatment) do not typically vary as wastewater throughput changes
Chapter 2 Water Use and Water Waste at Industrial Facilities
Table 3 Costs Associated with Water Used in an Industrial Process
Activity Unit Cost ($1000 Gallons)
City Water Purchase $355
Sewer Rate $399
Deionized using reverse osmosis
Equipment $057
Energy $120
Labor $143
Total deionized water $231
Deionized water (flexible cost) 40 x $231 = $092
Wastewater treatment
Sludge disposal $346
Treatment chemicals $244
Energy $032
Labor $625
Total wastewater treatment $1247
Wastewater treatment (flexible cost) 40 x $1247gallon = $498
Total cost of water $1344
Flexible cost savings of conserved water is estimated to be 40 percent of total treatment cost
Source Adapted from North Carolina Department of Environment and Natural Resources Water Efficiency Manual for CommercialIndustrial and Institutional Facilities May 2009 available at wwwp2paysorgref0100692pdf
22
23
Chapter 2 Water Use and Water Waste at Industrial Facilities
Appendix B contains a Water Cost Calculator that provides a template for calculating common costs associated with water use at industrial facilities It may also be useful to estimate the potential water and dollar savings that would result from implementing water efficiency measures at your facility see Appendix C for some equations that you can use to guide these estimates
In some water-stressed areas industrial facilities may face the possibility of an even greater water-related costmdashthat of lost revenue from the need to curtail production in the event of water supply disruptions Competition for water across residential agricultural industrial and environmental needs during periods of water scarcity may lead local water managers to impose limits on industrial water use Understanding the vulnerability to disruption of local water supplies can be an important consideration when assessing the true costs of water use when expanding or developing new facili-ties
The next chapter discusses strategies for understanding how water is used at your facility and iden-tifying opportunities to reduce water use and improve operations
To Consider
3 What are the primary water end uses at your facility
3 What processes and facility operations use the most water
3 What costs are associated with your facilityrsquos water use What indirect costs may be unaccounted for
Lean and Water Toolkit
25
CHAPTER 3
Finding Water Waste on the Factory Floor
Some of the most substantial reductions in water use can be found right on the factory floor This chapter describes several simple techniques to foster an understanding of where water goes in a facility and where it can be saved including the following
bull Water Gemba Walks bull Developing a Water Balance bull Water Waste and Value Stream Mapping bull Root Cause Analysis
While all of these techniques evaluate aspects of facility water use and can support your Lean efforts each has a different level of detail time and staff investment requiredmdashranging from a facility walk to a multi-day value stream mapping event Consider the level of effort desired before getting started to conduct the most effective analysis for your facilityrsquos needs
Water Gemba Walks A useful way to identify ways to reduce water consumption is a ldquogemba walkrdquo A water gemba walk is an exercise in which employees and managers walk the factory floor together to observe and inventory inefficiencies related to water use Gemba is a Japanese term meaning ldquothe real placerdquo in the context of Lean manufacturing gemba typically refers to the place where work happens (eg factory floor) Water gemba walks enable a team to quickly locate ldquolow-hanging fruitrdquo that save water at a small cost They help facilities to
bull Identify major sources of water loss such as leaks that can be repaired for significant savings
bull Acquire a more complete understanding of the major end uses of water and flows of water in the facility than can be achieved solely by analyzing water utility bills
bull Instill floor managers and workers with the importance of looking for and noticing leaks and inefficiencies helping to create a culture of water efficiency
Before you conduct your gemba walk first determine the purpose and scope of the walk How large an area will the walk cover and how long will it take How long will the team look at certain aspects of plant operations What information or data would equip the team to best see wastes and opportunities Second obtain copies of relevant documents and data including the last year of water utility bills or water consumption logs the floor plan of the facility if available and process diagrams for focus areas Third select the members of the gemba walk team A small team is best with approximately five to seven people constituting an ideal team size Include workers and man-agers familiar with the area outsiders new employees and veterans as well as an EHS representa-
26
Chapter 3 Finding Water Waste on the Factory Floor
tive in order to get a diversity of perspectives A brief training can orient your team to the purpose of a gemba walk and help them feel empowered to spot wastes throughout the walk
Once you have your team assembled use the Steps to Take During a Gemba Walk in Box 8 to find water waste and improvement opportunities at your facility
Steps to Take During a Gemba Walk (Box 8)
1 Identify all water-consuming equipment high-use areas and meterlocations
2Note all water losses evaporative losses and water incorporated in product excessive water pressure and leaks
3Observe shift clean-ups and process changeovers
4Quantify water flow rates and usage
5Note the water quality used in each process step
6Determine water quality needs for each process and quality of wastewater discharged
When employees are engaged and interested in finding wastes and identifying ways to improve water efficiency the benefits of your gemba walk can continue well beyond the exercise itself The training that your employees receive to conduct a gemba walk or other Lean exercises combined with immediate engagement in the exercises themselves can help to create a culture in which em-ployees routinely seek out ways to improve water efficiency
Consider conducting your gemba walk during a time when the facility is shut down as this can be a good time to find unexpected losses You can also collect data during your gemba walk on the nature of the water in use at various steps throughout each process knowing when treated water is necessary and when lower-quality water might be okay will help you identify reuse opportuni-ties later Table 4 Key Areas to Check During a Water Gemba Walk lists several common areas in industrial facilities in which water inefficiencies can be observed during a gemba walk
Chapter 3 Finding Water Waste on the Factory Floor
Table 4 Key Areas to Check During a Water Gemba Walk
Process and Equipment Use bull Cleaning Washing Rinsing bull Metal Finishing bull Painting bull Dyeing and Finishing bull Photo Processing bull Process Water Reuse bull Product Fluming (Water Transport) bull Pretreatmentfiltration systems bull Pump and Conveyor Lubrication bull Water Use in Products
Other Facility Support
bull Floor Washing bull Air Emission Wet Scrubbers bull Building Washing bull QAQC Testing bull Laboratories bull Landscaping and Irrigation bull Dust and Particulate Emission
Control bull Decorative Fountains and Ponds bull Vehicle Washing bull Cooling Water for Air Compres-
sors and Vacuum Pumps bull Hazardous Waste Storage and
Effluent
Cooling and Heating bull Single-Pass Cooling bull Cooling Towers bull Boilers Hot Water Steam Systems bull Air Washers bull Boiler Scrubbers
Sanitary and Domestic Kitchens bull Toilets bull Food Preparation and Cleaning bull Faucets bull Dishwashers bull Urinals bull Ice Machines bull Showers bull Faucets bull Wash-up Basins bull Food Disposals
Source Adapted from North Carolina Department of Environment and Natural Resources Water Efficiency Manual for Commercial Industrial and Institutional Facilities May 2009 available at wwwp2paysorgref0100692pdf
Leak detection during a gemba walk can be one of the best low-cost high-yield steps for reduc-ing water waste in a facility Leaks exist in all facilities and can result in water loss ranging from a fraction of a percent of a facilityrsquos total water use all the way up to a substantial portion Low water pressure dirty water and a high quantity of water that cannot be accounted for are all signs of a leak Bluing tablets or dyes can be used to easily check for leaks in tanks toilets or other water holding vessels Sonic or acoustic leak detection equipment can be used to check for leaks in under-ground pipes A simple drip gauge can help you conduct a basic estimate of how much water is lost due to a leak Many leaks can be repaired with simple measures such as tightening or replacing fit-tings15 In some cases it may be best to enlist the services of a professional leak-detection company to identify more complex leaks
15 North Carolina Department of Environment and Natural Resources Water Efficiency Manual for Commercial Industrial and Institutional Facilities May 2009 available at wwwp2paysorgref0100692pdf
27
28
Chapter 3 Finding Water Waste on the Factory Floor
Box 9 lists some examples of successful gemba walk and leak detection efforts
Examples of Water Gemba Walk Success (Box 9)
3Kirtland Air Force Base performed leak-detection gemba walks in which teams walked water lines with acoustic listening devices to find leaks sur-veying 90 percent of water distribution lines on the base The teams found that 31 leaks were dripping away nearly 16 percent of the basersquos water at a rate of 333 gallons lost per minute Repairs after the survey saved over 179 million gallons per year
3In one DTE Energy plant water pressure on the upper floors of the building was problematically low Observations on the factory floor revealed that an open valve on a new water treatment system was responsible for the low water pressure By installing a $3000 variable valve the company saved half a million dollars that it would have spent on a booster pump
3Del Monte Foods used a water gemba walk to identify potential water sav-ings in a recirculation line that was forked from eight inches to two four-inch pipes By combining the freshwater line with the main line the facility was able to save 300000 gallons per day
Sources US Department of Energy Federal Energy Management Program ldquoDistribution System Audits Leak Detec-tion and Repair Kirtland Air Force Base ndash Leak Detection and Repair Programrdquo 2009 information provided by Jason Schulist and Michael Sklar DTE Energy May 2011 and Scott Butler Del Monte Foods ldquoThe Del Monte Production System Lean to Green Integrative Futurerdquo Presentation at Green Six Sigma Summit Presentation May 2009
Developing a Water Balance While a gemba walk will help you identify potential water-savings opportunities developing a water balance will give you a more thorough picture of overall water use at your facility A water balance is a high-level simple assessment of the input and output of water in your facility that can help to identify opportunities for improving water efficiency A water balance might be appropriate for your facility especially if you are just beginning your journey with Lean and water and have not con-ducted a more detailed water audit
A water balance is a chart table or diagram of a facilityrsquos water use that shows the flows of water into and out of each process or operation in the facility It typically includes every water-consuming component on-site and all flows out of the facility A water balance can also include data on the cost of water Figure 8 illustrates the fundamental approach to developing a water balance Water bal-ances can also be developed as part of value stream maps
29
Chapter 3 Finding Water Waste on the Factory Floor
Figure 8 Typical Water Balance Calculation
Input (A)
Process Unit
A B C
Output (C)
A ndash (B+C) = Balance (or discrepancy)
Input is ProcessFacility Water Supply Water Losses (eg to air land and product) Output is Wastewater Discharge
Water Losses (B)
When creating a water balance make note of all water use in the facility and track water flows from the source through all operations at the facility to water losses and outputs including evaporative losses input to products and wastewater discharge All uses of water in a facility should be included in a water balance Common end uses of water are discussed in chapter 2 and include processing and auxiliary processing heating and cooling indoor domestic use and landscape irrigation The water balance should capture all of the flows into and out of each process at the facility and should verify that there is a balance between flows in and flows out Compare the estimated or measured total of end uses with the incoming metered amount Be sure to account for losses such as evaporation as well as wastewater discharge The Simplified Elements of a Water Balance figure (Figure 9) below shows an example of the components of a simple water balance for a facility while Table 5 Example Water Balance Summary presents overview information on water use by process from a water balance
30
Chapter 3 Finding Water Waste on the Factory Floor
Figure 9 Simplified Elements of a Water Balance
Pretreatment 950 gallons
Landscaping
Processing
Cooling Towers
Boilers 50 gallons
50 gallons
Losses
Wastewater
Losses
Wastewater
Water in Products
Stormwater
The process of putting together a water balance helps to capture a baseline of a facilityrsquos current water usage (see Box 10) A water balance will help you identify sources of risk such as leaks and compliance concerns Some companies choose to conduct water balances at varying levels of detail on a regular basis in an effort to locate ways to reduce water use and discover hidden water-savings dividends
Chapter 3 Finding Water Waste on the Factory Floor
Table 5 Example Water Balance Summary
Water Uses Input (GallonsYear)
Output (GallonsYear)
Loss (as a of Water Use)
Cooling tower make-up and boiler make-up
8484000 8248000 236000 (28)
Process use 6298000 6186000 112000 (18)
Cooling air compres-sors and pumps
7654000 7455000 199000 (26)
Landscaping 1675000 1533000 142000 (85)
General washing sanitation and maintenance
1101000 1095000 6000 (05)
Food preparation dishwasher
624000 613000 11000 (18)
Subtotal 26660000 25130000 1530000 (57)
Total Water Loss 1530000 GallonsYear
A spreadsheet developed by GEMI to help you create a water balance for your facility is available at wwwgemiorgwaterplannercalc-waterbalanceasp
Benefits of compiling a water balance include
bull Ability to identify processes that present the best targets for reducing water use
bull Establishment of baseline water use data from which improvements in efficiency can be benchmarked
bull Creation of a tool with which to compare different water-efficiency improvement strategies
31
32
Chapter 3 Finding Water Waste on the Factory Floor
Information to Collect for a Water Balance (Box 10)
To complete a water balance collect data on the volume of water flows for each process or operation in your facility including
3 Water and sewer bills from the previous one to three years
3 Numbers sizes and locations of water meters
3 Sources of incoming water
3 Diagrams of plumbing and water pipes as well as irrigation schematics
3 List of water-consuming processes
3 Information about unsewered wastewater (wastewater not discharged to municipal sewer systems such as through separate permitted discharges)
An outside expert could be the best option to help conduct a water balance for some facilities Contact your local water utility to ask whether it provides assistance for developing water balances some utilities provide this service (or related services) free of charge In many cases a water bal-ance can make it easy to identify steps to take to improve water efficiency If there is a discrepancy between the input and output of water in your facility that becomes apparent after preparing your water balance you might use that baseline to create a target future state that reduces the discrepan-cy by a set percentage Several of the resources in Appendix A provide information about developing water balances more involved assessments such as water footprints (see Box 11) and audits and benchmarking and tracking tools such as ENERGY STARrsquos Portfolio Manager
More Detailed Water Audits Water Assessments and Water Footprints
In the event that a more detailed assessment of water use and risks is desired an organization could consider conducting a water audit water source vulnerability assessment andor water footprint analysis While the results of these methods can inform the use of Lean to improve facility water efficiency they are typically conducted as stand-alone efforts that can require substantial effort and investment These methods are only described briefly below in this toolkit
bull A water audit typically involves a more comprehensive time-intensive facility-wide effort to as-sess a facilityrsquos water use and efficiency improvement opportunities A water audit may include activities described in this toolkit such as metering and baselining but it typically focuses on the full facility in a discrete brief period (eg during a 1ndash2 week effort) You may choose to follow specific standards when conducting the audits such as those of the American Society of Heating Refrigerating Cooling and Air-Conditioning Engineers
bull A water source vulnerability assessment generally looks outside of the facility at factors that have potential to affect the supply and cost of water that the facility and surrounding commu-nity relies upon This assessment can help a facility determine the risks of water supply disrup-tions or costs fluctuations and identify steps that may help to reduce these risks
33
Chapter 3 Finding Water Waste on the Factory Floor
bull Water footprinting analysis refers to the total volume of fresh water that is used directly and indirectly to run and support the business encompassing both water use within an industrial facility and throughout its supply chain You might consider conducting a water footprint to gain a more complete understanding of the places where water is used inefficiently throughout your supply chainmdashupstream among suppliers and downstream by users of the facilityrsquos output or products While a water footprint can be time-consuming and difficult to prepare it can be helpful in identifying improvement opportunities throughout the supply chain Box 11 provides tips for conducting water footprint analyses while chapter 5 discusses strategies for engaging suppliers to reduce water use and risks
Water Footprinting Tips (Box 11)
What information should water footprint analyses contain
3Track surface and groundwater sources rainwater stored in the soil and polluted water as inputs and outputs from a facility This can help address concerns about water scarcity and use
3 Include the geographical location of water withdrawals and discharges as well as direct and indirect water use
3 Work with suppliers to get data on water inputs and outputs from their operations often this is where the most water is used
3 Consider also estimating your productsrsquo end-use footprint which is any water used by consumers when they use the product
3 Note the scarcity and drought vulnerability of your suppliersmdasha water foot-print can be a valuable tool to identify business risks
3 Present the water footprint information in a clear and compelling manner such as a diagram showing water flows and quantities
For additional guidance on water footprinting see the Water Footprint Network website wwwwaterfootprintorg
Water Waste and Value Stream Mapping Like water balances value stream mapping can be a powerful tool for identifying water waste and savings opportunities Value stream mapping is a Lean method for creating a visual representation of the flows of information and materials across all the activities involved in producing a product for a customer In a value stream mapping event two maps are developed a map of the current state showing key data about existing processes and a future state map showing changes that can be made to reduce waste Value stream maps can be developed at the value-stream level (eg for a product family) or at the process level after your team has selected a process to investigate more closely
34
Chapter 3 Finding Water Waste on the Factory Floor
By adding water data to value stream maps value stream mapping can help you
bull Gain a better understanding of where the greatest water waste occurs
bull Identify areas where improvements can be made to reduce excess water use and other wastes
bull Develop an implementation plan for process improvements to reduce wastes in the value stream prioritizing water efficiency projects alongside other Lean and environ-mental projects
bull Quantify the expected savings from implementing those improvements
bull Create a culture of efficiency as team members from supervisors to floor workers be-come engaged in cutting waste
Adding Water Waste to Value Stream Maps Value stream maps depict all the activities in a value stream or a process along with key metrics that primarily relate to time Incorporating water considerations into a value stream mapping exer-cise is as simple as adding the amount of water used at each step onto the value stream map Figure 10 Adding Water Use to Value Stream Map Process Box shows a process data box with data on the water use by a particular process included Costs associated with the water used by each process or process step could also be added however to be fully representative these costs should include indirect costs such as those for support functions
Figure 10 Adding Water Use to Value Stream Map Process Box
CT = 4 min CO = 45 min Uptime = 61 Water Use = 9K gallonsday
2 people
Plating
Water use per day
35
Chapter 3 Finding Water Waste on the Factory Floor
Figure 11 Value Stream Map Incorporating Water Use Metrics shows an example of a current state value stream map that has been modified (with additions in blue) to include data on the amount of water used at each step Most activities that consume water are tracked in the map however note that this map does not include water loss as a result of leaks and evaporation or other losses that can occur between process steps
Figure 11 Value Stream Map Incorporating Water Use Metrics
Mar
ket F
orec
ast
Tota
l Lea
d Ti
me
= 68
day
sVa
lue
Adde
d Ti
me
= 15
min
Tota
l Wat
er U
se =
59K
gal
Cus
tom
erA
2 pe
ople
CT
= 4
min
CO
= 4
5 m
inU
ptim
e =
61
Wat
er U
se =
30K
gal
Dry
ing
2 pe
ople
Cle
anin
g
CT
= 2
min
CO
= 6
0 m
inU
ptim
e =
74
Wat
er U
se =
10K
gal
3 pe
ople
CT
= 7
min
CO
= 5
0 m
inU
ptim
e =
48
Wat
er U
se =
15K
gal
Rin
sing
I I
I 3
peop
le
Ship
ping
7 m
in4
min
2 m
in
15 d
ays
8 da
ys10
day
s 30
day
s
Prod
uctio
nC
ontr
ol
WK I
5 da
ys
D
I D
30 d
ays
WK
Rec
eivi
ng
CT
= 2
min
CO
= 3
0 m
inU
ptim
e =
93
Plat
ing
5 da
ys
2 m
in
Cus
tom
erB
Su
pplie
r1
Supp
lier
2
Lead
Tim
e
36
Chapter 3 Finding Water Waste on the Factory Floor
Many teams develop value stream maps using sticky notes to represent each step in a process This enables team members to move things around easily and helps them create the most accurate pic-ture of the process possible
To create a visual representation of the areas in the value stream map that use the most water try using different colors of sticky notes for high- and low-water using steps See Figure 12 for an example of the use of sticky notes to create a value stream map with water data added to several of the notes
Figure 12 Process Boxes Showing Water Waste
Another way to show water inputs and outputs associated with your facilityrsquos processes is by drawing lines into and out of each process data box on your value stream map In Figure 13 the red circles show where water and wastewater flows have been identified other waste streams are identified as well See EPArsquos Lean and Chemicals Toolkit for more information on this approach16
16 Value stream mapping is described in chapter 3 of the Lean and Chemicals Toolkit available at httpwwwepagovleanenvironmenttoolkitschemicalsch3htm
37
Chapter 3 Finding Water Waste on the Factory Floor
Figure 13 Water Inputs and Outputs Identified on a Value Stream Map
After creating a current state map your value stream mapping team will create a future state map that envisions ways to eliminate waste in the value stream and identifies areas for future process improvement projects such as kaizen events or just-do-its (described in the next chapter) With water data included on the current state value stream map your team will be able to easily identify opportunities for increased water efficiency and can work together to identify prioritize and develop an implementation plan for improvement projects that can meet both Lean and environmental goals Incorporating water waste into value stream mapping allows water efficiency projects to be combined with and considered together with other operational improvements
The implementation plan is a key product from the value stream mapping event Take care to de-velop an implementation plan that details the steps to carry out the improvements you have identi-fied being sure to assign responsibility for each step of the plan Consult with facility EHS staff and permitting authorities before making any changes that could affect facility emissions or wastewater discharges
For more information on adding environmental metrics to value stream maps see chapter 3 of EPArsquos Lean and Environment Toolkit17
17 Available on the EPA Lean Manufacturing and the Environment website at wwwepagovleanenvironment
38
Chapter 3 Finding Water Waste on the Factory Floor
Root Cause Analysis When you find a water waste in your facility whether during a gemba walk or a value stream map-ping exercise itrsquos important to ask ldquoWhy did this happenrdquo There is a set of Lean tools that can help you answer this question Root cause analysis is the process of identifying a problem and working through possible components to identify the most basic reason why the problem is occurring Once the cause of the problem is identified you can prevent its recurrence Two tools of root cause analy-sis include fishbone diagrams and the ldquo5 whysrdquo approach
Explore water waste yoursquove found in a Fishbone Diagram (also known as an Ishikawa Diagram) which shows potential causes of a problem by grouping causes into major categories to identify the source of inefficiencies To investigate water waste using a fishbone diagram first identify the specific problem you wish to investigate perhaps a spike in water use at the facility or a leaky pipe or valve Write the primary problem you wish to investigate in the head of the diagram usually on the right side The ldquobonesrdquo of the diagram represent groupings of potential causes of the problem common categories include the following
bull Measurements
bull Material
bull Man (or Personnel)
bull Methods
bull Machines
bull Environment
Along each grouping many detailed sub-causes are listed Figure 14 on the next page Fishbone Diagram of Excessive Water Use shows an example of a fishbone diagram that one facility used to assess its water use
Another root cause analysis tool is the ldquo5 whysrdquo technique The approach uses a systematic ques-tionnaire technique to search for root causes of a problem Simply ask ldquoWhyrdquo when considering the primary problem ldquoWhy is excessive water used hererdquo Follow up with additional ldquoWhyrdquo inquiries until you drill down to the root cause of the problem The goal of the exercise is to pursue further until the root of the problem is identified Be aware that there is sometimes more than one cause of a problem
39
Chapter 3 Finding Water Waste on the Factory Floor
Asking Why Five Times (Box 12)
1 Why are we using so much water The parts need to be cleaned before painting
2 Why do the parts need to be cleaned The parts fail quality checks if they arenrsquot cleaned before being painted
3 Why do painted parts fail quality checks The paint doesnrsquot adhere when part surfaces are not prepared properly
4 Why do the surfaces of the part need to be prepared The surfaces get contaminated by oils used in the previous process
5 Why are oils used in the previous process The oils are used to prevent corrosion during storage
Based on an example from Robert B Pojasek ldquoAsking lsquoWhyrsquo Five Timesrdquo Environmental Quality Management (Autumn 2000) 83
Figure 14 Fishbone Diagram of Excessive Water Use
Measurements Material Personnel
Environment Methods Machines
Excessive Water Use
No metrics
Budget baseline
Untreated water
Galvanized piping
Operator understanding
Obsolete article
Operator training
RCM
Notification procedures
Ineffective ventilation
No ventilation
No headers
Plugged pipesdisks
Eroded orifice disks
Failed controllers
Failed valves
Failed probes
Source Schulist Jason Lean Towards Sustainability How to Use Lean and Six Sigma Methods to Drive Your Sustainability Journey DTE Energy 2009
40
Chapter 3 Finding Water Waste on the Factory Floor
Completing a root cause analysis exercise should be a precursor to brainstorming potential solu-tions to water waste problems at your facility By using these tools you can ensure that you address the root cause of the problem first instead of merely treating the symptoms Chapter 4 explains how to take the knowledge about your facilityrsquos water use that you have gained through the tools listed in this chapter and apply that knowledge to reduce water use
To Consider
3 Where are the largest sources of water waste in your facility If you donrsquot know what steps will you take to find out
3 Are there processes or areas at your facility that could use non-potable or lower quality recycled water
3 What resources might be available in your area to help you conduct a water balance or water audit
3 Where in your facility might be a good target for a water-focused value stream mapping activity
41
CHAPTER 4
Lean and Water Efficiency Improvement Strategies
After yoursquove taken the important first steps to understand how your facility uses water there are a number of ways to reduce your water use through Lean and water efficiency efforts This chapter describes the following
bull Kaizen Events and Just-Do-Its to Reduce Water Use bull Integrate Water Efficiency into Everyday Lean Practices bull Lean and Water Applications for Facility Operations and Support Processes
Kaizen Events and Just-Do-Its to Reduce Water Use There are three key questions to ask to identify water-efficiency opportunities
Key Water-Efficiency Questions (Box 13)
3 Can we stop or prevent water losses (eg leaks)
3 Can we reduce water use (eg changing equipment plumbing processes andor behaviors)
3 Can we recycle or reuse water for another purpose (eg recirculating water within a process reusing process water for another application capturing rainwater etc)
Leanrsquos implementation-based methods of kaizen events and just-do-its are powerful strategies for putting water efficiency into practicemdashjust-do-its for easy changes and kaizen events for more in-volved projects A kaizen eventmdashalso known as a rapid process improvement eventmdashis a 2ndash5 day period when a cross-functional team examines a process and makes rapid changes to improve it
Before initiating significant process changes remember to consult with your local utility or environmental agency to make sure that all facility permitting requirements are met EHS staff at your facility can provide guidance on which changes may trigger regulatory or worker health and safety issues
42
Chapter 4 Lean and Water Efficiency Improvement Strategies
Water Kaizen Event Examples (Box 14)
GE conducted week-long water kaizen events at three of its largest water-consuming sites in 2009 including monitoring and assessing water use facility-wide and developing water-reduction projects with associated financial benefits
3 These kaizen efforts combined with flow monitoring and water-conservation efforts at the largest water-consuming site helped GE reduce water use 30 percent from 153 billion gallons in 2006 to 107 billion gallons in 2009
Through an environment health amp safety kaizen event at one site United Technologies Corporation eliminated 40000 gallons of wastewater per year and saved $50000 per year by changing how the facility managed test cells an underground storage tank and its waste streams
3 The facility no longer sends water to the storage tank and waste fluids from the process (eg oils) are collected separately to allow for reuse recycling or reclamation
3 These efforts are expected to further reduce wastes up to a total savings of 75000 gallons and $150000 per year
GE ldquoEcomagination 2009 Annual Reportrdquo pp 16-17 httpgeecomaginationcomreporthtml World Business Council for Sustainable Development (WBCSD) ldquoEco-efficiency Gains Ground United Technologies Corporation (UTC)rdquo WBCSD Case Study August 10005 available from wwwwbcsdorg
Two types of kaizen events to reduce water use include
bull Water Kaizen Events Consider conducting some kaizen events that are specifically designed to find and implement water efficiency opportunities (see Box 14 for examples) Good places to target include processes or areas of facility operations that use significant amounts of water Some companies such as GE use kaizen events to look for water-efficiency opportunities across a single facility Water balances and value stream maps with water data can provide good ideas for where to focus water kaizen implementation activities
bull Kaizen Events on Water-Using Processes Even if the main objective of a kaizen event is not water efficiency itrsquos helpful to keep an eye out for water-efficiency opportunities There may be opportunities to reduce water use such as by adjusting equipment or reusing water while also improving other aspects of the process Use the Key Water-Efficiency Questions in Box 13 above to identify water-savings opportunities
Often when yoursquore looking for water waste perhaps while using strategies described in the last chapter yoursquoll find easy solutions that can be implemented right away These are good things to address with ldquojust-do-itrdquo Lean activities Just-do-its or ldquoquick winsrdquo are actions that individuals can take immediately to improve a process or operation Many actions to stop water losses (such as fixing leaks or shutting off water that shouldnrsquot be running) or simple equipment adjustments to conserve water (such as reducing water flow) fall in this category
43
Chapter 4 Lean and Water Efficiency Improvement Strategies
Water Efficiency Strategies Ways to reduce water use range from simple strategies such as adjusting the flow of water or install-ing water-saving devices on equipment to more involved options such as reusing water or changing to a low-water or waterless process There are five general types of water-saving strategies (see Fig-ure 15) Consider these strategies as you brainstorm improvement ideas in kaizen events and other Lean efforts Key things to keep in mind include
bull Consider water efficiency improvements in the context of other process improvements and Lean performance goals in order to get the best results
bull Evaluate how the process changes might affect wastewater volume or quality or have other environmental impacts (For example switching from a water-based lubricant to an oil-based lubricant or solvent could have implications for worker health andor the environment)
bull Consider which water-efficiency best management practices and technologies make sense for your facility
bull Adopt visual controls ldquomistake proofrdquo devices on equipment (eg automatic shut offs) andor procedures to help ensure that process changes are effective and can be easily maintained
bull After testing potential solutions making changes and evaluating actual performance be sure to develop or update the standard work for the activity so that workers can eas-ily identify the current best way to perform an activity (Standard work is also further discussed below)
Figure 15 Five Water-Savings Strategies
Mor
e D
ifficu
ltBi
gger
Impa
ct 3 Adjust water flow
3 Modify existing equipment or install water-saving devices
3 Change to more water-efficient equipment
3 Reuse or recycle water (treat if needed)
3 Shift to a low-water or waterless process
When evaluating water reuse opportunities itrsquos important to consider both water quality and water quantity Not all processes need the cleanest highest-quality water In many cases you may be able to reuse the ldquowasterdquo water from one process or operation as an input to another process or for another use at your facility (eg air handling condensate reverse osmosis reject water etc) as long as you match the quality of water needed for its intended use You may need to do some testing
Chapter 4 Lean and Water Efficiency Improvement Strategies
and additional treatment of the process water to make sure it is acceptable for the next use When evaluating the feasibility of using process water for irrigation or other outdoor uses check with your local utility or water pollution control agency about restrictions on water reuse applica-tions The water may require testing to ensure it meets pollutant limits
Waterless Cleaning of GatoraderegBottles (Box 15)
PepsiCo switched from cleaning Gatoradereg bottles with water to a new method of cleaning with purified air The new cleaning process works so well that it is being adopted by bottling facilities around the world achieving a 20 percent reduction in water consumption throughout the process and saving billions of gallons of water
You can use the Table for Evaluating Water Reuse Potential below as a simple guide to identify possible ways to reuse water to meet the water quality and quantity needs of processes You may also want to consider using reclaimed municipal water or water from another facility for certain uses For more information on water reuse strategies consult EPArsquos Guidelines for Water Reuse (wwwepagovnrmrlpubs625r04108625r04108pdf)
Table 6 Table for Evaluating Water Reuse Potential
Process Operation
Water Need Water Discharge
Volume Quality Volume Quality
Cooling
Boilers
Restrooms
Kitchen
Landscape
Process A
Process B
Process C
It may be possible for your facilityrsquos water to be reused by another industry or business Look for these potentially symbiotic relationships with other facilities in order to stretch the value of your water even further for the community
44
45
Chapter 4 Lean and Water Efficiency Improvement Strategies
Integrate Water Efficiency into Everyday Lean Practices A variety of Lean toolsmdashincluding standard work visual controls 5S and total productive main-tenance (TPM)mdashhelp workers identify and eliminate waste in their daily activities as described further below Along with other wastes these Lean tools can reinforce and promote strategies to reduce unnecessary water use
Waste Elimination Culture You can integrate water efficiency into the ldquoculture of Leanrdquo at your facility developing the capac-ity of your employees to identify water waste in their normal work practices and find solutions that help meet your facilityrsquos Lean and water goals When your workers are passionate about improving the way your facility uses water the gains you achieve can become self-sustaining into the future
Lean is built around the framework of eliminating waste and striving for perfection or ldquoTrue Northrdquo as discussed in chapter 1 It is most successful when employees are fully engaged in driv-ing out waste and identifying improvement opportunities In the long run developing people to be effective problem solvers is more important than implementing specific tools It is critical therefore to train employees on how to identify water waste and to encourage and motivate them to work towards your organizationrsquos water efficiency goals The use of goals or targets combined with incentives and support resources can be a powerful way to drive change and performance improve-ment Frito-Layrsquos ldquoGallon per Pound Challengerdquo Program described in Box 16 provides an example of a successful water efficiency program anchored by metrics and employee engagement
Figure 16 Sign to Encourage Water Conservation
46
Chapter 4 Lean and Water Efficiency Improvement Strategies
Frito-Lay Engaging Employees in Water Efficiency (Box 16)
Frito-Layrsquos ldquoGallon per Pound Challengerdquo established a water efficiency pro-gram for all manufacturing sites to exceed 95 percent water use efficiency The program creates a culture of conservation through awareness trainingand accountability
3Through mid-year 2007 the sitesrsquo collective water efficiency has improved to over 80 percent which translates to a reduction in water use of over 1 billion gallons per year
3 Achieving the goal of 95 percent minimum efficiency for all sites will result in an additional water savings of approximately 800 million gallons per year
3 Frito-Lay earned a 2007 Water Efficiency Leader Award from EPA for these water-efficiency efforts
The Challenge is anchored by a water efficiency scorecard which is emailed to a wide array of stakeholders monthly
3Water efficiency is calculated by dividing standard water consumption by the actual water consumption reported by the site If a site uses more water than the standard an efficiency score of less than 100 percent will result
3The scorecard includes monetary savings opportunities for sites operating below 100 percent efficiency as well as savings associated with improve-ments
3Periodically a ldquodid you knowrdquo section with best practices is distributed with the scorecard to help raise awareness
Frito-Layrsquos utility wall program involves an event held at each site each day where a cross-functional team of technicians and workers gather to compare actual water consumption over the prior 24-hours to standard consumption and the sitersquos goals
3Utility walls enable teams to identify excessive water use and develop ac-tion plans to find and correct sources of variance
3Teams identify areas where flow measurement and control devices can drive conservation and ensure that viable water-efficiency projects are com-pleted and working optimally
Standard Work Standard work refers to an agreed-upon set of work procedures (sometimes referred to as standard operating procedures) that establish the best and most reliable method of performing a task or operation Standard work helps sustain previous Lean improvements as well as serves as the founda-tion for future continuous improvement (kaizen) efforts Incorporating water-efficient practices into
47
Chapter 4 Lean and Water Efficiency Improvement Strategies
standard work for processes helps to make them common practice
Whenever you change operational practices to reduce water use or install new equipment that requires different operations be sure to update the standard work for those operations Water-efficiency strategies include both behavior changes and technological changes but even technology-based changes may involve a behavior component For example workers need to properly operate and maintain new water-efficient equipment Use standard work to reinforce desired behaviors
Visual Controls Often used as part of standard work visual controls support standardized procedures and display the status of an activity so every employee can see it and take appropriate action Visual controls make it easier to perform actions the correct way and notice when there are problems
Visual controls are essential for supporting behavior-based water Figure 17 Dual Flush efficiency strategies Examples of visual controls to encourage Toilet Visual Control water efficiency include
bull Signs to encourage employees to use less water
bull Placards on water-using equipment showing proper operation (eg could include optimum water flow level)
bull Water meters or sub-meters on high water using processes or equipment (see discussion in chapter 3)
bull Displays of facility water use and water-use reduc-tion goals on production control boards along with other performance metrics (cost quality timesafety environmental etc)
5S Another way to incorporate water efficiency into Lean is through 5S 5S is a systematic five-step pro-cess used to create and maintain a clean orderly work environment Many organizations add a sixth ldquoSrdquo for safety creating 6S (5S + Safety) The six pillars of 6S consist of
bull Safety (Respect workplace and employee) Create a safe place to work by removing workplace hazards
bull Sort (Get rid of it) Separate items that are not needed in the work area
bull Set in order (Organize) Organize the items that remain in the work area
bull Shine (Clean and solve) Clean and inspect equipment and the work area
48
Chapter 4 Lean and Water Efficiency Improvement Strategies
bull Standardize (Make consistent) Standardize cleaning inspection and safety practices
bull Sustain (Keep it up) Maintain a clean orderly and safe work area
Figure 18 Six Pillars of 6S (5S + Safety)
Source Adapted from Productivity Press Development Team 5S for Operators 5 Pillars of the Visual Workplace Productivity Press 1996
49
Chapter 4 Lean and Water Efficiency Improvement Strategies
One key step that is relevant to reducing water use is ldquoShinerdquo since water is often used in cleaning and rinsing Many industrial and manufacturing businesses use large amounts of water to flush lines rinse parts and tanks and clean equipment floors and other areas These cleaning and rins-ing practices often are large sources of wasteful water use and therefore opportunities for water savings Educate employees on how to do the ldquoShinerdquo step using less water considering some of the Water-Efficient Cleaning Strategies in Box 17 below
Since employees work attentively to maintain a clean and neat work environment in 5S it presents a good opportunity to spot water waste In daily 5S shop floor sweeps encourage employees to check for water leaks in pipes hoses plumbing fixtures and equipment as well as turn off water that shouldnrsquot be running Add checking for leaks to 5S checklists and other approaches implemented under ldquoStandardizerdquo and ldquoSustainrdquo steps so it becomes standard practice
Water considerations are also relevant to ldquoSafetyrdquo Preventing water from being on the shop floor and walkways can eliminate slipping hazards Repairing hot water and steam leaks can prevent burns
Water-Efficient Cleaning Strategies (Box 17)
Dry Clean-up First
3Use brooms brushes squeegees andor other tools to remove materi-als and debris in dry form before using water for secondary cleaning (This saves water reduces wastewater and enables recovery of process materi-als)
Eliminate Unnecessary Water Use for Floor Washing
3 Sweep or use a water broom instead of hosing floors
3 Spot mop if necessary
ldquoMistake-Proofrdquo Your Equipment
3 Use hoses that have automatic shut-off nozzles
3 Use efficient spray nozzles high-pressure washers andor flow restrictors to clean efficiently while reducing water use (High-pressure low-volume sprays generally work better than low-pressure high-volume sprays)
Use Efficient Spray Washing and Rinsing Techniques
3 Use water wisely and turn off water when not in use
3 Do not use a hose as a broom doing so wastes time water and energy
3 Optimize spray and rinsing techniques and document the best practices in the standard work for the process
For more suggestions see North Carolina Department of Environment and Natural Resources ldquoWater Efficiency Manual for Commercial Industrial and Institutional Facilitiesrdquo May 2009 wwwp2paysorgref0100692pdf
50
Chapter 4 Lean and Water Efficiency Improvement Strategies
Total Productive Maintenance As a key strategy for finding and preventing water losses as well as other equipment failures Total Productive Maintenance (TPM) is also relevant to water efficiency TPM is a Lean method that focuses on optimizing the effectiveness of manufacturing equipment TPM focuses on team-based maintenance that involves employees at every level and function
A key practice in TPM is to maintain equipment in a manner that enables workers to quickly iden-tify and correct problems that may result in leaks or spills Since many facility operations use water not just production processes itrsquos important to extend the preventative maintenance practices of TPM to non-production areas (eg restrooms and irrigation) when looking for water issues Box 18 outlines Proactive Maintenance Tips to Reduce Water Use that can be incorporated into a TPM program For more tips and suggestions see EPArsquos ldquoWaterSense at Work Best Management Practices for Commercial and Institutional Facilitiesrdquo available at wwwepagovwatersense
Proactive Maintenance Tips to Reduce Water Use (Box 18)
3Adopt a user-friendly system for reporting water leaks and fix leaksimmediately
3Inspect hot and cold water lines steam lines and traps water-using equip-ment and plumbing fixtures routinely to identify potential problems and keep them operating properly
3When performing maintenance on water-using equipment replace worn parts and check to make sure that water-saving features (eg automatic shut-off valves) are operating properly
3Shut off water supply to equipment in areas that are not in use
Lean and Water Applications for Facility Operations and Support Processes As noted earlier the most water-consuming aspects of your facility may not be production pro-cesses other facility water uses include cooling towers (which are often the largest water end use) boilers support processes restrooms kitchens and irrigation Water balances value stream maps and other strategies in chapter 3 describe how to identify the largest sources of water waste at your facility These represent good targets for kaizen events to reduce water use Consider the Questions to Identify Water-Savings Opportunities in Facility Operations and Support Processes in Box 19 to identify initial opportunities
51
Chapter 4 Lean and Water Efficiency Improvement Strategies
Questions to Identify Water-Savings Opportunities in FacilityOperations and Support Processes (Box 19)
Cleaning
3Can process cleaning or facility cleaning be accomplished without using water (ie using pressurized air to clean products or containers sweeping debris off the floor)
Process Equipment
3Can process equipment reuse water (closed loop) or use reclaimed water from other parts of the facility
Cooling and Heating
3 Has your facility replaced once-through cooling systems with a multi-pass cooling tower or closed systems
3 Can you optimize the blow-downbleed-off controls on boilers and cooling towers
3 Have you considered switching to air-cooled equipment instead of water-cooled equipment
3 Does your facility reuse condensate water
Restrooms and Kitchens
3 Do restrooms have water-efficient fixtures (eg WaterSense labeled toilets and urinals faucet aerators and showerheads)
3 Do kitchens use new water- and energy-efficient dishwashers (eg ENERGY STAR qualified models)
Landscaping and Irrigation
3 Has your facility designed its landscape to consider the local climate and grouped plans by similar watering needs
3 Does your facility use drip irrigation low-flow sprinklers and optimized watering schedules to minimize water use
Leaks
3Have you identified and repaired leaks throughout your facility
Appendix D Water Efficiency Opportunity Checklist is a more extensive checklist for identifying water-savings opportunities throughout your facility
52
Chapter 4 Lean and Water Efficiency Improvement Strategies
Along with the questions in Box 19 and Appendix D a wide array of resources are available that provide information on low-cost water-efficiency measures for common components of facility operations as well as resources that provide guidance and examples relevant to specific industries Consider these water-efficiency strategies in your Lean improvement projects Examples of resources with guidance for specific operations andor industries include
bull ldquoWater Efficiency Manual for Commercial Industrial and Institutional Facilitiesrdquo by the North Carolina Department of Environment and Natural Resources httpsavewaterncorgbushomephp
bull ldquoWaterSmart Guidebookrdquo by the East Bay Municipal Utility District of Oakland California wwwebmudcomfor-customersconservation-rebates-and-services commercialwatersmart-guidebook
bull ldquoWaterSense at Work Best Management Practices for Commercial and Institutional Facilitiesrdquo by EPA Office of Water wwwepagovwatersense
bull ldquoFacility Managerrsquos Guide to Water Managementrdquo by the Arizona Municipal Water Users Association amwuaorgpdfsfacility_managers_guidepdf
See Appendix A for details about these and other water efficiency resources
To Consider
3 What just-do-it actions can you identify to reduce water use
3 What processes or operations would you consider for kaizen events fo-cused on water efficiency
3 What water-reuse options might there be at your facility What steps will you take to learn more about those opportunities
3 What ideas do you have for adding water-efficiency practices into everyday Lean practices (eg through Lean training use of metrics incentive pro-grams standard work visual controls 5S TPM on water-using equipment or other means)
3 What other ideas do you have for reducing water use with Lean or other process improvement efforts
53
CHAPTER 5
Lean and Water Beyond the Factory Floor
Looking beyond your facility operationsmdashsuch as your supply chain interactions with your com-munity and how you design productsmdashcan allow you to uncover new ways to reduce water use and risks while adding value and improving business operating conditions and market opportunities This chapter examines
bull Lean and Water Efforts in Your Supply Chain bull Engaging with the Community bull Lean Product Design
Lean and Water Efforts in Your Supply Chain Depending on your industry sector the greatest opportunities for water use reduction may be in your supply chain rather than your facilityrsquos own operations As discussed in chapter 1 compa-nies whose suppliers have water-intensive operations may feel pressures from customers or other stakeholders to reduce water use within their supply chain It is important for your business to understand water use and risks throughout the value chainmdashincluding upstream in supplier opera-tions and downstream in customer activities In particular the water needed to extract and process raw materials may be significant in some sectors while other stages such as product-use are more important for others
Some water impacts in the supply chain can be addressed by engaging your suppliers in your Lean and water efforts The techniques in this toolkit can be applied at both large and small companies Here are some ideas to get started
bull Ask suppliers about their water use and their water efficiency efforts
bull Invite customers andor suppliers to participate in a Lean and water value stream map-ping event water gemba walk or water kaizen event at your facility to learn from your experience and share their perspectives
bull Offer to participate in your customerrsquos andor supplierrsquos Lean events if your business has relevant expertise
bull Share training materials yoursquove developed best practices and success stories of your Lean and water efforts to educate suppliers on these efforts
bull Invite suppliers to participate in training sessions with your employees For example the furniture manufacturer Steelcase invites its suppliers to attend workshops covering Lean and environment topics at its ldquoSteelcase Universityrdquo
54
Chapter 5 Lean and Water Beyond the Factory Floor
bull Start a dialog with your suppliers about Lean and water projects to initiate together
bull Encourage suppliers to develop and share short- and long-term water reduction goals and report progress against the goals
bull Provide incentives recognition andor financial support for suppliers to conduct Lean and environmental improvement efforts andor for suppliers that help you meet your water efficiency goals
bull Consider focusing first on suppliers that are located in water-scarce areas where reduc-ing water consumption can have the greatest positive impact on community relations
For some smaller companies working with your supply chain may be more challenging than is the case for larger companies One option for smaller facilities is to inform your suppliers that they may access resources available through local utilities such as technology rebates or free or subsidized water audits
Dubois Chemical and Steelcase An Innovative LeanWater Supplier Partnership (Box 20)
Furniture manufacturer Steelcase worked with Dubois Chemical on a demon-stration project exploring an alternative pretreatment washing process on one of Steelcasersquos finishing lines
3The team analyzed the total cost of ownership (for energy labor watersew-age and process chemicals) in the current and future state process maps and relied on water recycling and other strategies to save time energy water and chemicals
Due to the projectrsquos success Steelcase has deployed it on seven powder coat-ing lines Results include
3 Saved $1 million per year
3 Eliminated phosphates from pretreatment discharge
3 Met 2007 emergency water-reduction requirements in Atlanta
3 Reduced water use by 80 percent chemical volume used by 20-30 percent and waste discharged by 85-95 percent
3 Saved 45 million gallons of water per year Sources SteelcaseDubois info from Mary Ellen Mika and Keith Lane ldquoJoint Case Study Reducing Your Water Foot-printrdquo presentation at 23 September 2008 Corporate Climate Response Conference Mary Ellen Mika et al ldquoE3 and GSN Learning Evolving and Expandingrdquo presentation at 2011 Manufacturing Innovations Conference
55
Chapter 5 Lean and Water Beyond the Factory Floor
Some companies participate in Lean supply chain initiatives that focus on environmental objectives such as water use reduction For example in the US Green Suppliers Network Program Lean ser-vice providers at Manufacturing Extension Partnership centers partner with environmental special-ists to deliver ldquoLean and Cleanrdquo process assessments for companies in the supply chains of larger organizations on a fee-for-service basis (see Box 21) The assessments use value stream mapping with an added focus on environmental metrics and costs to identify opportunities for improvements in resource use Many of the assessments include support for implementation A similar program called E3 (Economy Energy and Environment) incorporates Lean environmental and energy technical assistance and also involves local utilities as partners19 Companies should encourage their suppliers to consult their local water and energy utilities to find rebates or incentives for efficient technologies and process improvements
Green Suppliers Network Lean and Water Successes (Box 21)
Southwire and Pacific Gas amp Electric (PGampE)
3 Southwire a manufacturer of wire and cable products and a key supplier of PGampE participated in a Green Suppliers Network review in 2008 at its Car-rollton Georgia plant
3 Based on the value stream map-based review and the teamrsquos recommenda-tions the facility implemented a water-looping system that recycled water without affecting product quality
3 These efforts cut facility water use by more than 9 million gallons (over 90 percent) and saved more than $70000 annually
McNeil PPC and Johnson amp Johnson
3 McNeil-PPC Inc which manufactures Listerinereg products for Johnson amp Johnson participated in a Green Suppliers Network review project in 2007 with the support of Johnson amp Johnson
3 With value stream mapping the team found that 450 gallons of Listerinereg and 60 gallons of water were wasted per line change
3The team recommended solutions to minimize changeover wastes These recommendations have significantly reduced the amount of water that the facility would otherwise use
3With changes such as reusing water for boilers using flavors instead of water to clean equipment sequencing flavors from light to dark switching to waterless conveyor belts and using closed-loop cooling the facility has cut wastewater discharge by 25-30 percent
Sources Green Suppliers Network wwwgreensuppliersgovresultssuccesshtml and information provided by Char-lie Souders Johnson amp JohnsonMcNeil Consumer Healthcare June 29 2011
19 For more information on the Green Suppliers Network see wwwgreensuppliersgov and for more information on the E3 initiative see wwwepagovgreensupplierse3html
56
Chapter 5 Lean and Water Beyond the Factory Floor
Another way that companies can influence supplier actions is through policies and programs that encourage water efficiency Examples include
bull Procter amp Gamble (PampG) has adopted a Supplier Environmental Sustainability Score-card which produces annual supplier sustainability performance ratings for suppliers based on environmental data and qualitative assessments the suppliers provide which include data on water use Suppliers receive higher ratings for contributing to PampGrsquos environmental initiatives and PampG recognizes suppliers receiving the highest rating in the process20
bull PepsiCo has a Supplier Sustainability Outreach Program in which suppliers regularly submit metrics to track their progress toward short-term and long-term goals in energy water and waste efficiency The program prepares suppliers to join ENERGY STAR which is required for all US-based suppliers Suppliers gain access to PepsiCo resourc-es training tools and an invitation to the Global Environmental Sustainability Sum-mit Fuel electricity and water savings from the program totaled $12 million as of the third quarter of 2010 Forty co-packers and suppliers across 102 manufacturing sites participate and the program continues to expand in the United States and globally
bull Levi Strauss amp Co is adjusting its policies to allow more water recycling and reuse at contract finishing facilitiesmdashit now allows reclaimed water to be used at finishing facilities through onsite treatment internal recycling or from a nearby treatment facil-ity Uses for reclaimed water include landscaping toilets and heating ventilation and cooling systems
bull Wal-Mart provided over 100000 suppliers with a sustainability survey to collect infor-mation about their environmental performance The survey includes questions on the total water use of facilities that produce products for Wal-Mart as well as guidelines for conducting a water footprint and improving water efficiency at facilities Future phases of Wal-Martrsquos ldquoSustainability Indexrdquo project include the development of a database of information on product lifecycles and a tool to help merchants and customers under-stand the sustainability of products21
Consider the following five strategies to promote Lean and water efficiency efforts with your suppli-ers keeping in mind that some of these might be less feasible or applicable for small facilities
bull Require reporting from suppliers Requests for reporting on water use and effi-ciency efforts sends a message to supply chain businesses that the company cares about water It may also help you understand business risks and opportunities to assist suppli-ers in reducing water use or risk Benchmarking of water metrics (eg water intensity
20 For more information about PampGrsquos sustainability work with suppliers see wwwpgcomen_USsustainabilityenvironmental_sus-tainabilityoperations_supplierssupplier_engagementshtml
21 For more information on Wal-Martrsquos Sustainability Index see httpwalmartstorescomSustainability9292aspx
57
Chapter 5 Lean and Water Beyond the Factory Floor
ratios that relate water use to production levels) may be useful to set goals and perfor-mance targets Companies can encourage suppliers to utilize ENERGY STARrsquos Portfolio Manager or other tools to track environmental performance
bull Examine product specifications Evaluate how procurement requirements affect the amount of water required to produce or transport the product to facilities Some com-panies may be able to reduce the water used in their supply chains by changing their sourcing specifications
bull Provide recognition awards andor incentives Recognizing supply-chain water and environmental initiatives can raise awareness of and encourage water use reduc-tion and best-practice sharing among suppliers Stories of water-saving efforts may also be of interest to customers
bull Consider supplier requirements It may be appropriate to consider water-related performance in the selection of suppliers particularly in water-intensive parts of your supply chain Performance targets or certification requirements (eg ISO 14001) could also be incorporated into procurement requirements or partnership agreements Consider developing sector-specific standards to reduce overall environmental impacts (eg the Business and Institutional Furniture Manufacturersrsquo Association Sustainability Standard)22
bull Provide subsidize or make referrals for technical assistance Companies can provide technical assistance or training on Lean and water approaches to supply chain partners Alternatively encourage participation of supply chain partners in ldquocommuni-ties of practicerdquo to share information on water efficiency and environmental improve-ment opportunities Manufacturing Extension Partnership centers provide support for Lean training and can help you integrate water efficiency considerations into your sup-ply chain Organizations can also make suppliers aware of water efficiency resources and services available from local utilities and other sources
bull Collaborate on joint Lean and water projects Collaborate with your suppliers and or your customers to develop approaches to reduce water use and risks or to capture new market opportunities Consider using the ideas strategies and tools in this toolkit as a starting point for a discussion about Lean and water opportunities to pursue
22 This standard is available at wwwbifmaorgpublicSusFurnStdhtml
58
Chapter 5 Lean and Water Beyond the Factory Floor
Levi Strauss amp Co and the Better Cotton Initiative (Box 22)
Levi Strauss amp Co completed a third-party lifecycle assessment to understand the environmental impact of an iconic product Levirsquosreg 501reg jeans The com-pany discovered that
3 Forty-nine percent of water consumption for Levirsquosreg 501reg jeans occurs in cotton production while another 45 percent occurs after consumers take the products home
3 The remaining water use is divided among fabric production (2 percent) finishing (3 percent) and retail (1 percent)
Recognizing the importance of the cotton production stage Levi Strauss amp Co joined the Better Cotton Initiative (wwwbettercottonorg) in 2008 to change the way it grew cotton
3 The Better Cotton Initiative seeks to make global cotton production better for the people who produce it better for the environment and better for the apparel sectorrsquos future
3 Pilot projects in countries such as Brazil India Mali and Pakistan work to reduce the environmental impacts from cotton production while supporting local economies
3 In Pakistan participating farms cut water use by over 30 percent 117 bil-lion cubic meters of irrigation water in 2010
Source Levi Strauss amp Co ldquoCEO Water Mandate Communication on Progress 2010rdquo wwwlevistrausscomsites
defaultfileslibrarydocument201012lsco-ceo-water-mandate-cop-2010pdf
Engaging with the Community In many cases water stewardship is a key component of a facilityrsquos ability to operate in a communi-ty Depending on where your facility is located your business and the surrounding community may face different types of water resource challengesmdashsuch as water scarcity infrastructure or pollution concerns Especially in water-scarce regions or during droughts people in the community may have an increased interest in what your facility is doing to reduce its impacts on local water resources Indeed community engagement is recognized as a key pillar of water resource management by the United Nations CEO Water Mandate which assists companies in developing and implement-ing sustainable water policies and practices23 Engaging proactively with your community on water conservation can be an effective way to mitigate water-related business risks as well as reduce your organizationrsquos overall water footprint
23 The UN CEO Water Mandate is available at wwwunglobalcompactorgIssuesEnvironmentCEO_Water_Mandate
59
Chapter 5 Lean and Water Beyond the Factory Floor
Two key strategies for effective community engagement include
bull Educate and engage your employees in water-efficiency efforts at your facility and encourage them to adopt similar practices at home (eg check for leaks use efficient appliances and faucets turn off water when not in use etc) Build the capacity of employees to spot water waste and problem solve throughout their daily activities on the job and off
bull Partner with community members and local organizations to conduct projects that improve water use water quality andor water infrastructure resources in the com-munity Consider using Lean methodsmdashsuch as a waste walk kaizen event or even a Lean design eventmdashto rapidly brainstorm and test improvement ideas for projects and include community stakeholders in those efforts
Along with the value of community engagement these strategies can have the benefit of partially or fully ldquooffsettingrdquo impacts the facility may have on local water resources That is a facility can sup-port efforts that replenish the local water supply by at least the amount of water the business uses directly In India PepsiCo has achieved a positive net water balance in this way (see Box 23)
PepsiCorsquos Positive Water Balance Project in India (Box 23)
At its facilities in India PepsiCo achieved a ldquopositive water balancerdquomdashwhere businesses contributed more water to the communities than they consumedmdash in 2009 and 2010
3 Savings of over 3 billion liters of water in 2009 and over 4 billion liters in 2010 have been verified externally by Deloitte LLP
As part of these efforts PepsiCo India has
3 Reduced water usage in manufacturing by 45 percent since 2005
3 Partnered with government agencies and local organizations to increase peoplersquos access to clean water
3 Worked with agricultural universities to promote ldquodirect seedingrdquo of rice paddies which allows seeds to be directly planted into the soil (without the need for a nursery) and avoids the need for flood irrigation (This reduces water use by up to 30 percent)
3 Saved over 5 billion liters of water from 6500 acres of direct-seeded paddy fields
3 In 2010 PepsiCo began working with the Nature Conservancy to explore ways to credibly achieve a positive water impact across its global operations
Source PepsiCo ldquoReplenishing Water Conserving the worldrsquos most precious asset Waterrdquo httppepsicoindiacoin
purposeenvironmental-sustainabilityreplenishing-waterhtml accessed 28 July 2011
60
Chapter 5 Lean and Water Beyond the Factory Floor
Businesses can use Lean tools to engage with communities in collaborative problem solving to achieve social economic and environmental goals such as water efficiency For example DTE Energymdasha Detroit Michigan based electric utilitymdashhas used tools including gemba walks value stream maps and ldquocritical-to-sustainabilityrdquo trees (a modification of ldquocritical-to-qualityrdquo trees) with Detroit area businesses and community members to tackle the following projects
bull Partnered with a non-profit to manage combined sewer overflows by planting thou-sands of trees to reduce the stormwater runoff in Detroit
bull Found a new use for the buffer land around substations as community gardens with thousands of pounds of produce harvested at each substation and donated to food pantries
bull Created a community-supported agriculture business model based on a gemba walk with the community that identified issues such as urban blight meaningful work neighborhood connectivity and healthy living
In areas where water scarcity and drought are issues facilities can engage with communities to share knowledge work toward solutions and build goodwill Here are two examples of companies who engaged in collaborative dialogue with their communities in response to problems with water scarcity in areas where their operations were located
bull Coca-Cola partnered with the United Nations Development Programme and Chinese government representatives to improve water efficiency in response to a severe drought threatening sugarcane growers The first phase will be completed in 2011 and will focus on improving infrastructural facilities that support the farmersrsquo work and life directly such as optimizing irrigation facilities and recycling treated wastewater from sugar plants to improve farm production and water use efficiency This first phase will provide approximately 500 million liters of water to rural residents and directly benefit 100000 rural sugarcane farmers in the region In future phases this collaboration will pursue improvements in water efficiency in business operations and will seek to ease pressure on local water supplies through continuing community water partnerships24
bull The chemical manufacturer Sasol identified water scarcity as a risk to its operations in South Africa and pro-actively approached the problem by organizing a joint dialogue with community stakeholders representatives of water-intensive industries in South Africa government and non-governmental institutions and local research institutions The dialogue promoted cooperation among the stakeholders and between Sasol and its surrounding community as the sharing of knowledge and experiences coalesced toward the formulation of several ideas for collective action toward improved water efficiency25
24 For more information about Coca-Colarsquos work with sugarcane growers in China see wwwthecoca-colacompanycomdynamic bullpress_center201103chinas-sustainable-sugarcane-initiativehtml
25 For more information see httpsasolsdrinvestoreportscomsasol_sdr_2008page_id=141
61
Chapter 5 Lean and Water Beyond the Factory Floor
Lean Product Design Lean design methods are a group of Lean tools and techniques that aim to
bull Design (or redesign) high-quality products that meet customer needs with the least amount of waste (aspects that do not add value) andor
bull Design (or redesign) processes and equipment that add value to products using the least amount of time material and capital resources
Taking a close look at the parts and processes that go into the creation of a product can help you to identify wastes including water waste and improve product quality reduce costs and potentially gain market advantage
Lean product design methods often rely on a set of criteria to evaluate the best alternatives Incor-porating efficient water use as a design criterion for product development can reduce water waste throughout the entire life cycle of the product Consider raw materials synthesis production customer use and the ultimate disposal or recyclingremanufacturing of the product when consid-ering water use
As with other aspects of Lean implementation product design is most effective when it incorporates ldquowhole systemsrdquo thinking focused on eliminating all forms of waste Be sure to consider traditional Lean goals for both the product and the manufacturing process such as product quality customer service cost and time when you incorporate water efficiency into the Lean product design pro-cess Improving water efficiency should not mean lowering the quality of your finished product or decreasing the productivity of your facility Note that sometimes design alternatives that improve water efficiency can present trade-offs in which decreasing water use results in increased en-ergy or chemical use such endeavors may not be worthwhile depending on the overall impacts You can help ensure that your product quality remains high by adhering to product quality design standards such as the US Green Building Councilrsquos LEED standards for buildings26 EPArsquos Water-Sense program standards for certain water-consuming products and appliances27 and sector-specific product standards
There are several Lean tools to help design (or redesign) a product in a way that reduces wastes Some of these tools are described in Table 7 below For more information about these tools and an explanation of which tools to use in various product design stages see chapter 6 of The Lean and Chemicals Toolkit28
26 The US Green Building Councilrsquos Leadership in Energy and Environmental Design (LEED) standards are available at wwwusgbc orgDisplayPageaspxCategoryID=19
27 For more information about the US EPA WaterSense Program see wwwepagovWaterSense 28 Available at wwwepagovleanenvironmenttoolkitschemicals
Chapter 5 Lean and Water Beyond the Factory Floor
Table 7 Methods Used in Lean Design29
Method Description
3P (Production Preparation Process or Pre-Production Planning)
An integrated and highly detailed approach to product andor process development which involves rapidly designing production processes and equipment to ensure capability built-in qual-ity productivity and flow 3P minimizes resource needs such as capital tooling space inventory and time
Design for Lean Six A method for designing processes that support Sigma Lean Six Sigma objectives such as reduced vari-
ability to improve yield reduce waste and accel-erate time-to-market
Design for Manufacturing amp Assembly
A simultaneous engineering process designed to optimize the relationship between design func-tion manufacturability and ease of assembly
Failure Mode amp Effects A design review methodology that focuses on Analysis identifying the potential failure modes of a prod-
uct and subsequently determining ways to miti-gate each risk of failure
Quality Function Deployment andldquoVoice of the Customerrdquo
An overall methodology that begins in the design process and attempts to map the customer-defined expectations and definition of quality into the processes and parameters that will fulfill them It integrates customer interview and market research techniques with internal cross-functional evaluations of the requirements
Value Engineering An organized methodology that identifies and selects the lowest lifecycle cost options in de-sign materials and processes that achieves the desired level of performance reliability and cus-tomer satisfaction It seeks to eliminate unneces-sary costs in the above areas and is often a joint effort with cross-functional internal teams and relevant suppliers
29 For additional information about many of these tools see Mascitelli Ronald The Lean Design Guidebook Technology Perspective Northridge CA 2004 See also EPArsquos webpage on 3P wwwepagovleanthinkingthreephtm
62
Chapter 5 Lean and Water Beyond the Factory Floor
Table 8 lists examples of questions to ask when evaluating product design alternatives to identify ways to reduce water waste during all phases of the product life cycle
Table 8 Questions to Ask During Lean Product Design
Life Cycle Phase Questions to Ask
Sourcing Materials 3 Will raw material production prior to manufacture and Inputs involve intensive use of water
3 Can you switch to materials that require less water in their production or work with suppliers to reduce water use
Production 3 Will water be used to manufacture the product Manufacturing Evaluate all new equipment and modifications
3 What steps can be taken to reduce the amount of water that will be used to manufacture the product (eg switch to water-less processes reuse water etc)
3 How can you design products to reuse water in multiple process steps (eg recovering rinses from cleaning counter-current flow or refiltering water)
Product Distribution 3 How much water will the product require during Use and Disposition use
3 What product design alternatives use less water (eg through reuse systems water-efficient fea-tures etc)
3 What steps can you take to ensure that product performance is maintained as you implement water efficiency improvements
3 How will the product design affect customer water use Can reductions in the product use phase be guaranteed
3 How can the design ensure customers will be satis-fied with product performance even with reduced water use
Some companies report that the ldquoseven waysrdquo method provides a useful means to identify a more diverse creative set of improvement options to address specific water-related needs This method is often used in the Lean design process This method typically involves brainstorming of seven alter-native approaches for addressing a specific improvement opportunity Sometimes teams are encour-
63
64
Chapter 5 Lean and Water Beyond the Factory Floor
aged to look at how similar tasks are accomplished in the natural world to spark creative thinking on alternatives The team then scores the seven alternatives using pre-established weighted criteria to select the preferred solution Consider incorporating water efficiency into these criteria (water used to manufacture andor full life-cycle water use) to ensure that product design alternatives are evaluated according to your Lean and water efficiency goals
Examples of Water Conservation through Product Design (Box 24)
GE used the 3P (Production Preparation Process) Lean strategy to launch a new water-saving product line
3Geospringtrade hybrid water heaters dishwashers and top-loading washing machines are being redesigned from scratch using Lean manufacturing techniques
3Production team members from engineers to technicians now work together in a cross-functional approach that involves everyone from design through production using scaled-down equipment and product mockups to visualize improvements
3This hands-on whole-team approach has allowed employees to make ad-justments in real-time allowing problems to be identified early and produc-ing dramatically simpler designs that cut total product development time
Levi Strauss amp Co examined the design of its popular blue jeans to identify ways to reduce the water used to manufacture the product
3 WaterltLesstrade jeans reduce water consumption by an average of 28 per-cent and up to 96 percent for some new products
3These water savings were accomplished by reducing washing cycles incor-porating ozone processing into washing and removing water from stone washing
3While the production of Levirsquosreg blue jeans like many products uses a sig-nificant amount of water in the supply chain as well as through consumer end use the company made significant progress by addressing water use in the manufacturing process
As described earlier in this chapter there is great potential for water savings throughout a productrsquos supply chain including the acquisition of resources and raw materials as well as the water that customers will use with the product or service However if you are just getting started with Lean consider focusing first on water use within your facility before branching into your supply chain and customer-use considerations
65
Chapter 5 Lean and Water Beyond the Factory Floor
To Consider
3What parts of the extended value chain of your enterprise use the most water If you donrsquot know how will you find out
3Have you talked with any of your suppliers about Lean and environmental improvement efforts
3What opportunities are there to offset water impacts and improve water resources for the local community
3What changes could you make to the design of your products to reduce water wastes
Lean and Water Toolkit
67
CHAPTER 6
Conclusion
This chapter includes the following sections bull Your Lean and Water Journey bull Concluding Thoughts
Your Lean and Water Journey We hope that this toolkit has provided you with practical ideas to leverage Lean methods to identify and eliminate water waste at your facility Learning to see water waste and to identify improvement opportunities using Lean tools will help you to save money and be a better partner to your com-munity by placing less of a burden on local water supply There are many tools and techniques to get started with using Lean to reduce water waste As described in more detail in chapter 1 here are three ways to get started with Lean and water efforts
bull Learn more about how your facility uses water Connect with environment and facilities personnel to discuss opportunities to reduce water waste with Lean Find water waste in your facility using tools like metering and water balances
bull Engage employees in lean and water improvement efforts Involve employees in teams to brainstorm ways to reduce water use encouraging their ideas to innovate improvement opportunities Try out some of the strategies for eliminating water waste that are described in this toolkit
bull Connect Lean and water efforts to sustainable water management strategies Use Lean tools to support a broader corporate water sustainability strategy Identify what the ldquoTrue Northrdquo goals and targets are for water use at your facility and track progress to inspire improvement and creative solutions Look beyond direct operations to engage your customers suppliers and communities
Many of the techniques in this toolkit can help you reduce water waste and identify savings rapidly however it is important to think about the bigger picture of how water is used across your organiza-tion Figure 2 repeated below from chapter 1 illustrates how the tools and techniques described in this toolkit can help you to address water use throughout your value chain
68
Chapter 6 Conclusion
Figure 2 Lean and Water Implementation Strategies
Understand Water Uses and Costs (Chapter 2)
Find Water Waste (Chapter 3)
Improve Operations and Processes with Lean and Water Strategies (Chapter 4)
Extend Lean and Water Efforts Throughout the Value Chain (Chapter 5)
Sourcing Materials and Inputs (Chapter5)
Production Manufacturing (Chapters 3 and 4)
Product Distribution Use and Disposition (Chapter 5)
Concluding Thoughts We hope this toolkit spurs creative thinking and energy within your organization and encourages you to explore these opportunities We aim to periodically release new versions of resources in EPArsquos Lean and Environment Toolkit series while working with partner companies and organizations to explore ways to improve efficiency using Lean We also hope to learn from your experiences using this toolkit Our goal is to refine the techniques presented provide examples and case studies to il-lustrate the possible benefits of these tools and present new techniques as they emerge We wish you success on your Lean and water journey
Your Thoughts on the Toolkit
Now that you have finished this toolkit reflect on what you read by answering these questions
3 What strategies and tools in the toolkit seemed particularly interesting Which ones were most applicable to your facility
3 What steps will you take next to advance Lean and water efforts at your facility
3 What other information and tools would help your organization to achieve your Lean and water goals
69
APPENDICES
Appendix A Water Efficiency Resources and Technical Assistance Providers This appendix describes resources and places to go for more information concerning the following topics
bull Water Conservation and Efficiency Resources bull Technical Assistance Providers
This appendix focuses on resources that are directly applicable to manufacturing and industrial facilities however some resources and tools may have broader relevance and contain information that will be useful to commercial institutional and residential water users as well as industrial water users
Water Efficiency and Conservation Resources At the Crest of a Wave A Proactive Approach to Corporate Water Strategy Pacific Institute wwwpacinstorgreportscrest_of_a_wave Making the case that businesses and industrial facilities must prepare for water trends this guide helps users to design and implement a two-stage water conservation strategy Case studies and success stories include those from companies such as Unilever Nestleacute Toyota General Motors Anheuser-Busch GE Proctor amp Gamble and more The steps presented help corporations to create a comprehensive approach to managing water risks and opportunities
Collecting the Drops A Water Sustainability Plannertrade Global Environmental Management Initiative (GEMI) wwwgemiorgwaterplanner This web-based tool and downloadable document provides step-by-step guidance and resources to help facilities conduct assessments of their water use and impacts on the water supply Facilities can then use this information to develop water sustainability strategies create action plans and take actions to improve water resource management in their operations and community The planner includes case examples of how GEMI member companies have engaged internal and external stake-holders and generated actions to improve water resource management and conservation Modules include
bull Module 1 Facility Water Use and Impact Assessment Program bull Module 2 Water Management Risk Assessment Questionnaire bull Module 3 Case Examples and Links
70
Appendix A Water Efficiency Resources and Technical Assistance Providers
Commercial Institutional and Industrial (CII) Water Users Manufacturing Introduction Alliance for Water Efficiency wwwallianceforwaterefficiencyorgManufacturing_Introductionaspx The Alliance for Water Efficiency Resource Library webpages offer information on CII water use and efficiency opportunities as well as links to the research and information about this end user catego-ry In manufacturing major uses and topics include cooling water process water steam generation and boilers sanitation irrigation food services and housekeeping The resource briefly discusses the need for and value of water audits for facilities and applying the strategies of reduce reuse and recycle for facility water consumption
Connecting the Drops Toward Creative Water Strategies A Water Sustainability Tooltrade GEMI wwwgemiorgwater This tool presents the business case for water efficiency and provides guidance and case studies on water assessment opportunity identification planning and implementation Five core analytic modules comprise a roadmap to help facilities identify specific steps that they can take to reduce their water use
bull Module 1 Water Use Impact and Source Assessment bull Module 2 Business Risk Assessment bull Module 3 Business Opportunity Assessment bull Module 4 Strategic Direction and Goal Setting bull Module 5 Strategy Development and Implementation
Cooling Towers Water Use Washington State Department of Ecology wwwecywagovtreeequipCThtml Cooling towers are a significant area of water use for many facilities and taking steps to assess and reduce water use in cooling towers can substantially lower a facilityrsquos overall water footprint The Washington State Department of Ecologyrsquos Technical Resources for Engineering Efficiency (TREE) Team created this succinct checklist of conservation suggestions questions to ask during a water use evaluation and suggested data to collect to identify opportunities for water savings from cooling towers
ENERGY STAR Portfolio Manager US Department of Energy and US Environmental Protection Agency wwwenergystargovindexcfmc=evaluate_performancebus_portfoliomanager This tool allows users to track and access information about their facilityrsquos water consumption inad-dition to data about energy consumption Water and energy use and cost data can be managed across multiple facilities in a secure online interface The tool allows you to track multiple water meters for each facility identify meters with customized names and key information benchmark your facili-ties relative to past performance monitor costs and share data with others inside or outside of your organization By tracking energy and water metrics across facilities users can identify opportunities for efficiency improvements and can receive EPA recognition for superior performance
71
Appendix A Water Efficiency Resources and Technical Assistance Providers
Facility Managerrsquos Guide to Water Management Arizona Municipal Water Users Association httpamwuaorgpdfsfacility_managers_guidepdf This guide is intended to help commercial industrial and institutional facilities to identify areas to improve water use efficiency within reasonable economic parameters The guide provides a step-by-step resource for creating a water management plan and includes worksheets on topics such as water consumption history and estimated water balances Several water end uses and options for reducing them are discussed including domestic water use cooling and heating systems landscape water uses and kitchen uses The guide provides planning and policy-setting options water man-agement options and guidance for empowering employees to effect changes to reduce water use
Federal Water Efficiency Best Management Practices US Department of Energy www1eereenergygovfempprogramwaterefficiency_bmphtml The Federal Energy Management Program developed Federal Water Efficiency Best Management Practices in response to an Executive Order requiring federal agencies to find cost-effective ways to reduce their water use in coordination with EPArsquos WaterSense Program Toward the goal of reduc-ing industrial landscaping and agricultural volumetric water consumption by 20 percent by 2020 (relative to a 2010 baseline) FEMP provides best practices for water management planning infor-mation and education programs water auditing and leak detection and reducing water in several end uses including
bull Boilers and steam systems bull Cooling towers bull Water-efficient irrigation bull Single-pass cooling equipment bull Toilets urinals faucets and showerheads
GEMI Local Water Tooltrade GEMI wwwgemiorgGEMIInteractiveToolsaspx By spring 2012 GEMI plans to release a new tool the GEMI Local Water Tooltrade which will be an interactive downloadable module that will help companies evaluate specific sites for water impacts and risks in order to devise site-specific sustainable water management strategies This tool is de-signed to complement the Global Water Tool (described below) which can help a company identify and prioritize risks to its competitive position based on the link between its operations and the external water landscape Companies can then employ the Local Water Tool to further evaluate the high water-risk locations and plan actions to manage those risks
Global Water Tool World Business Council for Sustainable Development wwwwbcsdorgpagesedocumentedocumentdetailsaspxid=221ampnosearchcontextkey=true In order for a facility to manage current and future risks related to its water use the Global Water Tool helps users map their water use and assess risks related to their global operations comparing water needs to local conditions The tool helps calculate water consumption and efficiency compar-ing water consumption data through time to help assess improvements and monitor progress
72
Appendix A Water Efficiency Resources and Technical Assistance Providers
Making Every Drop Work Increasing Water Efficiency in Californiarsquos Commercial In-dustrial and Institutional (CII) Sector National Resource Defense Council wwwnrdcorgwatercacii This guide provides practical suggestions for commercial industrial and institutional facilities to increase their water efficiency Both small-scale concrete steps to take and suggested higher-level strategic approaches toward water efficiency are described The guide includes a list and descrip-tions of available technologies for reducing water consumption by a variety of common end uses
Performing a Business or Industry Water Use and Conservation Audit New Hampshire Department of Environmental Services wwwdesstatenhusorganizationcommissionerpipfactsheetsdwgbdocumentsdwgb-26-16pdf This factsheet provides a short set of steps to audit water use in a business or industrial facility analyze feasibility of conservation measures and develop a conservation plan
Solutions for Sustainable Water Savings ndash A Guide to Water Efficiency General Electric Water amp Process Technologies wwwgewatercomwater_efficiencyindexjsp This guide provides a practical framework for site managers corporate officers engineering firms and water saving advocates to develop a water efficiency objective and meet this objective by ap-plying a variety of tools and metrics The manual covers baseline water footprinting identifying efficiency opportunities optimizing implementing and measuring
Waste Not Want Not The Potential for Urban Water Conservation in California Pacific Institute wwwpacinstorgreportsurban_usage This report presents a comprehensive assessment of water use and conservation potential in the state of California including industrial water use as well as commercial institutional and resi-dential It includes benchmarking data on water use for many industry sectors a description of the methodology for estimating cost and water savings from water conservation strategies and informa-tion on cost-effectiveness of various water conservation and efficiency improvements
A Water Conservation Guide for Commercial Industrial and Institutional Users New Mexico Office of the State Engineer wwwosestatenmuswater-infoconservationpdf-manualscii-users-guidepdf This guide presents the business case for water efficiency offers programmatic steps conservation strategies for indoor and outdoor use and process-specific and mechanical systems and illustrates potential opportunities with fifteen individual case studies
Water Efficiency Manual for Commercial Industrial and Institutional Facilities North Carolina Department of Environment and Natural Resources httpsavewaterncorgbushomephp This comprehensive manual provides sound principles of water conservation strategies for conduct-ing a successful water efficiency program auditing tools water management options and examples
73
Appendix A Water Efficiency Resources and Technical Assistance Providers
for three industry-specific processes textiles food and beverage and metal finishing Practical tools in the guide include assessment checklists step-by-step instructions for conducting a successful wa-ter efficiency program and explanations of approaches such as water balancing The manual details water management options for several common end uses including
bull Sanitary and Domestic Uses bull Cooling and Heating bull Boilers bull Kitchen and Food Preparation bull Commercial Laundries bull Cleaning Rinsing and In-process Reuse bull Reuse and Reclamation bull Landscaping
Water Efficient Equipment and Design A Guide for Non-Residential Construction and Development Austin Water Utility Water Conservation Division wwwallianceforwaterefficiencyorgWorkArealinkitaspxLinkIdentifier=idampItemID=1018 Equipment and design practices for the construction of new industrial and commercial facilities help to build lifecycle water savings into the design of these buildings Major renovations to exist-ing facilities as well as new construction should be undertaken with a careful assessment of ways to reduce the facilityrsquos lifetime water use This guide provides general guiding principles to ensure that facilities are constructed to maximize water conservation and efficiency as well as specific steps and guidelines to follow in all steps of design and construction
Water Footprint Manual Water Footprint Network wwwwaterfootprintorgpage=fileshome This guide provides a thorough description of the practice of water footprinting including practical steps for estimating a water footprint and instructions for assessing the difference between a direct and indirect water footprint This comprehensive guide to water footprinting instructs readers on estimating the footprint of a product as well as that of a business
WaterSense at Work Best Management Practices for Commercial and Institutional Fa-cilities US Environmental Protection Agency wwwepagovWaterSense The WaterSense Best Management Practices which EPArsquos Office of Water developed in coordination with the Federal Energy Management Program are a comprehensive set of recommendations and tips for how commercial and institutional facilities can improve their water efficiency EPArsquos Water-Sense Program helps water consumers identify best practices resources and tools to reduce their water use Commercial and institutional water users can take advantage of lists of water-efficient products to install in their facilities best management practices and other ways to improve water efficiency
74
Appendix A Water Efficiency Resources and Technical Assistance Providers
WaterSmart Guidebook East Bay Municipal Utility District Oakland California wwwebmudcomfor-customersconservation-rebates-and-servicescommercial watersmart-guidebook This extensive guidebook provides information on water-saving technologies currently available to commercial industrial and institutional businesses as well as specific water efficiency strategies and tips for different business types such as paper manufacturing and metal finishing Many water-using technologies such as process water are explored to show the areas in which the most water is used and where it can be saved
Technical Assistance Providers
Water Utility Incentive Programs Many utilities and local governments offer incentive programs to water utility customers to encour-age the efficiency of water use in the industrial commercial and institutional sectors Common approaches include a combination of water audits and rebates to help facilities realize water sav-ings Check with your local utility to see what incentives may be available Some notable programs include those sponsored by the following utilities and localities all of which saw significant reduc-tions of water use by facilities that they serve
bull City of Austin and Austin Water Utility wwwciaustintxuswaterconservation
bull Denver Water wwwdenverwaterorgConservationIncentivePrograms
bull East Bay Municipal Utilities District wwwebmudcomfor-customersfor-commercial-customerscommercial-conservation-rebates-and-services
bull Massachusetts Water Resources Authority wwwmwrastatemauscomsupportwaterconservationmainhtm
bull Metropolitan Water District of Southern California httpwwwbewaterwisecomicphtml
bull City of Phoenix phoenixgovwaterserviceswrcindexhtml
bull City of San Jose Environmental Services Department wwwsanjosecagovesdwater-conservationdefaultasp
bull Seattle Public Utilities wwwseattlegovutilServicesWaterFor_Commercial_CustomersWATER-CONS_200311261707523asp
75
Appendix A Water Efficiency Resources and Technical Assistance Providers
National Institute of Standards and Technology Hollings Manufacturing Extension Partnership wwwnistgovmep The National Institute of Standards and Technology (NIST) Hollings Manufacturing Extension Part-nership (MEP) is a network of manufacturing assistance centers that provide Lean manufacturing training Lean event facilitation and other services to small-to-medium sized businesses to make them more competitive Many MEP centers have experience providing integrated Lean and environ-mental services to businesses or have partnerships with environmental agencies to offer Lean and environment services
Pollution Prevention Resource Exchange (P2Rx) Consortium wwwp2rxorg The Pollution Prevention Resource Exchange (P2Rxtrade) is a consortium of regional pollution prevention information centers in the United States funded in part through grants from EPA These centers all provide pollution prevention information networking opportunities and technical assis-tance services to state agencies local governments businesses and technical assistance providers in their region Regional centers and contact information can be found on the P2Rxtrade website along with their collective information resources on Lean water efficiency and other topics
Appendix B Water Cost Calculator You can use this table to calculate costs associated with water use at your facility Write down the appropriate volumes units and unit costs and multiply volume by unit cost to find the dol-lars spent on each cost area Add these costs to find the total cost Note Unit costs for water may varydepending on the season andor based on water use (eg peak surcharges may apply above a certain level)30
Factor
Costs to Consider (Excluding Labor amp Maintenance
Costs)
Examples Description Vo
lum
e
Uni
ts(g
allo
ns)
Uni
t Cos
t ($
per
gal
lon)
Tota
l Cos
t (d
olla
rs)
Sup
ply
Base Purchase Price
Utility (eg 10 cents per gallon)
$ $
Peak Package Demand
(eg additional 1 cent per gallon for water supply over 10000 gallons)
$ $
Pumping costs (if self supplied)
Well-sourced $ $
Purchase of pre-treated water
Deionized dealkylized ultra-pure softened
$ $
Coo
ling
Energy Power to chillers towers etc re-ducing heat load of wastewater prior to release
$ $
Chemical For towers chill-ers coolants
$ $
30 Several resource tracking tools that may also be relevant These include Energy amp Materials Flow amp Cost Tracker from the North-east Waste Management Officialsrsquo Association wwwnewmoaorgpreventionemfact Water Conservation Tracking Tool (for water utilities) from Alliance for Water Efficiency wwwallianceforwaterefficiencyorgTracking-Toolaspx and Portfolio Manager (for energy and water use) from the ENERGY STAR Program wwwenergystargov
Total cost of water use should also include labor associated with operations maintenance accounting and legal associated with all items listed
76
Appendix B Water Cost Calculator
Factor
Costs to Consider (Excluding Labor amp Maintenance
Costs)
Examples Description Vo
lum
e
Uni
ts(g
allo
ns)
Uni
t Cos
t ($
per
gal
lon)
Tota
l Cos
t (d
olla
rs)
Trea
tmen
t(O
nsit
e)
Treatment chemicals
Softening de-alkalyzed
$ $
Filters mem-branes carbon
Purified deionized $ $
Sludge disposal Filtration $ $
Filter disposal Solid waste $ $
Was
tew
ater
Trea
tmen
t
Pretreatment chemicals
Neutralizers flocculants etc
$ $
Pretreatment energy
Evaporation Treatment plant operation
$ $
Sampling and testing kits (consumables)
pH TSS BOD COD
$ $
Was
tew
ater
Dis
posa
l
Sewer rate Utility $ $
Surcharges for pollutant exceeding
$
Permitting Permit renewals $
Septic system maintenance
$ $
Condensate or wastewater disposal if not sewered
$ $
Sludge disposal $ $
Total cost of water use should also include labor associated with operations maintenance accounting and legal associated with all items listed
77
Appendix B Water Cost Calculator
Factor
Costs to Consider (Excluding Labor amp Maintenance
Costs)
Examples Description Vo
lum
e
Uni
ts(g
allo
ns)
Uni
t Cos
t ($
per
gal
lon)
Tota
l Cos
t (d
olla
rs)
sses
Evaporative Cost of make-up water
$ $
Leaks Cost of make-up water
$ $
Treatment or Irrigation or $ $
Lo stormwater vehiclebuilding management washing runoff of runoff from exterior use of supplied water
Production $ $
Oth
er
process water use costs other facility costs
TOTAL $ $
Total cost of water use should also include labor associated with operations maintenance accounting and legal associated with all items listed
See Appendix C ldquoWater Unit Conversions and Calculationsrdquo for guidelines on calculating leak losses
78
Appendix C Water Unit Conversions and Calculations This appendix provides reference material on water unit conversions as well as guidance for esti-mating water use and potential water and cost savings
Water Unit Conversions31
Volume Unit Conversions
Units
Equivalent
Liters (lL)
Gallons (gal)
Cubic Feet (ft3)
Cubic Meters (m3)
Acre-Feet (ac-ft)
Liters 1 02642 3531 x 10-2 00001 8106 x 10-7
Gallons 3785 1 01337 3785 x 10-3 3068 x 10-6
Cubic Feet 2832 7481 1 2832 x 10-3 2296 x 10-5
Cubic Meters 1000 2642 3531 1 8106 x 10-4
Acre-Feet 1233 x 106 3259 x 105 4356 x 104 1233 1
Flow RateDischarge Unit Conversions
Units
Equivalent
Gallons per Minute
(gpm)
Liters per Second (Ls)
Acre-Feet per Day
(ac-ftday)
Cubic Feet per Second
(ft3s)
Cubic Meters per Day
(m3day)
Gallons per Minute
1 6309 x 10-2 4419 x 10-3 2228 x 10-3 545
Liters per Second
1585 1 7005 x 10-2
3351 x 10-2 864
Acre-Feet per Day
2263 1428 1 05042 1234
Cubic Feet per Second
4488 2832 1983 1 2447
Cubic Meters per Day
1369 x 109 864 x 107 6051 x 106 3051 x 106 1
31 GEMI ldquoUnit Conversionsrdquo Collecting the Drops A Water Sustainability PlannerTM available at wwwgemiorgwaterplannerunit-conversionhtm
79
80
Appendix C Water Unit Conversions and Calculations
Calculations and ldquoRules of Thumbrdquo for Estimating Water Use32
Use these guidelines and calculations to estimate water use in your facility The information in this section draws primarily from GEMIrsquos Collecting the Drops A Water Sustainability Plannertrade available at wwwgemiorgwaterplanner
Cooling Tower Usage
Cooling Tower Water Usage Calculations
Tower Evaporation Rate
C x ∆T1000
C = tower recirculation rate in the units of pounds of water
per minute
T = temperature difference across the cooling tower in
degrees Fahrenheit
Cooling Tower Blow Down Rate
[Windage Rate x (Cycles of Concentration -1) -
Tower Evaporation Rate] (1- Cycles of Concentration)
Cycles of Concentration = conductivity or chloride level
in the cooling tower blow-downconductivity or chloride
level in the cooling tower makeup water
bull Windage Loss from Cooling Towers (Water Lost from Friction Between Wind and the Surface of the Water in Cooling Towers)
bull Commonly 01 to 03 of the Recirculation Rate
bull The tower recirculation rate can be obtained from the manufacturerrsquos literature andor head versus flow curve for the pump
Cooling Tower Usage
Boiler Water Usage Calculations
Boiler Make Up Boiler Steam Rate - Condensate Return + Boiler Blow Down
Boiler Blow Down Range of 4 to 8 of Boiler Makeup
Sanitary Water Usage
bull 10ndash25 gallons per person per shift in industrial settings (based on estimates in GEMIrsquos Collecting the Drops A Water Sustainability Plannertrade 2007)
bull The lower value is used where there are just toilets A higher value is used where there are toilets showers and full kitchen services (that is food preparation and dish washing)
32 ldquoCalculationsrdquo and ldquoRules of Thumbrdquo from GEMI Collecting the Drops A Water Sustainability PlannerTM available at wwwgemi orgwaterplannercalculationshtm and wwwgemiorgwaterplannerrules-of-thumbhtm
81
Appendix C Water Unit Conversions and Calculations
bull 20-35 gallons per employee per day for domestic demands (not including kitchens) in commercialindustrial settings (based on estimates in the North Carolina Water Effi-ciency Manual 200933)
bull Savings of 25-35 percent in this domestic usage are readily achievable
Irrigation Usage
bull Number of sprinkler heads x the flow capacity per head (eg 25 gpm x the duration [minutes] of water application)
bull Inspect the irrigation system during operation to determine if there are leaks from broken sprinkler heads and from water distribution lines
Wastewater Streams from Water Treatment Operations
bull Reverse Osmosis Reject Flow
bull Reject stream generally ranges from 10 to 50 of the feed to the system depending on the salinity and the desired purity
bull Reject flow can be higher than the indicated range Reverse osmosis reject streams can be used as cooling tower makeup if the water is softened prior to the reverse osmosis system
Other Uses
bull Slab Washing
bull 5 galmin for each hose
bull 1 dripsecond
bull 10000 Lyear or 2642 galyear
bull Water Flow Estimation
bull Use a bucket and stop watch
Water Losses from Leaks
bull Estimate leaks based on the size of the hole and the water pressure (see Leak Water Loss Guide below) or measure directly using a bucket and stop watch
33 North Carolina Department of Environment and Natural Resources Water Efficiency Manual for Commercial Industrial and Institutional Facilities 2009 available at httpsavewaterncorgbushomephp
82
Appendix C Water Unit Conversions and Calculations
Leak Water Loss Guide (Water Loss in Gallons at 50 PSI)
Leak this Size Loss per Day Loss per Month Loss per Year
bullbull 120 3600 43200
360 10800 129600
693 20790 249480
1200 36000 432000bullbullbull bull 1920 57600 691200
3096 92880 1114560
4296 128880 1546560
6640 199200 2390400bullbullbull 6984 209520 2514240
Source Washington State Department of Health Office of Drinking Water available at wwwdohwagovehpdwwater_usewater_use_efficiencyhtm
Guidelines for Estimating Cost and Water Savings
It can be useful to estimate the potential long-term water and cost savings that will result from implementing water efficiency improvements in your facility This section provides guidelines on producing estimates of these savings after implementing improvements to a process at your facility
83
Appendix C Water Unit Conversions and Calculations
Current Water Use
First to estimate the current water use of an entire process at your facility identify the following information and use Equation 1 below
bull Average volume of water used during a full process or technology cycle
bull This may be provided by the product manufacturer through product literature or the manufacturerrsquos website or by using the guidelines and calculations in the previous section of this Appendix The water efficiency will be dependent upon the flow rate of each process cycle duration of each cycle and the number of cycles If the water use from the full process is not available from the manufacturer sum the water use from each part of cycle to determine the water use from the full process cycle
bull Average number of cycles per day
bull Days of facility operation per year
Water Use after Replacement or Retrofit
To estimate the water use of a more efficient technology or process change use Equation 1 but substitute the average volume of water used during an improved process cycle
Water Savings
To calculate water savings that can be achieved from a technology or process change identify the following information and use Equation 2 below
bull Current water use as calculated using Equation 1
bull Water use after replacement or retrofit as calculated using Equation 1
Equation 1
Water Use of a Technology or Process Cycle (gallonsyear) = Cycle Water Use (gallons) Number of Cycles (per day) Days of Facility Operation (daysyear)
Equation 2
Water Savings (gallonsyear) = Current Water use (gallonsyear) ndash Water Use After Improvements (gallonsyear)
84
Appendix C Water Unit Conversions and Calculations
Payback
To calculate the simple payback from a technology or process change identify the following infor-mation and use Equation 3 below
bull Equipment and installation cost of the replacement or retrofit
bull Water savings as calculated using Equation 2
bull Facility-specific cost of water and wastewater
Return on Investment
To calculate the return on investment of a technology or process change calculate the amount of cost savings as compared to the initial investment using Equation 4
General Calculations and On-Line Calculators
GEMIrsquos Collecting the Drops A Water Sustainability Plannertrade has several on-line and download-able calculators for measuring data related to water use and flows (see wwwgemiorgwaterplanner calculatorsasp) These include
bull Flow rate calculator
bull Friction loss and flow calculator
bull Pump hydraulic horsepower calculator
bull Water balance template and calculator
Equation 3
Payback (years) = Equipment and Installation Cost (dollars) [Water Savings (gallonsyear) Cost of Water and Wastewater (dollarsgallon)]
Equation 4
Return on Investment = [(Water Savings (gallonsyear) Cost of Water and Wastewater (dollarsgallon)] ndash Equipment and Installation Cost (dollars)
Appendix DWater Efficiency Opportunity Checklist
Water Efficiency Opportunity Checklist
FacilityBuilding Date Prepared
Prepared by Reviewed by
Water Efficiency Practice Yes No
1 Organizational Water Efficiency Practices
a Have you set water use reduction goals and targets for your facility
b Are water meters installed on high water using processes and are they working properly
c Do you have easy ways for employees to suggest ideas for water efficiency improvements (eg suggestion boxes)
2 Cooling and Heating
a Has once-through cooling water been eliminated with the use of chillers cooling towers or air-cooled equipment
b Has blow-downbleed-off control on cooling towers and boil-ers been optimized
c Is condensate being reused
d Is treated wastewater (or other sources of water for cooling tower make-up) reused where possible
e Are cycles of concentration for cooling towers maximized through efficient water treatment
f Is a conductivity controller installed on each cooling tower
g Have cooling towers been equipped with overflow alarms
h Are high-efficiency drift eliminators in use
3 Restrooms and Kitchens
a Are water-efficient fixtures installed (eg WaterSense labeled faucets toilets urinals and showerheads) Are there signs on dual-flush toilets showing people how to use them
b Have you installed metered or spring-loaded faucets or fau-cets with sensors
85
Appendix D Water Efficiency Opportunity Checklist
Water Efficiency Practice Yes No
c Have you adjusted plumbing to use the minimum amount of water that is functional
4 Process Use
a Have you installed timers to automatically shut off water flow when water is not required such as at the end of a produc-tion cycle
b Are solenoids and automatic shut-off valves checked regu-larly to ensure that they are working properly
c Is equipment set to the minimum flow rates recommended by the manufacturer
d Have pressure-reducing devices been installed on equipment that does not require high pressure
e Can process equipment reuse water (closed loop) or use reclaimed water from other parts of the facility
f Have you replaced water-based transportation with either waterless techniques or recycled water
g Are signs posted near equipment encouraging employee awareness of water use and discouraging tampering with equipment flow rate
5 Cleaning and Sanitation
a Are all hoses equipped with an automatic shut-off nozzle
b Has process cleaning or facility cleaning been replaced with waterless techniques (ie using pressurized air to clean products or containers sweeping debris off the floor) where possible
c Are improved rinsing techniques used (counter-current systems sequential use from high to lower quality needs conductivity flow controls improved spray nozzlespressure rinsing fog rinsing etc)
d Is spent rinse-water being reclaimed and reused for lower-grade processes or for other facility applications
e Have steps been taken to reduce the water used by steam sterilizers such as jacket and chamber condensate cooling modification
86
Appendix D Water Efficiency Opportunity Checklist
Water Efficiency Practice Yes No
f Are you using detergents that can easily be removed with little water
6 Landscaping and Irrigation
a Are low-flow sprinklers trickledrip irrigation and optimized watering schedules in use
b Are preventive maintenance techniques in place
c Has your facility designed its landscape to consider the local climate and grouped plants by similar watering needs
d Is grass planted only in places where it will provide optimal functional and aesthetic benefits
e Are systems in place to capture and reuse rain water and storm water for landscaping or for other uses (eg cooling tower make-up process water or dust suppression)
7 Leaks
a Are you conducting regular leak inspections
b Are leaky faucets faulty fittings and broken pipes and hoses identified and repaired promptly
c Are employees (including custodial crews) educated and em-powered to identify leaks and point them out for repair
d Is there a user-friendly method to report leaks
8 Comments
9 Recommended Follow-Up Actions34
34 For additional guidance see EPA Office of Water ldquoWaterSense at Work Best Management Practices for Commercial and Institu-tional Facilitiesrdquo wwwepagovwatersense North Carolina Department of Environment and Natural Resources Water Efficiency Manual for Commercial Industrial and Institutional Facilities wwwp2paysorgref0100692pdf East Bay Municipal Utility District of Oakland WaterSmart Guidebook wwwebmudcomfor-customersconservation-rebates-and-servicescommercial watersmart-guidebook and Arizona Municipal Water Users Association Facility Managerrsquos Guide to Water Management http amwuaorgpdfsfacility_managers_guidepdf
87
Appendix E Glossary of Water Terms Most of the definitions provided here are from the Alliance for Water Efficiencyrsquos water glossary available at wwwallianceforwaterefficiencyorgGlossaryaspx That glossary has a more extensive set of water-related terms and abbreviations
B
Best management practice (BMP)
Equipment or behavioral measure(s) established as the most practicable means of increasing water efficiency
Blowdown (or Bleed-off)
Draining off the water in a cooling tower reservoir or boiler to avoid the buildup of excess dissolved solids
E
End use A fixture appliance or other specific object or activity that uses water
M
Makeup water Fresh water introduced into a cooling tower or boiler to replace water lost to evaporation and blowdown
P
Peak use (demand)
The maximum demand occurring in a given period such as hourly or daily or annually Peak use can incur sur-charges above the normal base water cost charged by the utility
R
Reclaimed water Municipal wastewater effluent that is given additional treatment and distributed for reuse in certain applica-tions Also referred to as recycled water
Reverse osmosis A process to remove dissolved solids usually salts from water Salty water is forced through membranes at high pressure producing fresh water and a highly concentrat-ed brine
S
Source meter A meter that measures the quantity of water being sup-plied to a facility
88
89
Appendix E Glossary of Water Terms
Submeter A meter that measures usage for specific activities within a facility such as cooling towers process use or land-scape water use
W
Water audit An on-site survey of facility water use to measure equip-ment and management efficiency and generate recom-mendations to improve efficiency
Water balance A chart table or diagram that tracks water flow through a building or facility showing total inflows and total outflows (eg consumption irrigation evaporation leaks and losses)
Water conservation
1 Any beneficial reduction in the water loss waste or use
2 A reduction in water use accomplished by implemen-tation of water conservation or water-efficiency mea-sures
3 Improved water management practices that reduce or enhance the beneficial use of water
Water efficiency A measure of the amount of water used versus the mini-mum amount required to perform a task In irrigation the amount of water beneficially applied divided by the total water applied
Water footprint An analysis of the total volume of freshwater that is used directly and indirectly to run and support the business or to produce a product encompassing water use within an industrial facility throughout its supply chain and final disposition of the product
Lean and Water Toolkit
United States Environmental Protection Agencywwwepagovlean
October 2011EPA-100-K-11-003
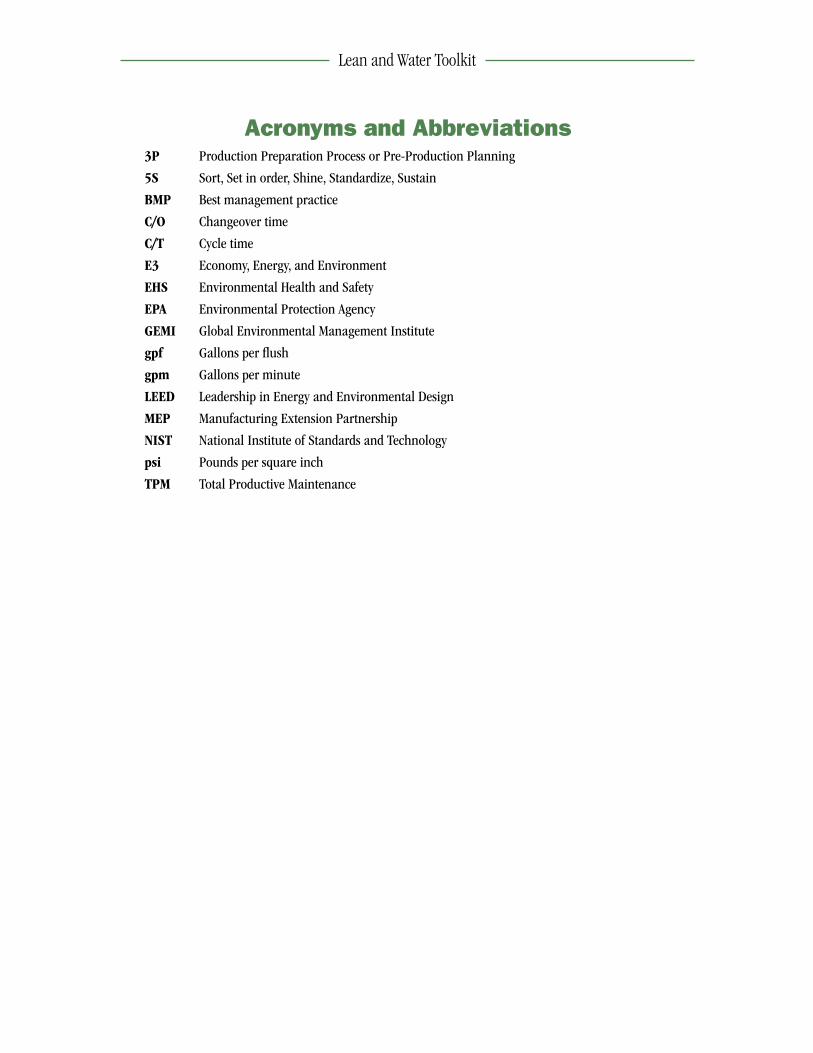
Lean and Water Toolkit
i
Executive Summary
Executive SummaryThis Lean and Water Toolkit describes practical strategies for using Lean manufacturingmdashthe production system developed by Toyotamdashto reduce water use while improving operational per-formance Drawing from the experiences and best practices of multiple industry and government partners this toolkit explores opportunities to identify and eliminate ldquowater wasterdquo including
bull Water losses and leaks
bull Non-value added or inefficient use of water
bull Missed opportunities to reuse water
bull Wastewater discharges
bull Unnecessary water use and risks throughout the supply chain
bull Missed opportunities to address customersrsquo water-efficiency goals
This toolkit is a supplement to EPArsquos Lean and Environment Toolkit (wwwepagovleantoolkit) which addresses all types of environmental wastes and improvement opportunities
Why Address Water Using Lean Companies recognize water use and availability as a critical business concern While direct water costs may be low many indirect costs associated with water use can make the full cost of water substantial Community concerns about water and the risk of water supply disruptions can increase pressures on companies to reduce water use Incorporating water use reduction into Lean initiatives provides an efficient and effective means to
1 Uncover cost savings and operational improvements
2 Reduce water-related business risks
3 Deliver value for customers and employees
Facilities already using Lean can often easily incorporate water considerations into value stream maps and other Lean efforts At the same time facilities conducting water efficiency initiatives may find that Lean tools provide a powerful means to drive effective implementation and results Con-necting Lean and water efforts can engage employees in powerful and rewarding ways that build capacity and momentum to solve problems and create value
Understand Water Uses and Costs The toolkit discusses common water end uses in industrial and manufacturing facilities and discuss-es costs associated with water use Costs of water include not only the cost of purchasing water but also costs associated with treatment heating conveyance and regulatory compliance Metering and sub-metering are important tools for understanding actual water use within a facility and tracking it over time
ii
Executive Summary
Find Water Waste The toolkit discusses several techniques to find water waste and opportunities at your facility in-cluding
bull Water Gemba Walks Have a team walk the factory floor together to observe and inventory inefficiencies related to water use
bull Water Balance Develop a diagram of your facilityrsquos water use that shows and quantifies the flows of water into and out of each process or operation in the facility
bull Value Stream Mapping Add information on water use andor costs to Lean value stream maps to help identify water waste and develop implementation plans for Lean and water efficiency improvement efforts
bull Root Cause Analysis Use root cause analysis methods to explore the underlying causes of water waste and inform improvements
Improve Operations and Processes with Lean and Water Strategies Solutions to reduce water waste can be identified during Lean events and in daily implementation of Lean principles and tools The toolkit discusses facility operations and support functions in which there may be specific improvement opportunities Strategies include
bull Waste Elimination Culture Encourage employees to identify water waste throughout their daily activities and create a culture in which they are empowered to continually im-prove the way your facility uses water
bull Kaizen Events and Just-Do-Its Pursue opportunities to address water waste during Lean kaizen events Consider focusing kaizen events specifically on water waste or water-intensive processes Also find quick opportunities for individuals to immediately improve a process or operation in just-do-it projects
bull Standard Work Embed water use management and efficiency tasks into standard operat-ing procedures to engage all employees in proactive water-efficiency activities
bull Visual Controls Use signs and visual controls to reinforce water waste reduction practices and standard work Clearly display information on water use and costs to raise awareness
bull 5S Incorporate water management and waste reduction activities into 5S housekeeping activities such as cleaning and inspections to engage all employees in identifying and eliminating water waste
bull Total Productive Maintenance Enable teams of workers to quickly identify and correct problems fix leaks and improve water efficiency while optimizing the effectiveness of your manufacturing equipment
iii
Executive Summary
These Lean tools can be used at a facility in concert with water-efficient best management practices (BMPs) that are often available from industry associations and government agencies1 Industrial facilities can target their efforts to the most effective solutions using these technology and process-based improvements
Extend Lean and Water Efforts throughout the Value Chain Looking beyond facility operations can allow you to uncover new ways to reduce water use and risks while adding value and improving business operating conditions and market opportunities Strategies include
bull Supply Chain Initiatives Work with your suppliers to improve understanding of water use costs and risks Provide incentives and technical support to help suppliers identify and eliminate water waste Collaborate with supply chain partners to address water-related op-portunities through joint Lean events and other initiatives
bull Engage Local Communities Educate and engage your employees in water-efficiency efforts at your facility and encourage them to adopt similar practices at home Partner with community members and local organizations to conduct projects or Lean events that improve water use andor quality in the community
bull Product Design Incorporate water efficiency and reuse as design criteria into Lean prod-uct and process design methods as a powerful means of reducing the water use of products throughout their lifecycle
Starting Your Lean and Water Journey There are many ways to get started with identifying and reducing water waste and improving busi-ness results using Lean Consider using the strategies and techniques in this toolkit to help you
1 Learn more about how your facility uses water
2 Engage employees in Lean and water improvement efforts
3 Connect Lean and water efforts to sustainable water management strategies
We hope the strategies and tools in this toolkit will help you on your Lean and water journeymdashen-abling you to reduce water waste and costs improve processes and foster positive relations with your customers and community
1 Appendix A provides information on water efficiency resources and technical assistance providers that offer helpful information on BMPs Also consider contacting your local water utility or the industry or trade association in your sector to inquire about water-related BMPs and resources
iv
Preface
Preface
Purpose of This ToolkitThe Lean and Water Toolkit offers Lean implementers practical strategies and techniques for improving common Lean results related to time cost and quality while also reducing water use costs and risk Environmental Health and Safety professionals will also find useful infor-mation in this toolkit for how to leverage Lean and Six Sigma business improvement methods to eliminate water waste Finally the toolkit introduces Lean practitioners to the wide array of water efficiency resources available from EPA and other organizations
The ldquoLeanrdquo methods discussed in this toolkit are organizational improvement methods pioneered in the Toyota Production System Lean production and Lean manufacturing refer to a customer-focused business model and collection of methods that focus on the elimination of waste (non-value added activity) while delivering quality products on time and at a low cost Six Sigma is a business model that focuses on improving quality by eliminating variation it is often combined with Lean The toolkit assumes that you are familiar with Lean methods For those who want to learn more about Lean see EPArsquos Lean and Environment website (wwwepagovlean)
Key Questions Addressed by This Toolkit Lean works well when it focuses on identifying and eliminating waste This toolkit contains strate-gies and techniques that can enable Lean practitioners to easily identify water waste and improve-ment opportunities alongside the myriad other wastes and improvement opportunities uncovered by Lean To accomplish this the toolkit aims to answer the following questions
What is water waste Water is required in substantial quantities to produce goods from food products to silicon chips Water waste is water that is used beyond the point at which it ceases to add value to the customer Excess water use often leads to wastewater which can harm human health and the environment through the pollutants it collects and overdrawing water resources in certain regions can exacer-bate water scarcity concerns Water can be wasted in the supply chain through facility operations and in product use and disposal This toolkit will help you to recognize water waste so that you can work to reduce it
Why should you address water waste with Lean Substantial water savings can ride the coattails of Lean improvement By eliminating manufactur-ing wastes such as unnecessary processing and cleaning businesses also reduce the water and associated labor and energy costs needed for cleaning conveyance cooling and heating Chapter 1 describes benefits of combining Lean and water efficiency efforts and discusses how to get started Chapter 2 provides an overview of industrial water use including information on water uses water metering and water costs
v
Preface
How do you know how much and where water is used in your facility A key step in effective Lean and water efforts is determining where to target water efficiency im-provement activities Chapter 3 discusses techniques for measuring water use and identifying op-portunities to reduce water use in the context of Lean Methods include gemba walks water balance value stream mapping and root cause analysis
How can you reduce water use with Lean methods Chapter 4 examines specific opportunities for using Lean methods to improve water efficiency including kaizen events standard work visual controls 5S and total productive maintenance These strategies present ways that you can integrate water efficiency principles and practices into the practical implementation-based tools of Lean manufacturing and the waste-elimination culture fostered by Lean
How can you use Lean to pursue water efficiency opportunities beyond your facilityrsquos operations For many companies water costs and risks may be driven by factors and activities beyond the facility fence-line Similarly opportunities to capture market value and win customers may require considerations upstream to manufacturing activities Chapter 5 explores strategies to leverage Lean initiatives and methods to reduce water risks in your supply chain and to engage the local commu-nity in water saving initiatives Chapter 5 also discusses how Lean product design methods can be used to improve water efficiency and add value by addressing customer water needs
Lean and Water Toolkit
1
CHAPTER 1
Introduction
Water is a crucial resource for the world economy Lean provides a framework in which organiza-tions can address water waste while saving costs reducing risks and adding customer value This chapter includes the following sections
bull Importance of Water to Industry bull Benefits of Addressing Water with Lean bull Getting Started with Lean and Water
Importance of Water to Industry Companies worldwide identify water issues as a critical business concern Water is essential for a range of industrial processes and support functions facility operations and as an ingredient for many products Water use is increasing much faster ldquoI am convinced that under present than population growth and regional and seasonal conditions and with the way water is differences in water availability can lead to short- being managed we will run out of ages and even water-related conflicts The World water long before we run out of fuelrdquo Economic Forum reports that 44 percent (28 billion) of people currently live in areas of the Peter Brabeck-Letmathe Chairman
world that are water stressed and if present trends Nestle Corporation
continue water scarcity will affect the livelihood of Source ldquoA water warning Peter Brabeck-Letmathe chairman of Nestleacute argues that water shortage is an even more urgent problem than climate changerdquo The Economist November 19 2008one-third of the worldrsquos population by 20252 wwweconomistcomnode12494630
Corporations are recognizing the important role they play in addressing water resource chal-lenges and companies are responding by engaging in efforts to measure report and reduce their water use In a survey conducted by the Carbon Disclosure Project of 302 of the worldrsquos largest 500 companies 89 percent of responding companies had developed specific water policies strategies and plans and 67 percent indicated that responsibility for water-related issues lies at the Board or Executive Committee level3 The United Nationsrsquo CEO Water Mandate launched in 2007 is designed to help companies develop implement and report on water sustainability policies and practices Industry-led associations such as the World Business Council for Sustainable Development and the Global Environmental Management Initiative also have major water initiatives
One key reason why companies choose to use water more efficiently is to improve their relationship with the communities that surround industrial facilities Water use is of paramount importance to a facilityrsquos relationship with its surrounding community Facilities that use less water in drought-
2 World Economic Forum ldquoThe Bubble Is Close to Bursting A Forecast of the Main Economic and Geopolitical Water Issues Likely to Arise in the World during the Next Two Decadesrdquo Draft Report for Discussion at World Economic Forum
3 Carbon Disclosure Project ldquoCDP Water Disclosure 2010 Global Reportrdquo available at wwwcdprojectnetCDPResultsCDP-2010-Water-Disclosure-Global-Reportpdf
2
Chapter 1 Introduction
prone areas leave more water available for residential use Some companies even risk being forced to withdraw from regions where water is a scarce resource a problem that is likely to recur as water scarcity increases in many regions around the globe In some cases communities around industrial facilities show much greater concern for the amount of water a facility uses than the amount of energy it uses
This toolkit provides strategies and tools for addressing water issues within the context of Lean manufacturing and other business process improvement methods
Benefits of Addressing Water with Lean Lean provides powerful tools for delivering value to customers in a manner that minimizes waste and risks from unnecessary water use Explicit consideration of water waste during Lean imple-mentation can create significant value for an organization helping to deliver quality products and services that customers want when they want them Research sponsored by EPA and others shows that some water use and waste reduction benefits typically ride the coattails of Lean efforts yet other opportunities to reduce wastes risks and non-value added activity associated with water may be overlooked There are three key benefits of addressing water with Lean as listed in Box 1 and further described below
Key Benefits of Addressing Water with Lean (Box 1)
1 Uncover cost savings and operational improvements
2 Reduce water-related business risks
3 Deliver value for customers and employee
Uncover Cost Savings and Operational Improvements Learning to see and eliminate waste is a cornerstone of Lean initiatives Water waste is often a sign of inefficient production and non-value added activity and it frequently indicates opportuni-ties for saving costs and time Lean and water strategies can help you to uncover cost savings and improvements in areas of your facilityrsquos operations that may not have received as much attention in your Lean efforts For production processes that are highly dependent on water or that have water-intensive support processes such as wastewater treatment the operational and environmental benefits from Lean and water efforts are even more significant
Learning to see water and other environmental waste during Lean efforts can reveal significant business improvement opportunities further strengthen Lean results and improve environmental performance Box 2 provides several examples of how companies have used Lean and Six Sigma methods to reduce water use save costs and improve their performance
3
Chapter 1 Introduction
Example Results From Lean and Water Efforts (Box 2)
3 IBM used Six Sigma tools to reduce water consumption and operating costs in wafer fabrication processes saving $3 million annually reducing water usage by 27 percent and increasing production by over 30 percent
3 GE combined high-tech water metering and other water efficiency prac-tices with its kaizen improvement methodology resulting in a 30 percent drop in water use since 2006
3 DTE Energy saved 20 million cubic feet of water (79 percent) and $700000 annually in a Lean Six Sigma project examining electric substa-tion water use
Sources IBM ldquoGreen Sigma Overviewrdquo Presentation to EPA June 2009 GE info cited in Carbon Disclosure Project ldquoCDP Water Disclosure 2010 Global Reportrdquo page 25 available at wwwcdprojectnetCDPResultsCDP-2010-Water-Disclosure-Global-Reportpdf and Jason Schulist DTE Energy ldquoLean Towards Sustainability How to Use Lean and Six Sigma Methods to Drive Your Sustainability Journeyrdquo Presentation at Green Six Sigma Conference May 19 2009
While many places have very low direct costs for water and wastewater there are also indirect costs to water use These costs can be significant yet they are often hidden in overhead or support cost centers (see Box 3 for examples of how facilities have uncovered water waste and costs) Examples of water costs include
bull Raw Material Costs Costs of measures to ensure that purchased water supply is of suf-ficient quality for use at a facility For example some facilities may bear costs for labor equipment and materials needed to improve water quality before use (eg when water is a key product ingredient) as well as for chemicals and other raw materials needed to treat and manage water at the facility and before discharging it Water treatment costs associated with deionized water and reverse osmosis can be substantial
bull Energy Costs for the energy required to heat and cool water pump or transfer water operate water-consuming equipment treat water and wastewater and other functions
bull Pollution Control Wastewater service costs paid to a utility andor industrial pretreat-ment costs for the energy labor materials equipment and chemicals needed to treat wastewater before discharging it from the facility
bull Regulatory Compliance Costs for regulatory compliance activities such as completing permit applications and tracking and reporting wastewater discharges to regulatory agencies In the United States industrial municipal and other facilities must obtain National Pollutant Discharge Elimination System permits if the facilities discharge water pollutants directly into US waters Pretreatment regulations govern industrial facilities that discharge into municipal sewer systems Also in some food and consumer product industries water use may be important to address Food and Drug Administra-tion sanitation requirements
4
Chapter 1 Introduction
Lean and water strategies such as those outlined in this toolkit help to reveal these costs and identify process improvement solutions The next chapter provides more information about water end uses and costs
Learning to See Water Waste and Costs (Box 3)
3A wood products company began metering water into two parallel process units and discovered one was using significantly more water than the other After some investigation the company identified and implemented mainte-nance practices that would substantially lower water use while also prevent-ing equipment failure and downtime
3A food processing company regarded the water supply from its groundwater well as essentially free While completing a facility water balance it me-tered the amount of hot water used for one process step Once the com-pany realized it was heating 25 gallons per minute of ground water from 55 degrees to boiling it began to think of opportunities to reduce and reuse the energy in the hot water rather than sending it down the drain
3A small high tech silicon wafer company was paying its city water utility $120 per hundred cubic feet of water After calculating the cost of pre-treating its process water and adding wastewater treatment and discharge expenses the company realized that the full cost of water was five times the initial cost of purchasing water These insights led the company to reuse rinse water in the process reducing total water use and demand for ultra pure water without affecting product quality
Reduce Water-Related Business Risks Lean provides an effective platform for reducing facility water use and the associated water-related business risks While the specific risks that individual facilities face vary examples of water-related risks include water shortages and reliability issues water quality issues that drive the need for additional water treatment increasing water costs and supply chain interruptions In some water-scarce regions there may be challenges with meeting basic human needs for clean water and sani-tation competition for scarce water resources may be intense between uses associated with public water supply agriculture industry and fisheries Climate change is predicted to exacerbate many of these water risksmdashincreasing global temperatures will likely lead to increases in water de-mand water scarcity more vulnerable ecosystems and more frequent extreme weather events4
How companies respond to water risks can also have important implications for how local commu-nities and customers perceive those companies 4 For more information on water and climate change see CERES and Pacific Institute ldquoWater Scarcity amp Climate Change Grow-
ing Risks for Businesses amp Investorsrdquo February 2009 available at wwwpacinstorgreportsbusiness_water_climatefull_report pdf For a discussion of business perspectives on the connections between water energy and climate change see World Business Council for Sustainable Development ldquoWater Energy and Climate Change A Contribution from the Business Communityrdquo March 2009 available at wwwwbcsdorg
5
Chapter 1 Introduction
Types of Water-Related Business Risks (Box 4)
Companies face a variety of risks related to water security including
3Business Interruption Risks that the supply of water may be disrupted in the supply chain production andor product use
3Reputation Risks related to public scrutiny of how companies respond to water resource challenges and engage with communities stakeholders and employees
3Regulatory Risks of increased government regulations or restrictions on water use and water pollution as well as the associated costs to respond to the requirements
3Access to Capital Risks of financial institutions adopting stricter lending and investment policies based on water uncertainties
Source World Economic Forum ldquoThe Bubble Is Close to Bursting A Forecast of the Main Economic and Geopolitical Water Issues Likely to Arise in the World during the Next Two Decadesrdquo Draft Report for Discussion at World Econom-ic Forum Annual Meeting 2009 January 2009 page 39 www3weforumorgdocsWEF_ManagingFutureWater20 Needs_DiscussionDocument_2009pdf
Reducing non-value added water use is a key strategy for mitigating water risks Integrated Lean and water strategies offer practical solutions that support multiple business objectives such as increased efficiency reduced costs improved customer responsiveness and decreased water and energy use By engaging employees in teams to identify and eliminate sources of water waste in your facilitymdashalongside other production wastes such as over processing defects and delays your facility can proactively reduce water risks while also supporting operational goals Proactively en-gaging with local utilities and communities to collaboratively address water resource challenges can provide additional opportunities to reduce business risks and increase value These efforts will make your facility less vulnerable to risks and better positioned to succeed given changes in water supply demand and quality
Deliver Value for Customers and Employees Reducing water use and risks through Lean Six Sigma and other process improvement meth-odologies can foster a competitive advantage for some businesses Customers and employees may view proactive environmental improvement efforts as an important attribute affecting customer loyalty and the ability to attract and retain employees In some market segments ldquogreenrdquo attributes are an important factor that can give a product or company competitive advantage People around the world view water issues as a key sustainability challenge For example more than 90 percent of the 32000 people polled in 15 countries for a GlobeScan and Circle of Blue survey in 2009 perceived ldquowater pollutionrdquo and ldquofreshwater shortagerdquo to be serious problems (70 percent considered them very serious problems)5 Some companies can tap into significant market niches by providing cus-tomers with water-efficient choices and solutions 5 GlobeScan and Circle of Blue ldquoWater Views Water Issues Researchrdquo August 19 2009
wwwcircleofblueorgwaternewswp-contentuploads200908circle_of_blue_globescanpdf
6
Chapter 1 Introduction
Participation in international or national water sustainability programs or local water efficiency efforts can provide businesses with public recognition and a competitive advantage for their wa-ter management achievements For businesses that manufacture water-using appliances parts or products companies can use design methods to make their products as water-efficient as possible throughout their lifecycles from manufacturing to use and disposal These methods can allow companies to cater to the steadily growing markets for green building and green products There are also awards and competitions that provide recognition and media publicity for water-related in-novations and efficiency accomplishments
Reducing your facilityrsquos water use and the water that your products require during use can add value for your ldquodownstreamrdquo customersmdashsaving them water and energy costs and helping them meet their water-efficiency goals Business interest in gathering and disclosing water use and risk information through initiatives such as the Global Reporting Initiative and the Carbon Disclo-sure Projectrsquos Water Disclosure Initiative may increase in the coming decade as water becomes a more critical business issue in some supply chains and industry sectors Chapter 5 discusses ideas for engaging with customers suppliers and communities on Lean and water efforts as well as incorporating water issues into Lean product design
Getting Started with Lean and Water There are many ways for a facility to get started with reducing water waste and finding Lean and water improvement opportunities While the possibilities can be daunting the important thing is to begin even if the effort is small Consider starting out with small steps such as tracking water use as a metric at your facility with the goal of reducing use This can be a great strategy for smaller facilities Here are some ideas for initiating a Lean and water effort
Learn More About How Your Facility Uses Water A key first step is learning how your facility uses water and identifying the process areas support functions and facility operations that have the greatest water waste and improvement opportunities Strategies include beginning to track water metrics as part of Lean and process improvement activi-ties and installing water meters on processes that use large amounts of water Box 5 lists examples of water metrics that facilities can use It is helpful for facility managers and Lean champions to track water usage regularly and to share this information with floor staff Regularly monitoring water use data can help you determine the impact of peak periods (eg during summer andor busier production months) and help you spot variations that could be signs of problems
7
Chapter 1 Introduction
Water Metrics (Box 5)
Facility-Wide Metrics
3 Volume of water used each month or other appropriate time period (eg gallonsmonth or gallonsshift)
3 Volume of wastewater (eg gallonsmonth or gallonsshift)
3 Water used for specific end uses (eg gallonsper month for outdoor ir-rigation cooling water evaporation heated process water bathrooms and kitchens etc)
Metrics Normalized to Production
3 Volume of water used per product (eg gallonspound of product gal-lonsproduct)
3 Volume of wastewater discharged per product (eg gallonspound of product or gallonsproduct)
Chapter 2 of this toolkit has more information on water end uses metering and costs
To be most effective in Lean and water implementation efforts Lean champions or operations man-agers should connect with environmental and facilities personnel early on to discuss plans for Lean and water efforts Environmental Health and Safety (EHS) personnel can assist with developing water balances and other assessments of facility and process water use including gathering data on water use and costs as well as helping prioritize Lean and water activities
After completing an initial water assessment managers can consider it in the context of other planned Lean events and prioritize opportunities for involving EHS personnel in value stream map-ping and kaizen events based on when their environmental expertise will add the most value
Engage Employees in Lean and Water Improvement Efforts Lean provides a solid framework to empower cross-disciplinary employee teams to identify and eliminate excess water use and other production waste thereby realizing both environmental and Lean gains Most likely your efforts to examine water use and waste will generate numerous ideas for process improvements and potential solutions Ideas could include water efficiency and reuse opportunities andor Lean events to improve water-intensive processes
bull Motivate employees and managers by communicating corporate sustainability goals and incorporating water efficiency into performance targets and incentives
bull Consider trying out some of the Lean and water improvement ideas in this toolkit but donrsquot limit employee teams to those ideasmdashencourage their creativity and initiative
bull Train employees on how to identify water waste and improvement opportunities building their capacity to problem solve and help meet your facilityrsquos water use reduction targets
8
Chapter 1 Introduction
bull Actively solicit employee suggestions for kaizen events or other improvement projects by inviting ideas in meetings and conversations andor by using a suggestions board or box
A significant benefit of involving employees throughout your facility in Lean efforts is the oppor-tunity to create a culture of continuous improvement When employees are engaged in identifying ways to improve water efficiency they are more likely to note these opportunities and areas of water waste throughout their normal day-to-day operations You might find that improved water efficiency becomes a continual trend at your facility and not just something that happens within the confines of a specific Lean exercise or event
Focus your facilityrsquos initial Lean and water efforts on high-impact easy-to-implement strategies in order to achieve the highest likelihood of success An Impact-Difficulty Matrix such as the one in Figure 1 can be useful for prioritizing among process improvement and implementation options Lean event participants can plot their ideas onto the four quadrants in the matrix based on whether or not an idea would have a large or small impact (either in terms of operational andor environ-mental objectives) and whether or not it would be difficult to implement This process lets people see visually which projects are most ldquoriperdquo for Lean
Connect Lean and Water Figure 1 Impact-Difficulty Matrix Efforts to Sustainable Water Management Strategies Lean and Six Sigma provide operational High tools that can support a broader corporate water sustainability strategy Leanrsquos focus on performance measurement continual improvement through employee engage-ment waste elimination improved ef- Low ficiency increased profits and customer satisfaction can be leveraged to support corporate water management efforts to Low High measure and report water use factor water
Difficulty into business decisions and implement the practical and effective solutions If your organization already has a sustainability policy andor specific water efficiency goals consider how Lean and water strategies could be used to enhance and accelerate those efforts
Risk-Based Water Sustainability Strategies
Depending on the importance of water to your business it may be worth developing a risk-based water sustainability strategy and then seeing how Lean and water efforts could support implementa-tion A number of resources can help you assess specific water-related risks determine the business case for water sustainability and develop implementation plans These include
Impact
9
Chapter 1 Introduction
bull Global Environmental Management Initiativersquos (GEMIrsquos) Connecting the Drops Toward Creative Water Strategies A Water Sustainability Tooltrade wwwgemiorgwater
bull World Business Council for Sustainable Developmentrsquos Global Water Tool wwwwbcsdorgwebwatertoolhtm
bull GEMIrsquos Local Water Tooltrade (scheduled to be released in spring 2012) wwwgemiorgGEMIInteractiveToolsaspx
This toolkit complements broader water sustainability strategy resources (such as those listed above) by exploring practical opportunities to leverage facility Lean and Six Sigma and similar process improvement initiatives to reduce water waste
True North Goals and Targets
Lean experts often extol the motivational power of setting goals and targets that represent the ldquoTrue Northrdquo for operations As noted by Lean expert Robert Hall of the Association of Manufacturing Excellence ldquoTrue North is what we should do not what we can do the ultimate ideal for the overall process and for every sub-process within itrdquo6 True North goals targets and metrics are powerful tools for inspiring and focusing employee attention and creativity to both continuously improve and find breakthrough solutions For example Nike Inc developed ldquoNorth Starrdquo goals and metrics to define what sustainable products and a sustainable company would look like which includes a focus on water stewardship7 Consider what the True North target is for water use in your facility For many facilities the True North targets may be zero wastewater and zero water use that is not incorporated into the product
Examining the Full Value Chain
To achieve sustainability goals itrsquos important to look beyond a facilityrsquos direct operations Lean methods can support water use and risk reduction efforts not only at areas within the direct control of a manufacturing or industrial facility but also throughout the lifecycle or extended value chain for a product or servicemdashfrom the extraction and processing of raw materials through production processes and onto product distribution use and disposition While the primary focus of this toolkit is on reducing water use at your facility Chapter 5 discusses opportunities to extend Lean and water techniques to other areas Figure 2 provides an illustration of how the content of the toolkit links to a value chain
6 Robert Hall ldquoThe Toyota Production System Seeks True Northrdquo Lean Directions e-Newsletter 2011 available at wwwsmeorgcgi-binget-newsletterplLEANamp20040709amp1amp
7 For more information on Nikersquos North Star see httpwwwnikebizcomcrreportcontentenvironment4-1-0-overviewphpcat=overview
10
Chapter 1 Introduction
Figure 2 Lean and Water Implementation Strategies
Understand Water Uses and Costs (Chapter 2)
Find Water Waste (Chapter 3)
Improve Operations and Processes with Lean and Water Strategies (Chapter 4)
Extend Lean and Water Efforts Throughout the Value Chain (Chapter 5)
Sourcing Materials and Inputs (Chapter5)
Production Manufacturing (Chapters 3 and 4)
Product Distribution Use and Disposition (Chapter 5)
To Consider
3Is water use responsible for major costs waste or risk at your organiza-tion If you donrsquot know how would you find out
3How has Lean affected your organizationrsquos use of water
3How could your organization benefit from efforts to reduce water waste us-ing Lean (Think about time and cost savings reduced risks and liabilities added value to customers etc)
3What ideas do you have for reducing water waste using Lean
11
CHAPTER 2
Water Use and Water Waste at Industrial Facilities
Understanding water use is an important first step in efforts to reduce water-related wastes costs and risks This chapter contains the following sections
bull Definition of Water Waste bull Industrial Water Use bull Water End Uses How Water Is Used at Facilities bull Measuring Facility Water Use Metering and Submetering bull Costs Associated with Water Use
Definition of Water Waste Water is one of the most critical resources in the world and is necessary for all types of industry Water is required in substantial quantities to create goods from food products to silicon chips In this toolkit the term ldquowater wasterdquo refers to use of water beyond the point that optimizes value to the customer This includes non-value-added water use throughout facility operations and support processes and from the supply chain through production product use and waste disposal Water waste can cause harm to health and well-being of people and ecosystems by diverting water from other needs and beneficial uses Reducing water waste can help ensure that present and future gen-erations have access to a sustainable water supply
Improve your facilityrsquos water efficiency by reducing water waste not only by reducing water intake but by finding creative ways to use water more efficiently Water efficiency as the term is used in this toolkit refers to reductions in the amount of water used per unit of production Water effi-ciency refers to the minimum amount of water needed to perform a task (Note that water-efficiency improvements do not necessarily mean that a facilityrsquos total water use is decreased since increases in production may offset water efficiency gains) Examples of water waste include
bull Loss of water through material failures such as leaky hose nozzles
bull Discarding water that could be reused such as treated rinse water
bull Wastewater discharges
bull Water used by high-flow appliances instead of more efficient alternatives
bull Use of water in excess of necessity such as the use of too much water for facility or parts cleaning
Understanding the many places where water waste occurs is an important first step for identifying areas for improvement
Chapter 2 Water Use and Water Waste at Industrial Facilities
Industrial Water UseThe use of water by industries both in the United States and throughout the world represents a significant portion of total water use US industrial water use is estimated to be more than 182 billion gallons per day (from direct water withdrawals not including water use from public water supply)8 While industrial water withdrawals account for just five percent of total water withdrawals in the United States thermoelectric power water withdrawals account for 49 percent Industrial and manufacturing businesses also use about 12 percent of the public water supply Industrial water us-ers include facilities involved in sectors such as chemicals food and beverage paper and associated products steel electronics and computers metal finishing petroleum refining and transportation equipment Overall two of the most water consuming sectors of the economy are agriculture and thermoelectric power although other industries may use a significant proportion of public water supplies in some areas
The share of industrial water use can be much greater in certain geographic areas and these areas can experience substantial supply pressures Figure 3 below shows a geographic distribution of wa-ter scarcity across the globe Areas prone to water scarcity will likely experience continued competi-tion for water resources which can impact your relationship with the surrounding community Be aware of your facilityrsquos location relative to potential water scarcity and consider water competi-tion when siting new facilities or building relationships with new suppliers In the United States the National Integrated Drought Information System maintains a user-friendly web portal(www droughtgov) with current information forecasts maps reports and resources addressing drought conditions and water scarcity
Industrial water use varies by sector as different activities require different inputs of water Box 6 lists eight industries that require substantial inputs of water
Water-Intensive Industries (Box 6)
3 Agriculture
3 Apparel
3 Beverages
3 Biotechnologypharmaceuticals
3 Electric power
3 Forest products
3 High-tech (including semiconductor manufacturing)
3 Metalsmining
8 Kenny Joan F et al Estimated Use of Water in the United States in 2005 USGS 2009 httppubsusgsgovcirc1344 The USGS data does not include industrial water use drawn from municipal water systems only direct withdrawals from surface and groundwater sources Actual industrial water use is likely greater For information on water use outside of the US see AQUASTAT Food and Agricul-ture Organization of the United Nations ldquoWater Withdrawal by Sector Around 2003rdquo data downloaded November 2010 wwwfaoorg nrwateraquastatmainindexstm Note that FAO data includes thermoelectric cooling water withdrawals in its industrial water totals
12
13
Chapter 2 Water Use and Water Waste at Industrial Facilities
Figure 3 Water Scarcity Map of the World
Source United Nations Environment Programme Map of Water Stress Indicator in Major Basins 2004 available at http mapsgridanogographicwater-scarcity-index
Water is a very important resource to many industries and as a result there are many opportuni-ties to reduce water use In the case of the high-tech industry which uses considerable quantities of water to manufacture semiconductors and other components water is vital to industry opera-tions Cleaning and rinsing silicon chips can require billions of gallons of water per year to produce a single chip can use up to 7900 gallons9 Apparel also ranks high in the list of water-intensive industries with cotton production and textile processing requiring substantial inputs of water Among industrial manufacturers the forest products sector is the third-largest consumer of water in the US requiring high volumes of water for pulp and paper manufacturing The electric power industry directly uses water extensively for cooling and emissions scrubbing fossil fuel plants and nuclear power plants require hundreds of liters of water for every kilowatt-hour of electricity that they produce10 Table 1 shows typical water quantities required to produce one ton of several manu-factured products
9 Uphadyay Sanjay ldquoMicroelectronics ndash Fostering Growth Opportunities in the Ultrapure Water Marketrdquo Frost amp Sullivan August 19 2011 available at wwwfrostcomprodservletmarket-insight-toppagdocid=240394448
10 CERES and Pacific Institute ldquoWater Scarcity amp Climate Change Growing Risks for Businesses amp Investorsrdquo February 2009 available at wwwpacinstorgreportsbusiness_water_climatefull_reportpdf
Chapter 2 Water Use and Water Waste at Industrial Facilities
Table 1 Typical Water Use Per Ton of Product
Paper 21000ndash528000 gallons
Beer 2113ndash6604 gallons
Sugar 792ndash105668 gallons
Steel 528ndash92460 gallons
Soap 264ndash9246 gallons
Gasoline 26ndash10566 gallons
Source United Nations World Water Assessment Programme United Nations World Water Development Report Water in a Changing World 2009 available at wwwunescoorgwaterwwapwwdrwwdr3
There is much variation among industrial sectors in relative water use and the need for water varies greatly across the stages of the product or service value chain from suppliers through production to product use It is important to know where in the value chain your industryrsquos water use is heavi-est so that you can appropriately target improvement efforts For example the apparel industry uses high volumes of water in raw material production whereas the biotech and pharmaceuticals industry uses most of its water resources in direct operations Table 2 shows the relative intensity of water impact (ranging from zero to three squares) in different segments of the value chain for several industry sectors
Table 2 High-Impact Water Use Sectors
Raw Material Production
Suppliers Direct Operations
Product Use End of Life
Apparel n n n n n
High-Tech Electronics
n n n
Beverage n n n n
FoodAgriculture n n n n n
Biotech Pharmaceuticals
n
Forest Products n n n
MetalsMining n n n n
Electric Power Energy
n n n n
Source CERES and Pacific Institute ldquoWater Scarcity amp Climate Change Growing Risks for Businesses amp Investorsrdquo February 2009 available at wwwpacinstorgreportsbusiness_water_climatefull_reportpdf
14
15
Chapter 2 Water Use and Water Waste at Industrial Facilities
Water End Uses How Water Is Used at Facilities In order to reduce water waste in industry it is important to understand the many ways that water is used within facilities Understanding water end uses is critical to identifying water savings opportunities While end uses of water vary by industry and by facility there are categories of water use that are present at most industrial facilities Water use in most industries can be classified into the following broad end uses
bull Production processing and in-product use
bull Auxiliary processes (eg pollution control labs and cleaning)
bull Cooling and heating (eg cooling towers and boilers)
bull Indoor domestic use (eg restrooms kitchens and laundry)
bull Landscape irrigation
These broad categories encompass many of the ways industrial facilities use water Among US industrial customers cooling operations (including cooling towers and open cooling systems) com-prise the single largest category of industrial water end use with more than 50 percent of industrial and commercial water demand combined going toward cooling11
The amount of water required for the various end uses differs by industry Service and manufactur-ing facilities require the most water for washing and processing while food and beverage facilities use most of their water intake in product preparation Figure 4 shows examples of water end uses in the computer and electronics manufacturing industry and the food processing industry
11 Vickers Amy Handbook of Water Use and Conservation WaterPlow Press 2001
16
Chapter 2 Water Use and Water Waste at Industrial Facilities
40
20
20
10
5 5
Figure 4 Breakdown of Water Uses in Two Industries
Rinsing
Cooling Systems
Fume Scrubbers
Water Purification
RestroomsOther
Landscaping
Computer and Electronics Manufacturers
3
42
14
13
9 Washing and Sanitation
Cooling and Heating
OneshyPass Cooling
Process
Domestic
OtherUnaccounted
Source Adapted from New Mexico Office of the State Engineer ldquoA Water Conservation Guide for Commercial Institutional and Industrial Usersrdquo July 1999 available at wwwosestatenmuswater-infoconservationpdf-manualscii-users-guidepdf
Major end uses of water often provide the greatest opportunities for water waste reduction and efficiency improvement For example in many food beverage and pharmaceutical companies cleaning process equipment can account for as much as 50 to 70 percent of a facilityrsquos total water use and represents a substantial opportunity to save water12 Figure 5 illustrates how water flows through several different end uses at an industrial facility note that this diagram does not incorpo-rate all reuse options Think of how a similar diagram would look that shows the water use at your facility
12 General Electric Company Water amp Process Technologies ldquoSolutions for Sustainable Water Savings A Guide to Water Efficiencyrdquo 2007 available at wwwgewatercompdfCapabilities20Brochures_CustAmericasEnglishBulletin1040enpdf
19
Food Processors
17
Chapter 2 Water Use and Water Waste at Industrial Facilities
Figure 5 Example Water End Uses at an Industrial Facility
Cooling amp Heating
Production Processes
Auxiliary Processes
Indoor Domestic Use
Landscape Irrigation
Treatment
Water Supply
Water in Products Wastewater Stormwater Losses Losses
Beyond these categories of water end use specific industries have processes that demand significant amounts of water For example in the textile industry a typical continuous fabric bleach range machine can consume 11000 gallons of water per hour13
Measuring Facility Water Use Metering and Submetering To gain a better understanding of water use patterns at your facility it is almost always helpful to use water meters Many Lean methods rely on the availability of timely and accurate information on key performance metrics By measuring water use and flows at the facility andor process level it becomes much easier to identify water efficiency opportunities As the saying goes you canrsquot manage what you donrsquot measure There are two types of water meters Source meters measure the amount of water being supplied to the facility while submeters measure usage for specific activities such as cooling towers process use or landscape water use
Water meters can be either portable or fixed on specific equipment Use portable water meters to measure water flows for processes or operations in your facility as part of Lean efforts such as gemba walks value stream mapping and kaizen events (strategies discussed in chapters 3-4) You can strap a hand-held acoustic water meter onto a pipe at a few places where you think there might be excessive water use Compare the water data from the master meter to the water flowing through the pipes in the process to confirm where there are potential water savings opportunities These data can help you develop a water balance (described in chapter 3) See Appendix B for resources to help you determine rates of water use including calculations and unit conversions
13 North Carolina Department of Environment and Natural Resources Water Efficiency Manual for Commercial Industrial and Institutional Facilities May 2009 available at wwwp2paysorgref0100692pdf
18
Chapter 2 Water Use and Water Waste at Industrial Facilities
Figure 6 Portable Water Meter
Source Eno Scientific wwwenoscientificcom
Accurately measuring water use can help you identify areas for targeted reductions and track progress from water-efficiency upgrades Submeters can also help identify leaks and indicate when equipment is malfunctioning In some cases it may also be useful to measure water pressure a drop in pressure can indicate the presence of a leak However especially for smaller facilities it will not necessarily make sense to use meters everywhere Consider using meters when you have a need to closely track data for example before and after a process improvement event on a water-inten-sive process You can use the data provided by the meters to compare water use and see how your efforts have improved your facilityrsquos water efficiency Larger facilities can also integrate meters into centralized building management systems making it easy to electronically track water usage gener-ate reports and trigger alerts when leaks or anomalies are found For additional advice on when to use water meters consult your local water utility or the resources in Appendix A
Installing the correct meter and ensuring it functions properly are critical to accurate water measurement There are many types and sizes of meters intended for different uses so it is impor-tant to choose the correct one Improper sizing or type of meter can cause problems For example
14 Smith Timothy A Plumbing Systems and Design Water-Meter Selection and Sizing 2008 wwwpark-usacomhomeaspxelid=71amparl=108
19
Chapter 2 Water Use and Water Waste at Industrial Facilities
an undersized water meter can cause excessive pressure loss reduced flow and noise Oversized me-ters are not economical and do not accurately measure minimal flow rates14 It is also important to ensure that water meters are properly calibrated according to the manufacturerrsquos recommendation and that appropriate maintenance practices are followed on metering equipment Most meters have internal mechanical parts and will begin to under-register the amount of water used as the meter gets older and the mechanical parts wear down When abnormal water measurements are detected check the metering equipment to ensure that the results are not due to metering equipment failures
By metering water use at the facility and process levels facility personnel can compile data to inform Lean improvement efforts Here are some practical tips for using water meters as a part of Lean efforts
bull Use flow meters and water quality or cleanliness standards to establish standard work for water usage flow and pressure levels taking into consideration ldquoset pointsrdquo recom-mended by equipment specifications and facility operating procedures These baseline levels give important context of what accounts for ldquonormalrdquo operating parameters against which improvements and new water losses can be assessed
bull Use data that meters provide to determine the appropriate frequency for aggregating and reporting water measures (eg hourly daily or weekly) that best meets your facil-ityrsquos needs
bull Show employees how to read and use water meters as part of Lean activities such as gemba walks value stream mapping and kaizen events so that they can identify water savings opportunities
bull Post water use reduction goals and water usage information on the factory floor on Lean production control boards or in other accessible places to raise awareness of water use and efficiency among employees
bull Track data from water meters over time Portfolio Manager an online building per-formance benchmarking tool available from the ENERGY STAR program can help you track and benchmark water consumption data For more information on the Portfolio Manager see Appendix A
20
Chapter 2 Water Use and Water Waste at Industrial Facilities
Costs of Water Waste As noted in chapter 1 costs associated with water use include more than the direct costs you pay for water supply but also the costs of water as it travels through processes and operations (see Figure 7) Box 7 provides examples of water costs such as energy pollution control regulatory compliance and raw material costs
Figure 7 Costs Associated with Water Use
Costs Associated with Water Use
Price of Incoming Water
Sewer Service Charge
Labor and other costs associated with water processing and treatment
Cost of energy and chemicals needed to process water
The ldquoprice on the water billrdquo
The cost of water use at a facility can be much greater than the amount on the water bill
Estimating the many components of total water cost for a facility can begin with the cost of water purchased from utilities but should also include the cost of steps required to process use and discharge the water These costs can amount to a good deal more than what appears on a utility bill When estimating water costs it is important to consider these and other indirect costs throughout all functions of a facility Be sure to use estimated future rates when assessing water costs in order to project the level of savings that will be possible when improvements are made
21
Chapter 2 Water Use and Water Waste at Industrial Facilities
Common Costs Associated with Water Use (Box 7)
Raw Material Costs
3 Water purchased from utilities marginal costs of purchasing additional wa-ter versus costs of conservation
3 Cost of water treatment filtering and softening before use
3 Costs for chemicals needed to treat and manage water
Energy Costs
3 Cost of energy to heat water
3 Cost of energy to pump water from its source or within the facility itself
3 Energy and labor costs for operating and maintaining water-using equip-ment
Pollution Control Costs
3 Wastewater and stormwater service rates including surcharges
3 Total cost of treating wastewater for disposal including labor energy chemi-cals equipment and residual disposal
3 Marginal costs of increasing effluent treatment capacity when water de-mand increases
Regulatory Compliance Costs
3Labor costs for regulatory compliance activities such as completing permit applications monitoring compliance and reporting wastewater discharges to regulatory agencies
Source Adapted from North Carolina Department of Environment and Natural Resources Water Efficiency Manual for Commercial Industrial and Institutional Facilities May 2009 available at wwwp2paysorgref0100692pdf
Full costs associated with water use often vastly outweigh the direct costs The direct cost of pur-chasing water from a utility may not seem significant enough alone to merit the effort to reduce water use but when the full cost of water is assessed the financial savings can be substantial Table 3 shows an example of the various costs of water in an industrial process In this example the esti-mated savings from implementing improvements using direct water and sewer costs alone is only 56 percent of the estimated savings using the full cost of water The flexible cost savings of conserved water is estimated to be 40 percent of total treatment cost Flexible treatment costs refer to expenses that vary according to the volume of water treated (eg energy used to pump and treat water treat-ment chemicals) fixed costs (eg capital equipment used for treatment) do not typically vary as wastewater throughput changes
Chapter 2 Water Use and Water Waste at Industrial Facilities
Table 3 Costs Associated with Water Used in an Industrial Process
Activity Unit Cost ($1000 Gallons)
City Water Purchase $355
Sewer Rate $399
Deionized using reverse osmosis
Equipment $057
Energy $120
Labor $143
Total deionized water $231
Deionized water (flexible cost) 40 x $231 = $092
Wastewater treatment
Sludge disposal $346
Treatment chemicals $244
Energy $032
Labor $625
Total wastewater treatment $1247
Wastewater treatment (flexible cost) 40 x $1247gallon = $498
Total cost of water $1344
Flexible cost savings of conserved water is estimated to be 40 percent of total treatment cost
Source Adapted from North Carolina Department of Environment and Natural Resources Water Efficiency Manual for CommercialIndustrial and Institutional Facilities May 2009 available at wwwp2paysorgref0100692pdf
22
23
Chapter 2 Water Use and Water Waste at Industrial Facilities
Appendix B contains a Water Cost Calculator that provides a template for calculating common costs associated with water use at industrial facilities It may also be useful to estimate the potential water and dollar savings that would result from implementing water efficiency measures at your facility see Appendix C for some equations that you can use to guide these estimates
In some water-stressed areas industrial facilities may face the possibility of an even greater water-related costmdashthat of lost revenue from the need to curtail production in the event of water supply disruptions Competition for water across residential agricultural industrial and environmental needs during periods of water scarcity may lead local water managers to impose limits on industrial water use Understanding the vulnerability to disruption of local water supplies can be an important consideration when assessing the true costs of water use when expanding or developing new facili-ties
The next chapter discusses strategies for understanding how water is used at your facility and iden-tifying opportunities to reduce water use and improve operations
To Consider
3 What are the primary water end uses at your facility
3 What processes and facility operations use the most water
3 What costs are associated with your facilityrsquos water use What indirect costs may be unaccounted for
Lean and Water Toolkit
25
CHAPTER 3
Finding Water Waste on the Factory Floor
Some of the most substantial reductions in water use can be found right on the factory floor This chapter describes several simple techniques to foster an understanding of where water goes in a facility and where it can be saved including the following
bull Water Gemba Walks bull Developing a Water Balance bull Water Waste and Value Stream Mapping bull Root Cause Analysis
While all of these techniques evaluate aspects of facility water use and can support your Lean efforts each has a different level of detail time and staff investment requiredmdashranging from a facility walk to a multi-day value stream mapping event Consider the level of effort desired before getting started to conduct the most effective analysis for your facilityrsquos needs
Water Gemba Walks A useful way to identify ways to reduce water consumption is a ldquogemba walkrdquo A water gemba walk is an exercise in which employees and managers walk the factory floor together to observe and inventory inefficiencies related to water use Gemba is a Japanese term meaning ldquothe real placerdquo in the context of Lean manufacturing gemba typically refers to the place where work happens (eg factory floor) Water gemba walks enable a team to quickly locate ldquolow-hanging fruitrdquo that save water at a small cost They help facilities to
bull Identify major sources of water loss such as leaks that can be repaired for significant savings
bull Acquire a more complete understanding of the major end uses of water and flows of water in the facility than can be achieved solely by analyzing water utility bills
bull Instill floor managers and workers with the importance of looking for and noticing leaks and inefficiencies helping to create a culture of water efficiency
Before you conduct your gemba walk first determine the purpose and scope of the walk How large an area will the walk cover and how long will it take How long will the team look at certain aspects of plant operations What information or data would equip the team to best see wastes and opportunities Second obtain copies of relevant documents and data including the last year of water utility bills or water consumption logs the floor plan of the facility if available and process diagrams for focus areas Third select the members of the gemba walk team A small team is best with approximately five to seven people constituting an ideal team size Include workers and man-agers familiar with the area outsiders new employees and veterans as well as an EHS representa-
26
Chapter 3 Finding Water Waste on the Factory Floor
tive in order to get a diversity of perspectives A brief training can orient your team to the purpose of a gemba walk and help them feel empowered to spot wastes throughout the walk
Once you have your team assembled use the Steps to Take During a Gemba Walk in Box 8 to find water waste and improvement opportunities at your facility
Steps to Take During a Gemba Walk (Box 8)
1 Identify all water-consuming equipment high-use areas and meterlocations
2Note all water losses evaporative losses and water incorporated in product excessive water pressure and leaks
3Observe shift clean-ups and process changeovers
4Quantify water flow rates and usage
5Note the water quality used in each process step
6Determine water quality needs for each process and quality of wastewater discharged
When employees are engaged and interested in finding wastes and identifying ways to improve water efficiency the benefits of your gemba walk can continue well beyond the exercise itself The training that your employees receive to conduct a gemba walk or other Lean exercises combined with immediate engagement in the exercises themselves can help to create a culture in which em-ployees routinely seek out ways to improve water efficiency
Consider conducting your gemba walk during a time when the facility is shut down as this can be a good time to find unexpected losses You can also collect data during your gemba walk on the nature of the water in use at various steps throughout each process knowing when treated water is necessary and when lower-quality water might be okay will help you identify reuse opportuni-ties later Table 4 Key Areas to Check During a Water Gemba Walk lists several common areas in industrial facilities in which water inefficiencies can be observed during a gemba walk
Chapter 3 Finding Water Waste on the Factory Floor
Table 4 Key Areas to Check During a Water Gemba Walk
Process and Equipment Use bull Cleaning Washing Rinsing bull Metal Finishing bull Painting bull Dyeing and Finishing bull Photo Processing bull Process Water Reuse bull Product Fluming (Water Transport) bull Pretreatmentfiltration systems bull Pump and Conveyor Lubrication bull Water Use in Products
Other Facility Support
bull Floor Washing bull Air Emission Wet Scrubbers bull Building Washing bull QAQC Testing bull Laboratories bull Landscaping and Irrigation bull Dust and Particulate Emission
Control bull Decorative Fountains and Ponds bull Vehicle Washing bull Cooling Water for Air Compres-
sors and Vacuum Pumps bull Hazardous Waste Storage and
Effluent
Cooling and Heating bull Single-Pass Cooling bull Cooling Towers bull Boilers Hot Water Steam Systems bull Air Washers bull Boiler Scrubbers
Sanitary and Domestic Kitchens bull Toilets bull Food Preparation and Cleaning bull Faucets bull Dishwashers bull Urinals bull Ice Machines bull Showers bull Faucets bull Wash-up Basins bull Food Disposals
Source Adapted from North Carolina Department of Environment and Natural Resources Water Efficiency Manual for Commercial Industrial and Institutional Facilities May 2009 available at wwwp2paysorgref0100692pdf
Leak detection during a gemba walk can be one of the best low-cost high-yield steps for reduc-ing water waste in a facility Leaks exist in all facilities and can result in water loss ranging from a fraction of a percent of a facilityrsquos total water use all the way up to a substantial portion Low water pressure dirty water and a high quantity of water that cannot be accounted for are all signs of a leak Bluing tablets or dyes can be used to easily check for leaks in tanks toilets or other water holding vessels Sonic or acoustic leak detection equipment can be used to check for leaks in under-ground pipes A simple drip gauge can help you conduct a basic estimate of how much water is lost due to a leak Many leaks can be repaired with simple measures such as tightening or replacing fit-tings15 In some cases it may be best to enlist the services of a professional leak-detection company to identify more complex leaks
15 North Carolina Department of Environment and Natural Resources Water Efficiency Manual for Commercial Industrial and Institutional Facilities May 2009 available at wwwp2paysorgref0100692pdf
27
28
Chapter 3 Finding Water Waste on the Factory Floor
Box 9 lists some examples of successful gemba walk and leak detection efforts
Examples of Water Gemba Walk Success (Box 9)
3Kirtland Air Force Base performed leak-detection gemba walks in which teams walked water lines with acoustic listening devices to find leaks sur-veying 90 percent of water distribution lines on the base The teams found that 31 leaks were dripping away nearly 16 percent of the basersquos water at a rate of 333 gallons lost per minute Repairs after the survey saved over 179 million gallons per year
3In one DTE Energy plant water pressure on the upper floors of the building was problematically low Observations on the factory floor revealed that an open valve on a new water treatment system was responsible for the low water pressure By installing a $3000 variable valve the company saved half a million dollars that it would have spent on a booster pump
3Del Monte Foods used a water gemba walk to identify potential water sav-ings in a recirculation line that was forked from eight inches to two four-inch pipes By combining the freshwater line with the main line the facility was able to save 300000 gallons per day
Sources US Department of Energy Federal Energy Management Program ldquoDistribution System Audits Leak Detec-tion and Repair Kirtland Air Force Base ndash Leak Detection and Repair Programrdquo 2009 information provided by Jason Schulist and Michael Sklar DTE Energy May 2011 and Scott Butler Del Monte Foods ldquoThe Del Monte Production System Lean to Green Integrative Futurerdquo Presentation at Green Six Sigma Summit Presentation May 2009
Developing a Water Balance While a gemba walk will help you identify potential water-savings opportunities developing a water balance will give you a more thorough picture of overall water use at your facility A water balance is a high-level simple assessment of the input and output of water in your facility that can help to identify opportunities for improving water efficiency A water balance might be appropriate for your facility especially if you are just beginning your journey with Lean and water and have not con-ducted a more detailed water audit
A water balance is a chart table or diagram of a facilityrsquos water use that shows the flows of water into and out of each process or operation in the facility It typically includes every water-consuming component on-site and all flows out of the facility A water balance can also include data on the cost of water Figure 8 illustrates the fundamental approach to developing a water balance Water bal-ances can also be developed as part of value stream maps
29
Chapter 3 Finding Water Waste on the Factory Floor
Figure 8 Typical Water Balance Calculation
Input (A)
Process Unit
A B C
Output (C)
A ndash (B+C) = Balance (or discrepancy)
Input is ProcessFacility Water Supply Water Losses (eg to air land and product) Output is Wastewater Discharge
Water Losses (B)
When creating a water balance make note of all water use in the facility and track water flows from the source through all operations at the facility to water losses and outputs including evaporative losses input to products and wastewater discharge All uses of water in a facility should be included in a water balance Common end uses of water are discussed in chapter 2 and include processing and auxiliary processing heating and cooling indoor domestic use and landscape irrigation The water balance should capture all of the flows into and out of each process at the facility and should verify that there is a balance between flows in and flows out Compare the estimated or measured total of end uses with the incoming metered amount Be sure to account for losses such as evaporation as well as wastewater discharge The Simplified Elements of a Water Balance figure (Figure 9) below shows an example of the components of a simple water balance for a facility while Table 5 Example Water Balance Summary presents overview information on water use by process from a water balance
30
Chapter 3 Finding Water Waste on the Factory Floor
Figure 9 Simplified Elements of a Water Balance
Pretreatment 950 gallons
Landscaping
Processing
Cooling Towers
Boilers 50 gallons
50 gallons
Losses
Wastewater
Losses
Wastewater
Water in Products
Stormwater
The process of putting together a water balance helps to capture a baseline of a facilityrsquos current water usage (see Box 10) A water balance will help you identify sources of risk such as leaks and compliance concerns Some companies choose to conduct water balances at varying levels of detail on a regular basis in an effort to locate ways to reduce water use and discover hidden water-savings dividends
Chapter 3 Finding Water Waste on the Factory Floor
Table 5 Example Water Balance Summary
Water Uses Input (GallonsYear)
Output (GallonsYear)
Loss (as a of Water Use)
Cooling tower make-up and boiler make-up
8484000 8248000 236000 (28)
Process use 6298000 6186000 112000 (18)
Cooling air compres-sors and pumps
7654000 7455000 199000 (26)
Landscaping 1675000 1533000 142000 (85)
General washing sanitation and maintenance
1101000 1095000 6000 (05)
Food preparation dishwasher
624000 613000 11000 (18)
Subtotal 26660000 25130000 1530000 (57)
Total Water Loss 1530000 GallonsYear
A spreadsheet developed by GEMI to help you create a water balance for your facility is available at wwwgemiorgwaterplannercalc-waterbalanceasp
Benefits of compiling a water balance include
bull Ability to identify processes that present the best targets for reducing water use
bull Establishment of baseline water use data from which improvements in efficiency can be benchmarked
bull Creation of a tool with which to compare different water-efficiency improvement strategies
31
32
Chapter 3 Finding Water Waste on the Factory Floor
Information to Collect for a Water Balance (Box 10)
To complete a water balance collect data on the volume of water flows for each process or operation in your facility including
3 Water and sewer bills from the previous one to three years
3 Numbers sizes and locations of water meters
3 Sources of incoming water
3 Diagrams of plumbing and water pipes as well as irrigation schematics
3 List of water-consuming processes
3 Information about unsewered wastewater (wastewater not discharged to municipal sewer systems such as through separate permitted discharges)
An outside expert could be the best option to help conduct a water balance for some facilities Contact your local water utility to ask whether it provides assistance for developing water balances some utilities provide this service (or related services) free of charge In many cases a water bal-ance can make it easy to identify steps to take to improve water efficiency If there is a discrepancy between the input and output of water in your facility that becomes apparent after preparing your water balance you might use that baseline to create a target future state that reduces the discrepan-cy by a set percentage Several of the resources in Appendix A provide information about developing water balances more involved assessments such as water footprints (see Box 11) and audits and benchmarking and tracking tools such as ENERGY STARrsquos Portfolio Manager
More Detailed Water Audits Water Assessments and Water Footprints
In the event that a more detailed assessment of water use and risks is desired an organization could consider conducting a water audit water source vulnerability assessment andor water footprint analysis While the results of these methods can inform the use of Lean to improve facility water efficiency they are typically conducted as stand-alone efforts that can require substantial effort and investment These methods are only described briefly below in this toolkit
bull A water audit typically involves a more comprehensive time-intensive facility-wide effort to as-sess a facilityrsquos water use and efficiency improvement opportunities A water audit may include activities described in this toolkit such as metering and baselining but it typically focuses on the full facility in a discrete brief period (eg during a 1ndash2 week effort) You may choose to follow specific standards when conducting the audits such as those of the American Society of Heating Refrigerating Cooling and Air-Conditioning Engineers
bull A water source vulnerability assessment generally looks outside of the facility at factors that have potential to affect the supply and cost of water that the facility and surrounding commu-nity relies upon This assessment can help a facility determine the risks of water supply disrup-tions or costs fluctuations and identify steps that may help to reduce these risks
33
Chapter 3 Finding Water Waste on the Factory Floor
bull Water footprinting analysis refers to the total volume of fresh water that is used directly and indirectly to run and support the business encompassing both water use within an industrial facility and throughout its supply chain You might consider conducting a water footprint to gain a more complete understanding of the places where water is used inefficiently throughout your supply chainmdashupstream among suppliers and downstream by users of the facilityrsquos output or products While a water footprint can be time-consuming and difficult to prepare it can be helpful in identifying improvement opportunities throughout the supply chain Box 11 provides tips for conducting water footprint analyses while chapter 5 discusses strategies for engaging suppliers to reduce water use and risks
Water Footprinting Tips (Box 11)
What information should water footprint analyses contain
3Track surface and groundwater sources rainwater stored in the soil and polluted water as inputs and outputs from a facility This can help address concerns about water scarcity and use
3 Include the geographical location of water withdrawals and discharges as well as direct and indirect water use
3 Work with suppliers to get data on water inputs and outputs from their operations often this is where the most water is used
3 Consider also estimating your productsrsquo end-use footprint which is any water used by consumers when they use the product
3 Note the scarcity and drought vulnerability of your suppliersmdasha water foot-print can be a valuable tool to identify business risks
3 Present the water footprint information in a clear and compelling manner such as a diagram showing water flows and quantities
For additional guidance on water footprinting see the Water Footprint Network website wwwwaterfootprintorg
Water Waste and Value Stream Mapping Like water balances value stream mapping can be a powerful tool for identifying water waste and savings opportunities Value stream mapping is a Lean method for creating a visual representation of the flows of information and materials across all the activities involved in producing a product for a customer In a value stream mapping event two maps are developed a map of the current state showing key data about existing processes and a future state map showing changes that can be made to reduce waste Value stream maps can be developed at the value-stream level (eg for a product family) or at the process level after your team has selected a process to investigate more closely
34
Chapter 3 Finding Water Waste on the Factory Floor
By adding water data to value stream maps value stream mapping can help you
bull Gain a better understanding of where the greatest water waste occurs
bull Identify areas where improvements can be made to reduce excess water use and other wastes
bull Develop an implementation plan for process improvements to reduce wastes in the value stream prioritizing water efficiency projects alongside other Lean and environ-mental projects
bull Quantify the expected savings from implementing those improvements
bull Create a culture of efficiency as team members from supervisors to floor workers be-come engaged in cutting waste
Adding Water Waste to Value Stream Maps Value stream maps depict all the activities in a value stream or a process along with key metrics that primarily relate to time Incorporating water considerations into a value stream mapping exer-cise is as simple as adding the amount of water used at each step onto the value stream map Figure 10 Adding Water Use to Value Stream Map Process Box shows a process data box with data on the water use by a particular process included Costs associated with the water used by each process or process step could also be added however to be fully representative these costs should include indirect costs such as those for support functions
Figure 10 Adding Water Use to Value Stream Map Process Box
CT = 4 min CO = 45 min Uptime = 61 Water Use = 9K gallonsday
2 people
Plating
Water use per day
35
Chapter 3 Finding Water Waste on the Factory Floor
Figure 11 Value Stream Map Incorporating Water Use Metrics shows an example of a current state value stream map that has been modified (with additions in blue) to include data on the amount of water used at each step Most activities that consume water are tracked in the map however note that this map does not include water loss as a result of leaks and evaporation or other losses that can occur between process steps
Figure 11 Value Stream Map Incorporating Water Use Metrics
Mar
ket F
orec
ast
Tota
l Lea
d Ti
me
= 68
day
sVa
lue
Adde
d Ti
me
= 15
min
Tota
l Wat
er U
se =
59K
gal
Cus
tom
erA
2 pe
ople
CT
= 4
min
CO
= 4
5 m
inU
ptim
e =
61
Wat
er U
se =
30K
gal
Dry
ing
2 pe
ople
Cle
anin
g
CT
= 2
min
CO
= 6
0 m
inU
ptim
e =
74
Wat
er U
se =
10K
gal
3 pe
ople
CT
= 7
min
CO
= 5
0 m
inU
ptim
e =
48
Wat
er U
se =
15K
gal
Rin
sing
I I
I 3
peop
le
Ship
ping
7 m
in4
min
2 m
in
15 d
ays
8 da
ys10
day
s 30
day
s
Prod
uctio
nC
ontr
ol
WK I
5 da
ys
D
I D
30 d
ays
WK
Rec
eivi
ng
CT
= 2
min
CO
= 3
0 m
inU
ptim
e =
93
Plat
ing
5 da
ys
2 m
in
Cus
tom
erB
Su
pplie
r1
Supp
lier
2
Lead
Tim
e
36
Chapter 3 Finding Water Waste on the Factory Floor
Many teams develop value stream maps using sticky notes to represent each step in a process This enables team members to move things around easily and helps them create the most accurate pic-ture of the process possible
To create a visual representation of the areas in the value stream map that use the most water try using different colors of sticky notes for high- and low-water using steps See Figure 12 for an example of the use of sticky notes to create a value stream map with water data added to several of the notes
Figure 12 Process Boxes Showing Water Waste
Another way to show water inputs and outputs associated with your facilityrsquos processes is by drawing lines into and out of each process data box on your value stream map In Figure 13 the red circles show where water and wastewater flows have been identified other waste streams are identified as well See EPArsquos Lean and Chemicals Toolkit for more information on this approach16
16 Value stream mapping is described in chapter 3 of the Lean and Chemicals Toolkit available at httpwwwepagovleanenvironmenttoolkitschemicalsch3htm
37
Chapter 3 Finding Water Waste on the Factory Floor
Figure 13 Water Inputs and Outputs Identified on a Value Stream Map
After creating a current state map your value stream mapping team will create a future state map that envisions ways to eliminate waste in the value stream and identifies areas for future process improvement projects such as kaizen events or just-do-its (described in the next chapter) With water data included on the current state value stream map your team will be able to easily identify opportunities for increased water efficiency and can work together to identify prioritize and develop an implementation plan for improvement projects that can meet both Lean and environmental goals Incorporating water waste into value stream mapping allows water efficiency projects to be combined with and considered together with other operational improvements
The implementation plan is a key product from the value stream mapping event Take care to de-velop an implementation plan that details the steps to carry out the improvements you have identi-fied being sure to assign responsibility for each step of the plan Consult with facility EHS staff and permitting authorities before making any changes that could affect facility emissions or wastewater discharges
For more information on adding environmental metrics to value stream maps see chapter 3 of EPArsquos Lean and Environment Toolkit17
17 Available on the EPA Lean Manufacturing and the Environment website at wwwepagovleanenvironment
38
Chapter 3 Finding Water Waste on the Factory Floor
Root Cause Analysis When you find a water waste in your facility whether during a gemba walk or a value stream map-ping exercise itrsquos important to ask ldquoWhy did this happenrdquo There is a set of Lean tools that can help you answer this question Root cause analysis is the process of identifying a problem and working through possible components to identify the most basic reason why the problem is occurring Once the cause of the problem is identified you can prevent its recurrence Two tools of root cause analy-sis include fishbone diagrams and the ldquo5 whysrdquo approach
Explore water waste yoursquove found in a Fishbone Diagram (also known as an Ishikawa Diagram) which shows potential causes of a problem by grouping causes into major categories to identify the source of inefficiencies To investigate water waste using a fishbone diagram first identify the specific problem you wish to investigate perhaps a spike in water use at the facility or a leaky pipe or valve Write the primary problem you wish to investigate in the head of the diagram usually on the right side The ldquobonesrdquo of the diagram represent groupings of potential causes of the problem common categories include the following
bull Measurements
bull Material
bull Man (or Personnel)
bull Methods
bull Machines
bull Environment
Along each grouping many detailed sub-causes are listed Figure 14 on the next page Fishbone Diagram of Excessive Water Use shows an example of a fishbone diagram that one facility used to assess its water use
Another root cause analysis tool is the ldquo5 whysrdquo technique The approach uses a systematic ques-tionnaire technique to search for root causes of a problem Simply ask ldquoWhyrdquo when considering the primary problem ldquoWhy is excessive water used hererdquo Follow up with additional ldquoWhyrdquo inquiries until you drill down to the root cause of the problem The goal of the exercise is to pursue further until the root of the problem is identified Be aware that there is sometimes more than one cause of a problem
39
Chapter 3 Finding Water Waste on the Factory Floor
Asking Why Five Times (Box 12)
1 Why are we using so much water The parts need to be cleaned before painting
2 Why do the parts need to be cleaned The parts fail quality checks if they arenrsquot cleaned before being painted
3 Why do painted parts fail quality checks The paint doesnrsquot adhere when part surfaces are not prepared properly
4 Why do the surfaces of the part need to be prepared The surfaces get contaminated by oils used in the previous process
5 Why are oils used in the previous process The oils are used to prevent corrosion during storage
Based on an example from Robert B Pojasek ldquoAsking lsquoWhyrsquo Five Timesrdquo Environmental Quality Management (Autumn 2000) 83
Figure 14 Fishbone Diagram of Excessive Water Use
Measurements Material Personnel
Environment Methods Machines
Excessive Water Use
No metrics
Budget baseline
Untreated water
Galvanized piping
Operator understanding
Obsolete article
Operator training
RCM
Notification procedures
Ineffective ventilation
No ventilation
No headers
Plugged pipesdisks
Eroded orifice disks
Failed controllers
Failed valves
Failed probes
Source Schulist Jason Lean Towards Sustainability How to Use Lean and Six Sigma Methods to Drive Your Sustainability Journey DTE Energy 2009
40
Chapter 3 Finding Water Waste on the Factory Floor
Completing a root cause analysis exercise should be a precursor to brainstorming potential solu-tions to water waste problems at your facility By using these tools you can ensure that you address the root cause of the problem first instead of merely treating the symptoms Chapter 4 explains how to take the knowledge about your facilityrsquos water use that you have gained through the tools listed in this chapter and apply that knowledge to reduce water use
To Consider
3 Where are the largest sources of water waste in your facility If you donrsquot know what steps will you take to find out
3 Are there processes or areas at your facility that could use non-potable or lower quality recycled water
3 What resources might be available in your area to help you conduct a water balance or water audit
3 Where in your facility might be a good target for a water-focused value stream mapping activity
41
CHAPTER 4
Lean and Water Efficiency Improvement Strategies
After yoursquove taken the important first steps to understand how your facility uses water there are a number of ways to reduce your water use through Lean and water efficiency efforts This chapter describes the following
bull Kaizen Events and Just-Do-Its to Reduce Water Use bull Integrate Water Efficiency into Everyday Lean Practices bull Lean and Water Applications for Facility Operations and Support Processes
Kaizen Events and Just-Do-Its to Reduce Water Use There are three key questions to ask to identify water-efficiency opportunities
Key Water-Efficiency Questions (Box 13)
3 Can we stop or prevent water losses (eg leaks)
3 Can we reduce water use (eg changing equipment plumbing processes andor behaviors)
3 Can we recycle or reuse water for another purpose (eg recirculating water within a process reusing process water for another application capturing rainwater etc)
Leanrsquos implementation-based methods of kaizen events and just-do-its are powerful strategies for putting water efficiency into practicemdashjust-do-its for easy changes and kaizen events for more in-volved projects A kaizen eventmdashalso known as a rapid process improvement eventmdashis a 2ndash5 day period when a cross-functional team examines a process and makes rapid changes to improve it
Before initiating significant process changes remember to consult with your local utility or environmental agency to make sure that all facility permitting requirements are met EHS staff at your facility can provide guidance on which changes may trigger regulatory or worker health and safety issues
42
Chapter 4 Lean and Water Efficiency Improvement Strategies
Water Kaizen Event Examples (Box 14)
GE conducted week-long water kaizen events at three of its largest water-consuming sites in 2009 including monitoring and assessing water use facility-wide and developing water-reduction projects with associated financial benefits
3 These kaizen efforts combined with flow monitoring and water-conservation efforts at the largest water-consuming site helped GE reduce water use 30 percent from 153 billion gallons in 2006 to 107 billion gallons in 2009
Through an environment health amp safety kaizen event at one site United Technologies Corporation eliminated 40000 gallons of wastewater per year and saved $50000 per year by changing how the facility managed test cells an underground storage tank and its waste streams
3 The facility no longer sends water to the storage tank and waste fluids from the process (eg oils) are collected separately to allow for reuse recycling or reclamation
3 These efforts are expected to further reduce wastes up to a total savings of 75000 gallons and $150000 per year
GE ldquoEcomagination 2009 Annual Reportrdquo pp 16-17 httpgeecomaginationcomreporthtml World Business Council for Sustainable Development (WBCSD) ldquoEco-efficiency Gains Ground United Technologies Corporation (UTC)rdquo WBCSD Case Study August 10005 available from wwwwbcsdorg
Two types of kaizen events to reduce water use include
bull Water Kaizen Events Consider conducting some kaizen events that are specifically designed to find and implement water efficiency opportunities (see Box 14 for examples) Good places to target include processes or areas of facility operations that use significant amounts of water Some companies such as GE use kaizen events to look for water-efficiency opportunities across a single facility Water balances and value stream maps with water data can provide good ideas for where to focus water kaizen implementation activities
bull Kaizen Events on Water-Using Processes Even if the main objective of a kaizen event is not water efficiency itrsquos helpful to keep an eye out for water-efficiency opportunities There may be opportunities to reduce water use such as by adjusting equipment or reusing water while also improving other aspects of the process Use the Key Water-Efficiency Questions in Box 13 above to identify water-savings opportunities
Often when yoursquore looking for water waste perhaps while using strategies described in the last chapter yoursquoll find easy solutions that can be implemented right away These are good things to address with ldquojust-do-itrdquo Lean activities Just-do-its or ldquoquick winsrdquo are actions that individuals can take immediately to improve a process or operation Many actions to stop water losses (such as fixing leaks or shutting off water that shouldnrsquot be running) or simple equipment adjustments to conserve water (such as reducing water flow) fall in this category
43
Chapter 4 Lean and Water Efficiency Improvement Strategies
Water Efficiency Strategies Ways to reduce water use range from simple strategies such as adjusting the flow of water or install-ing water-saving devices on equipment to more involved options such as reusing water or changing to a low-water or waterless process There are five general types of water-saving strategies (see Fig-ure 15) Consider these strategies as you brainstorm improvement ideas in kaizen events and other Lean efforts Key things to keep in mind include
bull Consider water efficiency improvements in the context of other process improvements and Lean performance goals in order to get the best results
bull Evaluate how the process changes might affect wastewater volume or quality or have other environmental impacts (For example switching from a water-based lubricant to an oil-based lubricant or solvent could have implications for worker health andor the environment)
bull Consider which water-efficiency best management practices and technologies make sense for your facility
bull Adopt visual controls ldquomistake proofrdquo devices on equipment (eg automatic shut offs) andor procedures to help ensure that process changes are effective and can be easily maintained
bull After testing potential solutions making changes and evaluating actual performance be sure to develop or update the standard work for the activity so that workers can eas-ily identify the current best way to perform an activity (Standard work is also further discussed below)
Figure 15 Five Water-Savings Strategies
Mor
e D
ifficu
ltBi
gger
Impa
ct 3 Adjust water flow
3 Modify existing equipment or install water-saving devices
3 Change to more water-efficient equipment
3 Reuse or recycle water (treat if needed)
3 Shift to a low-water or waterless process
When evaluating water reuse opportunities itrsquos important to consider both water quality and water quantity Not all processes need the cleanest highest-quality water In many cases you may be able to reuse the ldquowasterdquo water from one process or operation as an input to another process or for another use at your facility (eg air handling condensate reverse osmosis reject water etc) as long as you match the quality of water needed for its intended use You may need to do some testing
Chapter 4 Lean and Water Efficiency Improvement Strategies
and additional treatment of the process water to make sure it is acceptable for the next use When evaluating the feasibility of using process water for irrigation or other outdoor uses check with your local utility or water pollution control agency about restrictions on water reuse applica-tions The water may require testing to ensure it meets pollutant limits
Waterless Cleaning of GatoraderegBottles (Box 15)
PepsiCo switched from cleaning Gatoradereg bottles with water to a new method of cleaning with purified air The new cleaning process works so well that it is being adopted by bottling facilities around the world achieving a 20 percent reduction in water consumption throughout the process and saving billions of gallons of water
You can use the Table for Evaluating Water Reuse Potential below as a simple guide to identify possible ways to reuse water to meet the water quality and quantity needs of processes You may also want to consider using reclaimed municipal water or water from another facility for certain uses For more information on water reuse strategies consult EPArsquos Guidelines for Water Reuse (wwwepagovnrmrlpubs625r04108625r04108pdf)
Table 6 Table for Evaluating Water Reuse Potential
Process Operation
Water Need Water Discharge
Volume Quality Volume Quality
Cooling
Boilers
Restrooms
Kitchen
Landscape
Process A
Process B
Process C
It may be possible for your facilityrsquos water to be reused by another industry or business Look for these potentially symbiotic relationships with other facilities in order to stretch the value of your water even further for the community
44
45
Chapter 4 Lean and Water Efficiency Improvement Strategies
Integrate Water Efficiency into Everyday Lean Practices A variety of Lean toolsmdashincluding standard work visual controls 5S and total productive main-tenance (TPM)mdashhelp workers identify and eliminate waste in their daily activities as described further below Along with other wastes these Lean tools can reinforce and promote strategies to reduce unnecessary water use
Waste Elimination Culture You can integrate water efficiency into the ldquoculture of Leanrdquo at your facility developing the capac-ity of your employees to identify water waste in their normal work practices and find solutions that help meet your facilityrsquos Lean and water goals When your workers are passionate about improving the way your facility uses water the gains you achieve can become self-sustaining into the future
Lean is built around the framework of eliminating waste and striving for perfection or ldquoTrue Northrdquo as discussed in chapter 1 It is most successful when employees are fully engaged in driv-ing out waste and identifying improvement opportunities In the long run developing people to be effective problem solvers is more important than implementing specific tools It is critical therefore to train employees on how to identify water waste and to encourage and motivate them to work towards your organizationrsquos water efficiency goals The use of goals or targets combined with incentives and support resources can be a powerful way to drive change and performance improve-ment Frito-Layrsquos ldquoGallon per Pound Challengerdquo Program described in Box 16 provides an example of a successful water efficiency program anchored by metrics and employee engagement
Figure 16 Sign to Encourage Water Conservation
46
Chapter 4 Lean and Water Efficiency Improvement Strategies
Frito-Lay Engaging Employees in Water Efficiency (Box 16)
Frito-Layrsquos ldquoGallon per Pound Challengerdquo established a water efficiency pro-gram for all manufacturing sites to exceed 95 percent water use efficiency The program creates a culture of conservation through awareness trainingand accountability
3Through mid-year 2007 the sitesrsquo collective water efficiency has improved to over 80 percent which translates to a reduction in water use of over 1 billion gallons per year
3 Achieving the goal of 95 percent minimum efficiency for all sites will result in an additional water savings of approximately 800 million gallons per year
3 Frito-Lay earned a 2007 Water Efficiency Leader Award from EPA for these water-efficiency efforts
The Challenge is anchored by a water efficiency scorecard which is emailed to a wide array of stakeholders monthly
3Water efficiency is calculated by dividing standard water consumption by the actual water consumption reported by the site If a site uses more water than the standard an efficiency score of less than 100 percent will result
3The scorecard includes monetary savings opportunities for sites operating below 100 percent efficiency as well as savings associated with improve-ments
3Periodically a ldquodid you knowrdquo section with best practices is distributed with the scorecard to help raise awareness
Frito-Layrsquos utility wall program involves an event held at each site each day where a cross-functional team of technicians and workers gather to compare actual water consumption over the prior 24-hours to standard consumption and the sitersquos goals
3Utility walls enable teams to identify excessive water use and develop ac-tion plans to find and correct sources of variance
3Teams identify areas where flow measurement and control devices can drive conservation and ensure that viable water-efficiency projects are com-pleted and working optimally
Standard Work Standard work refers to an agreed-upon set of work procedures (sometimes referred to as standard operating procedures) that establish the best and most reliable method of performing a task or operation Standard work helps sustain previous Lean improvements as well as serves as the founda-tion for future continuous improvement (kaizen) efforts Incorporating water-efficient practices into
47
Chapter 4 Lean and Water Efficiency Improvement Strategies
standard work for processes helps to make them common practice
Whenever you change operational practices to reduce water use or install new equipment that requires different operations be sure to update the standard work for those operations Water-efficiency strategies include both behavior changes and technological changes but even technology-based changes may involve a behavior component For example workers need to properly operate and maintain new water-efficient equipment Use standard work to reinforce desired behaviors
Visual Controls Often used as part of standard work visual controls support standardized procedures and display the status of an activity so every employee can see it and take appropriate action Visual controls make it easier to perform actions the correct way and notice when there are problems
Visual controls are essential for supporting behavior-based water Figure 17 Dual Flush efficiency strategies Examples of visual controls to encourage Toilet Visual Control water efficiency include
bull Signs to encourage employees to use less water
bull Placards on water-using equipment showing proper operation (eg could include optimum water flow level)
bull Water meters or sub-meters on high water using processes or equipment (see discussion in chapter 3)
bull Displays of facility water use and water-use reduc-tion goals on production control boards along with other performance metrics (cost quality timesafety environmental etc)
5S Another way to incorporate water efficiency into Lean is through 5S 5S is a systematic five-step pro-cess used to create and maintain a clean orderly work environment Many organizations add a sixth ldquoSrdquo for safety creating 6S (5S + Safety) The six pillars of 6S consist of
bull Safety (Respect workplace and employee) Create a safe place to work by removing workplace hazards
bull Sort (Get rid of it) Separate items that are not needed in the work area
bull Set in order (Organize) Organize the items that remain in the work area
bull Shine (Clean and solve) Clean and inspect equipment and the work area
48
Chapter 4 Lean and Water Efficiency Improvement Strategies
bull Standardize (Make consistent) Standardize cleaning inspection and safety practices
bull Sustain (Keep it up) Maintain a clean orderly and safe work area
Figure 18 Six Pillars of 6S (5S + Safety)
Source Adapted from Productivity Press Development Team 5S for Operators 5 Pillars of the Visual Workplace Productivity Press 1996
49
Chapter 4 Lean and Water Efficiency Improvement Strategies
One key step that is relevant to reducing water use is ldquoShinerdquo since water is often used in cleaning and rinsing Many industrial and manufacturing businesses use large amounts of water to flush lines rinse parts and tanks and clean equipment floors and other areas These cleaning and rins-ing practices often are large sources of wasteful water use and therefore opportunities for water savings Educate employees on how to do the ldquoShinerdquo step using less water considering some of the Water-Efficient Cleaning Strategies in Box 17 below
Since employees work attentively to maintain a clean and neat work environment in 5S it presents a good opportunity to spot water waste In daily 5S shop floor sweeps encourage employees to check for water leaks in pipes hoses plumbing fixtures and equipment as well as turn off water that shouldnrsquot be running Add checking for leaks to 5S checklists and other approaches implemented under ldquoStandardizerdquo and ldquoSustainrdquo steps so it becomes standard practice
Water considerations are also relevant to ldquoSafetyrdquo Preventing water from being on the shop floor and walkways can eliminate slipping hazards Repairing hot water and steam leaks can prevent burns
Water-Efficient Cleaning Strategies (Box 17)
Dry Clean-up First
3Use brooms brushes squeegees andor other tools to remove materi-als and debris in dry form before using water for secondary cleaning (This saves water reduces wastewater and enables recovery of process materi-als)
Eliminate Unnecessary Water Use for Floor Washing
3 Sweep or use a water broom instead of hosing floors
3 Spot mop if necessary
ldquoMistake-Proofrdquo Your Equipment
3 Use hoses that have automatic shut-off nozzles
3 Use efficient spray nozzles high-pressure washers andor flow restrictors to clean efficiently while reducing water use (High-pressure low-volume sprays generally work better than low-pressure high-volume sprays)
Use Efficient Spray Washing and Rinsing Techniques
3 Use water wisely and turn off water when not in use
3 Do not use a hose as a broom doing so wastes time water and energy
3 Optimize spray and rinsing techniques and document the best practices in the standard work for the process
For more suggestions see North Carolina Department of Environment and Natural Resources ldquoWater Efficiency Manual for Commercial Industrial and Institutional Facilitiesrdquo May 2009 wwwp2paysorgref0100692pdf
50
Chapter 4 Lean and Water Efficiency Improvement Strategies
Total Productive Maintenance As a key strategy for finding and preventing water losses as well as other equipment failures Total Productive Maintenance (TPM) is also relevant to water efficiency TPM is a Lean method that focuses on optimizing the effectiveness of manufacturing equipment TPM focuses on team-based maintenance that involves employees at every level and function
A key practice in TPM is to maintain equipment in a manner that enables workers to quickly iden-tify and correct problems that may result in leaks or spills Since many facility operations use water not just production processes itrsquos important to extend the preventative maintenance practices of TPM to non-production areas (eg restrooms and irrigation) when looking for water issues Box 18 outlines Proactive Maintenance Tips to Reduce Water Use that can be incorporated into a TPM program For more tips and suggestions see EPArsquos ldquoWaterSense at Work Best Management Practices for Commercial and Institutional Facilitiesrdquo available at wwwepagovwatersense
Proactive Maintenance Tips to Reduce Water Use (Box 18)
3Adopt a user-friendly system for reporting water leaks and fix leaksimmediately
3Inspect hot and cold water lines steam lines and traps water-using equip-ment and plumbing fixtures routinely to identify potential problems and keep them operating properly
3When performing maintenance on water-using equipment replace worn parts and check to make sure that water-saving features (eg automatic shut-off valves) are operating properly
3Shut off water supply to equipment in areas that are not in use
Lean and Water Applications for Facility Operations and Support Processes As noted earlier the most water-consuming aspects of your facility may not be production pro-cesses other facility water uses include cooling towers (which are often the largest water end use) boilers support processes restrooms kitchens and irrigation Water balances value stream maps and other strategies in chapter 3 describe how to identify the largest sources of water waste at your facility These represent good targets for kaizen events to reduce water use Consider the Questions to Identify Water-Savings Opportunities in Facility Operations and Support Processes in Box 19 to identify initial opportunities
51
Chapter 4 Lean and Water Efficiency Improvement Strategies
Questions to Identify Water-Savings Opportunities in FacilityOperations and Support Processes (Box 19)
Cleaning
3Can process cleaning or facility cleaning be accomplished without using water (ie using pressurized air to clean products or containers sweeping debris off the floor)
Process Equipment
3Can process equipment reuse water (closed loop) or use reclaimed water from other parts of the facility
Cooling and Heating
3 Has your facility replaced once-through cooling systems with a multi-pass cooling tower or closed systems
3 Can you optimize the blow-downbleed-off controls on boilers and cooling towers
3 Have you considered switching to air-cooled equipment instead of water-cooled equipment
3 Does your facility reuse condensate water
Restrooms and Kitchens
3 Do restrooms have water-efficient fixtures (eg WaterSense labeled toilets and urinals faucet aerators and showerheads)
3 Do kitchens use new water- and energy-efficient dishwashers (eg ENERGY STAR qualified models)
Landscaping and Irrigation
3 Has your facility designed its landscape to consider the local climate and grouped plans by similar watering needs
3 Does your facility use drip irrigation low-flow sprinklers and optimized watering schedules to minimize water use
Leaks
3Have you identified and repaired leaks throughout your facility
Appendix D Water Efficiency Opportunity Checklist is a more extensive checklist for identifying water-savings opportunities throughout your facility
52
Chapter 4 Lean and Water Efficiency Improvement Strategies
Along with the questions in Box 19 and Appendix D a wide array of resources are available that provide information on low-cost water-efficiency measures for common components of facility operations as well as resources that provide guidance and examples relevant to specific industries Consider these water-efficiency strategies in your Lean improvement projects Examples of resources with guidance for specific operations andor industries include
bull ldquoWater Efficiency Manual for Commercial Industrial and Institutional Facilitiesrdquo by the North Carolina Department of Environment and Natural Resources httpsavewaterncorgbushomephp
bull ldquoWaterSmart Guidebookrdquo by the East Bay Municipal Utility District of Oakland California wwwebmudcomfor-customersconservation-rebates-and-services commercialwatersmart-guidebook
bull ldquoWaterSense at Work Best Management Practices for Commercial and Institutional Facilitiesrdquo by EPA Office of Water wwwepagovwatersense
bull ldquoFacility Managerrsquos Guide to Water Managementrdquo by the Arizona Municipal Water Users Association amwuaorgpdfsfacility_managers_guidepdf
See Appendix A for details about these and other water efficiency resources
To Consider
3 What just-do-it actions can you identify to reduce water use
3 What processes or operations would you consider for kaizen events fo-cused on water efficiency
3 What water-reuse options might there be at your facility What steps will you take to learn more about those opportunities
3 What ideas do you have for adding water-efficiency practices into everyday Lean practices (eg through Lean training use of metrics incentive pro-grams standard work visual controls 5S TPM on water-using equipment or other means)
3 What other ideas do you have for reducing water use with Lean or other process improvement efforts
53
CHAPTER 5
Lean and Water Beyond the Factory Floor
Looking beyond your facility operationsmdashsuch as your supply chain interactions with your com-munity and how you design productsmdashcan allow you to uncover new ways to reduce water use and risks while adding value and improving business operating conditions and market opportunities This chapter examines
bull Lean and Water Efforts in Your Supply Chain bull Engaging with the Community bull Lean Product Design
Lean and Water Efforts in Your Supply Chain Depending on your industry sector the greatest opportunities for water use reduction may be in your supply chain rather than your facilityrsquos own operations As discussed in chapter 1 compa-nies whose suppliers have water-intensive operations may feel pressures from customers or other stakeholders to reduce water use within their supply chain It is important for your business to understand water use and risks throughout the value chainmdashincluding upstream in supplier opera-tions and downstream in customer activities In particular the water needed to extract and process raw materials may be significant in some sectors while other stages such as product-use are more important for others
Some water impacts in the supply chain can be addressed by engaging your suppliers in your Lean and water efforts The techniques in this toolkit can be applied at both large and small companies Here are some ideas to get started
bull Ask suppliers about their water use and their water efficiency efforts
bull Invite customers andor suppliers to participate in a Lean and water value stream map-ping event water gemba walk or water kaizen event at your facility to learn from your experience and share their perspectives
bull Offer to participate in your customerrsquos andor supplierrsquos Lean events if your business has relevant expertise
bull Share training materials yoursquove developed best practices and success stories of your Lean and water efforts to educate suppliers on these efforts
bull Invite suppliers to participate in training sessions with your employees For example the furniture manufacturer Steelcase invites its suppliers to attend workshops covering Lean and environment topics at its ldquoSteelcase Universityrdquo
54
Chapter 5 Lean and Water Beyond the Factory Floor
bull Start a dialog with your suppliers about Lean and water projects to initiate together
bull Encourage suppliers to develop and share short- and long-term water reduction goals and report progress against the goals
bull Provide incentives recognition andor financial support for suppliers to conduct Lean and environmental improvement efforts andor for suppliers that help you meet your water efficiency goals
bull Consider focusing first on suppliers that are located in water-scarce areas where reduc-ing water consumption can have the greatest positive impact on community relations
For some smaller companies working with your supply chain may be more challenging than is the case for larger companies One option for smaller facilities is to inform your suppliers that they may access resources available through local utilities such as technology rebates or free or subsidized water audits
Dubois Chemical and Steelcase An Innovative LeanWater Supplier Partnership (Box 20)
Furniture manufacturer Steelcase worked with Dubois Chemical on a demon-stration project exploring an alternative pretreatment washing process on one of Steelcasersquos finishing lines
3The team analyzed the total cost of ownership (for energy labor watersew-age and process chemicals) in the current and future state process maps and relied on water recycling and other strategies to save time energy water and chemicals
Due to the projectrsquos success Steelcase has deployed it on seven powder coat-ing lines Results include
3 Saved $1 million per year
3 Eliminated phosphates from pretreatment discharge
3 Met 2007 emergency water-reduction requirements in Atlanta
3 Reduced water use by 80 percent chemical volume used by 20-30 percent and waste discharged by 85-95 percent
3 Saved 45 million gallons of water per year Sources SteelcaseDubois info from Mary Ellen Mika and Keith Lane ldquoJoint Case Study Reducing Your Water Foot-printrdquo presentation at 23 September 2008 Corporate Climate Response Conference Mary Ellen Mika et al ldquoE3 and GSN Learning Evolving and Expandingrdquo presentation at 2011 Manufacturing Innovations Conference
55
Chapter 5 Lean and Water Beyond the Factory Floor
Some companies participate in Lean supply chain initiatives that focus on environmental objectives such as water use reduction For example in the US Green Suppliers Network Program Lean ser-vice providers at Manufacturing Extension Partnership centers partner with environmental special-ists to deliver ldquoLean and Cleanrdquo process assessments for companies in the supply chains of larger organizations on a fee-for-service basis (see Box 21) The assessments use value stream mapping with an added focus on environmental metrics and costs to identify opportunities for improvements in resource use Many of the assessments include support for implementation A similar program called E3 (Economy Energy and Environment) incorporates Lean environmental and energy technical assistance and also involves local utilities as partners19 Companies should encourage their suppliers to consult their local water and energy utilities to find rebates or incentives for efficient technologies and process improvements
Green Suppliers Network Lean and Water Successes (Box 21)
Southwire and Pacific Gas amp Electric (PGampE)
3 Southwire a manufacturer of wire and cable products and a key supplier of PGampE participated in a Green Suppliers Network review in 2008 at its Car-rollton Georgia plant
3 Based on the value stream map-based review and the teamrsquos recommenda-tions the facility implemented a water-looping system that recycled water without affecting product quality
3 These efforts cut facility water use by more than 9 million gallons (over 90 percent) and saved more than $70000 annually
McNeil PPC and Johnson amp Johnson
3 McNeil-PPC Inc which manufactures Listerinereg products for Johnson amp Johnson participated in a Green Suppliers Network review project in 2007 with the support of Johnson amp Johnson
3 With value stream mapping the team found that 450 gallons of Listerinereg and 60 gallons of water were wasted per line change
3The team recommended solutions to minimize changeover wastes These recommendations have significantly reduced the amount of water that the facility would otherwise use
3With changes such as reusing water for boilers using flavors instead of water to clean equipment sequencing flavors from light to dark switching to waterless conveyor belts and using closed-loop cooling the facility has cut wastewater discharge by 25-30 percent
Sources Green Suppliers Network wwwgreensuppliersgovresultssuccesshtml and information provided by Char-lie Souders Johnson amp JohnsonMcNeil Consumer Healthcare June 29 2011
19 For more information on the Green Suppliers Network see wwwgreensuppliersgov and for more information on the E3 initiative see wwwepagovgreensupplierse3html
56
Chapter 5 Lean and Water Beyond the Factory Floor
Another way that companies can influence supplier actions is through policies and programs that encourage water efficiency Examples include
bull Procter amp Gamble (PampG) has adopted a Supplier Environmental Sustainability Score-card which produces annual supplier sustainability performance ratings for suppliers based on environmental data and qualitative assessments the suppliers provide which include data on water use Suppliers receive higher ratings for contributing to PampGrsquos environmental initiatives and PampG recognizes suppliers receiving the highest rating in the process20
bull PepsiCo has a Supplier Sustainability Outreach Program in which suppliers regularly submit metrics to track their progress toward short-term and long-term goals in energy water and waste efficiency The program prepares suppliers to join ENERGY STAR which is required for all US-based suppliers Suppliers gain access to PepsiCo resourc-es training tools and an invitation to the Global Environmental Sustainability Sum-mit Fuel electricity and water savings from the program totaled $12 million as of the third quarter of 2010 Forty co-packers and suppliers across 102 manufacturing sites participate and the program continues to expand in the United States and globally
bull Levi Strauss amp Co is adjusting its policies to allow more water recycling and reuse at contract finishing facilitiesmdashit now allows reclaimed water to be used at finishing facilities through onsite treatment internal recycling or from a nearby treatment facil-ity Uses for reclaimed water include landscaping toilets and heating ventilation and cooling systems
bull Wal-Mart provided over 100000 suppliers with a sustainability survey to collect infor-mation about their environmental performance The survey includes questions on the total water use of facilities that produce products for Wal-Mart as well as guidelines for conducting a water footprint and improving water efficiency at facilities Future phases of Wal-Martrsquos ldquoSustainability Indexrdquo project include the development of a database of information on product lifecycles and a tool to help merchants and customers under-stand the sustainability of products21
Consider the following five strategies to promote Lean and water efficiency efforts with your suppli-ers keeping in mind that some of these might be less feasible or applicable for small facilities
bull Require reporting from suppliers Requests for reporting on water use and effi-ciency efforts sends a message to supply chain businesses that the company cares about water It may also help you understand business risks and opportunities to assist suppli-ers in reducing water use or risk Benchmarking of water metrics (eg water intensity
20 For more information about PampGrsquos sustainability work with suppliers see wwwpgcomen_USsustainabilityenvironmental_sus-tainabilityoperations_supplierssupplier_engagementshtml
21 For more information on Wal-Martrsquos Sustainability Index see httpwalmartstorescomSustainability9292aspx
57
Chapter 5 Lean and Water Beyond the Factory Floor
ratios that relate water use to production levels) may be useful to set goals and perfor-mance targets Companies can encourage suppliers to utilize ENERGY STARrsquos Portfolio Manager or other tools to track environmental performance
bull Examine product specifications Evaluate how procurement requirements affect the amount of water required to produce or transport the product to facilities Some com-panies may be able to reduce the water used in their supply chains by changing their sourcing specifications
bull Provide recognition awards andor incentives Recognizing supply-chain water and environmental initiatives can raise awareness of and encourage water use reduc-tion and best-practice sharing among suppliers Stories of water-saving efforts may also be of interest to customers
bull Consider supplier requirements It may be appropriate to consider water-related performance in the selection of suppliers particularly in water-intensive parts of your supply chain Performance targets or certification requirements (eg ISO 14001) could also be incorporated into procurement requirements or partnership agreements Consider developing sector-specific standards to reduce overall environmental impacts (eg the Business and Institutional Furniture Manufacturersrsquo Association Sustainability Standard)22
bull Provide subsidize or make referrals for technical assistance Companies can provide technical assistance or training on Lean and water approaches to supply chain partners Alternatively encourage participation of supply chain partners in ldquocommuni-ties of practicerdquo to share information on water efficiency and environmental improve-ment opportunities Manufacturing Extension Partnership centers provide support for Lean training and can help you integrate water efficiency considerations into your sup-ply chain Organizations can also make suppliers aware of water efficiency resources and services available from local utilities and other sources
bull Collaborate on joint Lean and water projects Collaborate with your suppliers and or your customers to develop approaches to reduce water use and risks or to capture new market opportunities Consider using the ideas strategies and tools in this toolkit as a starting point for a discussion about Lean and water opportunities to pursue
22 This standard is available at wwwbifmaorgpublicSusFurnStdhtml
58
Chapter 5 Lean and Water Beyond the Factory Floor
Levi Strauss amp Co and the Better Cotton Initiative (Box 22)
Levi Strauss amp Co completed a third-party lifecycle assessment to understand the environmental impact of an iconic product Levirsquosreg 501reg jeans The com-pany discovered that
3 Forty-nine percent of water consumption for Levirsquosreg 501reg jeans occurs in cotton production while another 45 percent occurs after consumers take the products home
3 The remaining water use is divided among fabric production (2 percent) finishing (3 percent) and retail (1 percent)
Recognizing the importance of the cotton production stage Levi Strauss amp Co joined the Better Cotton Initiative (wwwbettercottonorg) in 2008 to change the way it grew cotton
3 The Better Cotton Initiative seeks to make global cotton production better for the people who produce it better for the environment and better for the apparel sectorrsquos future
3 Pilot projects in countries such as Brazil India Mali and Pakistan work to reduce the environmental impacts from cotton production while supporting local economies
3 In Pakistan participating farms cut water use by over 30 percent 117 bil-lion cubic meters of irrigation water in 2010
Source Levi Strauss amp Co ldquoCEO Water Mandate Communication on Progress 2010rdquo wwwlevistrausscomsites
defaultfileslibrarydocument201012lsco-ceo-water-mandate-cop-2010pdf
Engaging with the Community In many cases water stewardship is a key component of a facilityrsquos ability to operate in a communi-ty Depending on where your facility is located your business and the surrounding community may face different types of water resource challengesmdashsuch as water scarcity infrastructure or pollution concerns Especially in water-scarce regions or during droughts people in the community may have an increased interest in what your facility is doing to reduce its impacts on local water resources Indeed community engagement is recognized as a key pillar of water resource management by the United Nations CEO Water Mandate which assists companies in developing and implement-ing sustainable water policies and practices23 Engaging proactively with your community on water conservation can be an effective way to mitigate water-related business risks as well as reduce your organizationrsquos overall water footprint
23 The UN CEO Water Mandate is available at wwwunglobalcompactorgIssuesEnvironmentCEO_Water_Mandate
59
Chapter 5 Lean and Water Beyond the Factory Floor
Two key strategies for effective community engagement include
bull Educate and engage your employees in water-efficiency efforts at your facility and encourage them to adopt similar practices at home (eg check for leaks use efficient appliances and faucets turn off water when not in use etc) Build the capacity of employees to spot water waste and problem solve throughout their daily activities on the job and off
bull Partner with community members and local organizations to conduct projects that improve water use water quality andor water infrastructure resources in the com-munity Consider using Lean methodsmdashsuch as a waste walk kaizen event or even a Lean design eventmdashto rapidly brainstorm and test improvement ideas for projects and include community stakeholders in those efforts
Along with the value of community engagement these strategies can have the benefit of partially or fully ldquooffsettingrdquo impacts the facility may have on local water resources That is a facility can sup-port efforts that replenish the local water supply by at least the amount of water the business uses directly In India PepsiCo has achieved a positive net water balance in this way (see Box 23)
PepsiCorsquos Positive Water Balance Project in India (Box 23)
At its facilities in India PepsiCo achieved a ldquopositive water balancerdquomdashwhere businesses contributed more water to the communities than they consumedmdash in 2009 and 2010
3 Savings of over 3 billion liters of water in 2009 and over 4 billion liters in 2010 have been verified externally by Deloitte LLP
As part of these efforts PepsiCo India has
3 Reduced water usage in manufacturing by 45 percent since 2005
3 Partnered with government agencies and local organizations to increase peoplersquos access to clean water
3 Worked with agricultural universities to promote ldquodirect seedingrdquo of rice paddies which allows seeds to be directly planted into the soil (without the need for a nursery) and avoids the need for flood irrigation (This reduces water use by up to 30 percent)
3 Saved over 5 billion liters of water from 6500 acres of direct-seeded paddy fields
3 In 2010 PepsiCo began working with the Nature Conservancy to explore ways to credibly achieve a positive water impact across its global operations
Source PepsiCo ldquoReplenishing Water Conserving the worldrsquos most precious asset Waterrdquo httppepsicoindiacoin
purposeenvironmental-sustainabilityreplenishing-waterhtml accessed 28 July 2011
60
Chapter 5 Lean and Water Beyond the Factory Floor
Businesses can use Lean tools to engage with communities in collaborative problem solving to achieve social economic and environmental goals such as water efficiency For example DTE Energymdasha Detroit Michigan based electric utilitymdashhas used tools including gemba walks value stream maps and ldquocritical-to-sustainabilityrdquo trees (a modification of ldquocritical-to-qualityrdquo trees) with Detroit area businesses and community members to tackle the following projects
bull Partnered with a non-profit to manage combined sewer overflows by planting thou-sands of trees to reduce the stormwater runoff in Detroit
bull Found a new use for the buffer land around substations as community gardens with thousands of pounds of produce harvested at each substation and donated to food pantries
bull Created a community-supported agriculture business model based on a gemba walk with the community that identified issues such as urban blight meaningful work neighborhood connectivity and healthy living
In areas where water scarcity and drought are issues facilities can engage with communities to share knowledge work toward solutions and build goodwill Here are two examples of companies who engaged in collaborative dialogue with their communities in response to problems with water scarcity in areas where their operations were located
bull Coca-Cola partnered with the United Nations Development Programme and Chinese government representatives to improve water efficiency in response to a severe drought threatening sugarcane growers The first phase will be completed in 2011 and will focus on improving infrastructural facilities that support the farmersrsquo work and life directly such as optimizing irrigation facilities and recycling treated wastewater from sugar plants to improve farm production and water use efficiency This first phase will provide approximately 500 million liters of water to rural residents and directly benefit 100000 rural sugarcane farmers in the region In future phases this collaboration will pursue improvements in water efficiency in business operations and will seek to ease pressure on local water supplies through continuing community water partnerships24
bull The chemical manufacturer Sasol identified water scarcity as a risk to its operations in South Africa and pro-actively approached the problem by organizing a joint dialogue with community stakeholders representatives of water-intensive industries in South Africa government and non-governmental institutions and local research institutions The dialogue promoted cooperation among the stakeholders and between Sasol and its surrounding community as the sharing of knowledge and experiences coalesced toward the formulation of several ideas for collective action toward improved water efficiency25
24 For more information about Coca-Colarsquos work with sugarcane growers in China see wwwthecoca-colacompanycomdynamic bullpress_center201103chinas-sustainable-sugarcane-initiativehtml
25 For more information see httpsasolsdrinvestoreportscomsasol_sdr_2008page_id=141
61
Chapter 5 Lean and Water Beyond the Factory Floor
Lean Product Design Lean design methods are a group of Lean tools and techniques that aim to
bull Design (or redesign) high-quality products that meet customer needs with the least amount of waste (aspects that do not add value) andor
bull Design (or redesign) processes and equipment that add value to products using the least amount of time material and capital resources
Taking a close look at the parts and processes that go into the creation of a product can help you to identify wastes including water waste and improve product quality reduce costs and potentially gain market advantage
Lean product design methods often rely on a set of criteria to evaluate the best alternatives Incor-porating efficient water use as a design criterion for product development can reduce water waste throughout the entire life cycle of the product Consider raw materials synthesis production customer use and the ultimate disposal or recyclingremanufacturing of the product when consid-ering water use
As with other aspects of Lean implementation product design is most effective when it incorporates ldquowhole systemsrdquo thinking focused on eliminating all forms of waste Be sure to consider traditional Lean goals for both the product and the manufacturing process such as product quality customer service cost and time when you incorporate water efficiency into the Lean product design pro-cess Improving water efficiency should not mean lowering the quality of your finished product or decreasing the productivity of your facility Note that sometimes design alternatives that improve water efficiency can present trade-offs in which decreasing water use results in increased en-ergy or chemical use such endeavors may not be worthwhile depending on the overall impacts You can help ensure that your product quality remains high by adhering to product quality design standards such as the US Green Building Councilrsquos LEED standards for buildings26 EPArsquos Water-Sense program standards for certain water-consuming products and appliances27 and sector-specific product standards
There are several Lean tools to help design (or redesign) a product in a way that reduces wastes Some of these tools are described in Table 7 below For more information about these tools and an explanation of which tools to use in various product design stages see chapter 6 of The Lean and Chemicals Toolkit28
26 The US Green Building Councilrsquos Leadership in Energy and Environmental Design (LEED) standards are available at wwwusgbc orgDisplayPageaspxCategoryID=19
27 For more information about the US EPA WaterSense Program see wwwepagovWaterSense 28 Available at wwwepagovleanenvironmenttoolkitschemicals
Chapter 5 Lean and Water Beyond the Factory Floor
Table 7 Methods Used in Lean Design29
Method Description
3P (Production Preparation Process or Pre-Production Planning)
An integrated and highly detailed approach to product andor process development which involves rapidly designing production processes and equipment to ensure capability built-in qual-ity productivity and flow 3P minimizes resource needs such as capital tooling space inventory and time
Design for Lean Six A method for designing processes that support Sigma Lean Six Sigma objectives such as reduced vari-
ability to improve yield reduce waste and accel-erate time-to-market
Design for Manufacturing amp Assembly
A simultaneous engineering process designed to optimize the relationship between design func-tion manufacturability and ease of assembly
Failure Mode amp Effects A design review methodology that focuses on Analysis identifying the potential failure modes of a prod-
uct and subsequently determining ways to miti-gate each risk of failure
Quality Function Deployment andldquoVoice of the Customerrdquo
An overall methodology that begins in the design process and attempts to map the customer-defined expectations and definition of quality into the processes and parameters that will fulfill them It integrates customer interview and market research techniques with internal cross-functional evaluations of the requirements
Value Engineering An organized methodology that identifies and selects the lowest lifecycle cost options in de-sign materials and processes that achieves the desired level of performance reliability and cus-tomer satisfaction It seeks to eliminate unneces-sary costs in the above areas and is often a joint effort with cross-functional internal teams and relevant suppliers
29 For additional information about many of these tools see Mascitelli Ronald The Lean Design Guidebook Technology Perspective Northridge CA 2004 See also EPArsquos webpage on 3P wwwepagovleanthinkingthreephtm
62
Chapter 5 Lean and Water Beyond the Factory Floor
Table 8 lists examples of questions to ask when evaluating product design alternatives to identify ways to reduce water waste during all phases of the product life cycle
Table 8 Questions to Ask During Lean Product Design
Life Cycle Phase Questions to Ask
Sourcing Materials 3 Will raw material production prior to manufacture and Inputs involve intensive use of water
3 Can you switch to materials that require less water in their production or work with suppliers to reduce water use
Production 3 Will water be used to manufacture the product Manufacturing Evaluate all new equipment and modifications
3 What steps can be taken to reduce the amount of water that will be used to manufacture the product (eg switch to water-less processes reuse water etc)
3 How can you design products to reuse water in multiple process steps (eg recovering rinses from cleaning counter-current flow or refiltering water)
Product Distribution 3 How much water will the product require during Use and Disposition use
3 What product design alternatives use less water (eg through reuse systems water-efficient fea-tures etc)
3 What steps can you take to ensure that product performance is maintained as you implement water efficiency improvements
3 How will the product design affect customer water use Can reductions in the product use phase be guaranteed
3 How can the design ensure customers will be satis-fied with product performance even with reduced water use
Some companies report that the ldquoseven waysrdquo method provides a useful means to identify a more diverse creative set of improvement options to address specific water-related needs This method is often used in the Lean design process This method typically involves brainstorming of seven alter-native approaches for addressing a specific improvement opportunity Sometimes teams are encour-
63
64
Chapter 5 Lean and Water Beyond the Factory Floor
aged to look at how similar tasks are accomplished in the natural world to spark creative thinking on alternatives The team then scores the seven alternatives using pre-established weighted criteria to select the preferred solution Consider incorporating water efficiency into these criteria (water used to manufacture andor full life-cycle water use) to ensure that product design alternatives are evaluated according to your Lean and water efficiency goals
Examples of Water Conservation through Product Design (Box 24)
GE used the 3P (Production Preparation Process) Lean strategy to launch a new water-saving product line
3Geospringtrade hybrid water heaters dishwashers and top-loading washing machines are being redesigned from scratch using Lean manufacturing techniques
3Production team members from engineers to technicians now work together in a cross-functional approach that involves everyone from design through production using scaled-down equipment and product mockups to visualize improvements
3This hands-on whole-team approach has allowed employees to make ad-justments in real-time allowing problems to be identified early and produc-ing dramatically simpler designs that cut total product development time
Levi Strauss amp Co examined the design of its popular blue jeans to identify ways to reduce the water used to manufacture the product
3 WaterltLesstrade jeans reduce water consumption by an average of 28 per-cent and up to 96 percent for some new products
3These water savings were accomplished by reducing washing cycles incor-porating ozone processing into washing and removing water from stone washing
3While the production of Levirsquosreg blue jeans like many products uses a sig-nificant amount of water in the supply chain as well as through consumer end use the company made significant progress by addressing water use in the manufacturing process
As described earlier in this chapter there is great potential for water savings throughout a productrsquos supply chain including the acquisition of resources and raw materials as well as the water that customers will use with the product or service However if you are just getting started with Lean consider focusing first on water use within your facility before branching into your supply chain and customer-use considerations
65
Chapter 5 Lean and Water Beyond the Factory Floor
To Consider
3What parts of the extended value chain of your enterprise use the most water If you donrsquot know how will you find out
3Have you talked with any of your suppliers about Lean and environmental improvement efforts
3What opportunities are there to offset water impacts and improve water resources for the local community
3What changes could you make to the design of your products to reduce water wastes
Lean and Water Toolkit
67
CHAPTER 6
Conclusion
This chapter includes the following sections bull Your Lean and Water Journey bull Concluding Thoughts
Your Lean and Water Journey We hope that this toolkit has provided you with practical ideas to leverage Lean methods to identify and eliminate water waste at your facility Learning to see water waste and to identify improvement opportunities using Lean tools will help you to save money and be a better partner to your com-munity by placing less of a burden on local water supply There are many tools and techniques to get started with using Lean to reduce water waste As described in more detail in chapter 1 here are three ways to get started with Lean and water efforts
bull Learn more about how your facility uses water Connect with environment and facilities personnel to discuss opportunities to reduce water waste with Lean Find water waste in your facility using tools like metering and water balances
bull Engage employees in lean and water improvement efforts Involve employees in teams to brainstorm ways to reduce water use encouraging their ideas to innovate improvement opportunities Try out some of the strategies for eliminating water waste that are described in this toolkit
bull Connect Lean and water efforts to sustainable water management strategies Use Lean tools to support a broader corporate water sustainability strategy Identify what the ldquoTrue Northrdquo goals and targets are for water use at your facility and track progress to inspire improvement and creative solutions Look beyond direct operations to engage your customers suppliers and communities
Many of the techniques in this toolkit can help you reduce water waste and identify savings rapidly however it is important to think about the bigger picture of how water is used across your organiza-tion Figure 2 repeated below from chapter 1 illustrates how the tools and techniques described in this toolkit can help you to address water use throughout your value chain
68
Chapter 6 Conclusion
Figure 2 Lean and Water Implementation Strategies
Understand Water Uses and Costs (Chapter 2)
Find Water Waste (Chapter 3)
Improve Operations and Processes with Lean and Water Strategies (Chapter 4)
Extend Lean and Water Efforts Throughout the Value Chain (Chapter 5)
Sourcing Materials and Inputs (Chapter5)
Production Manufacturing (Chapters 3 and 4)
Product Distribution Use and Disposition (Chapter 5)
Concluding Thoughts We hope this toolkit spurs creative thinking and energy within your organization and encourages you to explore these opportunities We aim to periodically release new versions of resources in EPArsquos Lean and Environment Toolkit series while working with partner companies and organizations to explore ways to improve efficiency using Lean We also hope to learn from your experiences using this toolkit Our goal is to refine the techniques presented provide examples and case studies to il-lustrate the possible benefits of these tools and present new techniques as they emerge We wish you success on your Lean and water journey
Your Thoughts on the Toolkit
Now that you have finished this toolkit reflect on what you read by answering these questions
3 What strategies and tools in the toolkit seemed particularly interesting Which ones were most applicable to your facility
3 What steps will you take next to advance Lean and water efforts at your facility
3 What other information and tools would help your organization to achieve your Lean and water goals
69
APPENDICES
Appendix A Water Efficiency Resources and Technical Assistance Providers This appendix describes resources and places to go for more information concerning the following topics
bull Water Conservation and Efficiency Resources bull Technical Assistance Providers
This appendix focuses on resources that are directly applicable to manufacturing and industrial facilities however some resources and tools may have broader relevance and contain information that will be useful to commercial institutional and residential water users as well as industrial water users
Water Efficiency and Conservation Resources At the Crest of a Wave A Proactive Approach to Corporate Water Strategy Pacific Institute wwwpacinstorgreportscrest_of_a_wave Making the case that businesses and industrial facilities must prepare for water trends this guide helps users to design and implement a two-stage water conservation strategy Case studies and success stories include those from companies such as Unilever Nestleacute Toyota General Motors Anheuser-Busch GE Proctor amp Gamble and more The steps presented help corporations to create a comprehensive approach to managing water risks and opportunities
Collecting the Drops A Water Sustainability Plannertrade Global Environmental Management Initiative (GEMI) wwwgemiorgwaterplanner This web-based tool and downloadable document provides step-by-step guidance and resources to help facilities conduct assessments of their water use and impacts on the water supply Facilities can then use this information to develop water sustainability strategies create action plans and take actions to improve water resource management in their operations and community The planner includes case examples of how GEMI member companies have engaged internal and external stake-holders and generated actions to improve water resource management and conservation Modules include
bull Module 1 Facility Water Use and Impact Assessment Program bull Module 2 Water Management Risk Assessment Questionnaire bull Module 3 Case Examples and Links
70
Appendix A Water Efficiency Resources and Technical Assistance Providers
Commercial Institutional and Industrial (CII) Water Users Manufacturing Introduction Alliance for Water Efficiency wwwallianceforwaterefficiencyorgManufacturing_Introductionaspx The Alliance for Water Efficiency Resource Library webpages offer information on CII water use and efficiency opportunities as well as links to the research and information about this end user catego-ry In manufacturing major uses and topics include cooling water process water steam generation and boilers sanitation irrigation food services and housekeeping The resource briefly discusses the need for and value of water audits for facilities and applying the strategies of reduce reuse and recycle for facility water consumption
Connecting the Drops Toward Creative Water Strategies A Water Sustainability Tooltrade GEMI wwwgemiorgwater This tool presents the business case for water efficiency and provides guidance and case studies on water assessment opportunity identification planning and implementation Five core analytic modules comprise a roadmap to help facilities identify specific steps that they can take to reduce their water use
bull Module 1 Water Use Impact and Source Assessment bull Module 2 Business Risk Assessment bull Module 3 Business Opportunity Assessment bull Module 4 Strategic Direction and Goal Setting bull Module 5 Strategy Development and Implementation
Cooling Towers Water Use Washington State Department of Ecology wwwecywagovtreeequipCThtml Cooling towers are a significant area of water use for many facilities and taking steps to assess and reduce water use in cooling towers can substantially lower a facilityrsquos overall water footprint The Washington State Department of Ecologyrsquos Technical Resources for Engineering Efficiency (TREE) Team created this succinct checklist of conservation suggestions questions to ask during a water use evaluation and suggested data to collect to identify opportunities for water savings from cooling towers
ENERGY STAR Portfolio Manager US Department of Energy and US Environmental Protection Agency wwwenergystargovindexcfmc=evaluate_performancebus_portfoliomanager This tool allows users to track and access information about their facilityrsquos water consumption inad-dition to data about energy consumption Water and energy use and cost data can be managed across multiple facilities in a secure online interface The tool allows you to track multiple water meters for each facility identify meters with customized names and key information benchmark your facili-ties relative to past performance monitor costs and share data with others inside or outside of your organization By tracking energy and water metrics across facilities users can identify opportunities for efficiency improvements and can receive EPA recognition for superior performance
71
Appendix A Water Efficiency Resources and Technical Assistance Providers
Facility Managerrsquos Guide to Water Management Arizona Municipal Water Users Association httpamwuaorgpdfsfacility_managers_guidepdf This guide is intended to help commercial industrial and institutional facilities to identify areas to improve water use efficiency within reasonable economic parameters The guide provides a step-by-step resource for creating a water management plan and includes worksheets on topics such as water consumption history and estimated water balances Several water end uses and options for reducing them are discussed including domestic water use cooling and heating systems landscape water uses and kitchen uses The guide provides planning and policy-setting options water man-agement options and guidance for empowering employees to effect changes to reduce water use
Federal Water Efficiency Best Management Practices US Department of Energy www1eereenergygovfempprogramwaterefficiency_bmphtml The Federal Energy Management Program developed Federal Water Efficiency Best Management Practices in response to an Executive Order requiring federal agencies to find cost-effective ways to reduce their water use in coordination with EPArsquos WaterSense Program Toward the goal of reduc-ing industrial landscaping and agricultural volumetric water consumption by 20 percent by 2020 (relative to a 2010 baseline) FEMP provides best practices for water management planning infor-mation and education programs water auditing and leak detection and reducing water in several end uses including
bull Boilers and steam systems bull Cooling towers bull Water-efficient irrigation bull Single-pass cooling equipment bull Toilets urinals faucets and showerheads
GEMI Local Water Tooltrade GEMI wwwgemiorgGEMIInteractiveToolsaspx By spring 2012 GEMI plans to release a new tool the GEMI Local Water Tooltrade which will be an interactive downloadable module that will help companies evaluate specific sites for water impacts and risks in order to devise site-specific sustainable water management strategies This tool is de-signed to complement the Global Water Tool (described below) which can help a company identify and prioritize risks to its competitive position based on the link between its operations and the external water landscape Companies can then employ the Local Water Tool to further evaluate the high water-risk locations and plan actions to manage those risks
Global Water Tool World Business Council for Sustainable Development wwwwbcsdorgpagesedocumentedocumentdetailsaspxid=221ampnosearchcontextkey=true In order for a facility to manage current and future risks related to its water use the Global Water Tool helps users map their water use and assess risks related to their global operations comparing water needs to local conditions The tool helps calculate water consumption and efficiency compar-ing water consumption data through time to help assess improvements and monitor progress
72
Appendix A Water Efficiency Resources and Technical Assistance Providers
Making Every Drop Work Increasing Water Efficiency in Californiarsquos Commercial In-dustrial and Institutional (CII) Sector National Resource Defense Council wwwnrdcorgwatercacii This guide provides practical suggestions for commercial industrial and institutional facilities to increase their water efficiency Both small-scale concrete steps to take and suggested higher-level strategic approaches toward water efficiency are described The guide includes a list and descrip-tions of available technologies for reducing water consumption by a variety of common end uses
Performing a Business or Industry Water Use and Conservation Audit New Hampshire Department of Environmental Services wwwdesstatenhusorganizationcommissionerpipfactsheetsdwgbdocumentsdwgb-26-16pdf This factsheet provides a short set of steps to audit water use in a business or industrial facility analyze feasibility of conservation measures and develop a conservation plan
Solutions for Sustainable Water Savings ndash A Guide to Water Efficiency General Electric Water amp Process Technologies wwwgewatercomwater_efficiencyindexjsp This guide provides a practical framework for site managers corporate officers engineering firms and water saving advocates to develop a water efficiency objective and meet this objective by ap-plying a variety of tools and metrics The manual covers baseline water footprinting identifying efficiency opportunities optimizing implementing and measuring
Waste Not Want Not The Potential for Urban Water Conservation in California Pacific Institute wwwpacinstorgreportsurban_usage This report presents a comprehensive assessment of water use and conservation potential in the state of California including industrial water use as well as commercial institutional and resi-dential It includes benchmarking data on water use for many industry sectors a description of the methodology for estimating cost and water savings from water conservation strategies and informa-tion on cost-effectiveness of various water conservation and efficiency improvements
A Water Conservation Guide for Commercial Industrial and Institutional Users New Mexico Office of the State Engineer wwwosestatenmuswater-infoconservationpdf-manualscii-users-guidepdf This guide presents the business case for water efficiency offers programmatic steps conservation strategies for indoor and outdoor use and process-specific and mechanical systems and illustrates potential opportunities with fifteen individual case studies
Water Efficiency Manual for Commercial Industrial and Institutional Facilities North Carolina Department of Environment and Natural Resources httpsavewaterncorgbushomephp This comprehensive manual provides sound principles of water conservation strategies for conduct-ing a successful water efficiency program auditing tools water management options and examples
73
Appendix A Water Efficiency Resources and Technical Assistance Providers
for three industry-specific processes textiles food and beverage and metal finishing Practical tools in the guide include assessment checklists step-by-step instructions for conducting a successful wa-ter efficiency program and explanations of approaches such as water balancing The manual details water management options for several common end uses including
bull Sanitary and Domestic Uses bull Cooling and Heating bull Boilers bull Kitchen and Food Preparation bull Commercial Laundries bull Cleaning Rinsing and In-process Reuse bull Reuse and Reclamation bull Landscaping
Water Efficient Equipment and Design A Guide for Non-Residential Construction and Development Austin Water Utility Water Conservation Division wwwallianceforwaterefficiencyorgWorkArealinkitaspxLinkIdentifier=idampItemID=1018 Equipment and design practices for the construction of new industrial and commercial facilities help to build lifecycle water savings into the design of these buildings Major renovations to exist-ing facilities as well as new construction should be undertaken with a careful assessment of ways to reduce the facilityrsquos lifetime water use This guide provides general guiding principles to ensure that facilities are constructed to maximize water conservation and efficiency as well as specific steps and guidelines to follow in all steps of design and construction
Water Footprint Manual Water Footprint Network wwwwaterfootprintorgpage=fileshome This guide provides a thorough description of the practice of water footprinting including practical steps for estimating a water footprint and instructions for assessing the difference between a direct and indirect water footprint This comprehensive guide to water footprinting instructs readers on estimating the footprint of a product as well as that of a business
WaterSense at Work Best Management Practices for Commercial and Institutional Fa-cilities US Environmental Protection Agency wwwepagovWaterSense The WaterSense Best Management Practices which EPArsquos Office of Water developed in coordination with the Federal Energy Management Program are a comprehensive set of recommendations and tips for how commercial and institutional facilities can improve their water efficiency EPArsquos Water-Sense Program helps water consumers identify best practices resources and tools to reduce their water use Commercial and institutional water users can take advantage of lists of water-efficient products to install in their facilities best management practices and other ways to improve water efficiency
74
Appendix A Water Efficiency Resources and Technical Assistance Providers
WaterSmart Guidebook East Bay Municipal Utility District Oakland California wwwebmudcomfor-customersconservation-rebates-and-servicescommercial watersmart-guidebook This extensive guidebook provides information on water-saving technologies currently available to commercial industrial and institutional businesses as well as specific water efficiency strategies and tips for different business types such as paper manufacturing and metal finishing Many water-using technologies such as process water are explored to show the areas in which the most water is used and where it can be saved
Technical Assistance Providers
Water Utility Incentive Programs Many utilities and local governments offer incentive programs to water utility customers to encour-age the efficiency of water use in the industrial commercial and institutional sectors Common approaches include a combination of water audits and rebates to help facilities realize water sav-ings Check with your local utility to see what incentives may be available Some notable programs include those sponsored by the following utilities and localities all of which saw significant reduc-tions of water use by facilities that they serve
bull City of Austin and Austin Water Utility wwwciaustintxuswaterconservation
bull Denver Water wwwdenverwaterorgConservationIncentivePrograms
bull East Bay Municipal Utilities District wwwebmudcomfor-customersfor-commercial-customerscommercial-conservation-rebates-and-services
bull Massachusetts Water Resources Authority wwwmwrastatemauscomsupportwaterconservationmainhtm
bull Metropolitan Water District of Southern California httpwwwbewaterwisecomicphtml
bull City of Phoenix phoenixgovwaterserviceswrcindexhtml
bull City of San Jose Environmental Services Department wwwsanjosecagovesdwater-conservationdefaultasp
bull Seattle Public Utilities wwwseattlegovutilServicesWaterFor_Commercial_CustomersWATER-CONS_200311261707523asp
75
Appendix A Water Efficiency Resources and Technical Assistance Providers
National Institute of Standards and Technology Hollings Manufacturing Extension Partnership wwwnistgovmep The National Institute of Standards and Technology (NIST) Hollings Manufacturing Extension Part-nership (MEP) is a network of manufacturing assistance centers that provide Lean manufacturing training Lean event facilitation and other services to small-to-medium sized businesses to make them more competitive Many MEP centers have experience providing integrated Lean and environ-mental services to businesses or have partnerships with environmental agencies to offer Lean and environment services
Pollution Prevention Resource Exchange (P2Rx) Consortium wwwp2rxorg The Pollution Prevention Resource Exchange (P2Rxtrade) is a consortium of regional pollution prevention information centers in the United States funded in part through grants from EPA These centers all provide pollution prevention information networking opportunities and technical assis-tance services to state agencies local governments businesses and technical assistance providers in their region Regional centers and contact information can be found on the P2Rxtrade website along with their collective information resources on Lean water efficiency and other topics
Appendix B Water Cost Calculator You can use this table to calculate costs associated with water use at your facility Write down the appropriate volumes units and unit costs and multiply volume by unit cost to find the dol-lars spent on each cost area Add these costs to find the total cost Note Unit costs for water may varydepending on the season andor based on water use (eg peak surcharges may apply above a certain level)30
Factor
Costs to Consider (Excluding Labor amp Maintenance
Costs)
Examples Description Vo
lum
e
Uni
ts(g
allo
ns)
Uni
t Cos
t ($
per
gal
lon)
Tota
l Cos
t (d
olla
rs)
Sup
ply
Base Purchase Price
Utility (eg 10 cents per gallon)
$ $
Peak Package Demand
(eg additional 1 cent per gallon for water supply over 10000 gallons)
$ $
Pumping costs (if self supplied)
Well-sourced $ $
Purchase of pre-treated water
Deionized dealkylized ultra-pure softened
$ $
Coo
ling
Energy Power to chillers towers etc re-ducing heat load of wastewater prior to release
$ $
Chemical For towers chill-ers coolants
$ $
30 Several resource tracking tools that may also be relevant These include Energy amp Materials Flow amp Cost Tracker from the North-east Waste Management Officialsrsquo Association wwwnewmoaorgpreventionemfact Water Conservation Tracking Tool (for water utilities) from Alliance for Water Efficiency wwwallianceforwaterefficiencyorgTracking-Toolaspx and Portfolio Manager (for energy and water use) from the ENERGY STAR Program wwwenergystargov
Total cost of water use should also include labor associated with operations maintenance accounting and legal associated with all items listed
76
Appendix B Water Cost Calculator
Factor
Costs to Consider (Excluding Labor amp Maintenance
Costs)
Examples Description Vo
lum
e
Uni
ts(g
allo
ns)
Uni
t Cos
t ($
per
gal
lon)
Tota
l Cos
t (d
olla
rs)
Trea
tmen
t(O
nsit
e)
Treatment chemicals
Softening de-alkalyzed
$ $
Filters mem-branes carbon
Purified deionized $ $
Sludge disposal Filtration $ $
Filter disposal Solid waste $ $
Was
tew
ater
Trea
tmen
t
Pretreatment chemicals
Neutralizers flocculants etc
$ $
Pretreatment energy
Evaporation Treatment plant operation
$ $
Sampling and testing kits (consumables)
pH TSS BOD COD
$ $
Was
tew
ater
Dis
posa
l
Sewer rate Utility $ $
Surcharges for pollutant exceeding
$
Permitting Permit renewals $
Septic system maintenance
$ $
Condensate or wastewater disposal if not sewered
$ $
Sludge disposal $ $
Total cost of water use should also include labor associated with operations maintenance accounting and legal associated with all items listed
77
Appendix B Water Cost Calculator
Factor
Costs to Consider (Excluding Labor amp Maintenance
Costs)
Examples Description Vo
lum
e
Uni
ts(g
allo
ns)
Uni
t Cos
t ($
per
gal
lon)
Tota
l Cos
t (d
olla
rs)
sses
Evaporative Cost of make-up water
$ $
Leaks Cost of make-up water
$ $
Treatment or Irrigation or $ $
Lo stormwater vehiclebuilding management washing runoff of runoff from exterior use of supplied water
Production $ $
Oth
er
process water use costs other facility costs
TOTAL $ $
Total cost of water use should also include labor associated with operations maintenance accounting and legal associated with all items listed
See Appendix C ldquoWater Unit Conversions and Calculationsrdquo for guidelines on calculating leak losses
78
Appendix C Water Unit Conversions and Calculations This appendix provides reference material on water unit conversions as well as guidance for esti-mating water use and potential water and cost savings
Water Unit Conversions31
Volume Unit Conversions
Units
Equivalent
Liters (lL)
Gallons (gal)
Cubic Feet (ft3)
Cubic Meters (m3)
Acre-Feet (ac-ft)
Liters 1 02642 3531 x 10-2 00001 8106 x 10-7
Gallons 3785 1 01337 3785 x 10-3 3068 x 10-6
Cubic Feet 2832 7481 1 2832 x 10-3 2296 x 10-5
Cubic Meters 1000 2642 3531 1 8106 x 10-4
Acre-Feet 1233 x 106 3259 x 105 4356 x 104 1233 1
Flow RateDischarge Unit Conversions
Units
Equivalent
Gallons per Minute
(gpm)
Liters per Second (Ls)
Acre-Feet per Day
(ac-ftday)
Cubic Feet per Second
(ft3s)
Cubic Meters per Day
(m3day)
Gallons per Minute
1 6309 x 10-2 4419 x 10-3 2228 x 10-3 545
Liters per Second
1585 1 7005 x 10-2
3351 x 10-2 864
Acre-Feet per Day
2263 1428 1 05042 1234
Cubic Feet per Second
4488 2832 1983 1 2447
Cubic Meters per Day
1369 x 109 864 x 107 6051 x 106 3051 x 106 1
31 GEMI ldquoUnit Conversionsrdquo Collecting the Drops A Water Sustainability PlannerTM available at wwwgemiorgwaterplannerunit-conversionhtm
79
80
Appendix C Water Unit Conversions and Calculations
Calculations and ldquoRules of Thumbrdquo for Estimating Water Use32
Use these guidelines and calculations to estimate water use in your facility The information in this section draws primarily from GEMIrsquos Collecting the Drops A Water Sustainability Plannertrade available at wwwgemiorgwaterplanner
Cooling Tower Usage
Cooling Tower Water Usage Calculations
Tower Evaporation Rate
C x ∆T1000
C = tower recirculation rate in the units of pounds of water
per minute
T = temperature difference across the cooling tower in
degrees Fahrenheit
Cooling Tower Blow Down Rate
[Windage Rate x (Cycles of Concentration -1) -
Tower Evaporation Rate] (1- Cycles of Concentration)
Cycles of Concentration = conductivity or chloride level
in the cooling tower blow-downconductivity or chloride
level in the cooling tower makeup water
bull Windage Loss from Cooling Towers (Water Lost from Friction Between Wind and the Surface of the Water in Cooling Towers)
bull Commonly 01 to 03 of the Recirculation Rate
bull The tower recirculation rate can be obtained from the manufacturerrsquos literature andor head versus flow curve for the pump
Cooling Tower Usage
Boiler Water Usage Calculations
Boiler Make Up Boiler Steam Rate - Condensate Return + Boiler Blow Down
Boiler Blow Down Range of 4 to 8 of Boiler Makeup
Sanitary Water Usage
bull 10ndash25 gallons per person per shift in industrial settings (based on estimates in GEMIrsquos Collecting the Drops A Water Sustainability Plannertrade 2007)
bull The lower value is used where there are just toilets A higher value is used where there are toilets showers and full kitchen services (that is food preparation and dish washing)
32 ldquoCalculationsrdquo and ldquoRules of Thumbrdquo from GEMI Collecting the Drops A Water Sustainability PlannerTM available at wwwgemi orgwaterplannercalculationshtm and wwwgemiorgwaterplannerrules-of-thumbhtm
81
Appendix C Water Unit Conversions and Calculations
bull 20-35 gallons per employee per day for domestic demands (not including kitchens) in commercialindustrial settings (based on estimates in the North Carolina Water Effi-ciency Manual 200933)
bull Savings of 25-35 percent in this domestic usage are readily achievable
Irrigation Usage
bull Number of sprinkler heads x the flow capacity per head (eg 25 gpm x the duration [minutes] of water application)
bull Inspect the irrigation system during operation to determine if there are leaks from broken sprinkler heads and from water distribution lines
Wastewater Streams from Water Treatment Operations
bull Reverse Osmosis Reject Flow
bull Reject stream generally ranges from 10 to 50 of the feed to the system depending on the salinity and the desired purity
bull Reject flow can be higher than the indicated range Reverse osmosis reject streams can be used as cooling tower makeup if the water is softened prior to the reverse osmosis system
Other Uses
bull Slab Washing
bull 5 galmin for each hose
bull 1 dripsecond
bull 10000 Lyear or 2642 galyear
bull Water Flow Estimation
bull Use a bucket and stop watch
Water Losses from Leaks
bull Estimate leaks based on the size of the hole and the water pressure (see Leak Water Loss Guide below) or measure directly using a bucket and stop watch
33 North Carolina Department of Environment and Natural Resources Water Efficiency Manual for Commercial Industrial and Institutional Facilities 2009 available at httpsavewaterncorgbushomephp
82
Appendix C Water Unit Conversions and Calculations
Leak Water Loss Guide (Water Loss in Gallons at 50 PSI)
Leak this Size Loss per Day Loss per Month Loss per Year
bullbull 120 3600 43200
360 10800 129600
693 20790 249480
1200 36000 432000bullbullbull bull 1920 57600 691200
3096 92880 1114560
4296 128880 1546560
6640 199200 2390400bullbullbull 6984 209520 2514240
Source Washington State Department of Health Office of Drinking Water available at wwwdohwagovehpdwwater_usewater_use_efficiencyhtm
Guidelines for Estimating Cost and Water Savings
It can be useful to estimate the potential long-term water and cost savings that will result from implementing water efficiency improvements in your facility This section provides guidelines on producing estimates of these savings after implementing improvements to a process at your facility
83
Appendix C Water Unit Conversions and Calculations
Current Water Use
First to estimate the current water use of an entire process at your facility identify the following information and use Equation 1 below
bull Average volume of water used during a full process or technology cycle
bull This may be provided by the product manufacturer through product literature or the manufacturerrsquos website or by using the guidelines and calculations in the previous section of this Appendix The water efficiency will be dependent upon the flow rate of each process cycle duration of each cycle and the number of cycles If the water use from the full process is not available from the manufacturer sum the water use from each part of cycle to determine the water use from the full process cycle
bull Average number of cycles per day
bull Days of facility operation per year
Water Use after Replacement or Retrofit
To estimate the water use of a more efficient technology or process change use Equation 1 but substitute the average volume of water used during an improved process cycle
Water Savings
To calculate water savings that can be achieved from a technology or process change identify the following information and use Equation 2 below
bull Current water use as calculated using Equation 1
bull Water use after replacement or retrofit as calculated using Equation 1
Equation 1
Water Use of a Technology or Process Cycle (gallonsyear) = Cycle Water Use (gallons) Number of Cycles (per day) Days of Facility Operation (daysyear)
Equation 2
Water Savings (gallonsyear) = Current Water use (gallonsyear) ndash Water Use After Improvements (gallonsyear)
84
Appendix C Water Unit Conversions and Calculations
Payback
To calculate the simple payback from a technology or process change identify the following infor-mation and use Equation 3 below
bull Equipment and installation cost of the replacement or retrofit
bull Water savings as calculated using Equation 2
bull Facility-specific cost of water and wastewater
Return on Investment
To calculate the return on investment of a technology or process change calculate the amount of cost savings as compared to the initial investment using Equation 4
General Calculations and On-Line Calculators
GEMIrsquos Collecting the Drops A Water Sustainability Plannertrade has several on-line and download-able calculators for measuring data related to water use and flows (see wwwgemiorgwaterplanner calculatorsasp) These include
bull Flow rate calculator
bull Friction loss and flow calculator
bull Pump hydraulic horsepower calculator
bull Water balance template and calculator
Equation 3
Payback (years) = Equipment and Installation Cost (dollars) [Water Savings (gallonsyear) Cost of Water and Wastewater (dollarsgallon)]
Equation 4
Return on Investment = [(Water Savings (gallonsyear) Cost of Water and Wastewater (dollarsgallon)] ndash Equipment and Installation Cost (dollars)
Appendix DWater Efficiency Opportunity Checklist
Water Efficiency Opportunity Checklist
FacilityBuilding Date Prepared
Prepared by Reviewed by
Water Efficiency Practice Yes No
1 Organizational Water Efficiency Practices
a Have you set water use reduction goals and targets for your facility
b Are water meters installed on high water using processes and are they working properly
c Do you have easy ways for employees to suggest ideas for water efficiency improvements (eg suggestion boxes)
2 Cooling and Heating
a Has once-through cooling water been eliminated with the use of chillers cooling towers or air-cooled equipment
b Has blow-downbleed-off control on cooling towers and boil-ers been optimized
c Is condensate being reused
d Is treated wastewater (or other sources of water for cooling tower make-up) reused where possible
e Are cycles of concentration for cooling towers maximized through efficient water treatment
f Is a conductivity controller installed on each cooling tower
g Have cooling towers been equipped with overflow alarms
h Are high-efficiency drift eliminators in use
3 Restrooms and Kitchens
a Are water-efficient fixtures installed (eg WaterSense labeled faucets toilets urinals and showerheads) Are there signs on dual-flush toilets showing people how to use them
b Have you installed metered or spring-loaded faucets or fau-cets with sensors
85
Appendix D Water Efficiency Opportunity Checklist
Water Efficiency Practice Yes No
c Have you adjusted plumbing to use the minimum amount of water that is functional
4 Process Use
a Have you installed timers to automatically shut off water flow when water is not required such as at the end of a produc-tion cycle
b Are solenoids and automatic shut-off valves checked regu-larly to ensure that they are working properly
c Is equipment set to the minimum flow rates recommended by the manufacturer
d Have pressure-reducing devices been installed on equipment that does not require high pressure
e Can process equipment reuse water (closed loop) or use reclaimed water from other parts of the facility
f Have you replaced water-based transportation with either waterless techniques or recycled water
g Are signs posted near equipment encouraging employee awareness of water use and discouraging tampering with equipment flow rate
5 Cleaning and Sanitation
a Are all hoses equipped with an automatic shut-off nozzle
b Has process cleaning or facility cleaning been replaced with waterless techniques (ie using pressurized air to clean products or containers sweeping debris off the floor) where possible
c Are improved rinsing techniques used (counter-current systems sequential use from high to lower quality needs conductivity flow controls improved spray nozzlespressure rinsing fog rinsing etc)
d Is spent rinse-water being reclaimed and reused for lower-grade processes or for other facility applications
e Have steps been taken to reduce the water used by steam sterilizers such as jacket and chamber condensate cooling modification
86
Appendix D Water Efficiency Opportunity Checklist
Water Efficiency Practice Yes No
f Are you using detergents that can easily be removed with little water
6 Landscaping and Irrigation
a Are low-flow sprinklers trickledrip irrigation and optimized watering schedules in use
b Are preventive maintenance techniques in place
c Has your facility designed its landscape to consider the local climate and grouped plants by similar watering needs
d Is grass planted only in places where it will provide optimal functional and aesthetic benefits
e Are systems in place to capture and reuse rain water and storm water for landscaping or for other uses (eg cooling tower make-up process water or dust suppression)
7 Leaks
a Are you conducting regular leak inspections
b Are leaky faucets faulty fittings and broken pipes and hoses identified and repaired promptly
c Are employees (including custodial crews) educated and em-powered to identify leaks and point them out for repair
d Is there a user-friendly method to report leaks
8 Comments
9 Recommended Follow-Up Actions34
34 For additional guidance see EPA Office of Water ldquoWaterSense at Work Best Management Practices for Commercial and Institu-tional Facilitiesrdquo wwwepagovwatersense North Carolina Department of Environment and Natural Resources Water Efficiency Manual for Commercial Industrial and Institutional Facilities wwwp2paysorgref0100692pdf East Bay Municipal Utility District of Oakland WaterSmart Guidebook wwwebmudcomfor-customersconservation-rebates-and-servicescommercial watersmart-guidebook and Arizona Municipal Water Users Association Facility Managerrsquos Guide to Water Management http amwuaorgpdfsfacility_managers_guidepdf
87
Appendix E Glossary of Water Terms Most of the definitions provided here are from the Alliance for Water Efficiencyrsquos water glossary available at wwwallianceforwaterefficiencyorgGlossaryaspx That glossary has a more extensive set of water-related terms and abbreviations
B
Best management practice (BMP)
Equipment or behavioral measure(s) established as the most practicable means of increasing water efficiency
Blowdown (or Bleed-off)
Draining off the water in a cooling tower reservoir or boiler to avoid the buildup of excess dissolved solids
E
End use A fixture appliance or other specific object or activity that uses water
M
Makeup water Fresh water introduced into a cooling tower or boiler to replace water lost to evaporation and blowdown
P
Peak use (demand)
The maximum demand occurring in a given period such as hourly or daily or annually Peak use can incur sur-charges above the normal base water cost charged by the utility
R
Reclaimed water Municipal wastewater effluent that is given additional treatment and distributed for reuse in certain applica-tions Also referred to as recycled water
Reverse osmosis A process to remove dissolved solids usually salts from water Salty water is forced through membranes at high pressure producing fresh water and a highly concentrat-ed brine
S
Source meter A meter that measures the quantity of water being sup-plied to a facility
88
89
Appendix E Glossary of Water Terms
Submeter A meter that measures usage for specific activities within a facility such as cooling towers process use or land-scape water use
W
Water audit An on-site survey of facility water use to measure equip-ment and management efficiency and generate recom-mendations to improve efficiency
Water balance A chart table or diagram that tracks water flow through a building or facility showing total inflows and total outflows (eg consumption irrigation evaporation leaks and losses)
Water conservation
1 Any beneficial reduction in the water loss waste or use
2 A reduction in water use accomplished by implemen-tation of water conservation or water-efficiency mea-sures
3 Improved water management practices that reduce or enhance the beneficial use of water
Water efficiency A measure of the amount of water used versus the mini-mum amount required to perform a task In irrigation the amount of water beneficially applied divided by the total water applied
Water footprint An analysis of the total volume of freshwater that is used directly and indirectly to run and support the business or to produce a product encompassing water use within an industrial facility throughout its supply chain and final disposition of the product
Lean and Water Toolkit
United States Environmental Protection Agencywwwepagovlean
October 2011EPA-100-K-11-003