Marshall University Marshall Digital Scholar Faculty Research Marshall Institute for Interdisciplinary Research 4-1-2009 Lean and obese Zucker rats exhibit different paerns of p70s6 kinase regulation in the tibialis anterior muscle in response to high-force muscle contraction Anjaiah Kaa Marshall University, [email protected]Sunil K. Karkala Marshall University Miaozong Wu Marshall University, [email protected]Sarath Meduru Marshall University Devashish H. Desai Marshall University, [email protected]See next page for additional authors Follow this and additional works at: hp://mds.marshall.edu/miir_faculty Part of the Biochemical Phenomena, Metabolism, and Nutrition Commons , and the Musculoskeletal, Neural, and Ocular Physiology Commons is Article is brought to you for free and open access by the Marshall Institute for Interdisciplinary Research at Marshall Digital Scholar. It has been accepted for inclusion in Faculty Research by an authorized administrator of Marshall Digital Scholar. For more information, please contact [email protected]. Recommended Citation Kaa, A., Karkala, S. K., Wu, M., Meduru, S., Desai, D. H., Rice, K. M., & Blough, E. R. (2009). "Lean and obese Zucker rats exhibit different paerns of p70s6 kinase regulation in the tibialis anterior muscle in response to high‐force muscle contraction". Muscle & Nerve, 39(4), 503-511.
Transcript
Marshall UniversityMarshall Digital Scholar
Faculty Research Marshall Institute for Interdisciplinary Research
4-1-2009
Lean and obese Zucker rats exhibit differentpatterns of p70s6 kinase regulation in the tibialisanterior muscle in response to high-force musclecontractionAnjaiah KattaMarshall University, [email protected]
See next page for additional authorsFollow this and additional works at: http://mds.marshall.edu/miir_facultyPart of the Biochemical Phenomena, Metabolism, and Nutrition Commons, and the
Musculoskeletal, Neural, and Ocular Physiology Commons
This Article is brought to you for free and open access by the Marshall Institute for Interdisciplinary Research at Marshall Digital Scholar. It has beenaccepted for inclusion in Faculty Research by an authorized administrator of Marshall Digital Scholar. For more information, please [email protected].
Recommended CitationKatta, A., Karkala, S. K., Wu, M., Meduru, S., Desai, D. H., Rice, K. M., & Blough, E. R. (2009). "Lean and obese Zucker rats exhibitdifferent patterns of p70s6 kinase regulation in the tibialis anterior muscle in response to high‐force muscle contraction". Muscle &Nerve, 39(4), 503-511.
Lean and Obese Zucker Rats Exhibit Different Patterns of
p70S6kinase Regulation in the Tibialis Anterior Muscle in
Response to High Force Muscle Contraction
Anjaiah Katta, MS
1, Sunil K. Karkala, MS
1, Miaozong Wu, PhD
2, Sarath Meduru, MS
2, Devashish H.
Desai1, MS, Keven M. Rice, MS
1,2, and Eric Blough, PhD
1,2,3
1 Department of Pharmacology, Physiology and Toxicology, Marshall University, Joan C. Edwards School of Medicine 2 Cell Differentiation and Development Center, Marshall University 3 Department of Biological Sciences, Marshall University Abstract
Increased phosphorylation of the 70 kDa ribosomal S6 kinase (p70s6k) signaling is strongly correlated with the degree of muscle adaptation following exercise. Here, we compare the phosphorylation of p70s6k, Akt and mTOR in the tibialis anterior (TA) muscles of lean and obese Zucker rats following a bout of eccentric exercise. Exercise increased p70S6k (Thr 389) phosphorylation immediately after (33.3 ± 7.2%) and during recovery [1-hr; (24.0 ± 14.9%), and 3-hr (24.6 ± 11.3%)], in the lean TA and at 3-hr (33.5 ± 8.0%) in the obese TA. mTOR (Ser 2448) phosphorylation was elevated in the lean TA immediately after exercise (96.5 ± 40.3%) but remained unaltered in the obese TA. Exercise increased Akt (Thr 308) and Akt (Ser 473) phosphorylation in the lean but not the obese TA. These results suggest that insulin resistance is associated with alterations in the ability of muscle to activate p p70s6k signaling following an acute bout of exercise.
Type 2 (non-insulin dependent) diabetes mellitus (DM) is an emerging epidemic in Western cultures that is thought to afflict 150 million people worldwide 11. Insulin resistance is frequently accompanied by a variety of metabolic and cardiovascular abnormalities that include hypertension, glucose intolerance, Type 2 diabetes, dyslipidemia, atherosclerosis and central obesity. A number of studies that employ strength training regimens have been shown to improve glycemic control, increase skeletal muscle size and strength, and positively change body composition. They suggest that anaerobic exercise may be an effective strategy for the treatment of insulin resistance and type 2 diabetes 6,7,49,53. Recent reports have suggested that differences exist between normal and insulin resistant muscle in their adaptation to an exercise regimen 8,5,50,20,24,48. However, the direct effects of exercise on the phenotype of insulin resistant muscle have not been widely
Author for correspondence: Eric R. Blough, Ph.D., Laboratory of Molecular Physiology, Byrd Biotechnology Building, 1 John Marshall Drive, Marshall University, Huntington, WV 25755-1090, [email protected].
Katta et al. Page 2 studied. It is thought that the beneficial effects of exercise on muscle are mediated through activation of various signaling cascades which are involved in regulating changes in gene expression, glucose uptake, and protein synthesis 2. Whether insulin resistance alters exercise-induced signal transduction processes in muscle is unknown, but the existence of differences, if present, may help to explain why exercise-induced skeletal muscle adaptations may differ between normal and insulin resistant populations.
It is well established that increased muscle loading increases the rates of muscle protein synthesis 27. This increase in protein synthesis, at least in part, is thought to be regulated by the phosphorylation of the p70 ribosomal protein S6 kinase (p70S6k) 26, whose activation has been proposed to promote increased translation of messages that have a polypyrimide motif just downstream of the 5′ cap 45. It is thought that p70S6k activity is regulated by the mammalian target of rapamycin (mTOR), which functions as a growth factor and nutrient- sensing signaling molecule in mammalian cells 40. How mTOR activity is modulated is not clear; however, recent evidence suggests that mTOR is controlled by Akt or protein kinase B (PKB) which is activated in response to phospholipid products of the phosphatidylinositol 3- kinase (PI3K) reaction. It is well documented that binding of insulin to the membrane receptor stimulates a cascade of phosphorylation events resulting in activation of PI3K. It is likely that PKB/Akt directly increases mTOR activity by phosphorylating mTOR at Ser2448, and it has been hypothesized that this event is a critical point of control in the regulation of protein synthesis 4. It has been postulated that p70S6k signaling may be particularly important in mediating muscle adaptation given that the phosphorylation of this molecule following an exercise bout has been found to be strongly associated with the increase in muscle weight after 6 wk of chronic stimulation 1 The purpose of the present study was to determine whether insulin resistance alters p70S6k signaling after an acute episode of contractile activity. To investigate this possibility, muscle signaling was examined in 12-week old lean and obese Zucker rats, as it is widely accepted that the insulin resistance exhibited by these animals closely models the development of type 2 diabetes seen in humans 3,18,25,39. We hypothesized that insulin resistance would be associated with differences in how muscle contraction regulates the phosphorylation of the Akt/mTOR/p70S6k signaling cascade. To test this hypothesis, the contraction-mediated activation of Akt, mTOR and p70S6k was assessed either immediately after or 1 or 3h after a single bout of sciatic nerve stimulation. Taken together, our data suggest that insulin resistance alters contraction-induced p70S6k phosphorylation in skeletal muscle. These findings are consistent with the possibility that insulin resistance alters the way skeletal muscle “senses and responds” to contractile stimuli.
METERIALS AND METHODS
Animal Care
All procedures were performed as outlined in the Guide for the Care and Use of Laboratory Animals as approved by the Council of the American Physiological Society and the Animal Use Review Board of Marshall University. Young (10 week, n=12) male lean Zucker and young (10 week, n=12) male obese Zucker rats were obtained from the Charles River Laboratories. Rats were housed two to a cage in an Association for Assessment and Accreditation of Laboratory Animal Care (AAALAC) approved vivarium. Housing conditions consisted of a 12H: 12H dark-light cycle, and temperature was maintained at 22° ± 2°C. Animals were provided food and water ad libitum and allowed to recover from shipment for at least two weeks before experimentation. During this time the animals were carefully observed and weighed weekly to ensure that none exhibited signs of failure to thrive, such as precipitous weight loss, disinterest in the environment, or unexpected gait alterations.
Katta et al. Page 3
Materials
Anti- p70S6k (#9202), Akt (#9272), mTOR (#2972), PTEN (#9552), TSC2/tuberin (#3612), raptor (#4978), phosphorylated Thr389 p70S6K (#9206), phosphorylated Ser421/Thr424 p70S6K (#9204), phosphorylated Ser2448 mTOR (#2971), phosphorylated Thr308 Akt (#9275), phosphorylated Ser473 ( #9271) Akt, Ser380/Thr382/383 phosphorylated PTEN (#9554), phosphorylated Thr1462 TSC2/tuberin (#3611), Mouse IgG, and Rabbit IgG antibodies were purchased from Cell Signaling Technology (Beverly, MA). Enhanced chemiluminescence (ECL) western blotting detection reagent was obtained from Amersham Biosciences (Piscataway, NJ). Restore western blot stripping buffer was obtained from Pierce Company (Rockford, IL), and 3T3 cell lysates were from Santa Cruz Biotechnology (Santa Cruz, CA). All other chemicals were purchased from Sigma Biosciences (St. Louis, MO) or Fisher Scientific Company (Hanover, IL).
Contractile stimulation of skeletal muscles
The high-frequency electrical stimulation (HFES) model has been previously described 36 and was chosen on the basis of its efficacy in stimulating protein translation and muscle hypertrophy in vivo1. In order to produce maximal contractile stimulus, a voltage of 5–7V was applied to electrodes placed on the sciatic nerve and the sciatic nerve was stimulated with 1-ms pulses at 100 Hz, where all motor units(both fast and slow) are recruited. The contractionslasted 3 s and were followed by a 10-s rest, and after the sixth repetition there was an additional 50 s of rest. The HFES model used in the present study produced 10 sets of 6 contractions with an overall protocol time of 22 min. This protocol results in eccentric contraction of the TA. The TA muscle was chosen for analysis on the basis of previous studies demonstrating that HFES induces p70S6k phosphorylation and muscle hypertrophy in the TA muscle 15,30,47,54. Animals were killed by a lethal dose of pentobarbital sodium at baseline, immediately following, 1h or 3 h after HFES. Once excised, muscles were blotted dry, trimmed of visible fat and tendon projections, weighed, immediately frozen in liquid nitrogen, and stored at −80° C.
Preparation of protein isolate and immunoblotting
Muscles were pulverized in liquid nitrogen using a mortar and pestle until a fine powder was obtained. After washing with ice cold PBS, pellets were lysed on ice for 15 minutes in Tissue Protein Extraction Reagent (T-PER) lysis buffer composed of T-PER reagent (2mL/ 1g tissue weight) (Pierce, Rockford, IL), 1 mM EDTA (pH 8.0), 1 mM EGTA (pH 7.5), 1M magnesium chloride, 1 mM PMSF, 1μl protease inhibitor cocktail and 1 mM sodium vanadate to inhibit phosphatase activity and centrifuged for 10 minutes at 2000 × g to pellet particulate matter. This process was repeated twice, and the supernatants were combined for protein concentration determination using the Bradford method (Pierce, Rockford, IL). Samples were diluted to a concentration of 3 μg/ μl in SDS loading buffer and boiled for 5 minutes. 60 μg of protein were separated using 10% SDS-PAGE gels. Transfer of protein onto nitrocellulose membranes, verification of transfer and determination of equal loading between lanes and membranes was determined as outlined previously 33. Protein immuno- detection was performed as outlined by the antibody manufacturer while immunoreactive bands were visualized with Electrochemiluminescence (ECL) (Amersham Biosciences). Exposure time was adjusted at all times to keep the integrated optical densities (IODs) within a linear and non-saturated range, and band signal intensity was quantified by densitometry using a flatbed scanner (Epson Perfection 3200 PHOTO) and imaging software (AlphaEaseFC) after normalization to β-tubulin. Molecular weight markers (Cell Signaling) were used as molecular mass standards, and NIH 3T3 cell lysates were included as positive controls. To allow direct comparisons to be made between the concentration levels of different signaling molecules, immunoblots were stripped and re-probed with Restore western blot stripping buffer as detailed by the manufacturer (Pierce, Rockford, IL).
Katta et al. Page 4
Statistical analysis
Results are presented as mean ± SEM. Data were analyzed by using the Sigma Stat 3.0 statistical program. Data was analyzed using a two-way ANOVA followed by the Student- Newman-Keuls post-hoc testing when appropriate. P <0.05 was considered to be statistically significant.
RESULTS
Insulin resistance and muscle mass
The average body weight of the obese Zucker rats was ~82 % greater than that of the lean Zucker rats (597 ± 21.7 g vs. 328 ± 12.2 g; P< 0.05). Compared to lean animals, TA muscle mass was ~35% less (651 ± 9.0 mg vs. 479 ± 20 mg) in the obese Zucker rats (P< 0.05) (Table 1).
P70S6k pathway related protein levels and phosphorylation status are altered in the insulin
resistant TA muscle
To investigate the effects of insulin resistance on the total amounts of p70S6k, mTOR, Akt, PTEN, TSC2 and raptor we performed SDS PAGE and western blot analysis using antibodies which recognize both the unphosphorylated and phosphorylated forms of these molecules. There were no differences in mTOR, raptor and TSC2 protein content (P< 0.05) (Figs.1, 5). The muscle content of p70S6k, and Akt in the obese zucker TA was 27.9 ± 3.6% and 28.2 ± 10.1% lower, respectively than that observed in their lean counterparts (P< 0.05) (Fig. 1). The expression of PTEN was higher in obese Zucker rats by 25.63 ± 4.2% when compared to the lean Zucker rats (P< 0.05) (Fig. 5). Immunoblot analysis using phospho- specific antibodies indicated that the basal phosphorylation level of p70S6k (Thr 389) was 26.1 ± 7.5% lower in the obese Zucker TA compared to that observed in lean animals (P<0.05) (Fig. 2). No differences were seen across groups in basal phosphorylation levels of p70S6k (Thr421/Ser424), mTOR (Ser 2448), Akt (Thr 308) Akt (Ser 473) and TSC2 (Figs. 2, 3, 4 and 5).
The contraction-induced phosphorylation of p70S6k is altered in the obese-Zucker rat
Phosphorylation of p70S6k, mTOR and Akt in exercised TA muscles was determined at 0-, 1-, and 3-hours after a bout of HFES and compared to control (unstimulated) muscles. Exercise-induced phosphorylation of these molecules was compared between lean and obese Zucker rats. In the case of each molecule examined, significant differences existed between lean and obese Zucker rats (Fig. 2, 3 & 4). In the lean rat TA, the phosphorylation of p70S6k (Thr 389) was found to be 33.3 ± 7.2%, 24.0 ± 14.9% and 24.6 ± 11.3% higher than in unstimulated control muscles at 0-, 1- and 3-hr post-HFES, respectively (P< 0.05) (Fig. 2). This response appeared to differ in the obese Zucker TA, where the phosphorylation of p70S6k (Thr 389) was 33.5 ± 8.0% higher than control 3hr post-exercise (P<0.05), but not immediately after or at the 1 hr post-HFES (Fig. 2). In lean Zucker TA, the Erk1/2- dependent phosphorylation of p70S6k (Thr 421/Ser 424) was 412.5 ± 37.2%, 331.0 ± 28.1% and 83.0 ± 20.7% higher than control at 0-, 1- and 3-hr, respectively (P< 0.05) (Fig. 2). Although different in magnitude compared to lean animals (Fig. 2) p70S6k (Thr 421/Ser 424 ) phosphorylation in the obese TA exhibited a similar pattern and was 294.5 ± 9.6%, 103.3 ± 35.5% and 182.0 ± 26.1% higher than baseline at 0-, 1- and 3-hours, respectively (Fig 2; P< 0.05)
Katta et al. Page 5
Contraction-induced phosphorylation of potential p70S6k regulators is
altered in the obese Zucker rat
It is thought that p70S6k phosphorylation is regulated by the mTOR complex and its upstream regulator Akt 4,40,41. mTOR phosphorylation (Ser 2448) was found to be 96.5 ± 40.3% higher than baseline immediately after exercise in lean animals (P< 0.05), while it was not different from baseline at 1 and 3 hr post-HFES (Fig. 3). This response differed in obese animals with no alteration in mTOR (Ser 2448) phosphorylation levels at any time point after HFES (Fig. 3). There was no significant difference between contraction-induced TSC2 (Thr 1462) phosphorylation in obese Zucker rats compared to their lean counterparts (Fig. 5). In the lean Zucker TA, Akt (Thr 308) phosphorylation was 31.8 ± 16.2%, 29.8 ± 7.5% and 31.1 ± 8.8% higher than baseline at 0-, 1- and 3-hr post-HFES, exhibiting a biphasic response (P<0.05; Fig. 4). An altogether opposite response was observed in the obese Zucker TA, where Akt (Thr 308) phosphorylation was 25.3 ± 6.2%, 44.6 ± 9.0% and 30.4 ± 5.9% lower than baseline at 0-, 1-, and 3-hours, respectively after HFES (P<0.05). In lean rats the phosphorylation of Akt (Ser 473) appeared to mirror what was seen at the Thr 308 residue with HFES and was 47.2 ± 12.1% and 43.7 ± 11.7% higher than baseline at 0- and 3-hours, respectively (P< 0.05) (Fig. 4). This pattern of response was essentially opposite in the obese Zucker rats, where the phosphorylation of Akt (Ser 473) was 18.7 ± 6.4%, 46.3 ± 5.5% and 32.4 ± 7.3% lower than baseline at 0-, 1-, and 3-hours post-HFES, respectively (P< 0.05) (Fig. 4). Taken together these results suggest that the contraction- induced activation of p70S6k signaling may be altered with insulin resistance.
DISCUSSION
The obese Zucker rat is insulin resistant and has been used as a model of type 2 diabetes 10,22. In this report we demonstrate that the phosphorylation (activation) of the Akt/mTOR/ p70S6k pathway in response to a maximal contractile stimulus appears to be altered in insulin resistant muscle.
Our results suggest that, compared to lean animals, the magnitude and time course of the contraction-induced phosphorylation of p70S6k (Thr 389) and p70S6k (Thr 421/ser 424) was significantly different in obese animals (Fig. 2). The p70S6k is a serine/threonine protein kinase, and it has been shown to play an important role in regulating protein synthesis. It is thought that p70S6k modulates protein synthesis, at least in part, by controlling the translation of numerous messenger RNA transcripts that encode components of the translational apparatus 38. Illustrating this fact is the finding that blockade of p70S6k activity results in significant inhibition of protein synthesis in multiple cell systems 12,23,9,32,55. In skeletal muscle, the contraction-induced phosphorylation of p70S6K has been found to be elevated following HFES 1,37,36 and is highly correlated with an increase in muscle mass following a resistance training program 1. To our knowledge, the influence of diabetes on p70S6k phosphorylation in response to muscle contraction has not been reported before. The physiological significance of these alterations remains unclear; however it is interesting to note that previous reports have suggested that the insulin- stimulated phosphorylation of p70S6k may be altered in diabetic rats 19,14,29. In the light of these studies, our data suggest that insulin resistance may affect how multiple stimuli may regulate the phosphorylation of p70S6k. Future studies that employ a combination of approaches to stimulate p70S6k phosphorylation will certainly be of value in determining how insulin resistance may affect the regulation of p70S6k in skeletal muscle.
To further explore how insulin resistance may be associated with alterations in the contraction-induced regulation of p70S6k phosphorylation, we assessed the effects of muscle contraction on mTOR. Like p70S6k, mTOR is thought to be involved in regulating several components of the translational machinery and in addition, it is thought to be an
Katta et al. Page 6
upstream activator of p70S6k 16. Similar to previous studies, increased contractile activity appears to be a strong stimulus to increase the phosphorylation level of mTOR in non- diabetic muscle 37,36. Conversely, in the insulin resistant TA, HFES appears to be unable to alter the degree of mTOR phosphorylation (Fig. 3). This latter finding is consistent with our data that demonstrate that insulin resistant muscle exhibits a reduced ability to activate p70S6k following a bout of HFES. Taken together, these data suggest that insulin resistance- associated alterations in p70S6k regulation may be due, at least in part, to defects in the ability of diabetic muscle to activate mTOR following a contractile stimulus.
It is thought that mTOR phosphorylation of Ser 2448 is directly regulated by Akt/PKB 41,43,44. Akt is a serine/threonine kinase that has been shown to mediate certain types of muscle hypertrophy 4. Under non-stimulated conditions Akt is located in the cytoplasm. It is thought to translocate to the plasma membrane upon activation, where it is phosphorylated by phosphinositide-dependent kinases (PDK) on its two principal regulatory sites Thr 308 and Ser 47352. Like p70S6k and mTOR, HFES significantly increased the amount of Akt (Ser 308) and Akt (Ser 473) phosphorylation in non-diabetic muscle (Fig 4). Similar findings regarding the effects of contractile activity on Akt phosphorylation in non-insulin resistant muscle have been reported previously 34,42,51. In contrast to our findings in the non-insulin resistant animals, these events appeared to differ in insulin resistant muscle. This suggests that insulin resistance is associated with alterations in the ability of skeletal muscle to activate Akt signaling following increased contractile loading (Fig. 4). Given that Akt is thought to reside upstream of mTOR, this lack of Akt activation in insulin resistant muscle may provide an explanation as to why insulin resistance may be associated with defects in HFES induced mTOR and p70S6k phosphoryation.
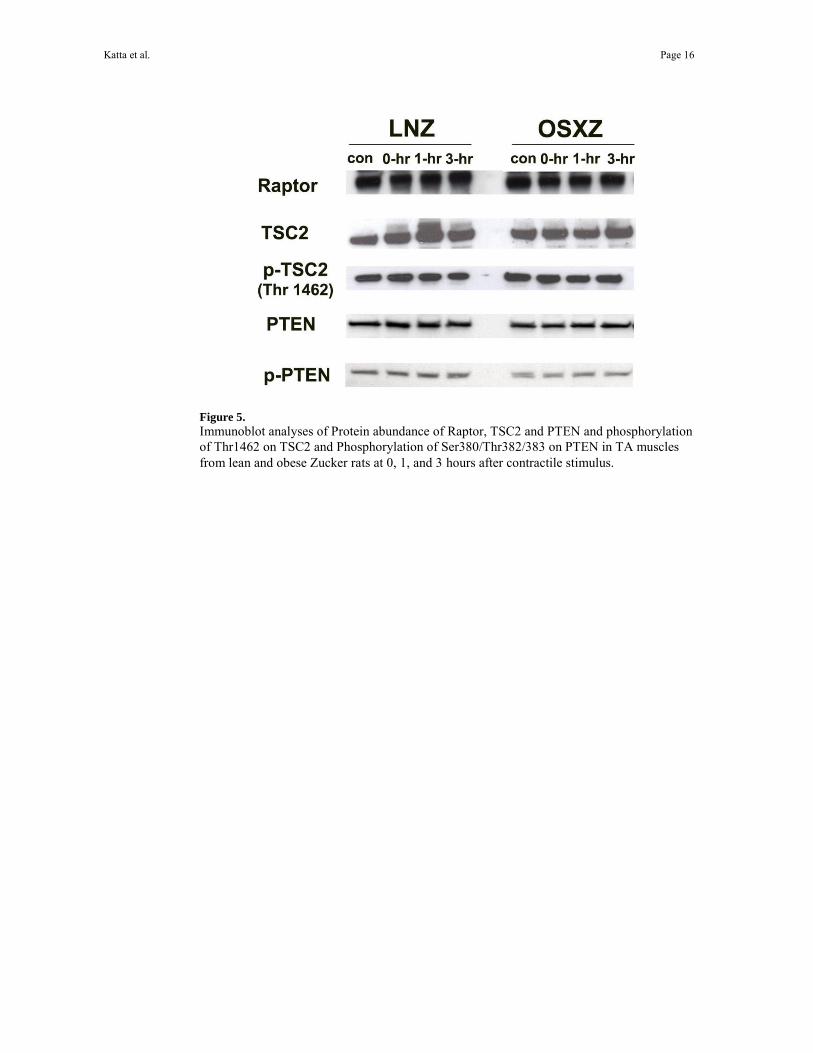
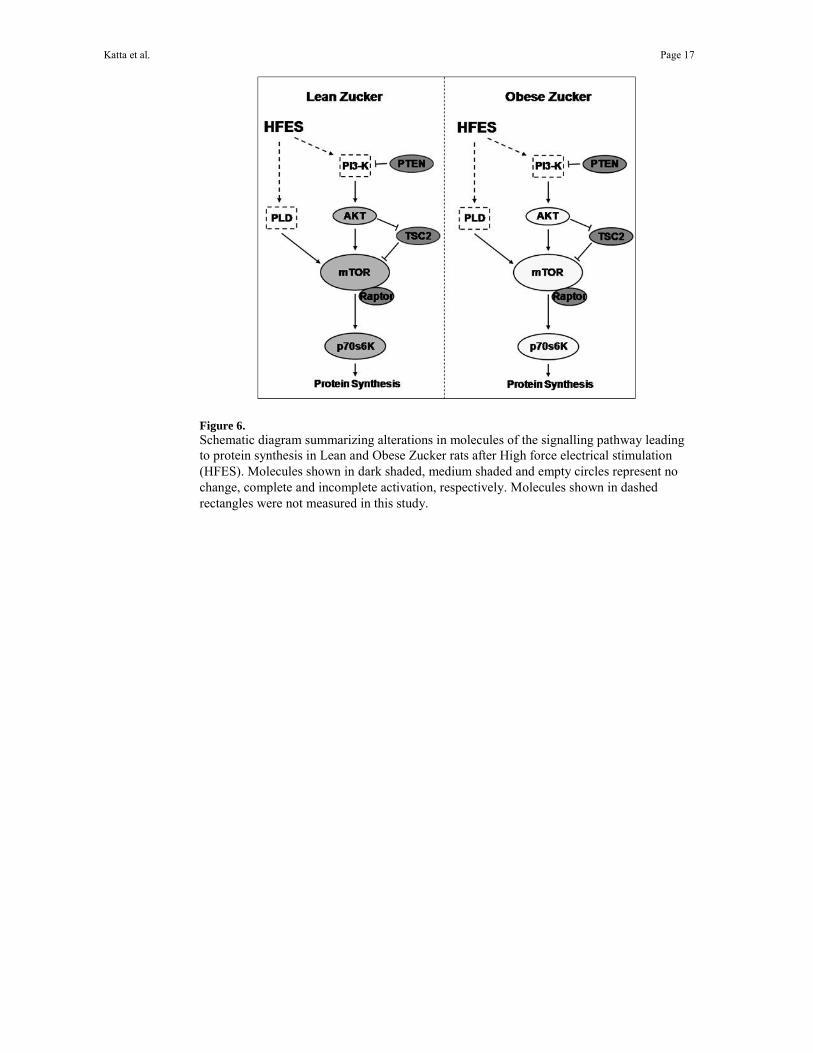
In an attempt to explain differences in contraction-dependent signaling between models we also examined how HFES affected the regulation of raptor (a positive regulator of mTOR activity), the Akt inhibitor, phosphatase and tensin homolog (PTEN), and the mTOR repressor, tuberin (TSC2) 28. The ability of PTEN and TSC2 to inhibit downstream signaling is thought to be regulated by phosphorylation 57,56 while differences in raptor levels between models could influence mTOR activation. Our findings of no differences in the regulation of these three molecules with HFES between models suggests that raptor, PTEN and tuberin may not be responsible for the differences in Akt and mTOR phosphorylation that we observe between normal and insulin-resistant muscle subjected to HFES (Fig. 5). Although not investigated here, recent work has suggested that phospholipase D (PLD) may play a key role in regulating load-induced mTOR phosphorylation in skeletal muscle 21. Whether differences in PLD regulation with insulin resistance can explain the alterations in mTOR signaling we see between our experimental models will require further experimentation (Fig. 6).
The precise influence of insulin resistance on Akt regulation in muscle contraction remains unclear. It has been postulated that the degree of Akt activation following contractile activity may be dependent upon the type of contractile activity, contraction intensity, and/or the duration of stimulation 36. Given this contention, it is plausible that differences in the signaling response between models could be related to the time points chosen for evaluation. Future studies that employ other time points could yield different findings. Alternatively, it is possible that the two groups experienced a different amount of tension during the HFES protocol. Although this possibility exists, we consider it unlikely that differences in contractile intensity, if present, are solely responsible for the alterations in muscle signaling we observe. Indeed, given the nature of the HFES model (direct nerve stimulation), the type of contraction this model produces in the TA (maximal eccentric loading) and the conditions under which the loading occurred (identical in both groups), we suggest that our data are consistent with the notion that insulin resistance is characterized by alterations in contractile
Katta et al. Page 7
signaling. The molecular mechanism(s) responsible for these differences are largely unknown. Exercise was found to have no effect on Akt as observed in isolated soleus muscle, suggesting perhaps that systemic factors and/or oxidative stress may also play a role in mediating the activation of Akt by exercise 46. Supporting this contention, hyperglycemia has been shown to directly decrease insulin-induced Akt phosphorylation on Ser473 in rat and human skeletal muscle 17,35. The factors which may regulate diminished Akt activation during hyperglycemia will require further experimentation. Similarly, it is also possible that reduced availability of circulating growth factors, decreased expression of local growth factors or alterations in cytokine levels may also play a role regulating Akt signaling 31. This latter possibility is an intriguing alternative that we are actively pursuing. Given the strong correlation between the phosphorylation level of p70S6k and degree of muscle hypertrophy seen by others, these data could suggest that insulin resistant muscle may be incapable of growth following a resistance-based exercise program. This is not in agreement with the findings of Farrell and colleagues who demonstrated that diabetic muscle is fully capable of undergoing muscle hypertrophy following 8 weeks of resistance training13. The reasons for this apparent discrepancy are not entirely clear, but they may lie in the difference in models and time points of the studies. Irrespective of the mechanism, it is likely that insulin resistance-associated differences in the ability of skeletal muscle to induce Akt → mTOR → p70S6K signaling could be of clinical importance, given the potential role that this signaling pathway may play in regulating protein synthesis and the adaptation of skeletal muscle to increased contractile loading (Fig. 6). Given the apparent linkage between exercise-induced increase in muscle mass and improvement in glucose disposal, we speculate that the data of the present study may have implications for the improvement of resistance based programs for the treatment of diabetes mellitus.
Acknowledgements
This study was supported by National Institute on Aging Grant AG-027103-1 to E. B. and WV-EPSCoR to Marshall University.
Abbreviations
ECL Enhanced Chemiluminiscence
HFES High Frequency Electrical Stimulation
LZ Lean Zucker
mTOR mammalian Target of Rapamycin
PBS Phosphate Buffered Saline
PTEN Phosphatase and Tensin Homolog
OZ Obese Zucker
p70S6k 70 kDa ribosomal S6 kinase
PKB Protein Kinase B
SDS-PAGE Sodium Dodecyl Sulfate-Polyacrylamide Gel Electrophoresis
TA Tibialis Anterior
T-PER Tissue Protein Extraction Reagent
TSC2 Tuberous Sclerosis Complex 2
Katta et al. Page 8
References
1. Baar K, Esser K. Phosphorylation of p70(S6k) correlates with increased skeletal muscle mass
following resistance exercise. Am J Physiol. 1999; 276(1 Pt 1):C120–127. [PubMed: 9886927] 2. Bassel-Duby R, Olson EN. Signaling pathways in skeletal muscle remodeling. Annu Rev Biochem.
2006; 75:19–37. [PubMed: 16756483] 3. Berthiaume N, Mika AK, Zinker BA. Development of insulin resistance and endothelin-1 levels in
the Zucker fatty rat. Metabolism. 2003; 52(7):845–849. [PubMed: 12870159] 4. Bodine SC, Stitt TN, Gonzalez M, Kline WO, Stover GL, Bauerlein R, Zlotchenko E, Scrimgeour
A, Lawrence JC, Glass DJ, Yancopoulos GD. Akt/mTOR pathway is a crucial regulator of skeletal muscle hypertrophy and can prevent muscle atrophy in vivo. Nat Cell Biol. 2001; 3(11):1014–1019. [PubMed: 11715023]
5. Brozinick JT Jr, Etgen GJ Jr, Yaspelkis BB 3rd, Kang HY, Ivy JL. Effects of exercise training on muscle GLUT-4 protein content and translocation in obese Zucker rats. Am J Physiol. 1993; 265(3 Pt 1):E419–427. [PubMed: 8214051]
6. Bruce CR, Kriketos AD, Cooney GJ, Hawley JA. Disassociation of muscle triglyceride content and insulin sensitivity after exercise training in patients with Type 2 diabetes. Diabetologia. 2004; 47(1): 23–30. [PubMed: 14673522]
7. Cauza E, Hanusch-Enserer U, Strasser B, Ludvik B, Metz-Schimmerl S, Pacini G, Wagner O, Georg P, Prager R, Kostner K, Dunky A, Haber P. The relative benefits of endurance and strength training on the metabolic factors and muscle function of people with type 2 diabetes mellitus. Arch Phys Med Rehabil. 2005; 86(8):1527–1533. [PubMed: 16084803]
8. Christ CY, Hunt D, Hancock J, Garcia-Macedo R, Mandarino LJ, Ivy JL. Exercise training improves muscle insulin resistance but not insulin receptor signaling in obese Zucker rats. J Appl Physiol. 2002; 92(2):736–744. [PubMed: 11796688]
9. Coutant A, Rescan C, Gilot D, Loyer P, Guguen-Guillouzo C, Baffet G. PI3K-FRAP/mTOR pathway is critical for hepatocyte proliferation whereas MEK/ERK supports both proliferation and survival. Hepatology. 2002; 36(5):1079–1088. [PubMed: 12395317]
10. Crettaz M, Prentki M, Zaninetti D, Jeanrenaud B. Insulin resistance in soleus muscle from obese Zucker rats. Involvement of several defective sites. Biochem J. 1980; 186(2):525–534. [PubMed: 6990920]
11. Diamond J. The double puzzle of diabetes. Nature. 2003; 423(6940):599–602. [PubMed: 12789325]
12. Dufner A, Thomas G. Ribosomal S6 kinase signaling and the control of translation. Exp Cell Res. 1999; 253(1):100–109. [PubMed: 10579915]
13. Farrell PA, Fedele MJ, Hernandez J, Fluckey JD, Miller JL 3rd, Lang CH, Vary TC, Kimball SR, Jefferson LS. Hypertrophy of skeletal muscle in diabetic rats in response to chronic resistance exercise. J Appl Physiol. 1999; 87(3):1075–1082. [PubMed: 10484579]
14. Fluckey JD, Pohnert SC, Boyd SG, Cortright RN, Trappe TA, Dohm GL. Insulin stimulation of muscle protein synthesis in obese Zucker rats is not via a rapamycin-sensitive pathway. Am J Physiol Endocrinol Metab. 2000; 279(1):E182–187. [PubMed: 10893338]
15. Geiger PC, Wright DC, Han DH, Holloszy JO. Activation of p38 MAP kinase enhances sensitivity of muscle glucose transport to insulin. Am J Physiol Endocrinol Metab. 2005; 288(4):E782–788. [PubMed: 15585585]
16. Gingras AC, Raught B, Sonenberg N. Regulation of translation initiation by FRAP/mTOR. Genes Dev. 2001; 15(7):807–826. [PubMed: 11297505]
17. Gosmanov AR, Umpierrez GE, Karabell AH, Cuervo R, Thomason DB. Impaired expression and insulin-stimulated phosphorylation of Akt-2 in muscle of obese patients with atypical diabetes. Am J Physiol Endocrinol Metab. 2004; 287(1):E8–E15. [PubMed: 15010337]
18. Han XX, Chabowski A, Tandon NN, Calles-Escandon J, Glatz JF, Luiken JJ, Bonen A. Metabolic challenges reveal impaired fatty acid metabolism and translocation of FAT/CD36 but not FABPpm in obese Zucker rat muscle. Am J Physiol Endocrinol Metab. 2007; 293(2):E566–575. [PubMed: 17519284]
Katta et al. Page 9
19. Hei YJ, Chen X, Pelech SL, Diamond J, McNeill JH. Skeletal muscle mitogen-activated protein kinases and ribosomal S6 kinases. Suppression in chronic diabetic rats and reversal by vanadium. Diabetes. 1995; 44(10):1147–1155. [PubMed: 7556949]
20. Holten MK, Zacho M, Gaster M, Juel C, Wojtaszewski JF, Dela F. Strength training increases insulin-mediated glucose uptake, GLUT4 content, and insulin signaling in skeletal muscle in patients with type 2 diabetes. Diabetes. 2004; 53(2):294–305. [PubMed: 14747278]
21. Hornberger TA, Chu WK, Mak YW, Hsiung JW, Huang SA, Chien S. The role of phospholipase D and phosphatidic acid in the mechanical activation of mTOR signaling in skeletal muscle. Proc Natl Acad Sci U S A. 2006; 103(12):4741–4746. [PubMed: 16537399]
22. Ionescu E, Sauter JF, Jeanrenaud B. Abnormal oral glucose tolerance in genetically obese (fa/fa) rats. Am J Physiol. 1985; 248(5 Pt 1):E500–506. [PubMed: 3887938]
23. Jefferies HB, Fumagalli S, Dennis PB, Reinhard C, Pearson RB, Thomas G. Rapamycin suppresses 5′TOP mRNA translation through inhibition of p70s6k. Embo J. 1997; 16(12):3693–3704. [PubMed: 9218810]
24. Juel C, Holten MK, Dela F. Effects of strength training on muscle lactate release and MCT1 and MCT4 content in healthy and type 2 diabetic humans. J Physiol. 2004; 556(Pt 1):297–304. [PubMed: 14724187]
25. Kim YB, Peroni OD, Franke TF, Kahn BB. Divergent regulation of Akt1 and Akt2 isoforms in insulin target tissues of obese Zucker rats. Diabetes. 2000; 49(5):847–856. [PubMed: 10905496]
26. Kimball SR, Horetsky RL, Jefferson LS. Signal transduction pathways involved in the regulation of protein synthesis by insulin in L6 myoblasts. Am J Physiol. 1998; 274(1 Pt 1):C221–228. [PubMed: 9458731]
27. Laurent GJ, Millward DJ. Protein turnover during skeletal muscle hypertrophy. Fed Proc. 1980; 39(1):42–47. [PubMed: 6985870]
28. Lee CH, Inoki K, Guan KL. mTOR pathway as a target in tissue hypertrophy. Annu Rev Pharmacol Toxicol. 2007; 47:443–467. [PubMed: 16968213]
29. Markuns JF, Napoli R, Hirshman MF, Davalli AM, Cheatham B, Goodyear LJ. Effects of streptozocin-induced diabetes and islet cell transplantation on insulin signaling in rat skeletal muscle. Endocrinology. 1999; 140(1):106–111. [PubMed: 9886813]
30. Martineau LC, Gardiner PF. Insight into skeletal muscle mechanotransduction: MAPK activation is quantitatively related to tension. J Appl Physiol. 2001; 91(2):693–702. [PubMed: 11457783]
31. Melian E, Gonzalez B, Ajo R, Gonzalez N, Sanchez Franco F. Tissue-specific response of IGF-I mRNA expression to obesity-associated GH decline in the male Zucker fatty rat. J Endocrinol. 1999; 160(1):49–56. [PubMed: 9854176]
32. Mourani PM, Garl PJ, Wenzlau JM, Carpenter TC, Stenmark KR, Weiser-Evans MC. Unique, highly proliferative growth phenotype expressed by embryonic and neointimal smooth muscle cells is driven by constitutive Akt, mTOR, and p70S6K signaling and is actively repressed by PTEN. Circulation. 2004; 109(10):1299–1306. [PubMed: 14993145]
33. Mylabathula DB, Rice KM, Wang Z, Uddemarri S, Kinnard RS, Blough ER. Age-associated changes in MAPK activation in fast- and slow-twitch skeletal muscle of the F344/NNiaHSD X Brown Norway/BiNia rat model. Exp Gerontol. 2006; 41(2):205–214. [PubMed: 16378702]
34. Nader GA, Esser KA. Intracellular signaling specificity in skeletal muscle in response to different modes of exercise. J Appl Physiol. 2001; 90(5):1936–1942. [PubMed: 11299288]
35. Oku A, Nawano M, Ueta K, Fujita T, Umebayashi I, Arakawa K, Kano-Ishihara T, Saito A, Anai M, Funaki M, Kikuchi M, Oka Y, Asano T. Inhibitory effect of hyperglycemia on insulin-induced Akt/protein kinase B activation in skeletal muscle. Am J Physiol Endocrinol Metab. 2001; 280(5):E816–824. [PubMed: 11287365]
36. Parkington JD, Siebert AP, LeBrasseur NK, Fielding RA. Differential activation of mTOR signaling by contractile activity in skeletal muscle. Am J Physiol Regul Integr Comp Physiol. 2003; 285(5):R1086–1090. [PubMed: 12881204]
38. Pearson RB, Thomas G. Regulation of p70s6k/p85s6k and its role in the cell cycle. Prog Cell Cycle Res. 1995; 1:21–32. [PubMed: 9552351]
39. Peterson JM, Bryner RW, Alway SE. Satellite cell proliferation is reduced in muscles of obese Zucker rats but restored with loading. Am J Physiol Cell Physiol. 2008; 295(2):C521–528. [PubMed: 18508911]
40. Pullen N, Thomas G. The modular phosphorylation and activation of p70s6k. FEBS Lett. 1997; 410(1):78–82. [PubMed: 9247127]
41. Reynolds, THt; Bodine, SC.; Lawrence, JC, Jr. Control of Ser2448 phosphorylation in the mammalian target of rapamycin by insulin and skeletal muscle load. J Biol Chem. 2002; 277(20): 17657–17662. [PubMed: 11884412]
42. Sakamoto K, Hirshman MF, Aschenbach WG, Goodyear LJ. Contraction regulation of Akt in rat skeletal muscle. J Biol Chem. 2002; 277(14):11910–11917. [PubMed: 11809761]
43. Scott PH, Lawrence JC Jr. Attenuation of mammalian target of rapamycin activity by increased cAMP in 3T3-L1 adipocytes. J Biol Chem. 1998; 273(51):34496–34501. [PubMed: 9852118]
44. Sekulic A, Hudson CC, Homme JL, Yin P, Otterness DM, Karnitz LM, Abraham RT. A direct linkage between the phosphoinositide 3-kinase-AKT signaling pathway and the mammalian target of rapamycin in mitogen-stimulated and transformed cells. Cancer Res. 2000; 60(13):3504–3513. [PubMed: 10910062]
45. Shah OJ, Kimball SR, Jefferson LS. Glucocorticoids abate p70(S6k) and eIF4E function in L6 skeletal myoblasts. Am J Physiol Endocrinol Metab. 2000; 279(1):E74–82. [PubMed: 10893325]
46. Shaw M, Cohen P, Alessi DR. The activation of protein kinase B by H2O2 or heat shock is mediated by phosphoinositide 3-kinase and not by mitogen-activated protein kinase-activated protein kinase-2. Biochem J. 1998; 336 (Pt 1):241–246. [PubMed: 9806907]
47. Somwar R, Perreault M, Kapur S, Taha C, Sweeney G, Ramlal T, Kim DY, Keen J, Cote CH, Klip A, Marette A. Activation of p38 mitogen-activated protein kinase alpha and beta by insulin and contraction in rat skeletal muscle: potential role in the stimulation of glucose transport. Diabetes. 2000; 49(11):1794–1800. [PubMed: 11078445]
48. Stickland NC, Batt RA, Crook AR, Sutton CM. Inability of muscles in the obese mouse (ob/ob) to respond to changes in body weight and activity. J Anat. 1994; 184 (Pt 3):527–533. [PubMed: 7928642]
49. Tokmakidis SP, Zois CE, Volaklis KA, Kotsa K, Touvra AM. The effects of a combined strength and aerobic exercise program on glucose control and insulin action in women with type 2 diabetes. Eur J Appl Physiol. 2004; 92(4–5):437–442. [PubMed: 15232701]
50. Treadway JL, James DE, Burcel E, Ruderman NB. Effect of exercise on insulin receptor binding and kinase activity in skeletal muscle. Am J Physiol. 1989; 256(1 Pt 1):E138–144. [PubMed: 2643337]
51. Turinsky J, Damrau-Abney A. Akt kinases and 2-deoxyglucose uptake in rat skeletal muscles in vivo: study with insulin and exercise. Am J Physiol. 1999; 276(1 Pt 2):R277–282. [PubMed: 9887206]
52. Vanhaesebroeck B, Alessi DR. The PI3K-PDK1 connection: more than just a road to PKB. Biochem J. 2000; 346(Pt 3):561–576. [PubMed: 10698680]
53. Venojarvi M, Puhke R, Hamalainen H, Marniemi J, Rastas M, Rusko H, Nuutila P, Hanninen O, Aunola S. Role of skeletal muscle-fibre type in regulation of glucose metabolism in middle-aged subjects with impaired glucose tolerance during a long-term exercise and dietary intervention. Diabetes Obes Metab. 2005; 7(6):745–754. [PubMed: 16219019]
54. Wretman C, Lionikas A, Widegren U, Lannergren J, Westerblad H, Henriksson J. Effects of concentric and eccentric contractions on phosphorylation of MAPK(erk1/2) and MAPK(p38) in isolated rat skeletal muscle. J Physiol. 2001; 535(Pt 1):155–164. [PubMed: 11507166]
55. Wu X, Reiter CE, Antonetti DA, Kimball SR, Jefferson LS, Gardner TW. Insulin promotes rat retinal neuronal cell survival in a p70S6K-dependent manner. J Biol Chem. 2004; 279(10):9167– 9175. [PubMed: 14660591]
56. Yamada KM, Araki M. Tumor suppressor PTEN: modulator of cell signaling, growth, migration and apoptosis. J Cell Sci. 2001; 114(Pt 13):2375–2382. [PubMed: 11559746]
Katta et al. Page 11
57. Zhang H, Cicchetti G, Onda H, Koon HB, Asrican K, Bajraszewski N, Vazquez F, Carpenter CL, Kwiatkowski DJ. Loss of Tsc1/Tsc2 activates mTOR and disrupts PI3K-Akt signaling through downregulation of PDGFR. J Clin Invest. 2003; 112(8):1223–1233. [PubMed: 14561707]
Katta et al. Page 12
Figure 1. TA muscles from lean (LNZ) and obese Zucker rats (OSXZ) were analyzed by Western blot analysis for diabetes-related changes in total p70S6k, mTOR and Akt protein expression. Protein quantifications were done after normalization by the abundance of β-tubulin protein. Results are expressed as a percent of the normal, LNZ value. An asterisk (*) indicates significant differences (P< 0.05) from the lean Zucker value.
with insulin resistance The basal (control) and contraction-induced phosphorylation of p70S6k in TA muscles from lean and obese Zucker rats at 0, 1, and 3 hours after contractile stimulus. p70S6k (Thr 389 & Thr 421/ser 424) phosphorylation was determined by Western blot analysis and immunodetection for phosphorylation on Thr389 andThr421/Ser424. All the protein quantifications were done after normalization by the abundance of β-tubulin protein. An asterisk (*) indicates a significant difference (P < 0.05) from the control within-animal model, and a cross (†) indicates significant difference (P < 0.05) at corresponding time points across animal models.
Katta et al. Page 14
Figure 3. Contraction-induced mTOR (Ser2448) phosphorylation is altered with insulin
resistance The basal (control) and contraction-induced phosphorylation of the mTOR in TA muscles from lean (LNZ) and obese Zucker (OSXZ) rats at 0-, 1-, and 3-hours after HFES. Phosphorylation of mTOR was determined by immunodetection of phosphorylation on Ser2448. An asterisk (*) indicates significant difference (P < 0.05) from the control time point within-animal model, and a cross (†) indicates a significant difference (P < 0.05) at corresponding time points across animal models.
Katta et al. Page 15
Figure 4. Effects of eccentric, maximal muscle contraction in situ on phosphorylation of Akt (Thr308/Ser473) The basal (control) and contraction-induced phosphorylation of the Akt in TA muscles from lean and obese Zucker rats at 0, 1, and 3 hours after contractile stimulus. Akt phosphorylation was determined by Western analysis and immunodetection for Akt phosphorylation on Thr308 and Ser473. An asterisk (*) indicates significant difference (P < 0.05) from the control within-animal model, and a cross (†) indicates significant difference (P < 0.05) at corresponding time points across animal models.
Katta et al. Page 16
Figure 5. Immunoblot analyses of Protein abundance of Raptor, TSC2 and PTEN and phosphorylation of Thr1462 on TSC2 and Phosphorylation of Ser380/Thr382/383 on PTEN in TA muscles from lean and obese Zucker rats at 0, 1, and 3 hours after contractile stimulus.
Katta et al. Page 17
Figure 6. Schematic diagram summarizing alterations in molecules of the signalling pathway leading to protein synthesis in Lean and Obese Zucker rats after High force electrical stimulation (HFES). Molecules shown in dark shaded, medium shaded and empty circles represent no change, complete and incomplete activation, respectively. Molecules shown in dashed rectangles were not measured in this study.
Katta et al. Page 18
Table 1
Body weight and muscle mass of lean and obese (fa/fa) Zucker rats.
Lean Zucker Obese Zucker
Body mass, g 328 ± 12.2 597 ± 21.7*
TA mass, mg 651 ± 9.0 479 ± 20*
An asterisk (*) indicates significant difference (P < 0.05) from the lean Zucker value.