Page 1
African Journal of Applied Research
Vol. 3, No. 1 (2017), pp. 121-134
http://www.ajaronline.com
ISSN: 2408-7920
Copyright ⓒ African Journal of Applied Research 121
LEAN AND SIX SIGMA IMPROVEMENT CONCEPT: AUTOMOBILE
AFTER-SALES SERVICE DELAYS ON CUSTOMER SATISFACTION
IN GHANA
Baidoo, F.1, and
Servo, J. B.
2
1 Department of Mechanical Engineering, Cape Coast Technical University, Cape Coast,
Ghana 2
School of Engineering, Ghana Technology University, Accra, Ghana.
[email protected]
Abstract
Lean and six sigma are continuous improvement methodologies that have evolved from
collections of techniques to comprehensive management systems and popularized by several
high-profile companies. Both methodologies strive to improve customer service leading to
sustained organizational success and both require a supporting organizational culture. The
success and complementary nature of these methodologies have led to their combination into
a single methodology, commonly called Lean Six Sigma. This research employed a case study
approach to gather data on service quality dimension, completion time, time allocation in the
service process, and returned jobs. The study recognizes in broad scope the major quality
challenges that most service garages are faced with. The research approach took different
perspectives through questionnaire administration, direct observations, interview, and data
analysis. The questionnaire administration and direct observations confirmed that customers
were dissatisfied with the after-sales service delivery. Delay and poor quality repair works
have been identified as major issues contributing to customer dissatisfaction in the
automobile repair service garages in Ghana. The DMAIC approach was followed to identify,
measure, and analyze the potential causes of delay and poor quality. The improve and control
phases of DMAIC, lean six sigma tools and techniques were subsequently developed and
recommended to achieve a better after-sales service. The paper recommended that the after-
sales service process could run more efficiently and effectively if sources of delay in
completing repair works can be identified and eliminated.
Keywords: Lean Six Sigma, Service Delivery Delays, Cause and Effect, Customer Satisfaction
INTRODUCTION
In the automobile industry, specifically with after-sales service, quality of repair service
makes the difference between a firm‟s overall success and failure. Profit generated by after-
sales services is often higher than the one obtained with sales; the service market can be four
or five times larger than the market for products and it may generate at least three times the
turnover of the original purchase during a given product‟s life-cycle (Bundschuh and
Dezvane, 2003). Van Iwaarden et al., (2008) are of the view that, the main factor behind
Motorola creating the concept of Six Sigma in the mid-1980s is that, its development was
Page 2
African Journal of Applied Research
Vol. 3, No. 1 (2017), pp. 121-134
http://www.ajaronline.com
ISSN: 2408-7920
Copyright ⓒ African Journal of Applied Research 122
continuous improvement in the manufacture of complex devices involving a large number of
parts with a high probability of defects in the end product.
Anderson and Kovach, (2014) make a good observation in the construction industry and
conclude that successful project completion leads to customer satisfaction. They went ahead
to assert that, schedule delays, however, may be caused by unexpected downtime due to
rework/repair. In the automobile service industry, what customers want is the speed of service
delivery by their respective dealership centre. Besides being a long-term potential revenue
source, the after-sales service constitutes a mean to uncover customer needs and a strategic
driver for customer retention. It represents, in fact, one of the few constant connections that
customers have with a brand influencing customer satisfaction and loyalty (Gallagher et al.,
2005). When poor service is experienced, both the firm and customer are negatively impacted,
the customer receives poor service and the firm loses future potential sales. The quality of a
service and repair works have become even more important in this time of economic recovery
through strengthening customer relationships, attracting customers lost and renewing their
confidence in the firm by means of effective service recovery strategies. The perception of
after-sales as a source of competitive advantage and business opportunity requires a shift from
a traditional product-centric view, in which after-sales is considered a „necessary evil‟, to a
customer-centric view (Lele, 1997).
The vision statement of most auto dealership garage is to be the market leader in the auto
industry by achieving the biggest market share in the transport provision industry. Visions
play an important role in the improvement work for a company. The vision explains the
question: what do we want to become? A vision should contain a clear picture of the direction
of a company‟s striving, and when the goal is reached. According to George (2002), the slow
rate of corporate improvement is not due to lack of knowledge of six sigma methodology or
lean technique, but rather the transition from theory to implementation. The significance of
this paper is for an automobile dealership to improve and maintain world class after sales
service levels. Failure to do so can lead to lower customer satisfaction, patronage and loyalty.
The environment for most of the automobile dealerships is very challenging these days under
the massive global market competition, therefore companies are looking for systematic ways
to cut operation cost, improving workflow rate and repair work quality. In an attempt to
address the challenges confronting the auto service industry, many dealership garages have
resorted to application of quality improvement tools. Tanik and Sen (2012) in their
introductory statement in their paper mentioned that, “As quality management approaches
evolved, six sigma as a methodology has become the most commonly accepted tool of quality
improvement at present. It takes into consideration many aspects of problem-solving
techniques with a project-based perspective” (p342). The production and distribution of
products and services to satisfy customer needs, wants and expectations enable a business to
achieve its primary objective. The quality of after sales service provided by automobile
dealerships has a major influence on customer satisfaction. With the aim of sustaining long
term relationships with their customers, many businesses have changed their strategic focus to
emphasize customer retention (Peng and Wang, 2006). Preserving their long term customer
Page 3
African Journal of Applied Research
Vol. 3, No. 1 (2017), pp. 121-134
http://www.ajaronline.com
ISSN: 2408-7920
Copyright ⓒ African Journal of Applied Research 123
relationships requires that these businesses both measure and appropriately adjust the quality
of their service.
Crouse, and Anglin (1996) are of the view that if the job is not done well the first time it
would lead to shop-come-back. However, there are a number of issues that could lead to shop-
come-back. This could include delay in completing repair works and poor quality work.
However an increased number of returned jobs in a repair garage could lead to lower sales
and consequently affect the centre. The consequences of not satisfying customers in the
competitive automobile environment can be severe. Hoyer and MacInnis (2001), indicate that
dissatisfied customers can decide to discontinue purchasing the good or service and further
complain to the company as well as to a third party and perhaps return the product. They are
of the view that a dissatisfied customer will engage in negative word-of-mouth
communication. Abdul Aziz et al., (2013) assert that customer satisfaction is a measure of
how products and services supplied by a company meet or surpass customer expectation.
They further defined customer satisfaction as the number of customers or percentage of total
customers, whose reported experience with a firm, its products, or its services (ratings)
exceeds specified satisfaction goals. It is against this background that deployment and
implementation of lean six sigma methodology would be crucial to improving after sales
service in the automobile industry.
The paper aims at examining the automobile After-Sales service delays on Customer
satisfaction in Ghana auto service and repair garages. The paper seeks to find out about the
root causes of delay and poor quality works in the automobile dealership service workshops.
Again to establish how service delivery delays influence lean six sigma deployment and
implementation at the auto service workshops. The focus of the paper is to answer questions
like “What are the root causes of delay and poor quality works in the automobile dealership
service workshops?”, “How can service delivery delay, influence lean six sigma quality
methodology implementation on after-sales service in the automobile industry”?
The Concept of Quality and Lean Six Sigma
Historically, quality has been given many different definitions by a lot of writers. Orbak
(2012) explain that the main initiative of lean thinking is to maximize customer value while
eliminating waste. According to Orbak, the critical objective is to offer perfect value to the
customer through a perfect „value creation‟ process that produces no waste. Six Sigma quoted
by Kamran and Sajid (2010) in their paper indicate that “it is an improvement methodology in
the field of Total Quality Management (TQM)” (p745). According to them, it is defined as „a
methodology for pursuing continuous improvement in customer satisfaction and profit that
goes beyond defect reduction and emphasizes business process improvement in general. In
line with what Kamran and Sajid indicated in their paper, Grima et al., (2014) attest to the
fact that six sigma has proven to be a powerful system for improving quality and productivity.
It worth to note that quality practice should focus on today and future customer. The fact that
the quality concept should originate from the needs and wants of the customers was
something that post-war Japanese managers soon became aware of (Bergman and Klefsjö,
2003). Bergman and Klefsjö (2003) define quality as a wider concept where quality is to
satisfy, and preferably exceed, the needs and expectations of the customers. The wider
Page 4
African Journal of Applied Research
Vol. 3, No. 1 (2017), pp. 121-134
http://www.ajaronline.com
ISSN: 2408-7920
Copyright ⓒ African Journal of Applied Research 124
definitions can be interpreted as including internal customers, which can be different
departments within the organization, the co-workers as a group, or the co-workers as
individuals.
Cause and Effect Diagram: A cause and effect diagram is used to identify and analyze a
problem in a team setting. Teams brainstorm to generate categories such as materials,
machines, personnel, environment, etc. Within each category, the team identifies causes that
contribute to the effect (the problem). A cause and effect diagram visually displays these
causes, and helps the team to locate the most significant causes that lead to the problem.
RESEARCH METHODOLOGY
Different techniques such as observation, structured questionnaires and secondary data were
applied in the process for data collection. The case study is selected for this research because
it is the preferred method when attempting to answer “how?” and “what?” research questions
about modern events over which the researcher has no control (Yin, 2003). The research
question in this effort is “How can lean six sigma quality methodology help improve customer
satisfaction on After-Sales-Service in the automobile industry?” Data was collected from a
dealership service garage. Cause and effect diagram also known as the Fish Bone diagram
were used to establish the major root cause to service delays and their effect on customers.
DMAIC framework and a descriptive statistics including mean scores of the Likert scale were
also employed for the study. The standard time for completing routine maintenance service
used for the purpose of the study was 3.00hours
RESULTS AND DISCUSSION
After Sales Service Processes in Auto Service Garage
The key element in determining the level of service quality is customer satisfaction or
dissatisfaction. In this process, the service advisor plays an important role in ensuring that the
customers leave the dealership satisfied. The process begins with service appointment which
helps reduce waiting time during greeting and consulting section. It ensures that the job is
scheduled and completed on the requested date and time. During greeting and consulting,
customers (either cash or credit) submit a repair order and the order is received and processed.
The Service Advisor acknowledges the customer with a smile immediately upon arrival and
listens carefully to the customer‟s needs and prepares the job card based on exactly what the
customer has said. When the job card is prepared, the job scheduler or controller assigns the
job to a technician for execution of the repair work after performing diagnosis. Spare parts
requisition is a prerequisite for all preventive maintenance and repair jobs. A request for parts
is forwarded to parts department by the technician for processing. After completion of the
repair job, the quality control officer inspects the repair work and road tests the vehicle for
final quality checks. When the repair work is certified by the testing officer, the job card is
closed and given to service advisors for bill processing. The vehicle is then driven to the
washing bay for cleaning. After the billing process is completed, the customer is informed
about the bill and collection. During vehicle delivery, the Service Advisor explains the
services and repairs performed in words to the customer for him or her to understand and
Page 5
African Journal of Applied Research
Vol. 3, No. 1 (2017), pp. 121-134
http://www.ajaronline.com
ISSN: 2408-7920
Copyright ⓒ African Journal of Applied Research 125
shows the customer the total charges for labour, the total for parts and the grand total.
Delivery takes place when the customer signs for the repair job and takes delivery of the
vehicle. After vehicle delivery, the customer is contacted within three days to confirm that the
work was performed to the customer‟s satisfaction. This is done to respond to any concerns or
complaints as a top priority to ensure an ongoing relationship.
Sources of Delay
Figure 1 displays the percentages of responses to question on delay in completing the repair
works. The questions were aimed at establishing the degree to which the technicians and
supervisors agreed or disagreed that some service processes cause delay in completing the
repair work. Figure 1 indicates that 58% of the respondents strongly agreed that parts supply
causes delay; 42% just agreed to the statement. This shows that 100% agreed that delay was
caused by parts supply. Other areas which contributed significantly to delay were vehicle
delivery and road testing. The remaining areas which did not affect delivery time were job
allocation, bill processing, and receipt issue. Generally, the graph suggests that most of the
delays are caused by parts supply, vehicle delivery, road testing, diagnosis and vehicle
washing.
Figure 1:Views on Sources of Delay
Completion Time
In order to confirm the sources of delay in completing routine maintenance service, data on
completion time for 200 vehicles was collected. Ideally, a service process flat rate time of
approximately 180 minutes for up to 60,000 km routine service was used for the purpose of
this study. Figure 2 showed data on completion time for two hundred vehicles at the express
section and time allocation for each step in the service process.
74 88
15
100
74
95 86
23 25
91
0
20
40
60
80
100
120
Greeting&
Consulting
Diagnosis JobAllocation
PartsRequest
WorkProcessing
RoadTesting
VehicleWashing
BillProcessing
ReceiptIssue
VehicleDelivery
Re
spo
nse
s
Views on Sources of Delay
Response
Page 6
African Journal of Applied Research
Vol. 3, No. 1 (2017), pp. 121-134
http://www.ajaronline.com
ISSN: 2408-7920
Copyright ⓒ African Journal of Applied Research 126
Figure 2 Time Allocation
The graph showed in figure 2 represents time allocation for each service process. Work
processing registered a maximum time of 116 minutes, while parts supply recorded 39
minutes. Job allocation and receipt issue accounted for 10 minutes each, while the remaining
25 minutes, 30 minutes, 15 minutes, 24 minutes, 12 minutes and 20 minutes for greeting,
diagnosis, road testing, vehicle washing, bill processing and vehicle delivery respectively.
Returned Jobs
The quality of repair jobs in automobile dealerships significantly affects customer satisfaction
and retention. Returned jobs are repair works brought back for rework because of poor
workmanship. The study attempted to determine the sigma level of the service garage by
collecting data on returned jobs from January through to November. In all 5976 jobs were
received and a total of 313 were reported as return jobs representing 5.24 %. Figure 3 showed
the number of returned jobs (rework) for a period of 11 months. Returned jobs were compared
with total vehicle received for the period under consideration and the percentage of jobs
calculated against the total number of vehicles received.
Figure 3: Returned Jobs vrs Total Vehicle Received
The Analyze Phase
The third phase of the DMAIC framework is the analyze phase. After gathering data and
establishing the time taken for a technician to complete a routine maintenance service and the
number of returned jobs, the root causes of the delay and poor quality would be determined.
25 30 10
39
116
15 24 12 10 20
0
50
100
150
GreetingDiagnosisJobAllocation
PartsRequest
WorkProcessing
RoadTesting
VehicleWashing
BillProcessing
Receiptissue
VehicleDelivery
Tim
e (
min
)
Time Allocation
Time (min)
0
200
400
600
800
Total Vehicle Received
Returned Jobs
Page 7
African Journal of Applied Research
Vol. 3, No. 1 (2017), pp. 121-134
http://www.ajaronline.com
ISSN: 2408-7920
Copyright ⓒ African Journal of Applied Research 127
For this case, Cause-and-Effect Diagram was used to identify and determine the effects of the
potential causes to the problems.
Analysis of Completion Time
The data on completion time for two hundred vehicles was reviewed and analysed to
determine the mean and standard deviation using statistical method. The results showed that
the mean delivery time for completing routine maintenance service is 5.00 hours and standard
deviation of 0.97.
Table 1:Data on Completion Time
Class Interval Frequency
Class Mid-
point (X) fx
Deviation, d
= (X-Xm) fd2
3.5 - 3.7 21 3.6 75.6 -1.4145 42.01701525
3.8 - 4.0 19 3.9 74.1 -1.1145 23.60009475
4.1 - 4.3 20 4.2 84 -0.8145 13.268205
4.4 - 4.6 16 4.5 72 -0.5145 4.235364
4.7 - 4.9 26 4.8 124.8 -0.2145 1.1962665
5.0 - 5.2 19 5.1 96.9 0.0855 0.13889475
5.3 - 5.5 21 5.4 113.4 0.3855 3.12081525
5.6 - 5.8 15 5.7 85.5 0.6855 7.04865375
5.9 - 6.1 12 6 72 0.9855 11.654523
6.2 - 6.4 9 6.3 56.7 1.2855 14.87259225
6.5 - 6.7 13 6.6 85.8 1.5855 32.67953325
6.8 - 7.0 9 6.9 62.1 1.8855 31.99599225
∑f=200
∑fx=1002.9
∑fd2=185.82795
Source: field work 2015
Mean, Xm = ∑fx ∑f
Xm = 1002.9/200
Xm = 5.0145
Xm = 5.00 hours
Page 8
African Journal of Applied Research
Vol. 3, No. 1 (2017), pp. 121-134
http://www.ajaronline.com
ISSN: 2408-7920
Copyright ⓒ African Journal of Applied Research 128
Standard deviation, σ = { ∑fd2 / (N-1) }
σ= (185.82795/199)
σ= 0.97
The service process mean is 5.00 0.97 which is outside the stated promised time of 3.00
hours stated in the flat rate time for completion of routine maintenance service.
Analysis of Returned Jobs
To tackle the problem of returned job, data on returned jobs was collected as shown in Table
2. Analysis of the data gave an average of 5.25 0.6% returned job in each month. Relative to
the 6-sigma quality standard of 3.4 Defect per Million Opportunities, the high returned job
rate of 52500 per 1000000 opportunities gave a six sigma value of 3.13, which is an
indication of the poor quality service of the garages after sales service operation.
Table 2: Analysis of Data on Returned Jobs
Month
Total
Vehicle
Received
Returned
Jobs Percentage of
Returned Jobs
Deviation, d
= X-Xm
d2
January 513 23 4.483430799 -0.766569 0.587628
February 562 28 4.982206406 -0.267794 0.071713
March 543 26 4.788213628 -0.461786 0.213247
April 517 31 5.996131528 0.7461315 0.556712
May 520 27 5.192307692 -0.057692 0.003328
June 578 25 4.325259516 -0.92474 0.855145
July 506 32 6.324110672 1.0741107 1.153714
August 538 30 5.576208178 0.3262082 0.106412
September 522 29 5.555555556 0.3055556 0.093364
October 604 34 5.629139073 0.3791391 0.143746
November 573 28 4.886561955 -0.363438 0.132087
∑X = 57.74
∑d2=3.92
Source: field work 2015
Page 9
African Journal of Applied Research
Vol. 3, No. 1 (2017), pp. 121-134
http://www.ajaronline.com
ISSN: 2408-7920
Copyright ⓒ African Journal of Applied Research 129
Mean, Xm = ∑X/ N
Xm =57.74 /11
Xm = 5.25
Standard deviation, σ = {∑fd2 / N}
σ= (3.92/11) σ = 0.6
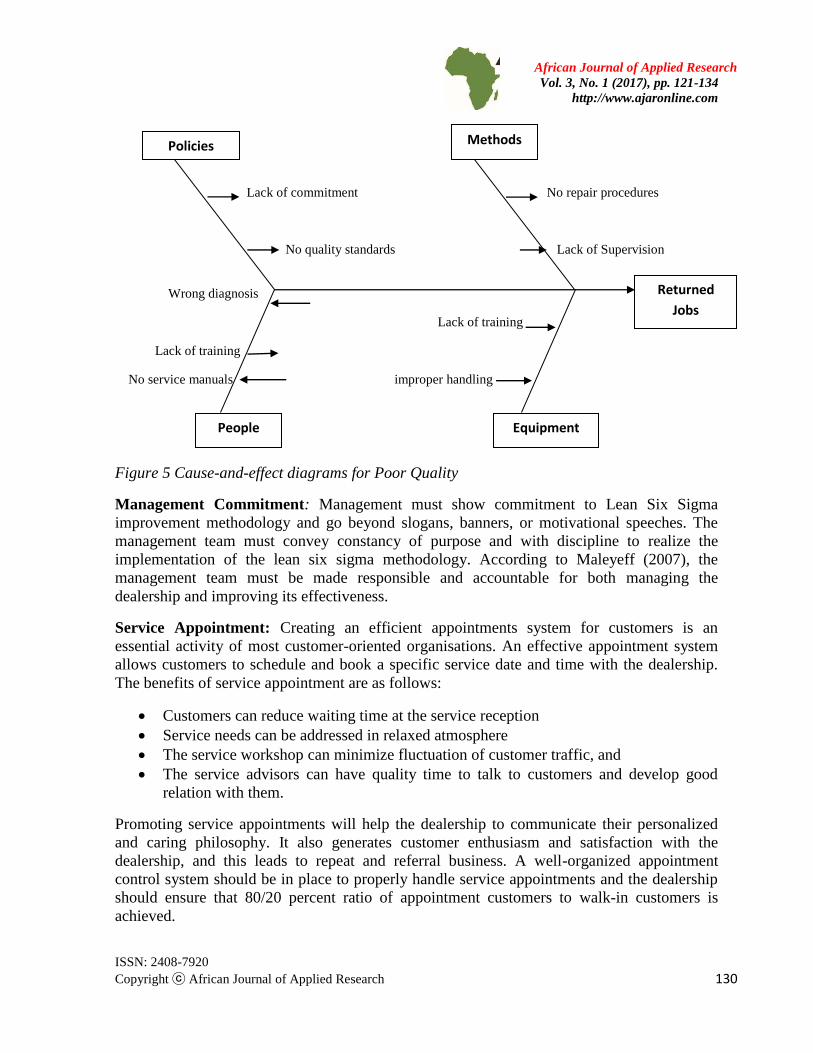
Cause-and-Effect Analysis: The cause-and-effect diagrams have been developed based on
observations and responses from technicians and supervisors on sources of delay in figure 1
and time allocation in figure 2. The Cause-and-Effect diagrams for delay and poor quality are
shown in figure 4 and figure 5, respectively. In conducting the analysis for delay, five main
categories were created, including Equipment, Spare parts, Diagnosis, road testing and
washing. Also, four categories were created for poor quality work as policies, methods,
people and equipment. Generated under each of the categories were causes that contributed to
the problems.
No Testing officer Queuing in parts department
Inexperience Unavailability of parts
No control No tools
No orientation
Lack of manpower Lack of
Capacity maintenance
No washing
machine Attitude Broken down equipment
Figure 4 Cause-and-effect diagrams for Delay
Delay in service delivery
Washing
Diagnosis
Equipment
Spare Parts Road Testing
Management
Page 10
African Journal of Applied Research
Vol. 3, No. 1 (2017), pp. 121-134
http://www.ajaronline.com
ISSN: 2408-7920
Copyright ⓒ African Journal of Applied Research 130
Lack of commitment No repair procedures
No quality standards Lack of Supervision
Wrong diagnosis
Lack of training
Lack of training
No service manuals improper handling
Figure 5 Cause-and-effect diagrams for Poor Quality
Management Commitment: Management must show commitment to Lean Six Sigma
improvement methodology and go beyond slogans, banners, or motivational speeches. The
management team must convey constancy of purpose and with discipline to realize the
implementation of the lean six sigma methodology. According to Maleyeff (2007), the
management team must be made responsible and accountable for both managing the
dealership and improving its effectiveness.
Service Appointment: Creating an efficient appointments system for customers is an
essential activity of most customer-oriented organisations. An effective appointment system
allows customers to schedule and book a specific service date and time with the dealership.
The benefits of service appointment are as follows:
Customers can reduce waiting time at the service reception
Service needs can be addressed in relaxed atmosphere
The service workshop can minimize fluctuation of customer traffic, and
The service advisors can have quality time to talk to customers and develop good
relation with them.
Promoting service appointments will help the dealership to communicate their personalized
and caring philosophy. It also generates customer enthusiasm and satisfaction with the
dealership, and this leads to repeat and referral business. A well-organized appointment
control system should be in place to properly handle service appointments and the dealership
should ensure that 80/20 percent ratio of appointment customers to walk-in customers is
achieved.
Returned
Jobs
People
Methods
Equipment
Policies
Page 11
African Journal of Applied Research
Vol. 3, No. 1 (2017), pp. 121-134
http://www.ajaronline.com
ISSN: 2408-7920
Copyright ⓒ African Journal of Applied Research 131
Customer Reception: Analysis of the questionnaires showed that most customers were not
satisfied with the customer service care during their interaction with the dealership. Also, the
customers complained about the limited parking lots which forced some of them to park their
vehicles on the road. For the dealership to get its customers satisfied, the service advisors
must be trained to provide good customer service. A good customer service will allow the
dealership to build a competitive advantage, create a brand name, and obtain loyalty in their
customer base. Therefore, retaining new customers comes from stealing them away from the
competition. The dealership must provide its customers with proper parking lots as the
parking lots give first impression of the dealership.
Quality of Repair Work: Much waste has been created in the dealership because quality was
not right the first time. Some customers complained of poor quality work and unnecessary
waiting to solve their problem. An Analysis of data on returned jobs at the Dealership showed
that over 5 percent of the repair works were not done right the first time leading to customer
dissatisfaction. The dealership was, of course, pleased that demand for after-sales servicing
with the Centre was strong and did not want to miss the opportunity to achieve great financial
gains. In an effort to generate enough sales to meet this demand, Management had chosen to
place emphasis on the service target, not quality. Because of this, the quality of the repair
works suffered, leading to a high number of returned jobs. To solve the quality issues with
repair works, the dealership has to employ final quality inspectors and provide Quality
Control Bay with required tools to perform the final quality checks before the vehicle is
tested. The technicians should follow standard work procedures and carry out proper
diagnosis before carrying out repair works. The dealership should include test drive in the
final inspection if the repair involves drivability, noises, vibration or other problems that are
difficult to determine.
Workshop Loading: An observation showed that there is serious congestion in the dealership
thereby impeding smooth flow of work. This is because service advisors received a lot of cars
in a day without taking into account the workshop capacity. To achieve an efficient work
flow, job progress control system must be well organized to ensure that all work is completed
on schedule and the vehicle is returned to the customer at the promised delivery time. A
monitoring and feedback system should also be in place to continually monitor the job
progress and report any signs of work delay which may affect the promised delivery time.
Reliable Equipment: An interview with the technicians in the service department showed
that the tools and equipment used in the workshop are not of high quality as evidenced by
frequent breakdowns. However, given that the dealership is a service industry where repair
jobs are required to be completed on time, one would have assumed that the dealership will
used state-of-the-art equipment to support its service operations. Based on this fact, the
dealership should procure quality tools and equipment and employ a maintenance officer or
train some of the Technicians to carry out preventive maintenance works. Also, standard
operating procedures for the tools and equipment must be clearly displayed for all technicians
to follow.
Employee Training: Many dealerships neglect their staffs as they expend their energy on
achieving lean process. The employees are drivers of the lean process and the problem
Page 12
African Journal of Applied Research
Vol. 3, No. 1 (2017), pp. 121-134
http://www.ajaronline.com
ISSN: 2408-7920
Copyright ⓒ African Journal of Applied Research 132
solvers. Without the employees, transition to lean approach cannot be achieved. The
employees must, therefore, be properly trained to become leaders in the lean six sigma
initiative. It is recommended, therefore, that the dealership provides training for both service
advisors and technicians.
Spare Parts Supply: From the measure phase, it was found that the parts department used 39
minutes to supply parts to the workshop. This fact strongly suggests that the parts department
has to improve their supply system. To achieve an improvement in the parts supply system,
the service department must be provided with a transit spare parts store to minimize
unnecessary movement and waiting by the technicians. The parts department can also adopt a
parts kit system for service intervals of 5000km – 100,000km to minimize the waiting time.
Deployment of lean six sigma cannot be achieved unless the parts department is efficient,
since the parts department has to be as capable as the service department at delivering
excellent-quality service just in time.
Vehicle Washing: The importance of quality car wash is often overlooked by many
automobile dealerships. As the vehicle plies the road, dirt and debris are constantly collected
on the vehicle‟s paint, frame and body. The accumulations of these matters often take a toll on
the paint, weakening and eventually making it look dull. An observation at the dealership
showed that most of the vehicles serviced were either not washed or improperly washed. For
the dealership to solve the problem of car washing, a professional should be employed to
beef-up the manpower at the washing bay and an automatic car washing equipment be
procured to enhance quality of car washing.
Vehicle Delivery: Vehicle delivery is an important point in the service delivery process. This
means that the vehicle must be ready for the customer at the promised time and all necessary
arrangements made in advance to ensure that the customer is satisfied. Most at times,
customers get dissatisfied because they have to wait at the Cashier‟s counter for payment. It is
imperative that service advisors ensure quality delivery so that the customer is completely
satisfied with all repair work done as this will help to instill confidence in the customer.
Customer Follow-up: An effective follow-up system helps ensure that dissatisfied customers
are given the proper attention they require right away. Follow-up contact should be made to
every customer after each service visit to find out whether the customer is satisfied with the
service provided and, at the same time, to show proper customer care. It is important that an
appropriate person with a sociable personality be assigned to be responsible for customer
follow-up, preferably on a full time basis.
CONCLUSION
Delivery time was considered as the main determinant of customer satisfaction. The study
showed that 82% of the customers were dissatisfied with delivery time. Analysis of data on
completion time for routine maintenance service indicated a delivery time of 5.00 ± 0.97
hours. The percentage of returned jobs in a month gave an average value of 5.25 ± 0.6%.
Relative to six sigma quality standards, the average rate of returned job gave a six sigma value
of 3.13. Findings suggest that delay in completing the repair work depends mainly on spare
Page 13
African Journal of Applied Research
Vol. 3, No. 1 (2017), pp. 121-134
http://www.ajaronline.com
ISSN: 2408-7920
Copyright ⓒ African Journal of Applied Research 133
parts supply, broken-down equipment, road testing, and vehicle washing. Additionally, the
empirical study established that the high rate of returned jobs was caused mainly by wrong
diagnosis.
REFERENCES
Abdul Aziz, A. R., Nishazini, M. B., and Noorashikin, N. A. Z. (2013). The Impact of Quality
Standards and a Special Customer Service Program on Customer Satisfaction Index
(CSI) For Kpj Seremban Specialist Hospital, Malaysia. IOSR Journal of Business and
Management, 4(3), 114-119.
Anderson, N. C., and Kovach, J. V. (2014). Reducing welding defects in turnaround projects:
A lean six sigma case study. Quality Engineering, 26(2), 168-181.
Bergman, B., and Klefsjö, B. (2010). Quality from customer needs to customer satisfaction.
Student literature AB. ISBN: 978-91-44-05942-6 http://www.diva-portal.org
Retrieved December 3, 2016
Bundschuh, R. G., and Dezvane, T. M. (2003). How to make after-sales services pay off.
McKinsey Quarterly, 4:116-127
Crouse, H., and Anglin, L. (1996). Automotive Tune up and Engine Performance, 3rd edition,
McGraw-Hill Inc.
Gallagher, T., Mitchke, M.D. and Rogers, M. C. (2005). Profiting from spare parts. The
McKinsey Quarterly.
George, M. L. (2002) Lean Six Sigma: Combining Six Sigma Quality with Lean Speed. New
York, NY: McGraw-Hill.
Grima, P., Marco-Almagro, L., Santiago, S., & Tort-Martorell, X. (2014). Six Sigma: hints
from practice to overcome difficulties. Total Quality Management & Business
Excellence, 25(3-4), 198-208.
Hoyer, W. D., and MacInnis, D. J., (2001). Consumer Behaviour. 2nd ed., Boston, Houghton
Mifflin Company.
Kamran, M. and Ali, S. (2010). Critical Analysis of Six Sigma Implementation Total
Quality Management. Vol. 21, No. 7, 745–759
Lele, M. M. (1997). After-sales service-necessary evil or strategic opportunity? Managing
Service Quality: An International Journal, 7(3), 141-145.
Maleyeff, J. (2007). Improving Service Delivery in Government with Lean Six Sigma:
www.cabq.gov Retrieve 24 October 2011
Orbak, Â. Y. (2012). Shell scrap reduction of foam production and lamination process in
automotive industry. Total Quality Management & Business Excellence, 23(3-4), 325-
341.
Peng, L. Y., and Wang, Q. (2006). Impact of Relationship Marketing Tactics on Switchers
and Stayers in a Competitive Service Industry. Journal of Marketing Management,
V.22, pp.25-59
Tanik, M., and Sen, A. (2012). A six sigma case study in a large-scale automotive supplier
company in Turkey. Total Quality Management & Business Excellence, 23(3-4), 343-
358.
Van Iwaarden, J., Van der Wiele, T., Dale, B., Williams, R., and Bertsch, B. (2008). The Six
Page 14
African Journal of Applied Research
Vol. 3, No. 1 (2017), pp. 121-134
http://www.ajaronline.com
ISSN: 2408-7920
Copyright ⓒ African Journal of Applied Research 134
Sigma improvement approach: a transnational comparison. International Journal of
Production Research, 46(23), 6739-6758.
Yin, R. K. (2003). Case Study Research: Design and Methods,(3rd) Sage Publications.
Thousand Oaks, California.