18th LACCEI International Multi-Conference for Engineering, Education, and Technology: “Engineering, Integration, and Alliances for a Sustainable Development” “Hemispheric Cooperation for Competitiveness and Prosperity on a Knowledge-Based Economy”, July 27-31, 2020, Virtual Edition. 1 Lean Manufacturing Model of Waste Reduction Using Standardized Work to Reduce the Defect Rate in Textile MSEs Nicole Barrientos-Ramos 1 , Luz Tapia-Cayetano 1 , Fernando Maradiegue-Tuesta, Mg 1 and Carlos Raymundo, PhD 2 1 Ingeniería Industrial, Universidad Peruana de Ciencias Aplicadas, Lima, Perú. [email protected], [email protected], [email protected]2 Dirección de Investigación, Universidad Peruana de Ciencias Aplicadas, Lima, Perú, [email protected]Abstract–The textile industry currently represents 7.2% of the manufacturing companies’ GDP. However, it has experienced severe sales volatility owing to the high competitiveness, primarily mainly from Southeast Asian countries. Low productivity, process variability, operating cost overruns or long lead times are the main causes of the sector gap that must be attacked. Thus, this research is aims to contribute to the textile industry with methodologies and tools to gain a competitive advantage and reduce its operating cost overruns. We analyzed a real case study applied to a company called TEXTIL S.AC., following the implementation of combined work to integrate labor, work method, and machines to reduce the manufacturing cycle time by 300 seconds and, thus, waste such as defective products that generate expenses for the company. The results of the implementation and validation through process simulation showed an 8% reduction in the defect rate and a 32% improvement in the lead times. Keywords—Waste reduction, Lean Manufacturing, Standard work, Textile industry, 5S´s in textile industry. I. INTRODUCTION The textile industry is an important source of income and employment for many developing countries. In the last decade, a significant increase in the textile and clothing trade has been observed among Asian countries. However, this trade is skewed toward a handful of countries in East and South Asia. Similarly, China (together with Hong Kong) dominates this trade with a majority share of up to 65%. Other significant suppliers are India, South Korea, and Japan, with a 7%, 5%, and 4% share, respectively [1]. The greatest changes in the textile industry occurred in the 1960s, following the rapid emergence of new production centers in the Asian region. However, the industrialized countries managed to maintain their competitive advantage due to the production equipment modernization [2]. In Peru, the textile sector represents 7.2% of the manufacturing companies’ GDP, according to the information extracted from Produce (Ministry of Production) [3]. Thus, the textile industry, having a strong impact on the economy, is a relevant sector in the national economic activity and a significant national employment promoter that generates around 422 thousand direct jobs annually. However, in Peru, the textile industry faces difficult times, evidenced through a decrease in the sales, both domestically and overseas. Facho [4] states that it is more complicated to expand business and close orders because the main clothing brands have relocated to Southeast Asia, carrying with them significant production volumes at low prices with which the national textile sector cannot compete. In part, this variation is owing to the manufacturing production and its divisions. Thus, we must investigate and tackle the main causes that lead customers to choose Asian garments over domestic products. After analyzing the national market, we identified the potential causes that lead to sales variations, such as high lead times or excessive amount of reprocessed garments. In view of this, several authors have studied the textile industry to seek solutions to the main issues. They state that to achieve successful business practices, both medium and small-sized enterprises should use effective strategies such as Lean tools in a given process to face the changing requirements of their customers and the business environment [5]. In production systems, defective products are one of the wastes with the greatest negative impact on delivery times, cost, quality, and non-compliance with standards. However, according to various studies, companies implementing tools such as Value Stream Mapping (VSM), 5S, Kanban and Total Productive Maintenance (TPM) manage to reduce not only the number of defective products but also the cycle time of garment production and the costs incurred in, given that these solutions are appropriate to deal with waste- related problems [6] [7]. Based on the aforementioned, the purpose of this research is to provide a Lean Manufacturing model for waste reduction to tackle the Peruvian textile industry problems. We intend to show that the engineering tools can achieve significant and high-impact changes not only in the company under study but also in all the Peruvian textile companies. The methodology of the combined work under the Lean approach aims to improve productivity, thus reducing operating cost overruns by integrating all the company’s resources and identifying those non-value-added manual activities. The goal is to achieve great results with low investment, given that the sector mostly counts on micro and small enterprises (MSEs) that monopolize a large part of the market. This document will be divided into four sections for conducting the research development. The first section will present the literature review or state of the art, consisting in an exhaustive review of studies previously conducted and quoting experts in the field. The second section will detail the contribution because of previous cases reviewed for a specific Digital Object Identifier (DOI): http://dx.doi.org/10.18687/LACCEI2020.1.1.356 ISBN: 978-958-52071-4-1 ISSN: 2414-6390
Transcript
18th LACCEI International Multi-Conference for Engineering, Education, and Technology: “Engineering, Integration, and Alliances for a Sustainable Development” “Hemispheric Cooperation for Competitiveness and Prosperity on a Knowledge-Based Economy”, July 27-31, 2020, Virtual Edition. 1
Lean Manufacturing Model of Waste Reduction
Using Standardized Work to Reduce the Defect Rate
in Textile MSEs
Nicole Barrientos-Ramos1, Luz Tapia-Cayetano1, Fernando Maradiegue-Tuesta, Mg1 and Carlos Raymundo, PhD2
1 Ingeniería Industrial, Universidad Peruana de Ciencias Aplicadas, Lima, Perú. [email protected],
improvement, and, above all, sustainable business practices.
[9][10][11]. In general terms, one of the main benefits and
results of Lean tool implementation in the textile industry are
the improvement in production line efficiency, inventory
reduction, improved production process, reduction of
defective products, and equipment performance [14] [15].
C. Standardized work applied to waste reduction models in
the textile industry
Authors agree that companies must follow a methodology
intended to counteract situations, such as the manufacturing
process variability, the lack of a detailed sequence of work
procedures, and the great product diversity, through the
standardized work method [16] [17]. The action-research
methodology of standardized work can be implemented in a 5-
stage cycle: 1) Diagnosis, which is understanding how the
company works and what should be done; 2) Action planning,
which consists of proposing a table combining the information
on the process times and their visual representation; 3)
Standard action table, which provides standard operation times
for a work section; 4) Evaluation; and 5) learning
specifications. The main results, such as the increased part
production capacity per worktable allowed, were shown
comparing the current state with the improved one. This was
25% higher than the initial takt time. These results obtained in
the workshop, where the standardized work was implemented,
allowed to determine the work station capacity, a better visual
representation of the operations and the cycle time, which
provided benefits to the process, increasing its flexibility,
reducing manufacturing errors, and decreasing the process
variability [16] [17]. Based on the implementation and
analysis of the authors, by integrating standardized work with
information systems, we managed to improve the
effectiveness and precision of standardized times by 38% [17]
[18], making the method appropriate for waste reduction in the
industry.
D. Lean manufacturing and standardized work applied to
waste reduction models in the textile industry.
Many organizations struggle to implement Lean tools,
especially in SMEs, which deal with scarce resources or
complex processes [19]. Therefore, some authors developed
research on the Lean tool applicability in various industries.
Many small-scale manufacturing companies lack a system for
guaranteeing that they will deliver a quality product to their
customers, and often, their operation is considered inefficient
[19]. An interesting method based on quality, time and
flexibility KPIs, among others, was used to identify the most
appropriate Lean tool in a MSE [20] [21]. Likewise, to
achieve Lean tool applicability in MSEs, we must analyze the
18th LACCEI International Multi-Conference for Engineering, Education, and Technology: “Engineering, Integration, and Alliances for a Sustainable
Development” “Hemispheric Cooperation for Competitiveness and Prosperity on a Knowledge-Based Economy”, 29-31 July 2020, Buenos Aires, Argentina. 3
different types of waste and identify which process tools are to
be applied based on the literature and the applicability review
in different case studies [11] [18]. In this regard, the
implementation of LM standards with tools such as VSM, 5S,
TPM, SMED, and standardized work has achieved waste
reduction and production optimization. The main results were
a reduction in machine stoppage frequency, waste, repetitive
steps, as well as an improvement in quality and, above all,
sustainable business practices. This analysis was performed to
help companies adopt the most appropriate tool for their
purpose and specific goals, thus eliminating difficulties in
identifying the best strategy [11][19][21].
III. CONTRIBUTION
A. Rationale
The main current problems experienced by the textile
sector are, as already mentioned, low productivity, process
variability, operating cost overruns, and long lead times,
among others, giving rise to the sales gap that affects the
textile industries. Thus, we proposed a production model
based on standardized work and Lean tools to attack the
variability causes in the textile sector.
Based on the typologies described, we found that
standardized work is the most effective tool in terms of
reduction of times and number of defects caused in a
manufacturing company [16] [17]. We showed that using a
standard work combination sheet in a workshop under study
increased the workstation’s takt time by 25%. Another key
tool is the 5S method, which, applied in a case study, reduced
up to 80% the waste costs over a 3-year period [22]. To
complete the research scope, we sought a third tool that, in
conjunction with standardized work and 5S’s, would provide
support to achieve significant organizational results. Thus, we
used preventive maintenance, as previous research shows
results of up to 98.5% machine availability and 85.5%
machine reliability, entailing an increase in productivity of up
to 65% [21]. According to the literature review analysis, the
proper integration of these three tools is expected to achieve
relevant benefits in the present case study.
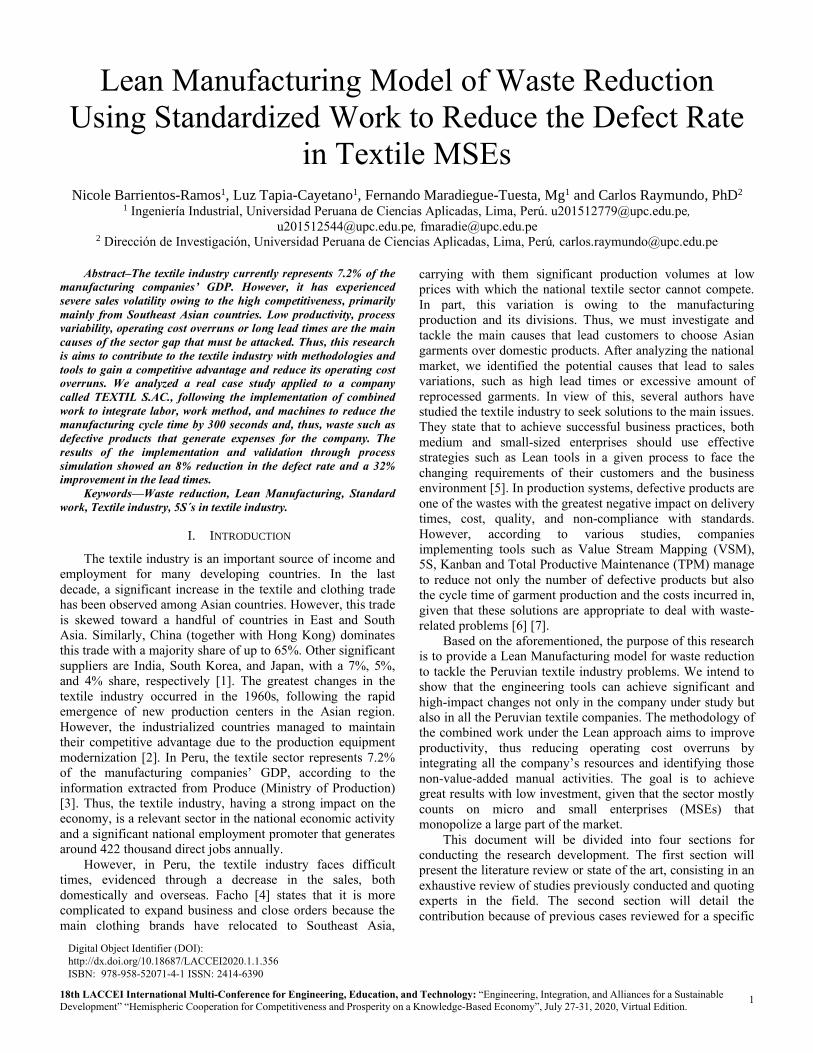
B. Proposed model
Exhibited in Fig. 1 is the proposed waste reduction model
based on the analysis described above, to outline the stages to
be followed for its implementation.
C. Model components
In this section, we will detail the components of the
solution design and proposal.
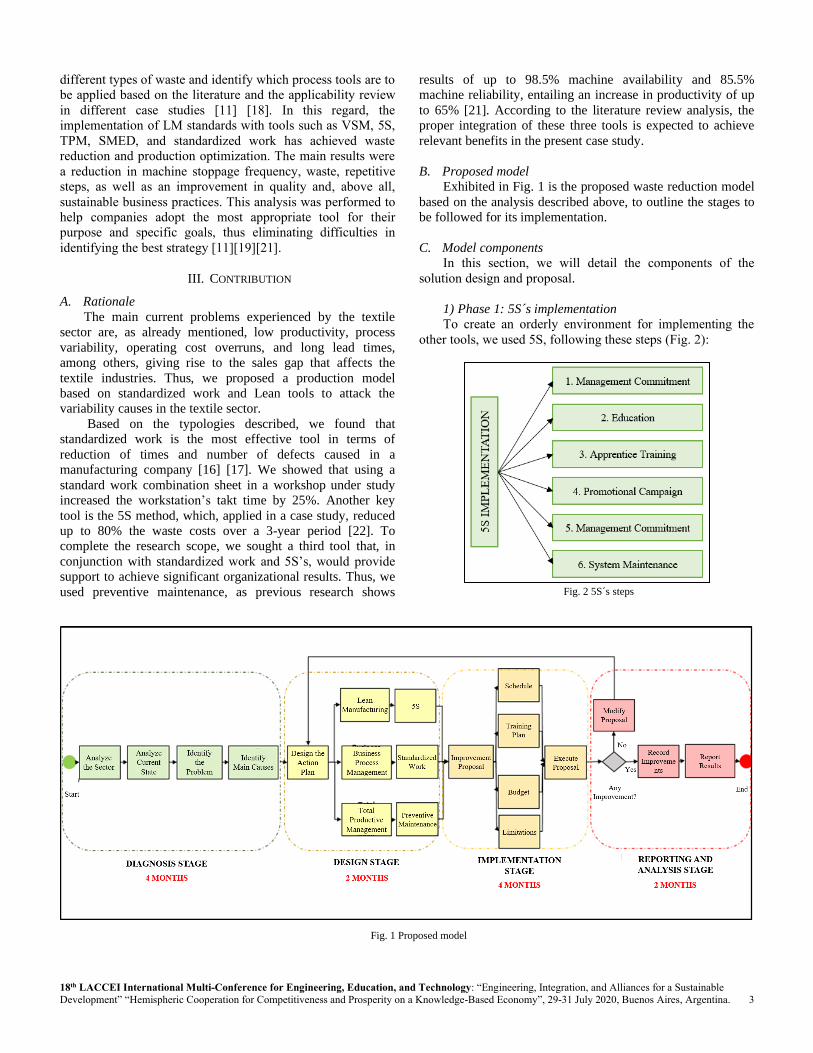
1) Phase 1: 5S´s implementation
To create an orderly environment for implementing the
other tools, we used 5S, following these steps (Fig. 2):
Fig. 2 5S´s steps
Fig. 1 Proposed model
18th LACCEI International Multi-Conference for Engineering, Education, and Technology: “Engineering, Integration, and Alliances for a Sustainable
Development” “Hemispheric Cooperation for Competitiveness and Prosperity on a Knowledge-Based Economy”, 29-31 July 2020, Buenos Aires, Argentina. 4
• Sort: This first concept is used to eliminate unwanted
or unnecessary items.
• Set in Order: The second “S” is used for an optimal
distribution of the work area items.
• Shine: An evaluation checklist was developed for the
cleaning inspections to be performed every morning.
• Standardize: Standardization is used to integrate and
maintain the first three “S’s” into the routine work.
• Sustain: Self-discipline is crucial to ensure that any
implementation will last over time and continue to
improve the state of a given process.
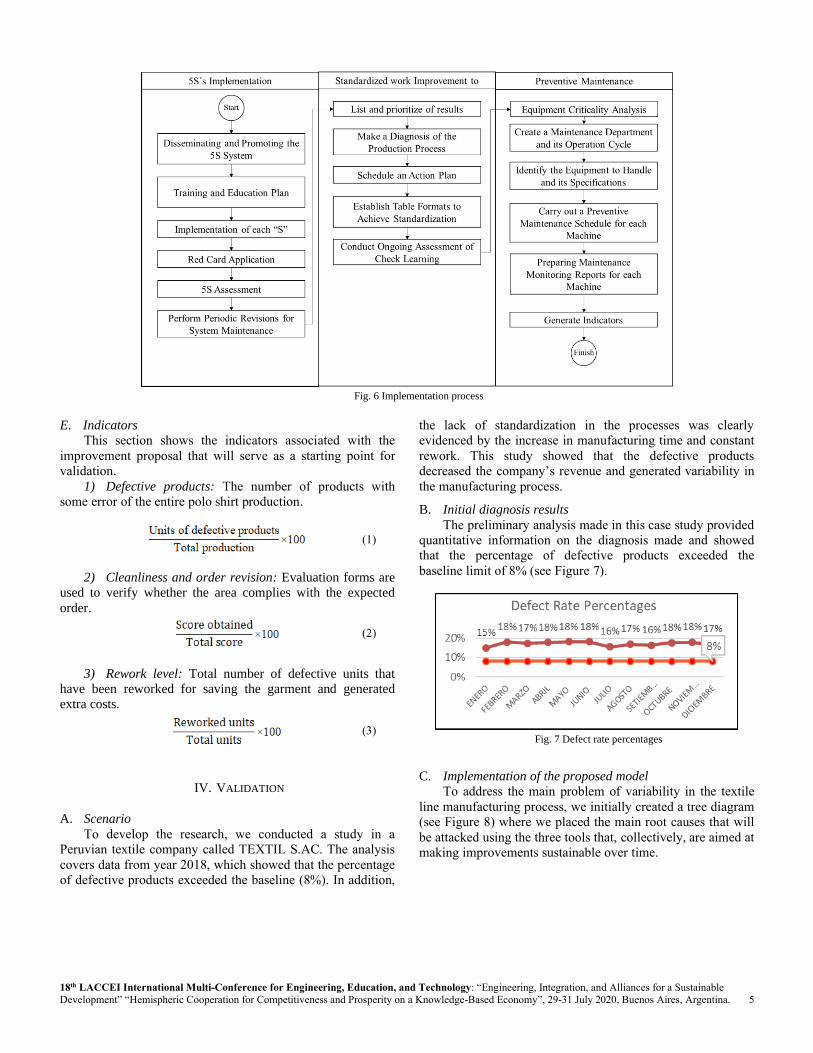
2) Phase 2: Standardized work
The following activities were considered to implement the
standardized work:
Fig. 3 Standardized work phases
This model depicted two different ways, in terms of
sequence, for manufacturing polo shirts. To standardize the
process, the work sequence that takes the least time to
document the procedure was selected and rated “standard”
(Fig.4).
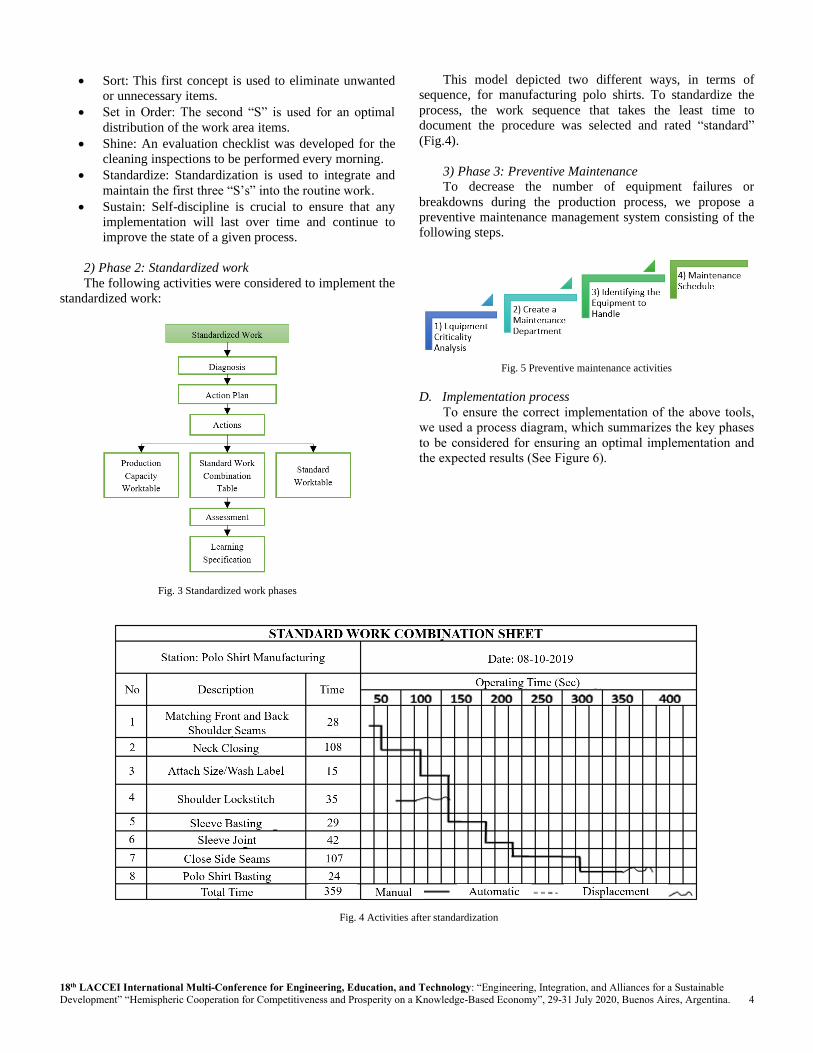
3) Phase 3: Preventive Maintenance
To decrease the number of equipment failures or
breakdowns during the production process, we propose a
preventive maintenance management system consisting of the
following steps.
Fig. 5 Preventive maintenance activities
D. Implementation process
To ensure the correct implementation of the above tools,
we used a process diagram, which summarizes the key phases
to be considered for ensuring an optimal implementation and
the expected results (See Figure 6).
Fig. 4 Activities after standardization
18th LACCEI International Multi-Conference for Engineering, Education, and Technology: “Engineering, Integration, and Alliances for a Sustainable
Development” “Hemispheric Cooperation for Competitiveness and Prosperity on a Knowledge-Based Economy”, 29-31 July 2020, Buenos Aires, Argentina. 5
Fig. 6 Implementation process
E. Indicators
This section shows the indicators associated with the
improvement proposal that will serve as a starting point for
validation.
1) Defective products: The number of products with
some error of the entire polo shirt production.
(1)
2) Cleanliness and order revision: Evaluation forms are
used to verify whether the area complies with the expected
order.
(2)
3) Rework level: Total number of defective units that
have been reworked for saving the garment and generated
extra costs.
(3)
IV. VALIDATION
A. Scenario
To develop the research, we conducted a study in a
Peruvian textile company called TEXTIL S.AC. The analysis
covers data from year 2018, which showed that the percentage
of defective products exceeded the baseline (8%). In addition,
the lack of standardization in the processes was clearly
evidenced by the increase in manufacturing time and constant
rework. This study showed that the defective products
decreased the company’s revenue and generated variability in
the manufacturing process.
B. Initial diagnosis results
The preliminary analysis made in this case study provided
quantitative information on the diagnosis made and showed
that the percentage of defective products exceeded the
baseline limit of 8% (see Figure 7).
Fig. 7 Defect rate percentages
C. Implementation of the proposed model
To address the main problem of variability in the textile
line manufacturing process, we initially created a tree diagram
(see Figure 8) where we placed the main root causes that will
be attacked using the three tools that, collectively, are aimed at
making improvements sustainable over time.
18th LACCEI International Multi-Conference for Engineering, Education, and Technology: “Engineering, Integration, and Alliances for a Sustainable
Development” “Hemispheric Cooperation for Competitiveness and Prosperity on a Knowledge-Based Economy”, 29-31 July 2020, Buenos Aires, Argentina. 6
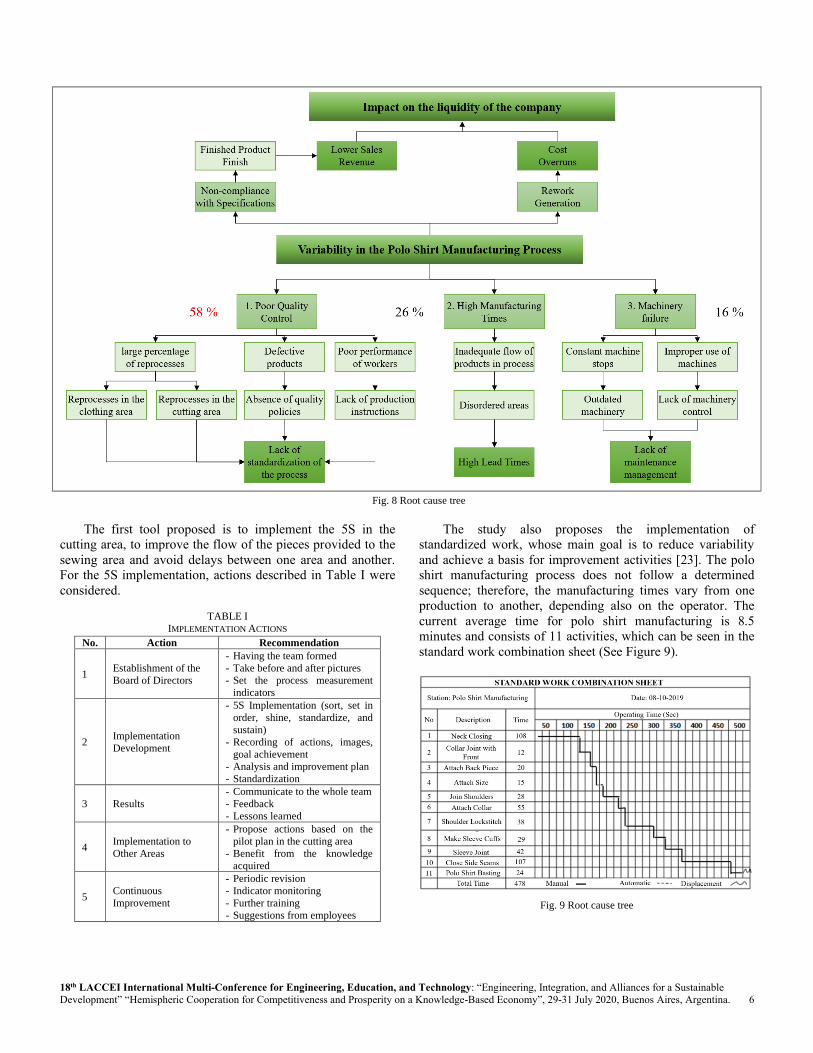
Fig. 8 Root cause tree
The first tool proposed is to implement the 5S in the
cutting area, to improve the flow of the pieces provided to the
sewing area and avoid delays between one area and another.
For the 5S implementation, actions described in Table I were
considered.
TABLE I
IMPLEMENTATION ACTIONS
No. Action Recommendation
1 Establishment of the
Board of Directors
- Having the team formed
- Take before and after pictures
- Set the process measurement
indicators
2 Implementation
Development
- 5S Implementation (sort, set in
order, shine, standardize, and
sustain)
- Recording of actions, images,
goal achievement
- Analysis and improvement plan
- Standardization
3 Results
- Communicate to the whole team
- Feedback
- Lessons learned
4 Implementation to
Other Areas
- Propose actions based on the
pilot plan in the cutting area
- Benefit from the knowledge
acquired
5 Continuous
Improvement
- Periodic revision
- Indicator monitoring
- Further training
- Suggestions from employees
The study also proposes the implementation of
standardized work, whose main goal is to reduce variability
and achieve a basis for improvement activities [23]. The polo
shirt manufacturing process does not follow a determined
sequence; therefore, the manufacturing times vary from one
production to another, depending also on the operator. The
current average time for polo shirt manufacturing is 8.5
minutes and consists of 11 activities, which can be seen in the
standard work combination sheet (See Figure 9).
Fig. 9 Root cause tree
18th LACCEI International Multi-Conference for Engineering, Education, and Technology: “Engineering, Integration, and Alliances for a Sustainable
Development” “Hemispheric Cooperation for Competitiveness and Prosperity on a Knowledge-Based Economy”, 29-31 July 2020, Buenos Aires, Argentina. 7
To validate the improvement proposed through this study, the implementation was simulated and compared with the current state. The software used is validated with experts and its use is essential to achieve results.
D. System simulation
The manufacturing process begins with the piece arrival:
front, back, collar, and sleeves. First, the front joint is made
and, then, the collar frame and its union. Then the shoulders
are joined, the label is attached, the sleeves are closed and
joined. To obtain the data of each activity time, we used a
representative sample of 100 data. For the calculations, the
acceptable confidence level for studying this type of variable
is 95%.
Fig. 10 simulation
To simulate the process, we used the collected data that
was entered into the INPUT ANALYZER software, based on
which we achieved the distribution and started the simulation.
The results of the current state, as well as those obtained from
the Arena software simulation are shown in Table II.
TABLE II
INDICATORS
Indicator Current Improvement Variation
tFinalProduction 6653.3 6361.7 4.38%
tTailEndJoinCollar 276.89 277.77
tTailEndMarkCollar 128.32 131.17
tTailEndJoinBack 104.12 102.64 1.42%
By implementing the improvements in the case study and
simulating the standardized process in Arena, we showed the
improvements achieved for the company, namely a reduction
in the manufacturing cycle time of 300 seconds.
TABLE III
TRAFFIC LIGHTS INDICATORS
Indicator Level Formula
N°
Current
value
Projected
value
Actual
value
Defective
products
>10%
(1) 16% 8% 5% ≤ 5%
≤ 10%
Cleanliness
and order
≤ 70%
(2) 65% 80% 83% ≥ 90%
> 70%
Rework
level
>12%
(3) 20% 12% 8% ≤ 8%
≤ 10%
V. CONCLUSIONS AND FUTURE RESEARCH
Nowadays, many companies are looking to be
competitive by increasing their productivity and profitability
and reducing waste in the entire process. Through this study,
we concluded that regardless of the company’s industry and
sector, Lean tools could be applicable in any environment.
This research focuses on proposals that can be replicated in all
companies that seek a methodology for solving their problems
to be always focused on continuous improvement.
The standardized process reduced up to 300 seconds the
manufacturing process time, with the aid of handbooks and the
periodical revision of the tasks performed by each operator in
this process. Moreover, the quantity of defective products was
reduced by 5%, and this is translated into a significant increase
in the on-time delivery level, as it was possible to diminish the
gap between the quantity processed and the quantity ordered
by customers. Further, the training allowed the staff to
properly implement the 5S’s tool to the work environment.
REFERENCES
[1] «Banco Central de Reserva del Perú,» 2019. [En línea]. Available: