54
Lean Six Sigma Green Belt Training

Lean Six Sigma Green Belt Training
ING Business School
UNIT 3Analyze
ING Business School Ref Unit 3-1
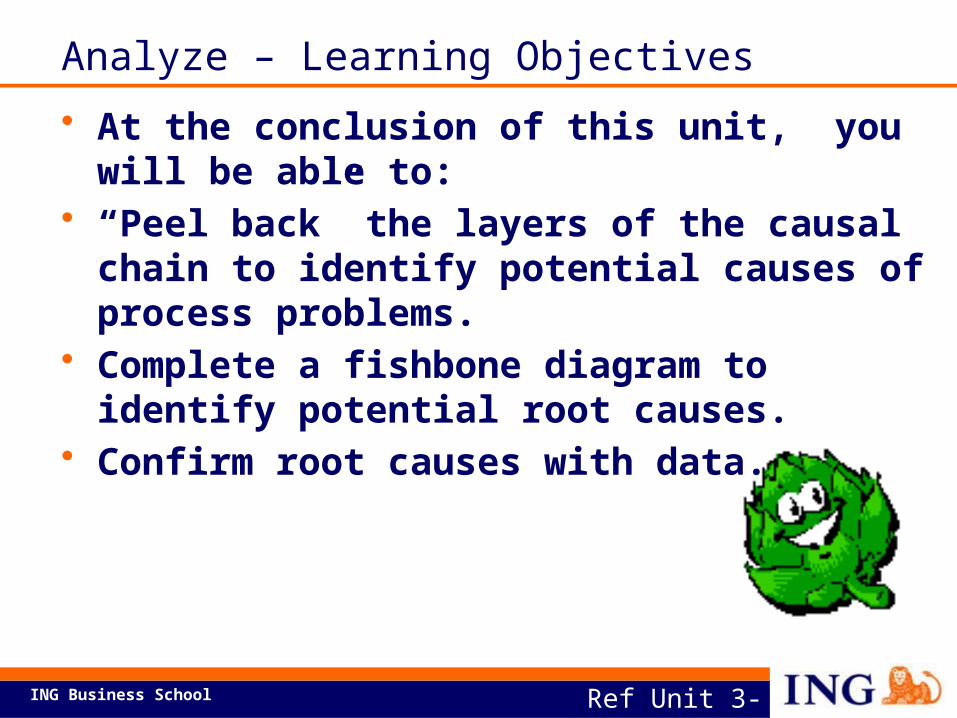
Analyze – Learning Objectives• At the conclusion of this unit, you will be able
to:• “Peel back” the layers of the causal chain to
identify potential causes of process problems.• Complete a fishbone diagram to identify
potential root causes. • Confirm root causes with data.
ING Business School
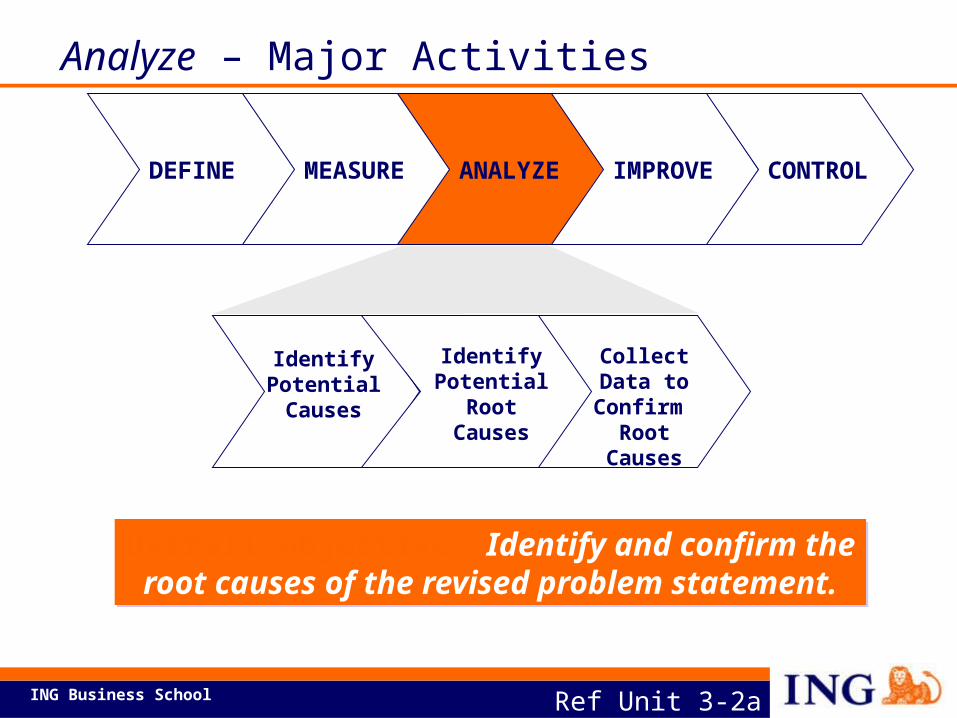
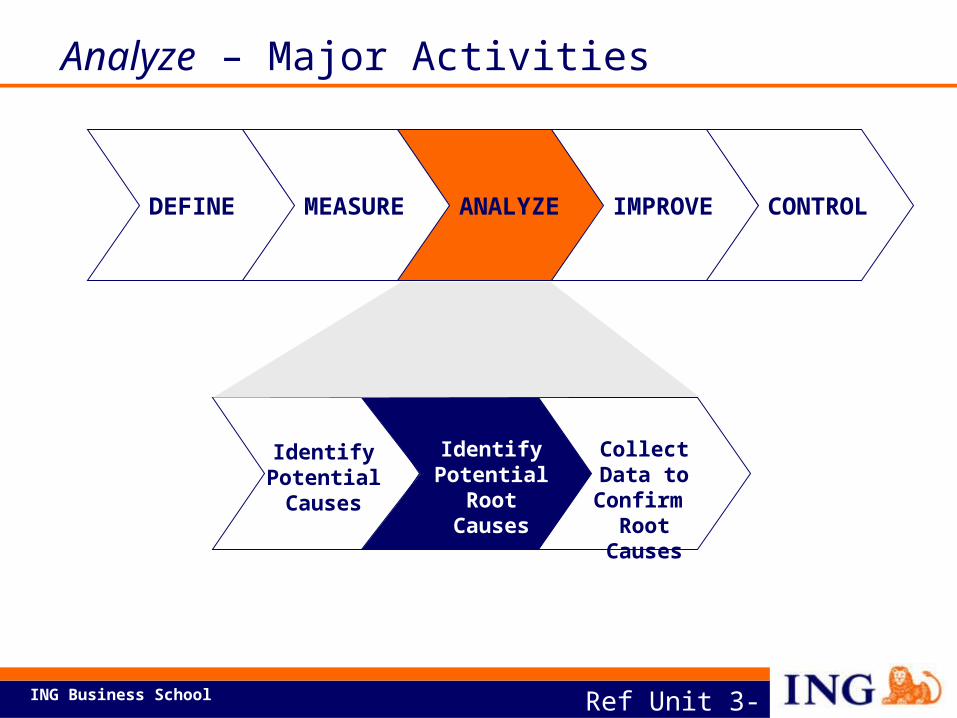
Identify Potential Causes
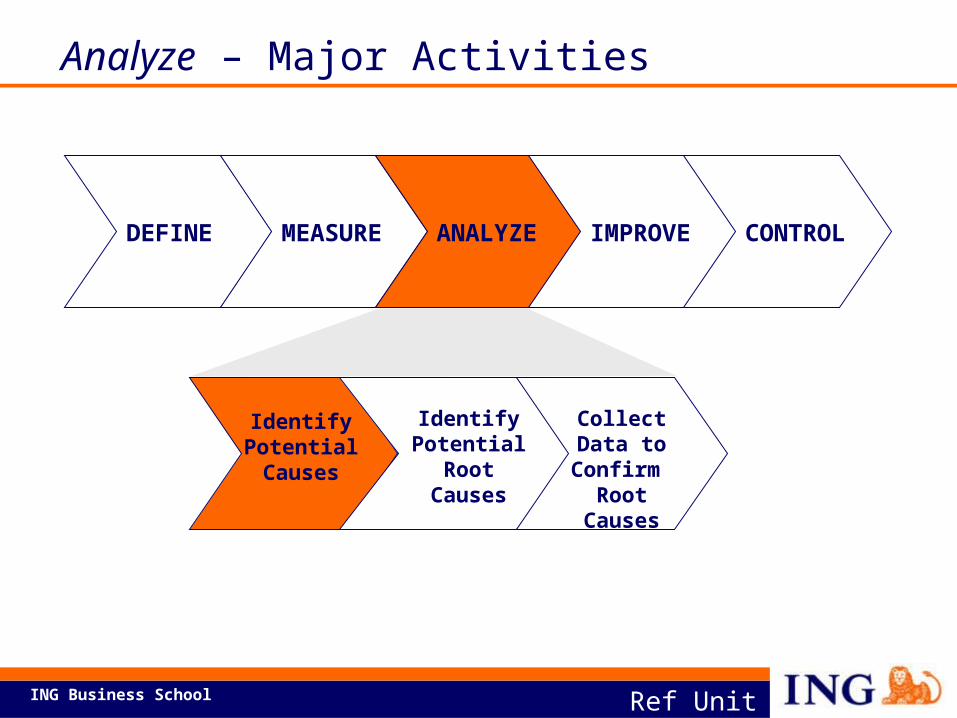
DEFINE MEASURE ANALYZE IMPROVE CONTROL
Identify Potential Root
Causes
Collect Data to Confirm
Root Causes
Overall objective: Identify and confirm the root causes of the revised problem statement.
Ref Unit 3-2a
Analyze – Major Activities
ING Business School
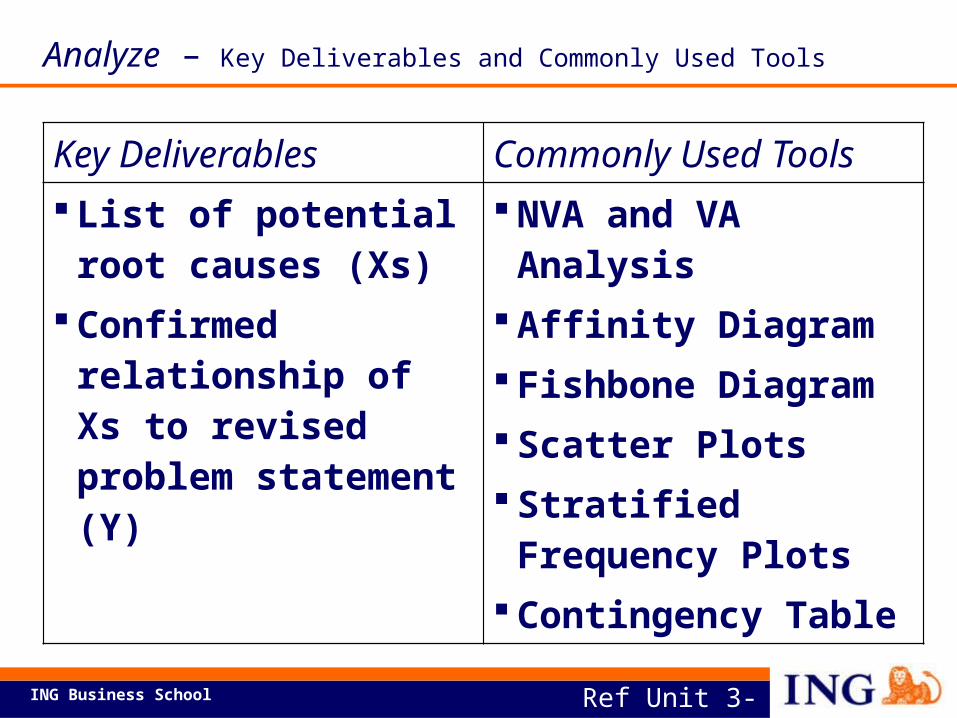
Key Deliverables Commonly Used Tools List of potential root
causes (Xs) Confirmed relationship
of Xs to revised problem statement (Y)
NVA and VA Analysis Affinity Diagram Fishbone Diagram Scatter Plots Stratified Frequency
Plots Contingency Table
Ref Unit 3-2b
Analyze – Key Deliverables and Commonly Used Tools
ING Business School
Identify Potential Causes
DEFINE MEASURE ANALYZE IMPROVE CONTROL
Identify Potential Root
Causes
Collect Data to Confirm
Root Causes
Ref Unit 3-3a
Analyze – Major Activities
ING Business School
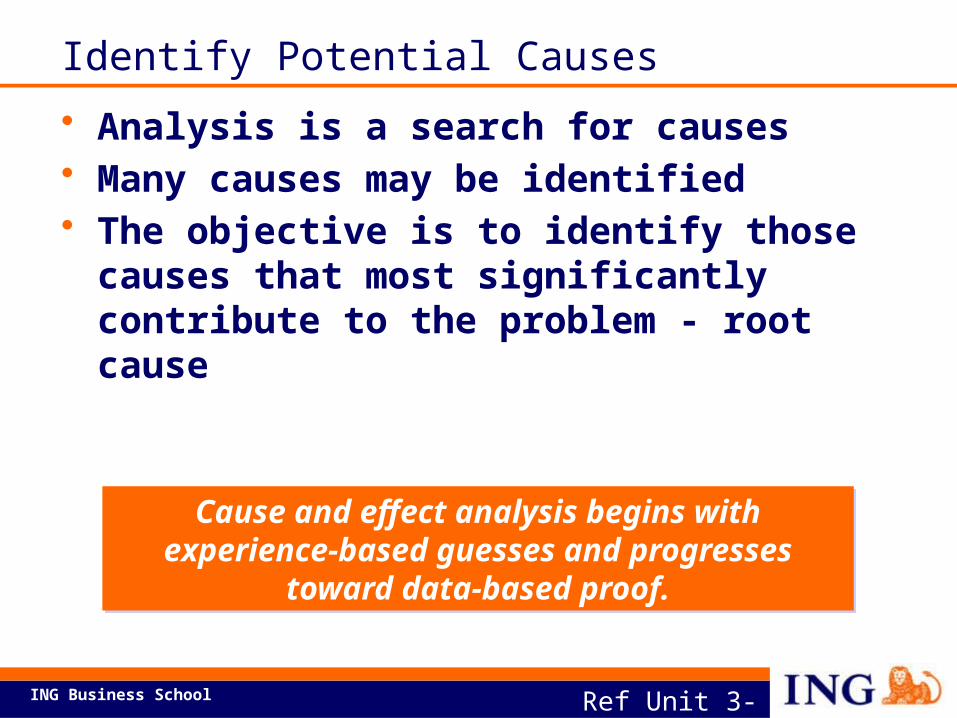
Cause and effect analysis begins with experience‑based guesses and progresses
toward data-based proof.
Ref Unit 3-3b
Identify Potential Causes• Analysis is a search for causes • Many causes may be identified • The objective is to identify those causes that
most significantly contribute to the problem - root cause
ING Business School Ref Unit 3-4a
Process
Inputs Outputs
Suppliers Customers
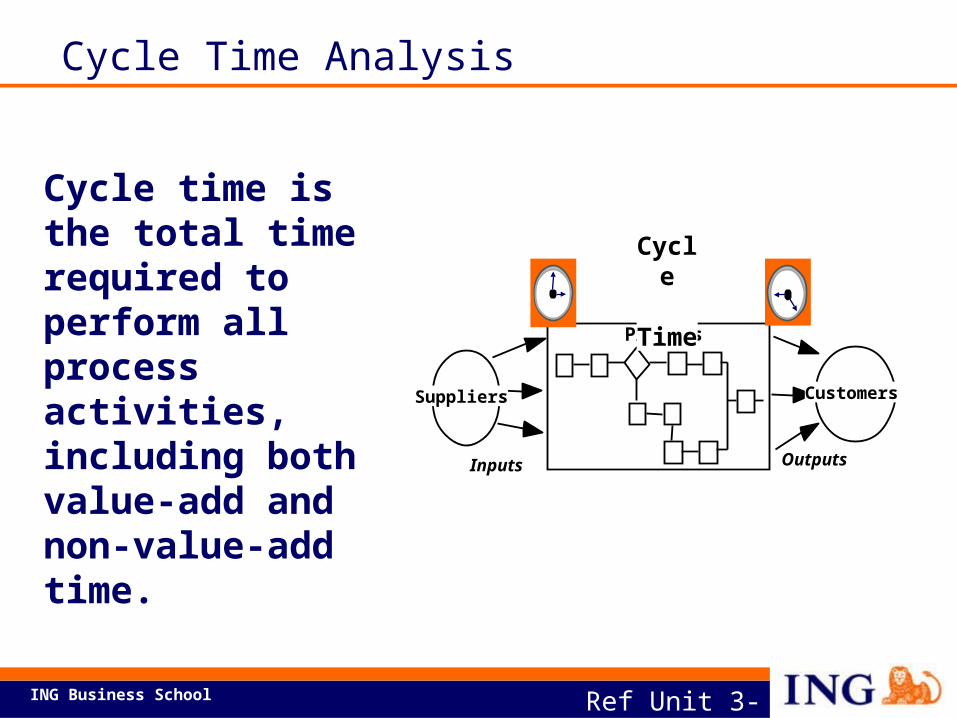
Cycle Time
Cycle Time Analysis
Cycle time is the total time required to perform all process activities, including both value-add and non-value-add time.
ING Business School
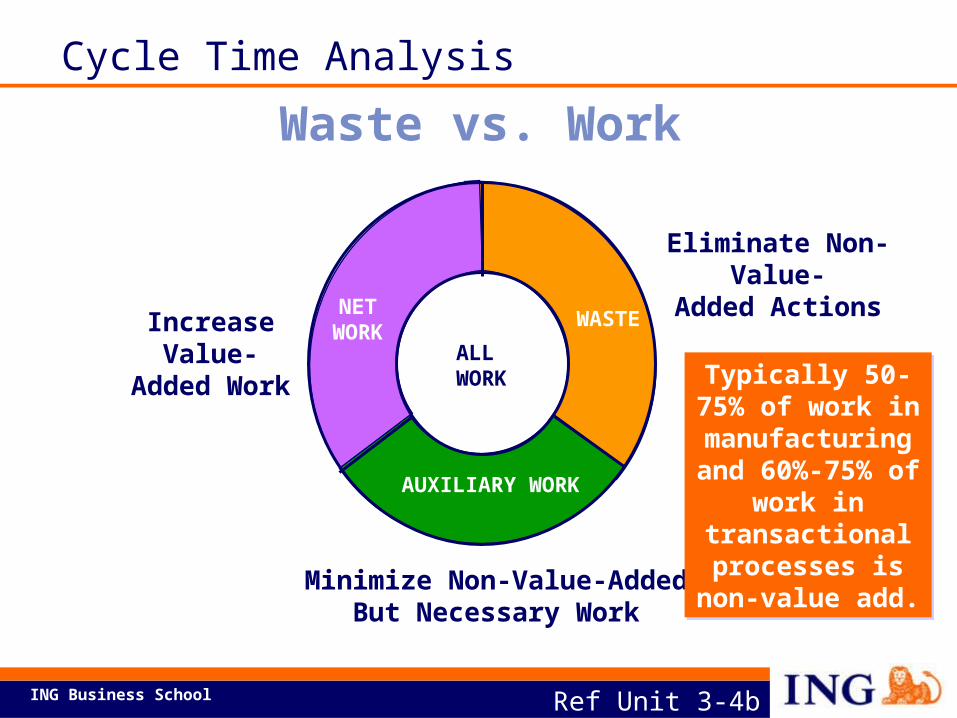
NETWORK WASTE
ALL WORK
AUXILIARY WORK
Eliminate Non-Value-Added Actions
Increase Value-Added Work
Minimize Non-Value-AddedBut Necessary Work
Typically 50-75% of work in
manufacturing and 60%-75% of
work in transactional
processes is non-value add.
Ref Unit 3-4b
Waste vs. WorkCycle Time Analysis
ING Business School Ref Unit 3-5a
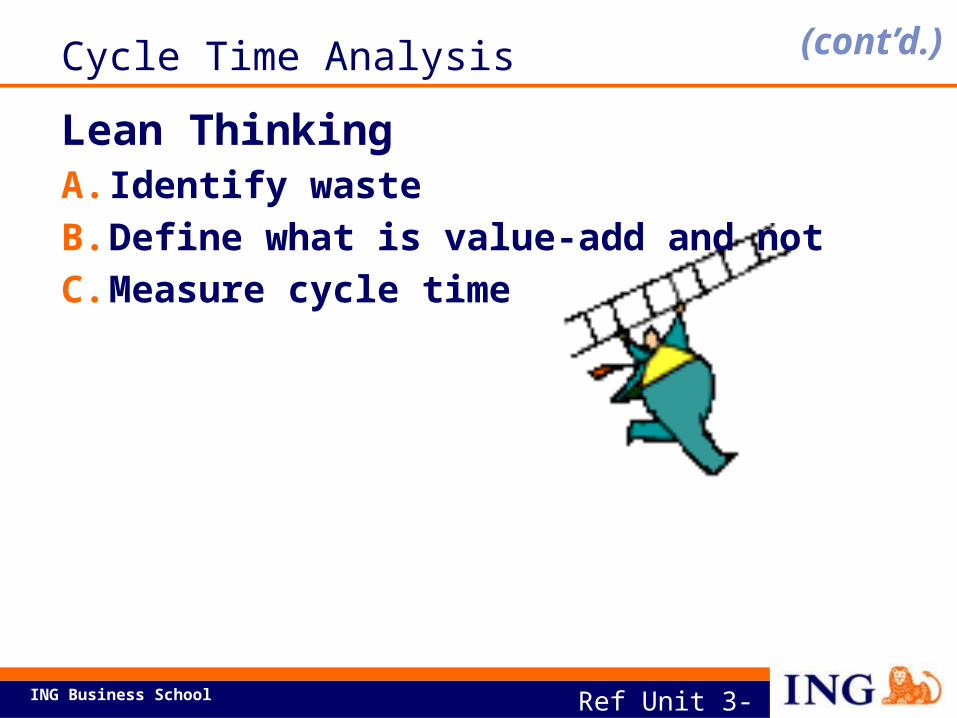
Cycle Time AnalysisLean ThinkingA. Identify wasteB. Define what is value-add and notC. Measure cycle time
(cont’d.)
ING Business School Ref Unit 3-5b
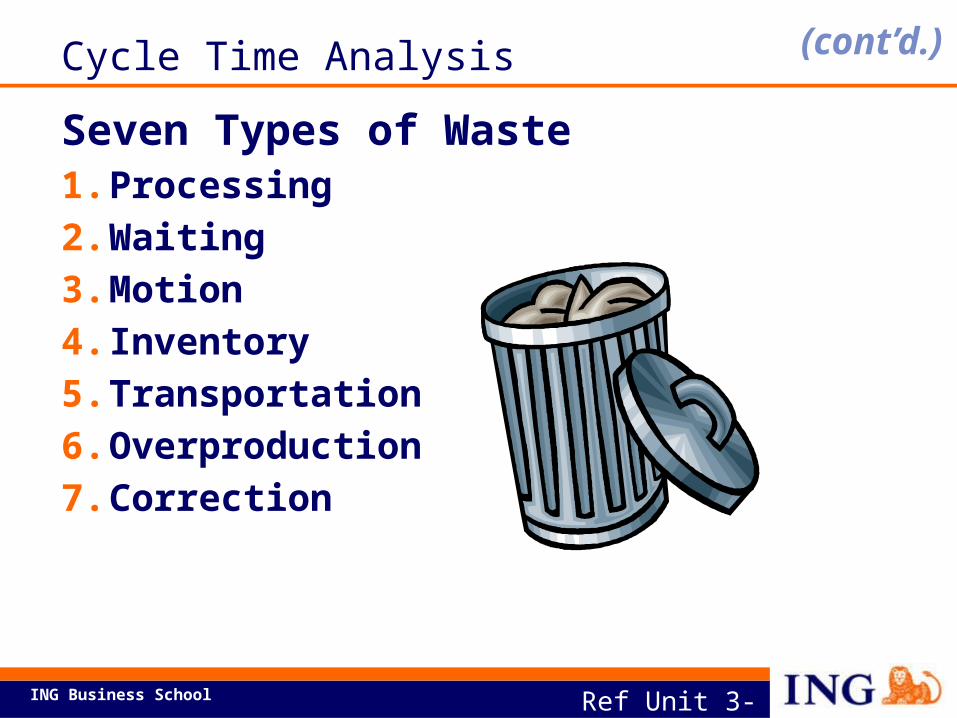
Cycle Time AnalysisSeven Types of Waste1. Processing 2. Waiting3. Motion4. Inventory5. Transportation6. Overproduction7. Correction
(cont’d.)
ING Business School
Inventory
Ref Unit 3-5c
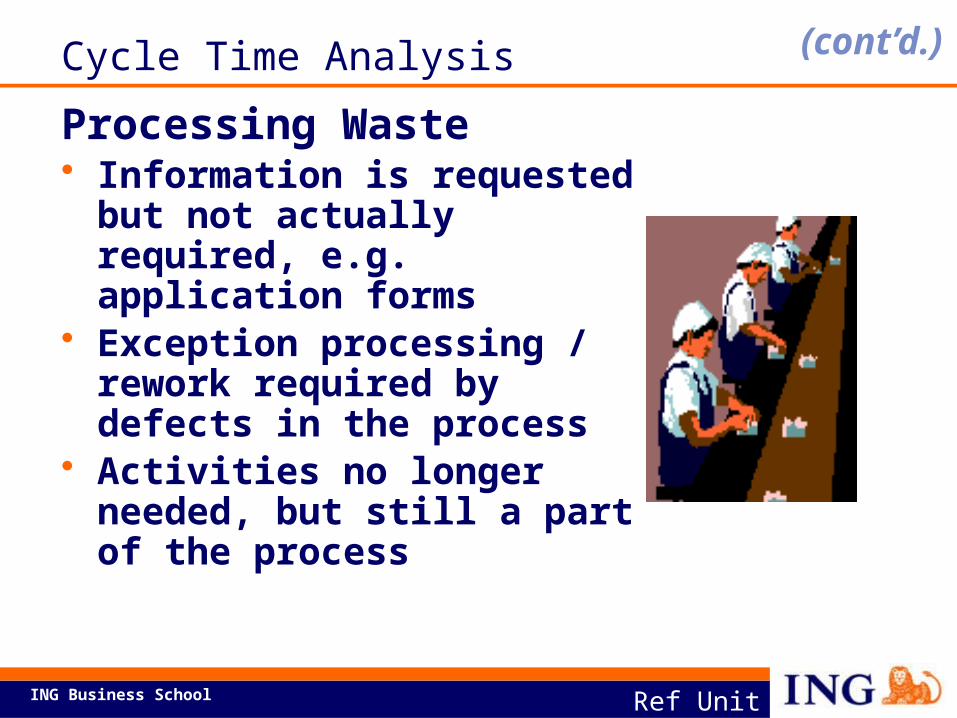
Cycle Time AnalysisProcessing Waste• Information is requested but
not actually required, e.g. application forms
• Exception processing / rework required by defects in the process
• Activities no longer needed, but still a part of the process
(cont’d.)
ING Business School
Inventory
Ref Unit 3-5d
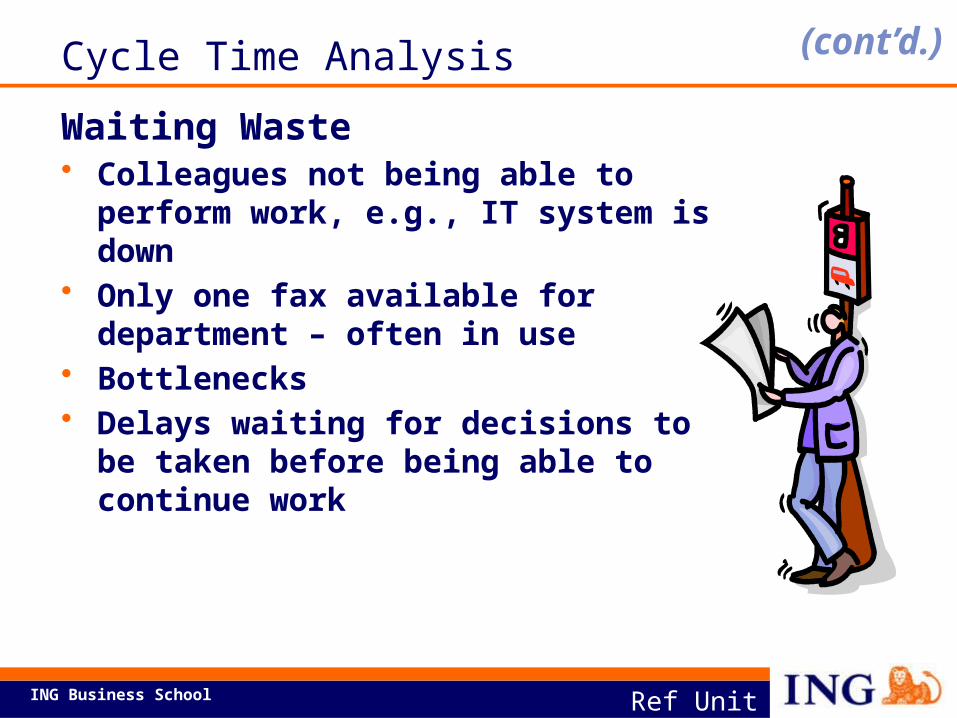
Cycle Time AnalysisWaiting Waste• Colleagues not being able to perform
work, e.g., IT system is down• Only one fax available for department –
often in use• Bottlenecks• Delays waiting for decisions to be taken
before being able to continue work
(cont’d.)
ING Business School
Inventory
Ref Unit 3-5e
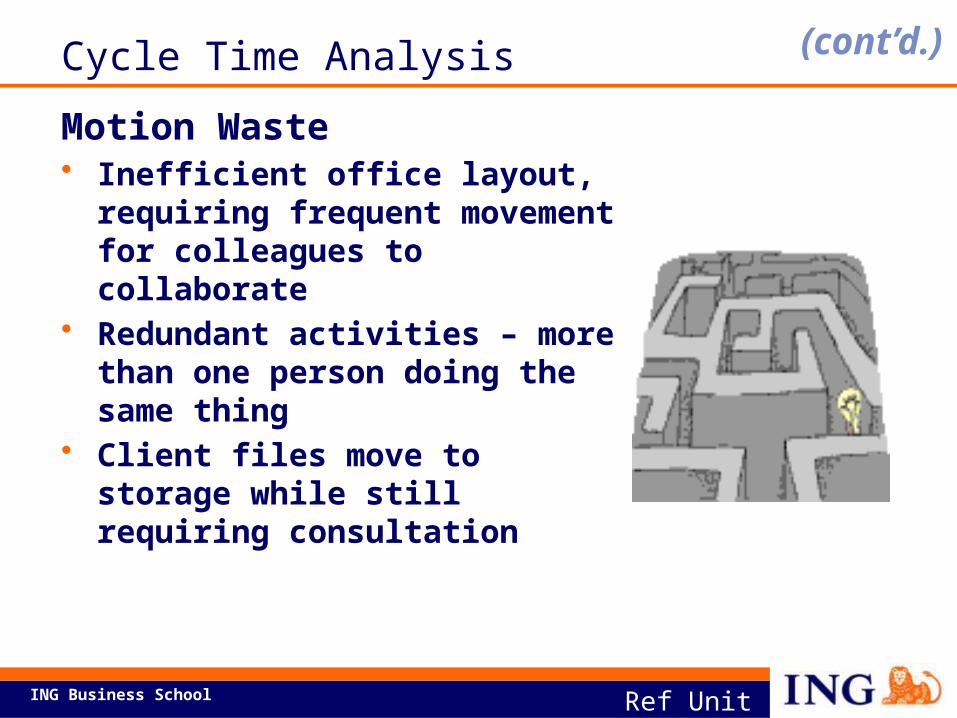
Cycle Time AnalysisMotion Waste• Inefficient office layout, requiring
frequent movement for colleagues to collaborate
• Redundant activities – more than one person doing the same thing
• Client files move to storage while still requiring consultation
(cont’d.)
ING Business School
Inventory
Ref Unit 3-5f
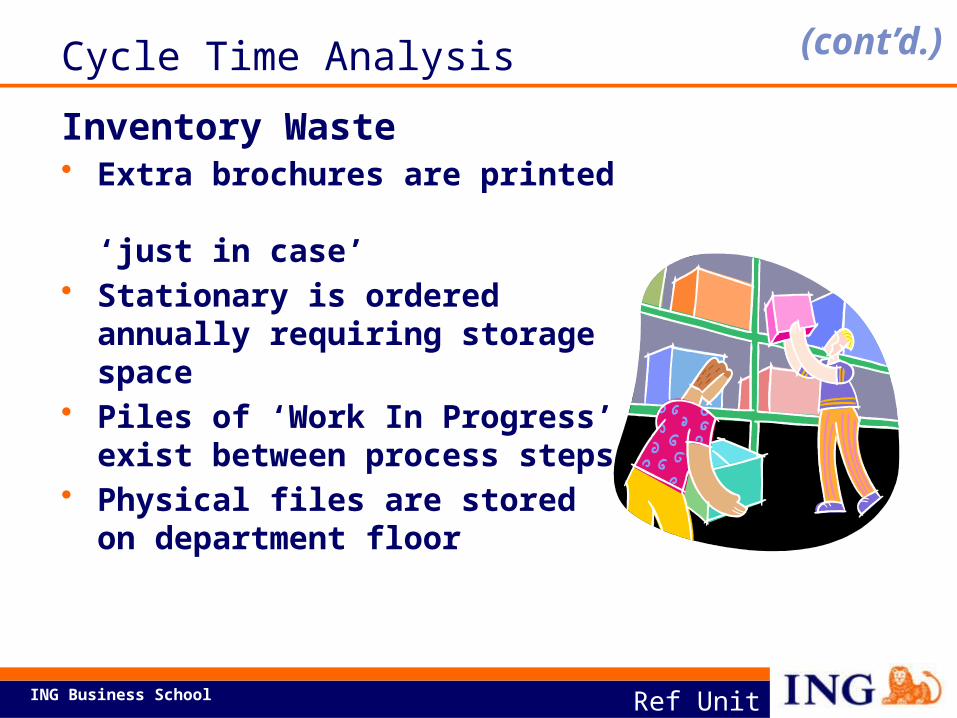
Cycle Time AnalysisInventory Waste• Extra brochures are printed
‘just in case’ • Stationary is ordered annually
requiring storage space• Piles of ‘Work In Progress’ exist
between process steps• Physical files are stored on
department floor
(cont’d.)
ING Business School
Inventory
Ref Unit 3-5g
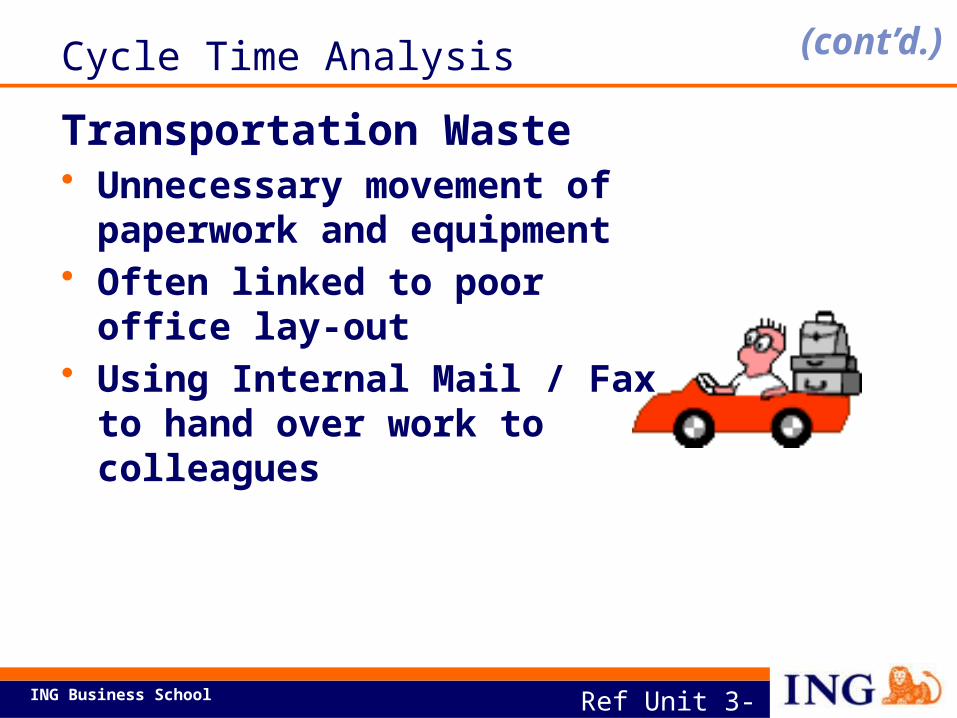
Cycle Time AnalysisTransportation Waste• Unnecessary movement of
paperwork and equipment• Often linked to poor office lay-
out• Using Internal Mail / Fax to hand
over work to colleagues
(cont’d.)
ING Business School
Inventory
Ref Unit 3-5h
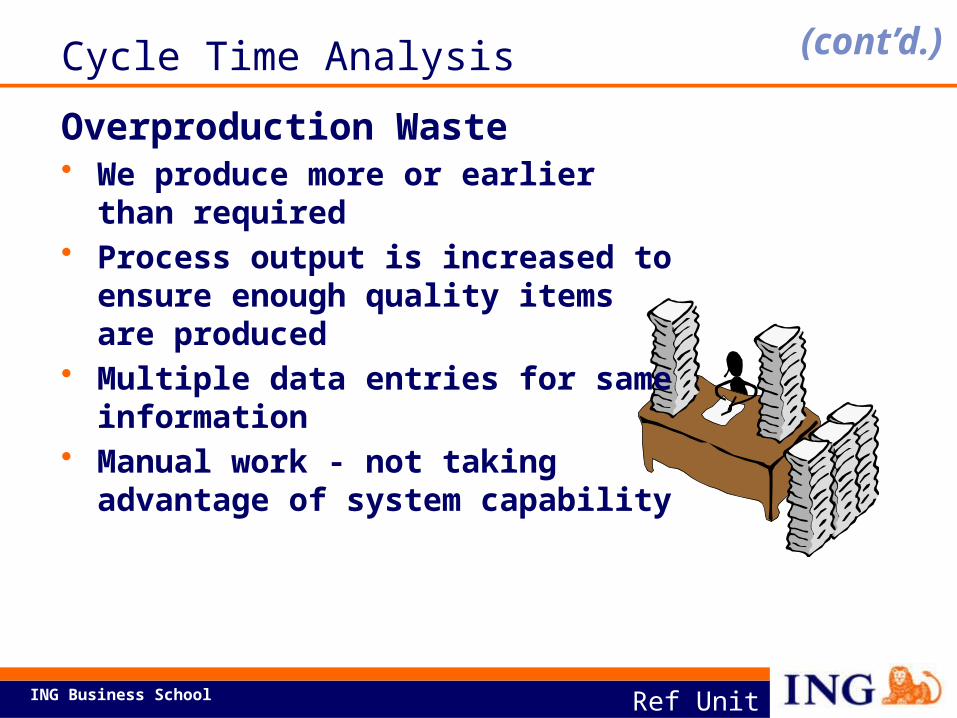
Cycle Time AnalysisOverproduction Waste• We produce more or earlier than
required• Process output is increased to ensure
enough quality items are produced • Multiple data entries for same
information• Manual work - not taking advantage of
system capability
(cont’d.)
ING Business School
Inventory
Ref Unit 3-5i
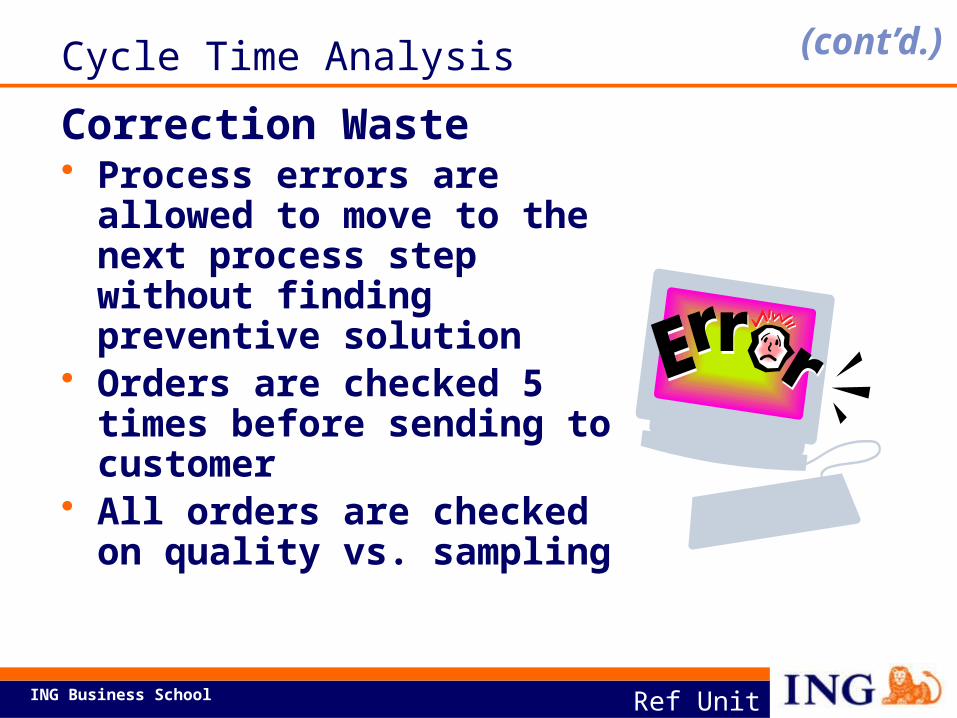
Cycle Time AnalysisCorrection Waste• Process errors are allowed to
move to the next process step without finding preventive solution
• Orders are checked 5 times before sending to customer
• All orders are checked on quality vs. sampling
(cont’d.)
ING Business School Ref Unit 3-5/6
• Do not get too hung up on what type of waste it is• Focus on finding a sustainable way to remove it
Cycle Time AnalysisValue-Added Time•Customers care about it; they are willing to pay for it
•The process activity physically changes the product/service
•Re-work is not involved; the work is done right the first time
Non-Value-Added Time•Processing •Waiting•Motion•Inventory•Transportation•Overproduction•Correction
(cont’d.)
ING Business School Ref Unit 3-7a
Cycle Time AnalysisMeasuring Cycle TimeDecide whether to measure cycle time on the entire
process or a sub-processUse a flowchart/process map Develop operational definitions for the starting and
ending points of each activityDevelop consensus about what is value-added and
what is non-value-added time Create a data collection form to identify which
activities will yield the most process improvement
(cont’d.)
ING Business School Ref Unit 3-7b
Cycle Time AnalysisUseful Cycle Time Data• Estimated cost/activity – total cost, not activity-based cost• Process time – value-add time per unit• Change-over time – time required to change from one type of
product/service to another, including learning time• Queue time – time spent waiting to be processed• Takt time – the rate at which output is completed, compared to
customer demand • Complexity – the number of different products/services
processed at the activity • Uptime – time worked per day minus breaks and interruptions • Defects and rework – time needed to correct defective
products/services
(cont’d.)
ING Business School
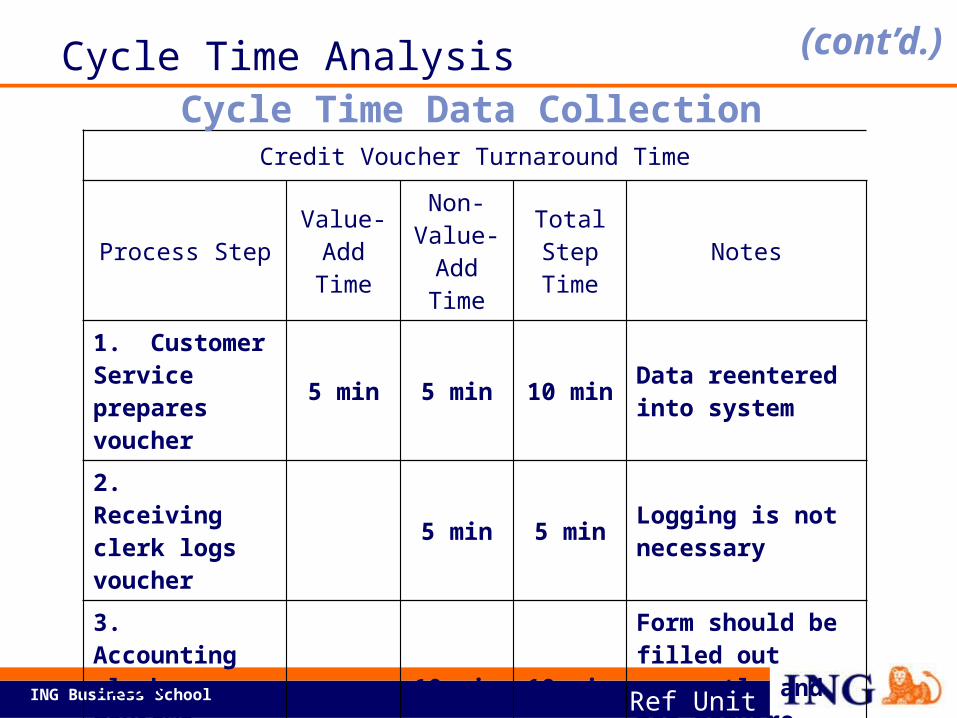
Credit Voucher Turnaround Time
Process Step Value-Add Time
Non-Value-Add
TimeTotal Step
Time Notes
1. Customer Service prepares voucher
5 min 5 min 10 min Data reentered into system
2. Receiving clerk logs voucher 5 min 5 min Logging is not
necessary
3. Accounting clerk reviews voucher
10 min 10 minForm should be filled out correctly and not require review
All additional process steps, time, and notes are included here
Total Process Time
Ref Unit 3-8
Cycle Time Data CollectionCycle Time Analysis (cont’d.)
ING Business School
Identify cycle time waste in your process.
Ref Unit 3-9
Activity
ING Business School Ref Unit 3-10
Identify Potential Causes
• Gather Many Causes• Use data from Measure Step• Talk with people • Focus on what you know • Think about sources of variation – people,
materials, methods, equipment, environment• Review past records
ING Business School
Brainstorming
Ref Unit 3-11
Identify Potential Causes
• Brainstorming approaches
• Brainstorming guidelines
(cont’d.)
ING Business School
Identify Potential Causes
DEFINE MEASURE ANALYZE IMPROVE CONTROL
Identify Potential Root
Causes
Collect Data to Confirm
Root Causes
Ref Unit 3-12a
Analyze – Major Activities
ING Business School
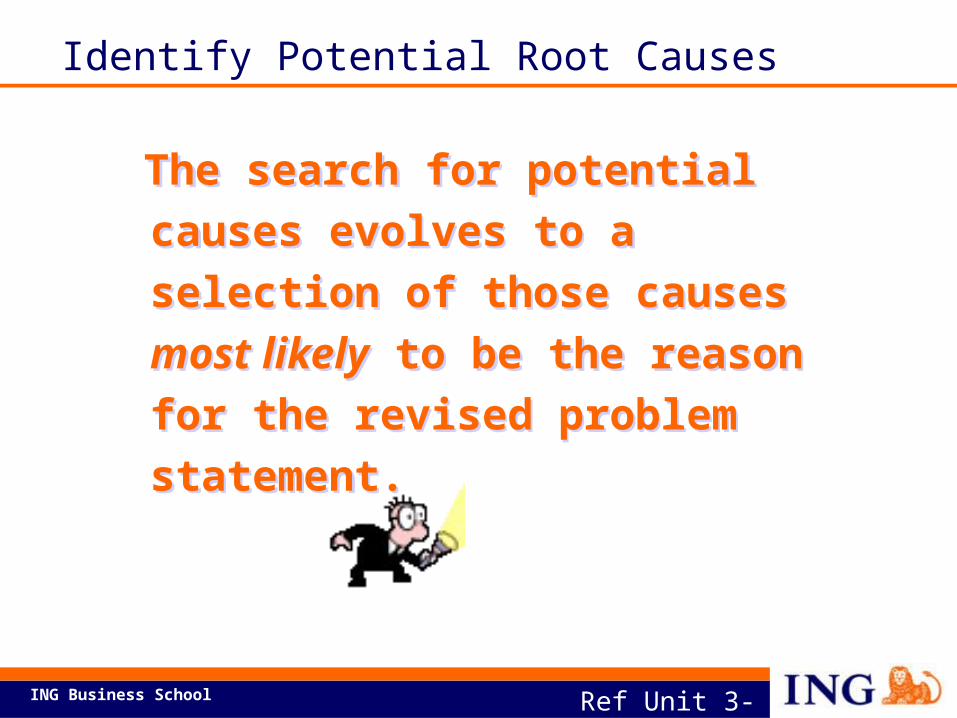
The search for potential causes evolves to a selection of those causes most likely to be the reason for the revised problem statement.
Ref Unit 3-12b
Identify Potential Root Causes
ING Business School
Cause and Effect Analysis
Ref Unit 3-12c
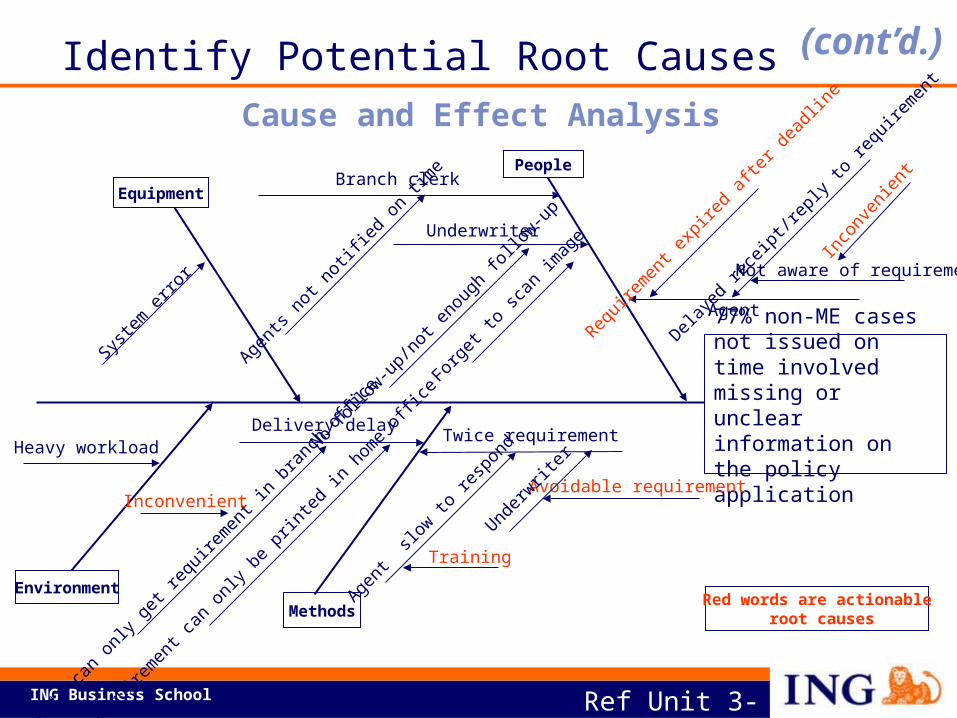
77% non-ME cases not issued on time involved missing or unclear information on the policy application
People
MethodsEnvironment
EquipmentBranch clerk
Underwriter
Forget
to sca
n imag
e
No follo
w-up/no
t eno
ugh f
ollow-up
Heavy workloadDelivery delay Twice requirement
Avoidable requirement
Agent
slow to
respo
nd
Agents
not n
otifie
d on t
ime
System
error
Agents
can o
nly ge
t requ
iremen
t in br
anch
office
Underw
riter
AgentReq
uirem
ent e
xpired
after
dead
line
Delaye
d rece
ipt/re
ply to
requ
iremen
t
Not aware of requirement
Incon
venie
nt
Requir
emen
t can o
nly be
ed in
home o
ffice
Training
Red words are actionable root causes
Inconvenient
Identify Potential Root Causes (cont’d.)
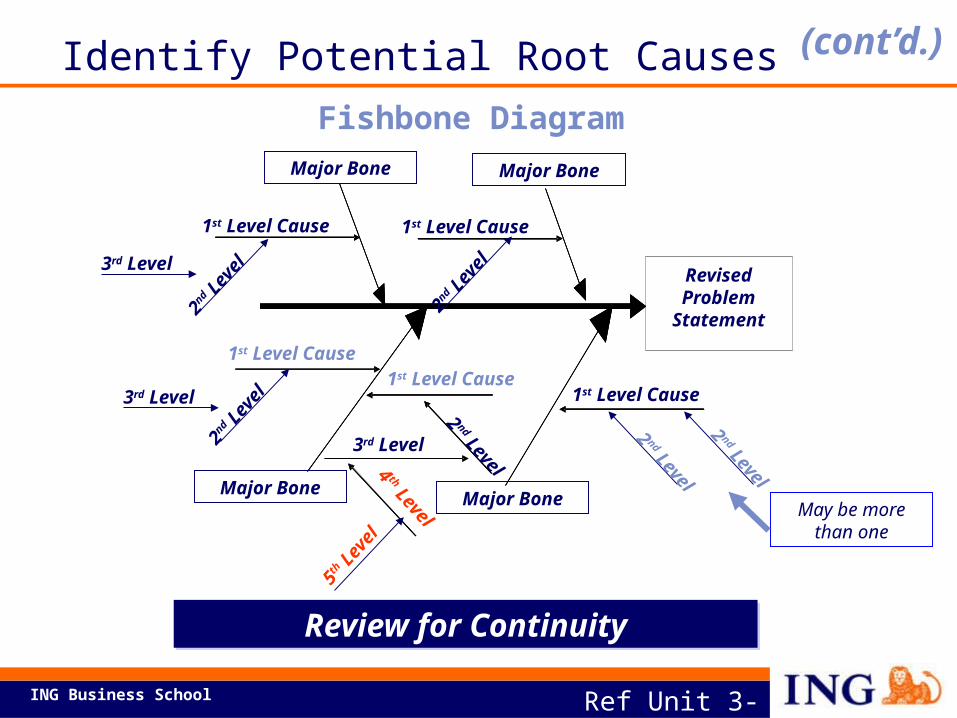
ING Business School
Revised Problem
Statement
Major Bone Major Bone
Major BoneMajor Bone
1st Level Cause1st Level Cause
1st Level Cause
1st Level Cause
1st Level Cause
3rd Level
3rd Level
3rd Level
4 th Level
5th Le
vel
2 nd Level
2 nd Level
2nd Le
vel
2nd Le
vel
2nd Le
vel
2 nd Level
May be more than one
Review for Continuity
Fishbone Diagram
Ref Unit 3-15
Identify Potential Root Causes (cont’d.)
ING Business School Ref Unit 3-16
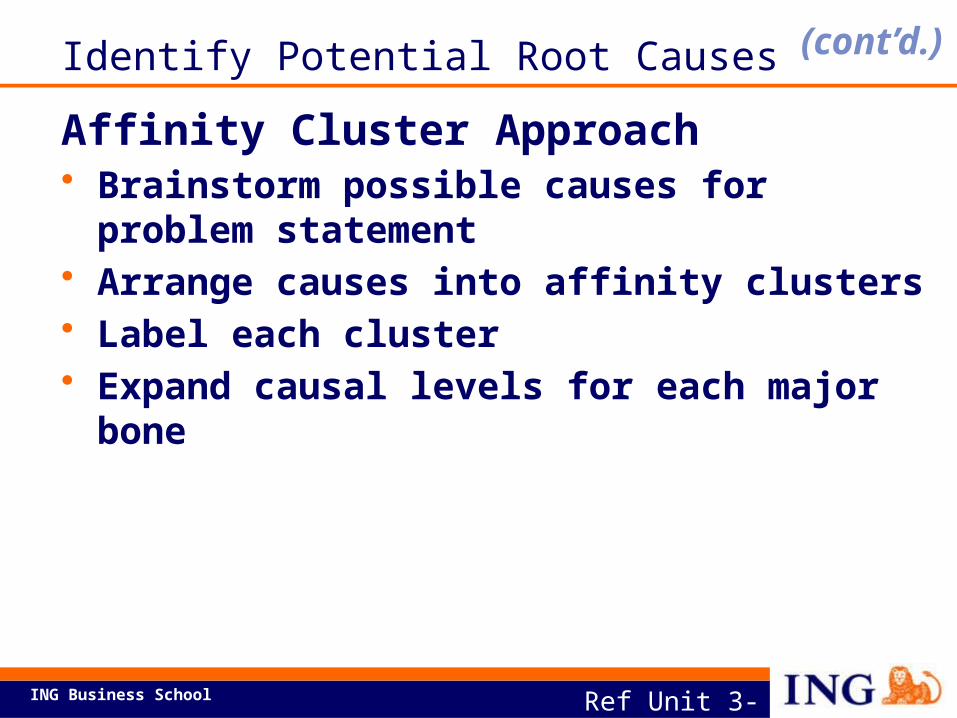
Identify Potential Root CausesAffinity Cluster Approach• Brainstorm possible causes for problem
statement• Arrange causes into affinity clusters• Label each cluster• Expand causal levels for each major bone
(cont’d.)
ING Business School
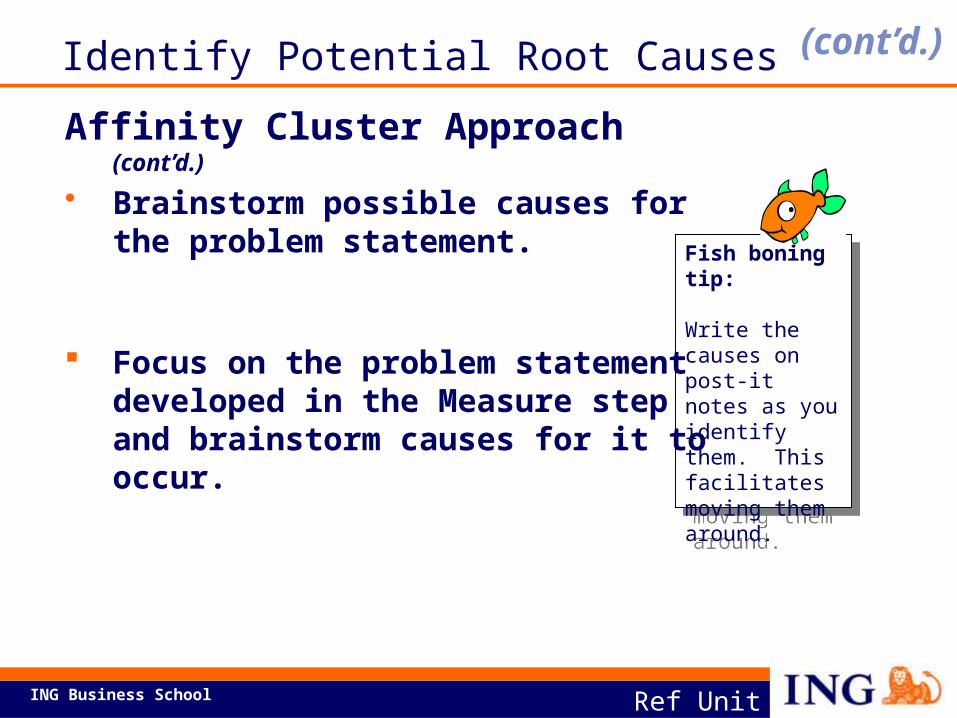
Fish boning tip:
Write the causes on post-it notes as you identify them. This facilitates moving them around.
Ref Unit 3-17
Identify Potential Root CausesAffinity Cluster Approach (cont’d.)• Brainstorm possible causes for the
problem statement.
Focus on the problem statement developed in the Measure step and brainstorm causes for it to occur.
(cont’d.)
ING Business School Ref Unit 3-18a
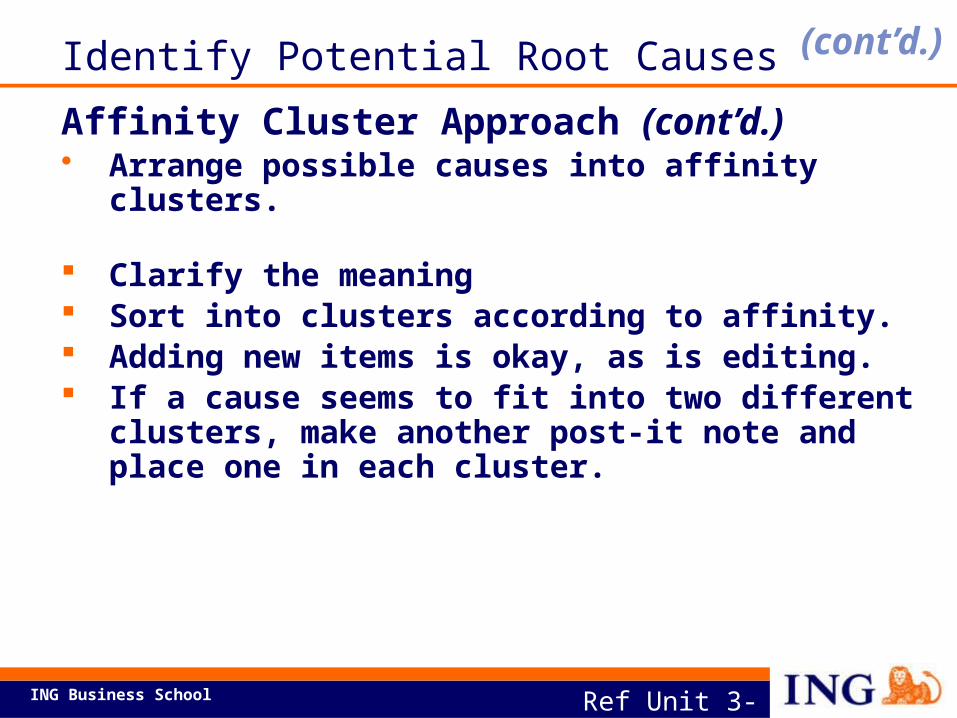
Identify Potential Root CausesAffinity Cluster Approach (cont’d.)• Arrange possible causes into affinity clusters.
Clarify the meaning Sort into clusters according to affinity. Adding new items is okay, as is editing. If a cause seems to fit into two different clusters,
make another post-it note and place one in each cluster.
(cont’d.)
ING Business School
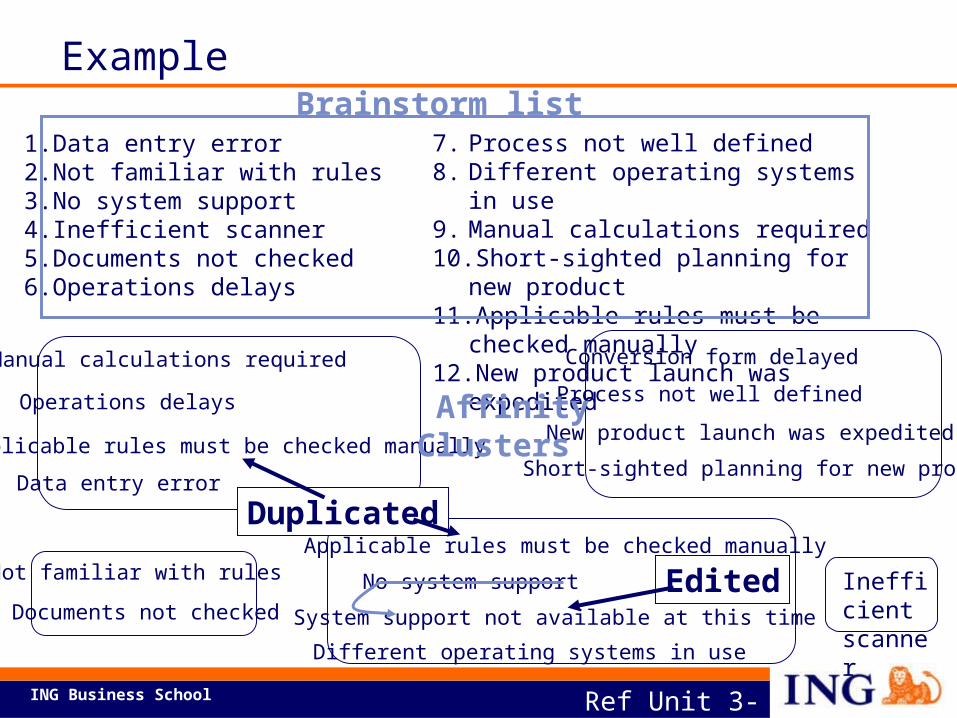
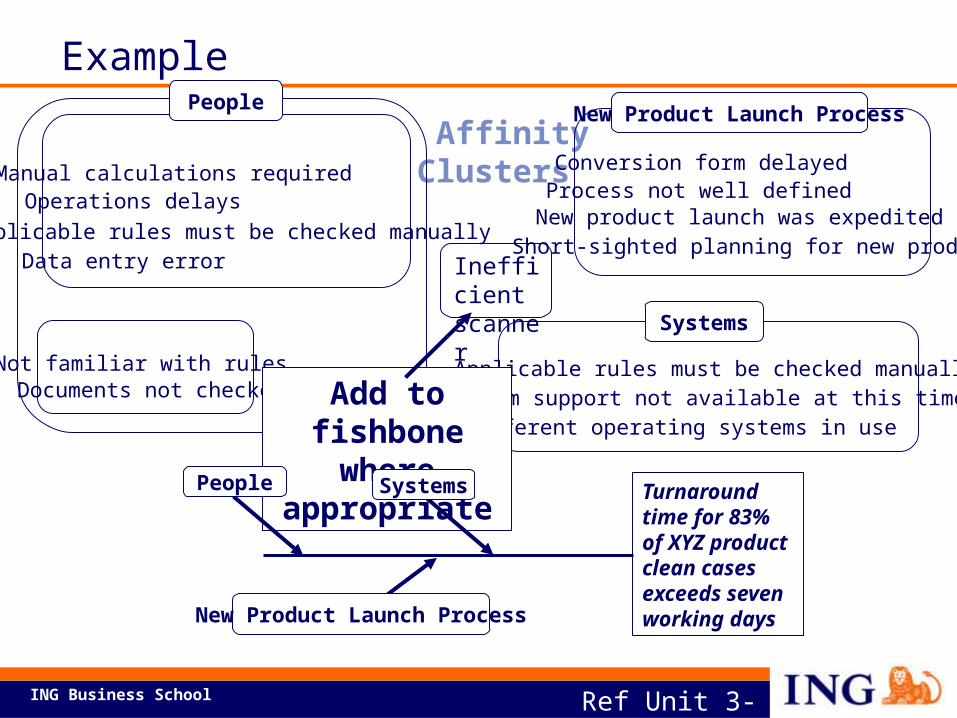
Data entry error
No system supportNot familiar with rules
Documents not checked
Process not well defined
Different operating systems in use
Manual calculations required
Short-sighted planning for new product
Applicable rules must be checked manually
New product launch was expedited
Conversion form delayed
Applicable rules must be checked manually
System support not available at this time
1. Data entry error2. Not familiar with rules3. No system support4. Inefficient scanner5. Documents not checked6. Operations delays
7. Process not well defined8. Different operating systems in use9. Manual calculations required10. Short-sighted planning for new product 11. Applicable rules must be checked manually12. New product launch was expedited
Brainstorm list
Operations delays AffinityClusters
Edited
Duplicated
Inefficient scanner
Ref Unit 3-18b
Example
ING Business School Ref Unit 3-19a
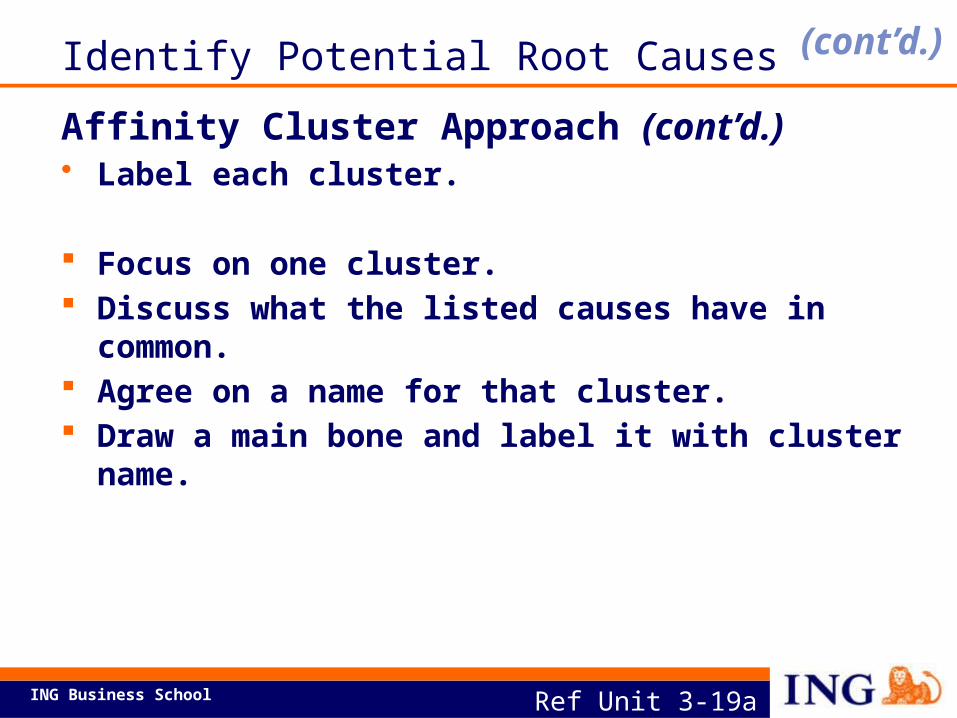
Identify Potential Root CausesAffinity Cluster Approach (cont’d.)• Label each cluster.
Focus on one cluster. Discuss what the listed causes have in common. Agree on a name for that cluster. Draw a main bone and label it with cluster name.
(cont’d.)
ING Business School
AffinityClusters
Inefficient scanner
Data entry error
Not familiar with rulesDocuments not checked
Manual calculations required
Applicable rules must be checked manuallyOperations delays
People
Different operating systems in use
Applicable rules must be checked manuallySystem support not available at this time
Systems
Process not well defined
Short-sighted planning for new productNew product launch was expedited
Conversion form delayed
New Product Launch Process
Add to fishbone where appropriate
Turnaround time for 83% of XYZ product clean cases exceeds seven working days
People
New Product Launch Process
Systems
Ref Unit 3-19b
Example
ING Business School Ref Unit 3-20a
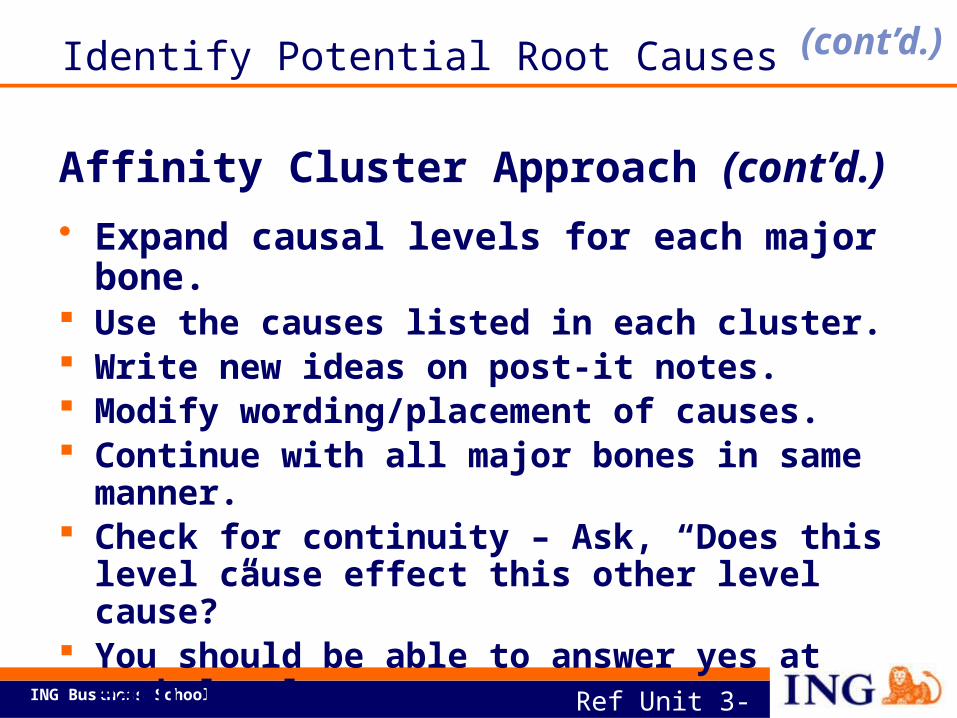
Identify Potential Root Causes
Affinity Cluster Approach (cont’d.)• Expand causal levels for each major bone. Use the causes listed in each cluster. Write new ideas on post-it notes. Modify wording/placement of causes. Continue with all major bones in same manner. Check for continuity – Ask, “Does this level cause
effect this other level cause?” You should be able to answer yes at each level.
(cont’d.)
ING Business School
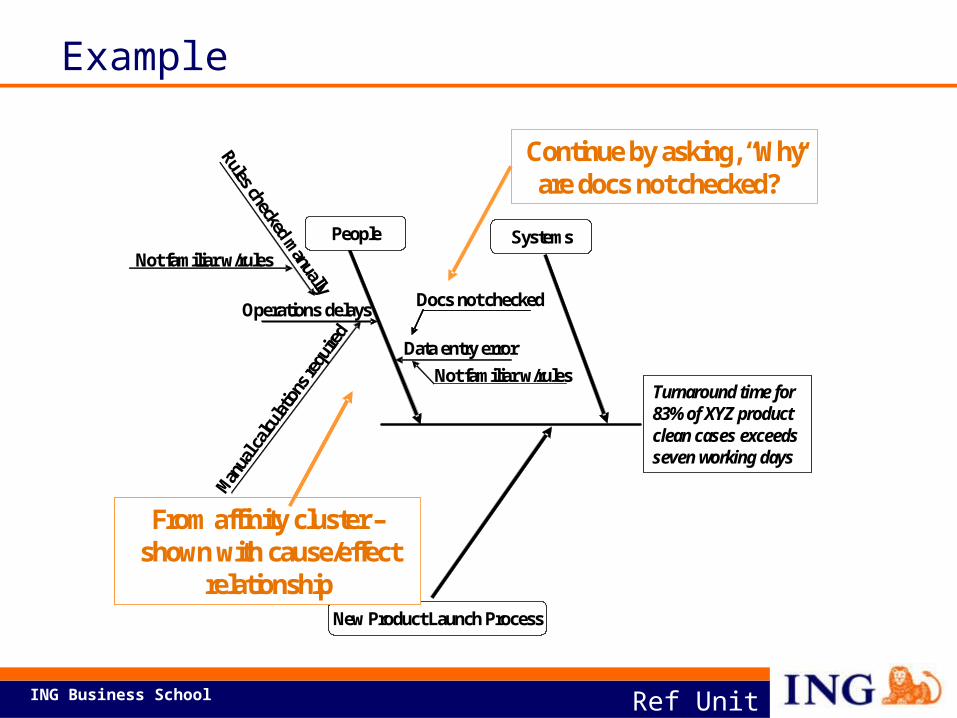
Turnaround time for 83% of XYZ product clean cases exceeds seven working days
People
New Product Launch Process
Systems
Operations delays
Manua
l calc
ulatio
ns re
quire
d
Rules checked manually
Data entry errorNot familiar w/rules
Not familiar w/rules
Docs not checked
From affinity cluster –shown with cause/effect
relationship
From affinity cluster –shown with cause/effect
relationship
Continue by asking, “Why are docs not checked?”
Ref Unit 3-20b
Example
ING Business School
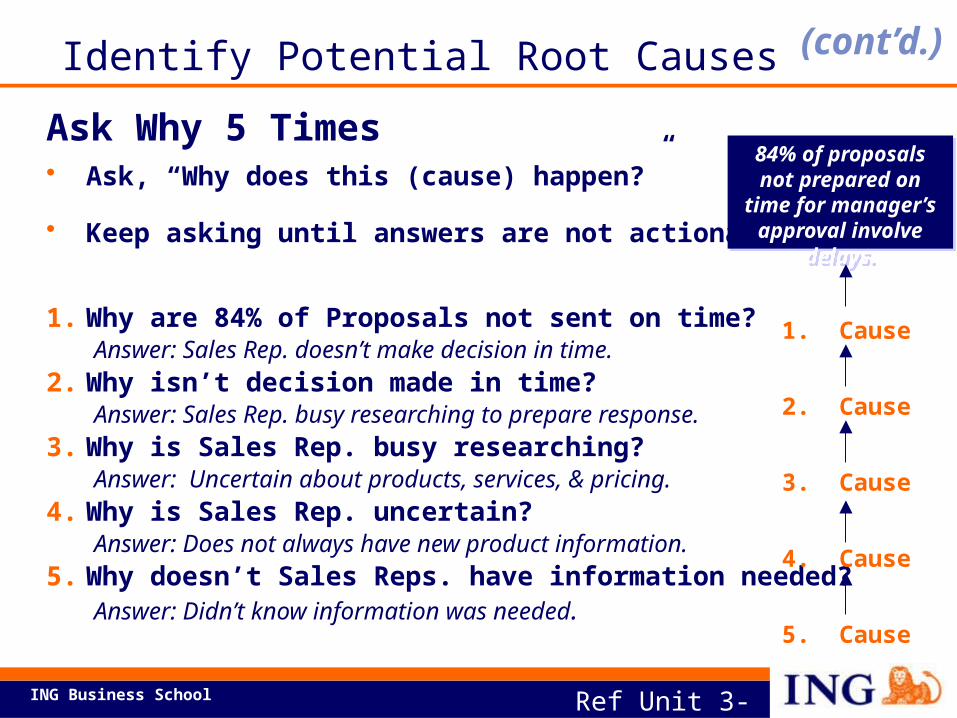
Ask Why 5 Times• Ask, “Why does this (cause) happen?”
• Keep asking until answers are not actionable.
1. Why are 84% of Proposals not sent on time?Answer: Sales Rep. doesn’t make decision in time.
2. Why isn’t decision made in time? Answer: Sales Rep. busy researching to prepare response.
3. Why is Sales Rep. busy researching?Answer: Uncertain about products, services, & pricing.
4. Why is Sales Rep. uncertain?Answer: Does not always have new product information.
5. Why doesn’t Sales Reps. have information needed?Answer: Didn’t know information was needed.
84% of proposals not prepared on time for manager’s approval
involve delays.
1. Cause
2. Cause
3. Cause
4. Cause
5. Cause
Ref Unit 3-21
Identify Potential Root Causes (cont’d.)
ING Business School Ref Unit 3-22
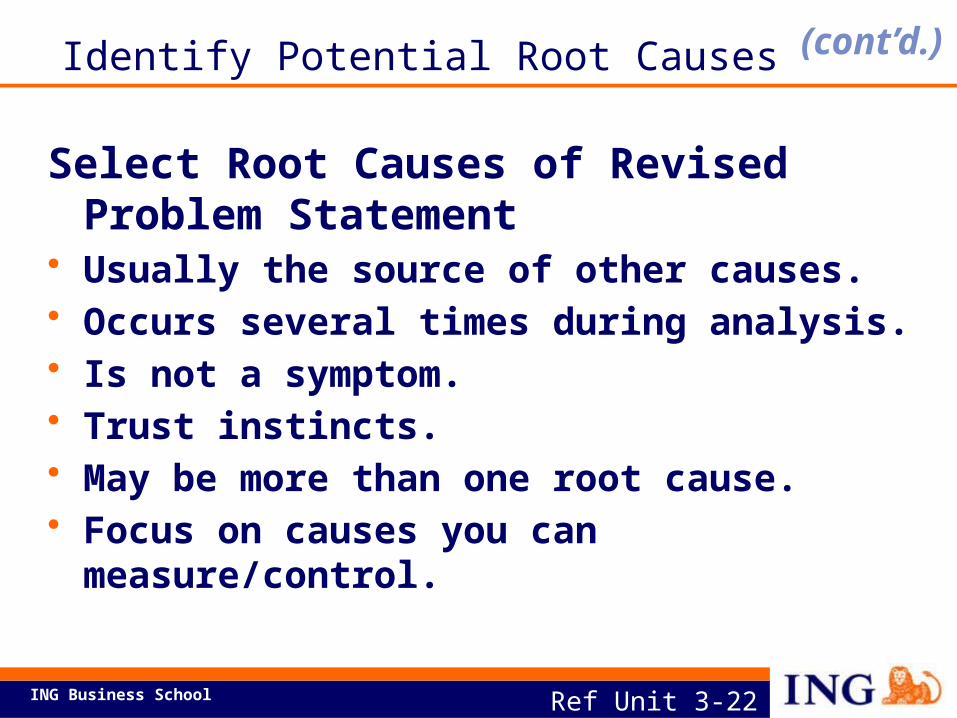
Identify Potential Root Causes
Select Root Causes of Revised Problem Statement
• Usually the source of other causes.• Occurs several times during analysis.• Is not a symptom.• Trust instincts.• May be more than one root cause.• Focus on causes you can measure/control.
(cont’d.)

ING Business School
Practice fishbone diagram.
Ref Unit 3-23
Activity
ING Business School
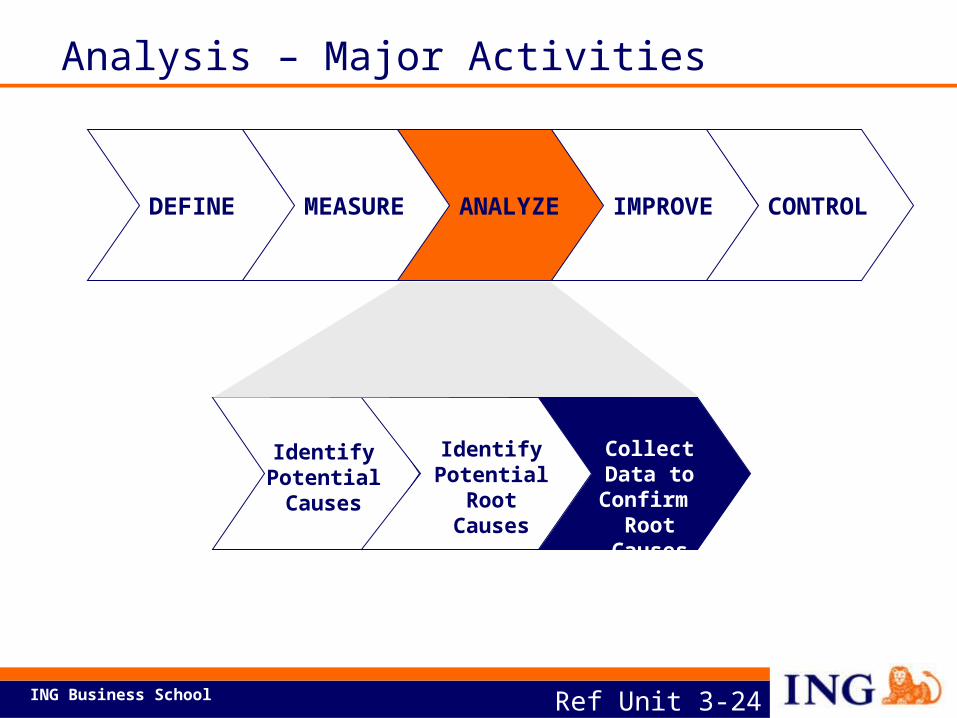
Identify Potential Causes
DEFINE MEASURE ANALYZE IMPROVE CONTROL
Identify Potential Root
Causes
Collect Data to Confirm
Root Causes
Ref Unit 3-24
Analysis – Major Activities
ING Business School Ref Unit 3-25a
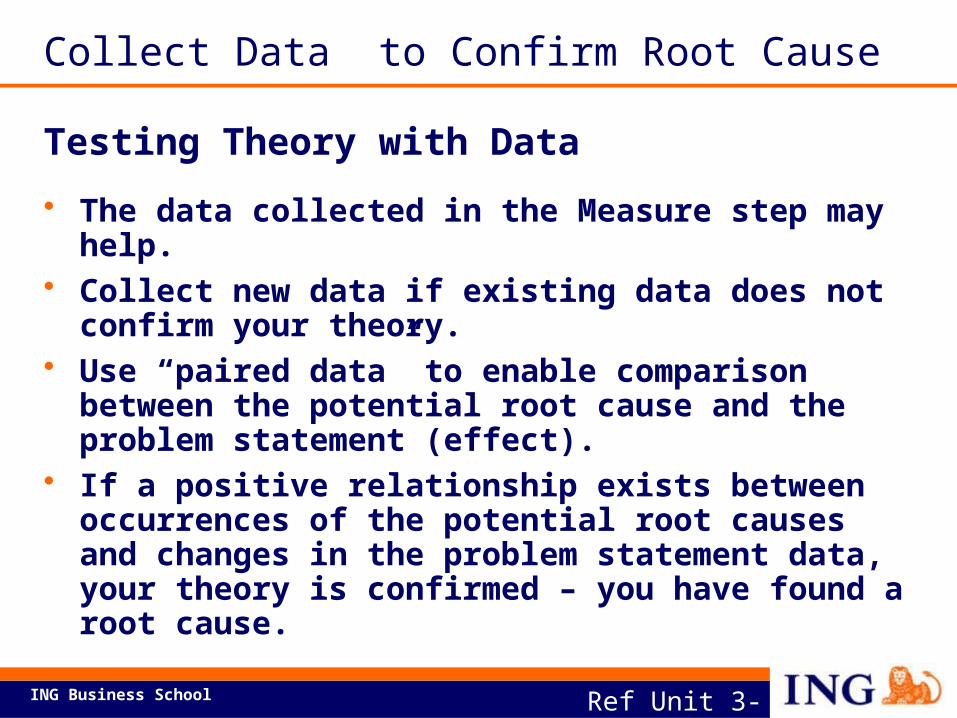
Collect Data to Confirm Root Cause
Testing Theory with Data• The data collected in the Measure step may help.• Collect new data if existing data does not confirm
your theory.• Use “paired data” to enable comparison between the
potential root cause and the problem statement (effect).
• If a positive relationship exists between occurrences of the potential root causes and changes in the problem statement data, your theory is confirmed – you have found a root cause.
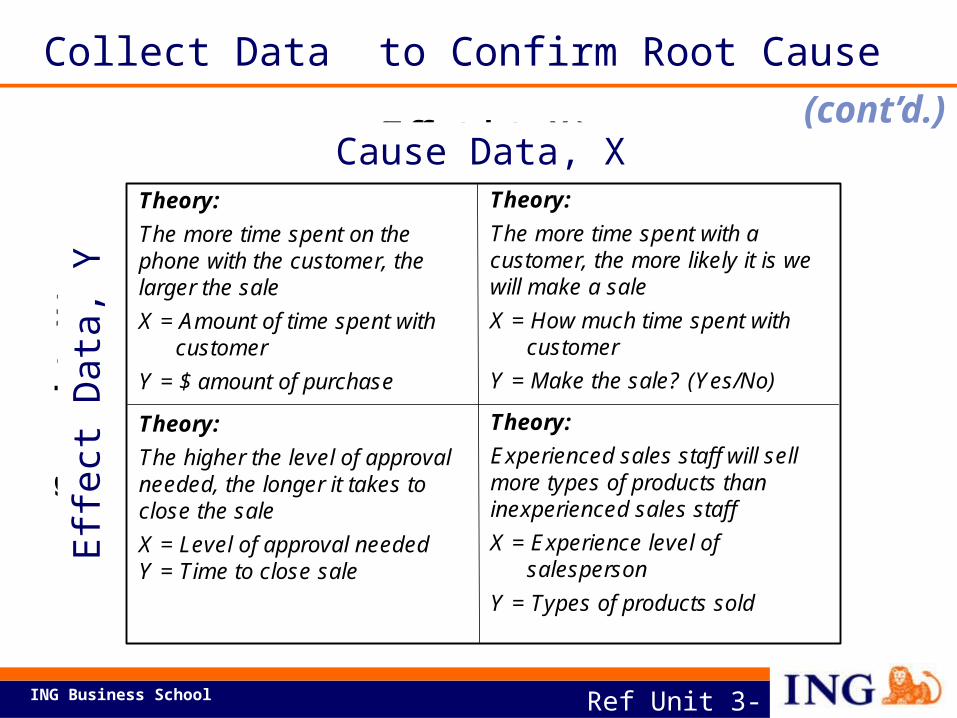
ING Business School
Theory:The more time spent on the phone with the customer, the larger the saleX = Amount of time spent with
customer Y = $ amount of purchase
Theory:The more time spent with a customer, the more likely it is we will make a saleX = How much time spent with
customer Y = Make the sale? (Yes/No)
Theory: The higher the level of approval needed, the longer it takes to close the saleX = Level of approval neededY = Time to close sale
Theory: Experienced sales staff will sell more types of products than inexperienced sales staff X = Experience level of
salesperson Y = Types of products sold
(Effect data, Y)
(Cau
se d
ata,
X)
Cause Data, XEff
ect D
ata,
Y
Ref Unit 3-25b
Collect Data to Confirm Root Cause(cont’d.)
ING Business School
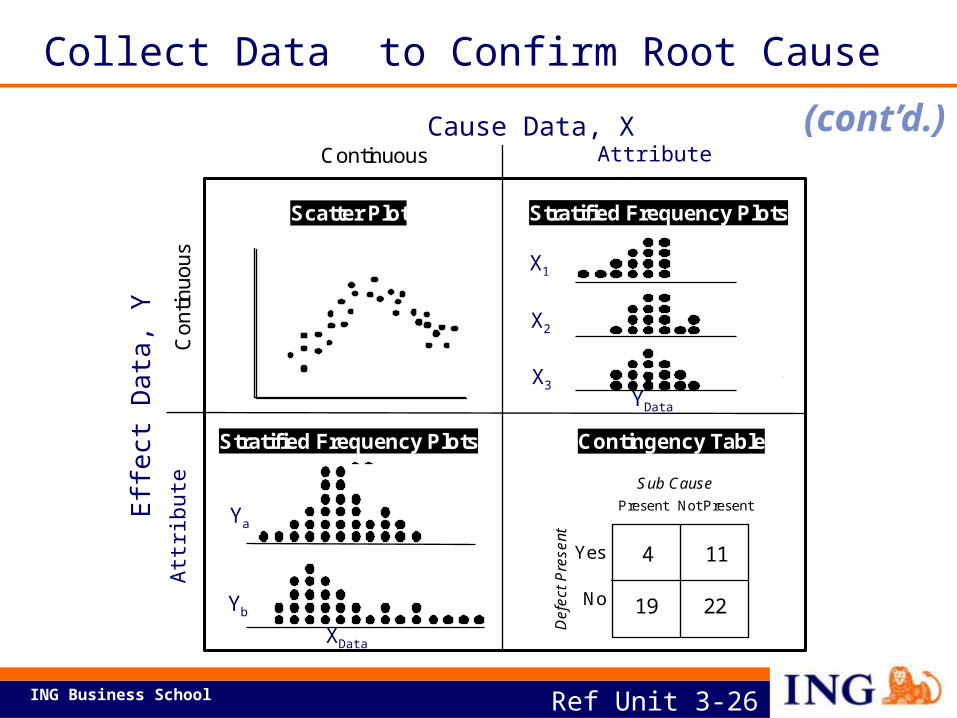
Con
tinuo
usD
iscr
ete
Contingency Table
Scatter Plot
4 11
19 22
Present Not Present
Yes
No
Sub Cause
Def
ect P
rese
nt
Stratified Frequency Plots
Ya
Yb
X Data
X C
ause
Dat
aContinuous Discrete
“Y” Effect Data
Stratified Frequency Plots
X1
X2
X3
Y Data
AttributeA
ttrib
ute
Cause Data, XEff
ect D
ata,
Y
Ya
Yb
X1
X2
X3YData
XData
Ref Unit 3-26
Collect Data to Confirm Root Cause(cont’d.)
ING Business School
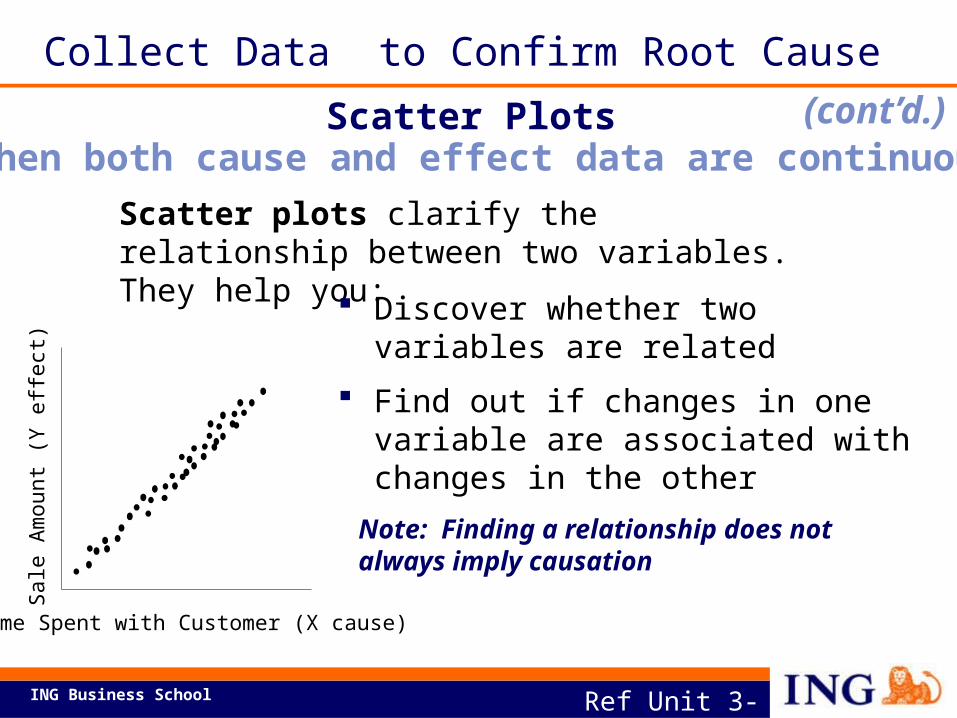
Scatter plots clarify the relationship between two variables. They help you:
Discover whether two variables are related
Find out if changes in one variable are associated with changes in the other
When both cause and effect data are continuous
Time Spent with Customer (X cause)
Sale
Am
ount
(Y e
ffect
)
Note: Finding a relationship does not always imply causation
Ref Unit 3-27
Scatter PlotsCollect Data to Confirm Root Cause
(cont’d.)
ING Business School
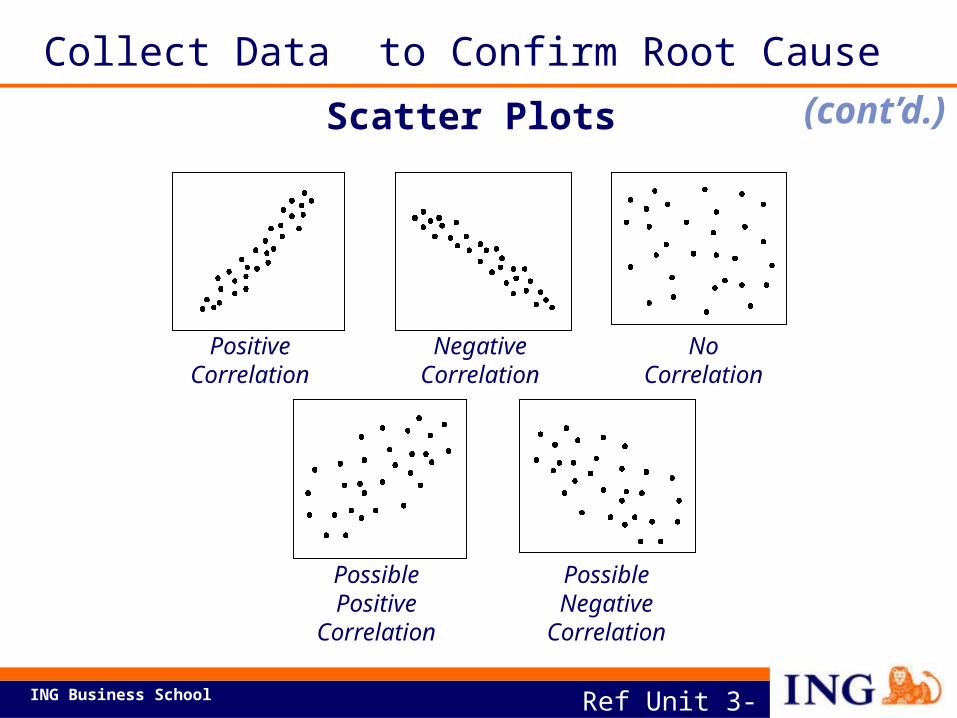
Positive Correlation
Negative Correlation
Possible Positive
Correlation
Possible Negative
Correlation
No Correlation
Ref Unit 3-29
Scatter PlotsCollect Data to Confirm Root Cause
(cont’d.)
ING Business School
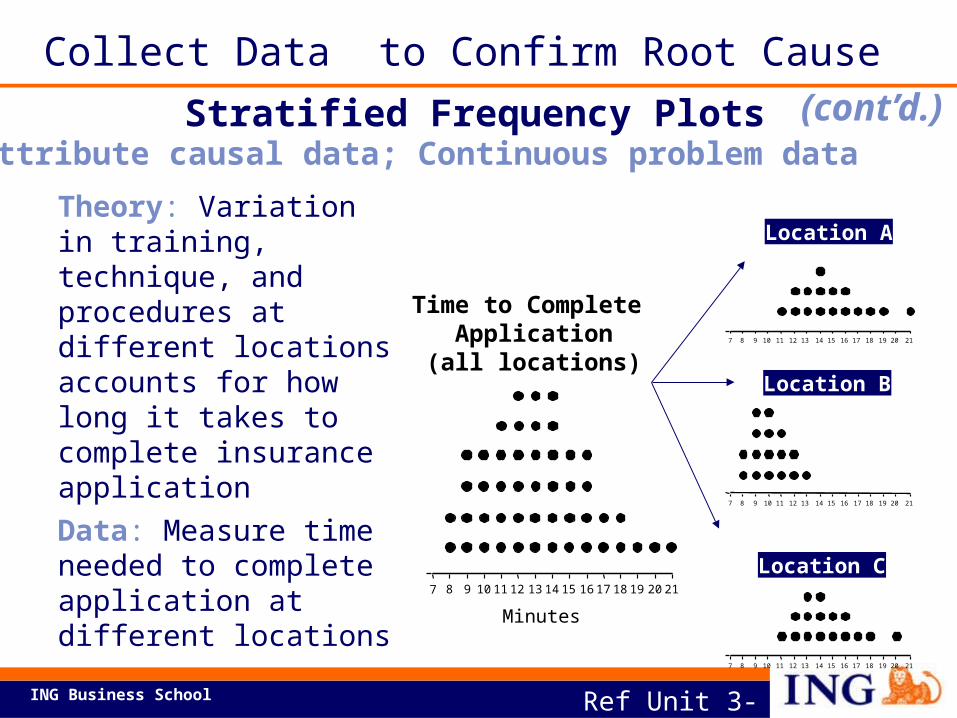
Theory: Variation in training, technique, and procedures at different locations accounts for how long it takes to complete insurance applicationData: Measure time needed to complete application at different locations
8 9 10 11 12 13 14 15 16 17 18 19 20 21
Minutes
7 8 9 10 11 12 13 14 15 16 17 18 19 20 21
7 8 9 10 11 12 13 14 15 16 17 18 19 20 21
7 8 9 10 11 12 13 14 15 16 17 18 19 20 21
Location C
Time to Complete Application(all locations)
Location B
Location A
7
Attribute causal data; Continuous problem data
Ref Unit 3-30a
Stratified Frequency Plots (cont’d.)Collect Data to Confirm Root Cause
ING Business School
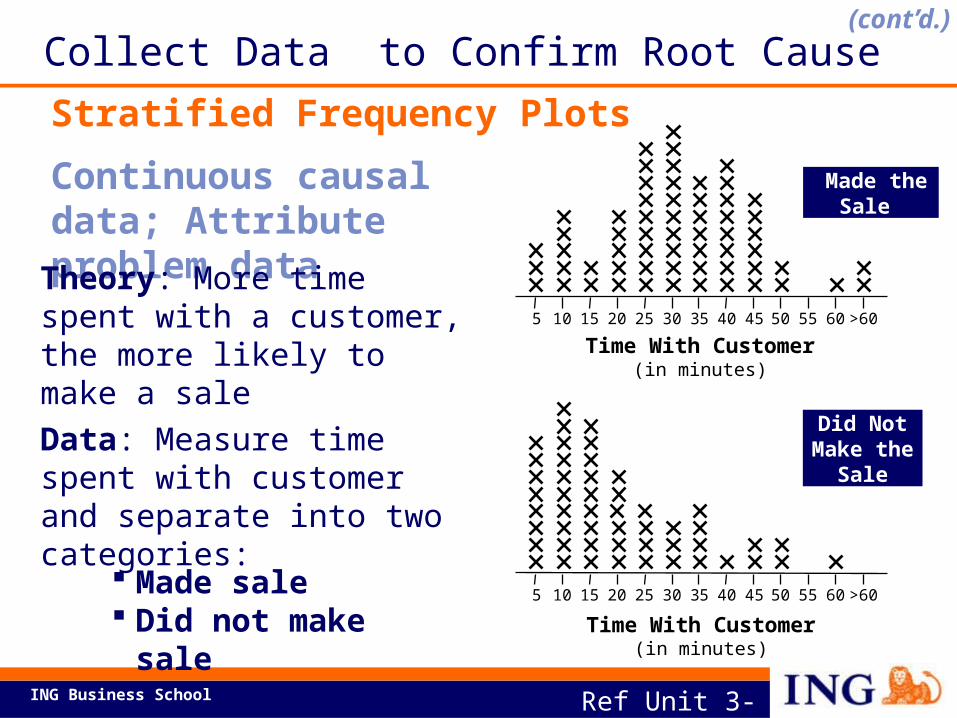
Continuous causal data; Attribute problem data
Theory: More time spent with a customer, the more likely to make a saleData: Measure time spent with customer and separate into two categories:
Time With Customer(in minutes)
Made the Sale
Did Not Make the
Sale
5 10 15 20 25 30 35 40 45 50 55 60 >60
5 10 15 20 25 30 35 40 45 50 55 60 >60
Time With Customer(in minutes)
Made sale Did not make sale
Ref Unit 3-30b
Stratified Frequency PlotsCollect Data to Confirm Root Cause
(cont’d.)
ING Business School
Attribute causal data (x); Attribute problem data (y)
Present
Present
Not Present
77
11
23
89
“Y” Defect:Data errors
A root cause!
“X” Cause: Poor Legibility
n = 200
Not Present
Ref Unit 3-32
Contingency TablesCollect Data to Confirm Root Cause
(cont’d.)
ING Business School
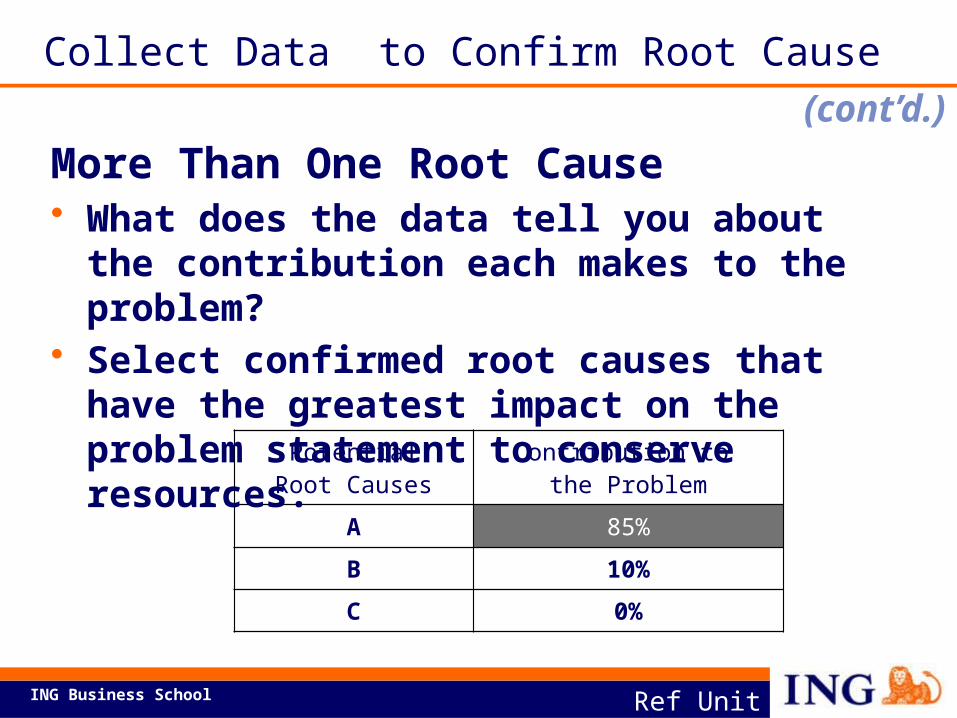
PotentialRoot Causes
Contribution to the Problem
A 85%B 10%C 0%
Ref Unit 3-34
Collect Data to Confirm Root Cause
More Than One Root Cause• What does the data tell you about the
contribution each makes to the problem?• Select confirmed root causes that have the
greatest impact on the problem statement to conserve resources.
(cont’d.)
ING Business School
Create a fishbone diagram for your revised problem statement; Identify potential root causes; Plan how to
confirm root causes with data. Ref Unit 3-35
Activity
ING Business School Ref Unit 3-36
Analyze Tollgate Questions1. What process deficiencies produce wasted
cycle time in your process? Why?2. What potential root causes were identified?
How?3. How do you know whether one root cause
has greater impact than another?4. How was root cause verification
demonstrated?
ING Business School Ref Unit 3-37a
Unit Summary
1. What are the three tests to determine if a process activity is Value-Add?
2. How does cause and effect analysis “peel back” the layers of the causal chain to uncover potential root causes of process problems?
3. What are the components of a fishbone diagram?
4. What is involved when confirming suspected root causes?
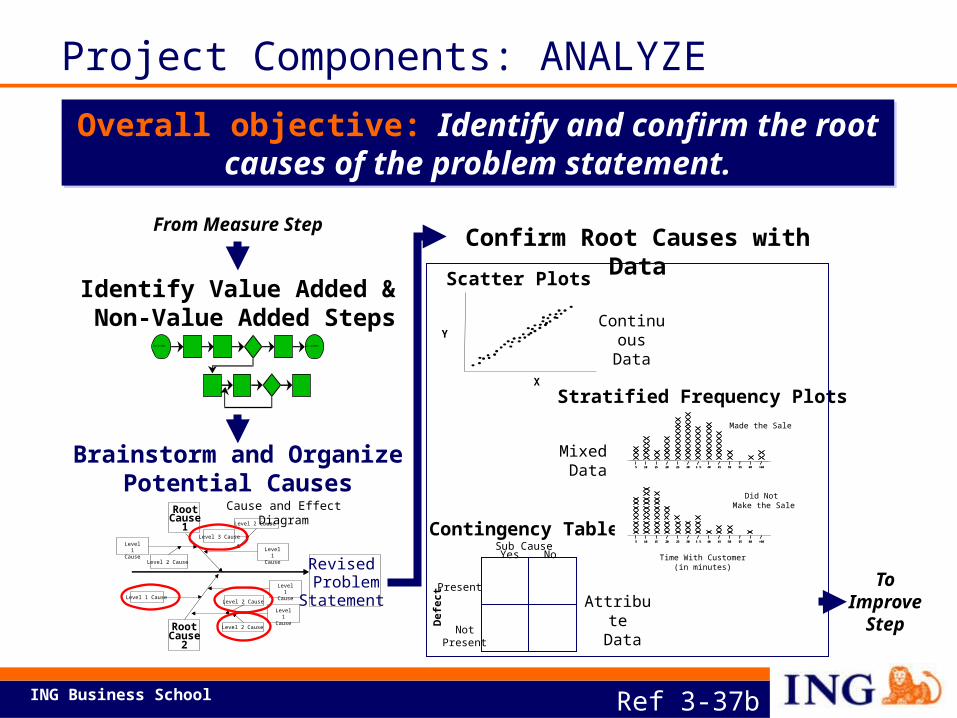
ING Business School
Customer Customer
Identify Value Added & Non-Value Added Steps
Brainstorm and Organize Potential Causes
Confirm Root Causes with Data
Overall objective: Identify and confirm the root causes of the problem statement.
To Improve
Step
Scatter Plots
Y
X
Contingency TableSub CauseYes No
Present
NotPresent
Def
ect
55
55
Made the Sale
Did Not Make the Sale
Time With Customer
(in minutes)
5 10 15 20 25 30 3 5 40 45 50 55 60 >60
5 10 15 20 25 30 3 5 40 45 50 55 60 >60
Made the Sale
Did Not Make the Sale
5 10 15 20 25 30 3 5 40 45 50 55 60 >60
5 10 15 20 25 30 3 5 40 45 50 55 60 >60
Time With Customer(in minutes)
5 10 15 20 25 30 3 5 40 45 50 55 60 >605 10 15 20 25 30 3 5 40 45 50 55 60 >60
5 10 15 20 25 30 3 5 40 45 50 55 60 >605 10 15 20 25 30 3 5 40 45 50 55 60 >60
Stratified Frequency Plots
From Measure Step
RootCause
1
RootCause
2
Level 1 CauseLevel 2 Cause
Cause and Effect Diagram
Revised Problem
Statement Level 1 Cause
Level 1 Cause
Level 2 Cause
Level 2 Cause
Level 3 Cause
Level 1 Cause
Level 1 Cause
Level 2 Cause
Continuous Data
Mixed Data
Attribute Data
Ref 3-37b
Project Components: ANALYZE


