AN INVESTIGATION OF GRADE 11 LEARNERS' UNDERSTANDING OF THE COSINE FUNCTION WITH SKETCHPAD BY C. MAJENGWA (209529036) A mini thesis for the degree of MASTER OF EDUCATION (MATHEMATICS EDUCATION) In the Department of Educational Studies University of KwaZulu Natal SUPERVISOR: Professor M. de Villiers December 2010
Transcript
AN INVESTIGATION OF GRADE 11 LEARNERS' UNDERSTANDING OF THE
COSINE FUNCTION WITH SKETCHPAD
BY
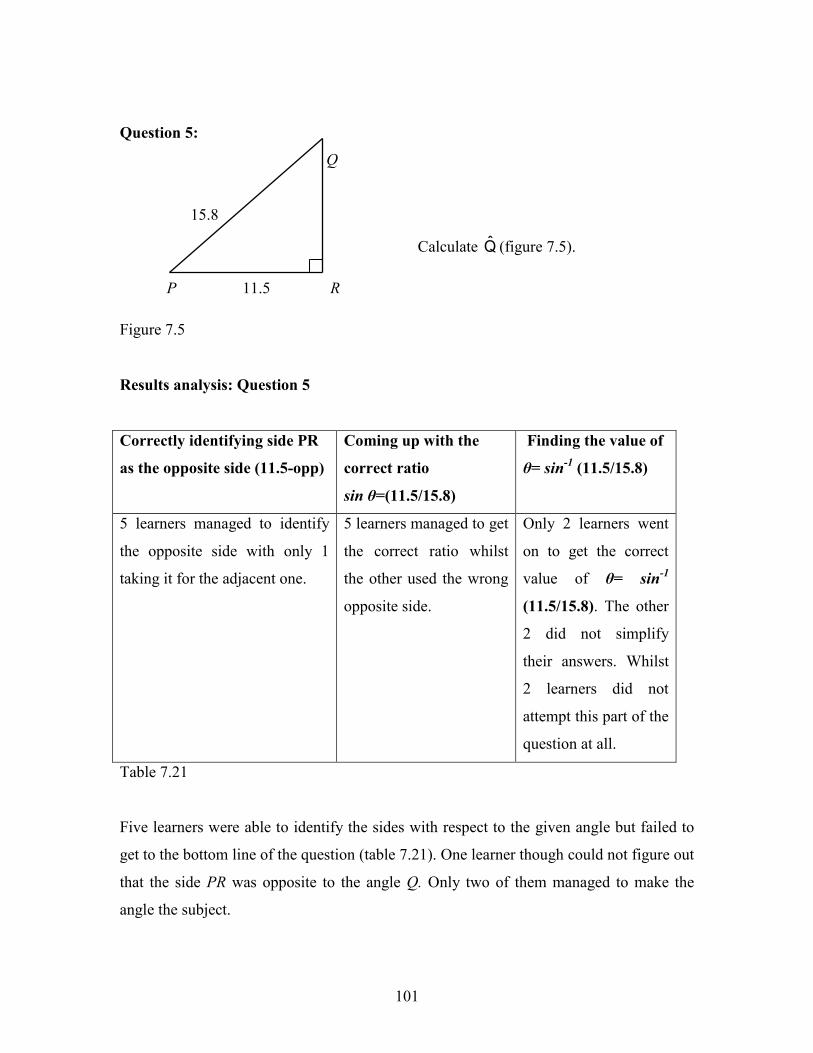
C. MAJENGWA
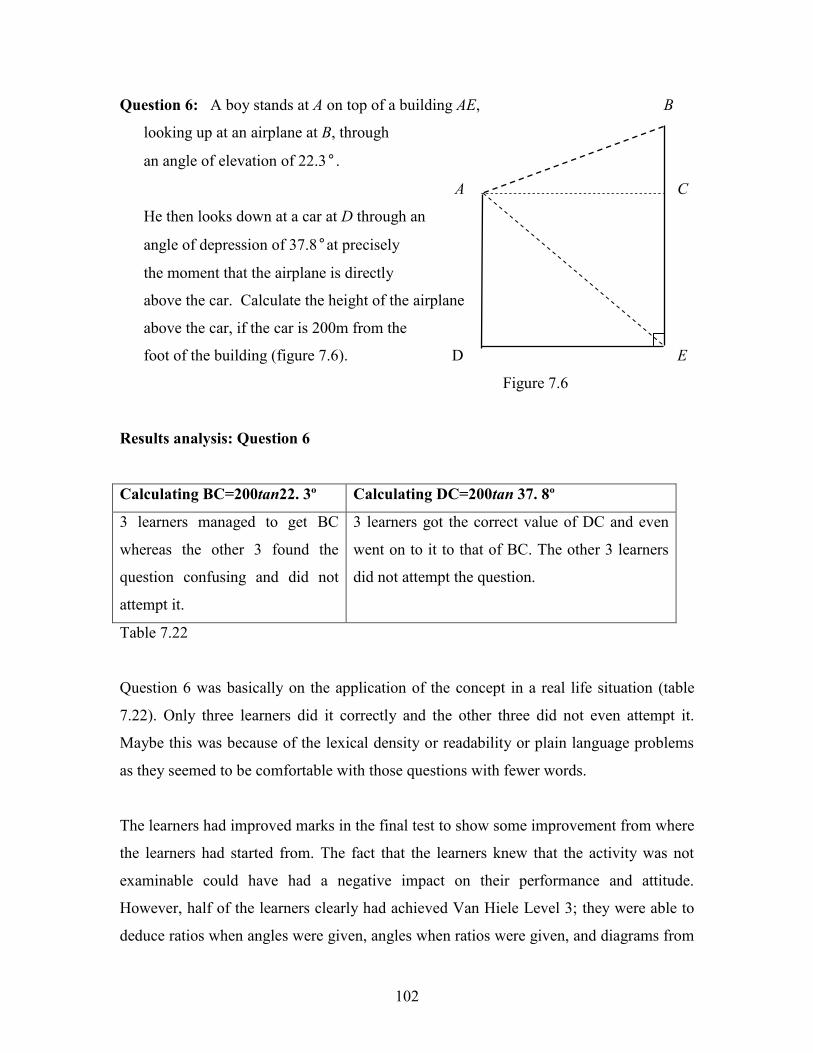
(209529036)
A mini thesis for the degree of
MASTER OF EDUCATION (MATHEMATICS EDUCATION)
In the Department of Educational Studies
University of KwaZulu Natal
SUPERVISOR: Professor M. de Villiers
December 2010
2
ABSTRACT
AN INVESTIGATION OF GRADE 11 LEARNERS’ UNDERSTANDING OF THE
COSINE FUNCTION WITH SKETCHPAD
This study investigated how Grade 11 learners from a school in KwaNdengezi, near
Pinetown, in Durban, understood the cosine function with software known as The
Geometer’s Sketchpad. This was done on the basis of what they had learnt in Grade 10.
The timing was just before they had covered the topic again in their current grade.
The researcher hoped, by using The Geometer’s Sketchpad, to contribute in some small
way to teaching and learning methods that are applicable to the subject. This may also,
hopefully, assist and motivate both teachers and learners to attempt to recreate similar
learning experiences in their schools with the same or similar content and concepts
appropriate to them.
In this research project, data came from learners through task-based interviews and
questionnaires. The school was chosen because of the uniqueness of activities in most
African schools and because it was easily accessible. Most learners do not have access to
computers both in school and at home. This somehow alienates them from modern
learning trends. They also, in many occasions, find it difficult to grasp the knowledge
they receive in class since the medium of instruction is English, a second language to
them.
Another reason is the nature of the teaching and learning process that prevails in such
schools. The Primary Education Upgrading Programme, according to Taylor and
Vinjevold (1999), found out that African learners would mostly listen to their teacher
through-out the lesson. Predominantly, the classroom interaction pattern consists of oral
input by teachers where learners occasionally chant in response. This shows that
questions are asked to check on their attentiveness and that tasks are oriented towards
information acquisition rather than higher cognitive skills. They tend to resort to
3
memorisation.
Despite the fact that trigonometry is one of the topics learners find most challenging, it is
nonetheless very important as it has a lot of applications. The technique of triangulation,
which is used in astronomy to measure the distance to nearby stars, is one of the most
important ones. In geography, distances between landmarks are measured using
trigonometry. It is also used in satellite navigation systems. Trigonometry has proved to
be valuable to global positioning systems. Besides astronomy, financial markets analysis,
electronics, probability theory, and medical imaging (CAT scans and ultrasound), are
other fields which make use of trigonometry.
A study by Blackett and Tall (1991), states that when trigonometry is introduced, most
learners find it difficult to make head or tail out of it. Typically, in trigonometry, pictures
of triangles are aligned to numerical relationships. Learners are expected to understand
ratios such as Cos A= adjacent/hypotenuse. A dynamic approach might have the potential
to change this as it allows the learner to manipulate the diagram and see how its changing
state is related to the corresponding numerical concepts. The learner is thus free to focus
on relationships that are of prime importance, called the principle of selective
construction (Blackett & Tall, 1991). It was along this thought pattern that the study was
carried-out.
Given a self-exploration opportunity within The Geometers' Sketchpad, the study
investigated learners' understanding of the cosine function from their Grade 10 work in
all four quadrants to check on:
What understanding did learners develop of the Cosine function as a function of
an angle in Grade 10?
What intuitions and misconceptions did learners acquire in Grade 10?
Do learners display a greater understanding of the Cosine function when using
Sketchpad?
In particular,
As a ratio of sides of a right-angled triangle?
4
As a functional relationship between input and output values and as depicted in
graphs?
The use of Sketchpad was not only a successful and useful activity for learners but also
proved to be an appropriate tool for answering the above questions. It also served as a
learning tool besides being time-saving in time-consuming activities like sketching
graphs. At the end, there was great improvement in terms of marks in the final test as
compared to the initial one which was the control yard stick.
However, most importantly, the use of a computer in this research revealed some errors
and misconceptions in learners’ mathematics. The learners had anticipated the ratios of
sides to change when the radius of the unit circle did but they discovered otherwise. In
any case, errors and misconceptions are can be understood as a spontaneous result of
learner's efforts to come up with their own knowledge. According to Olivier (1989), these
misconceptions are intelligent constructions based on correct or incomplete (but not
wrong) previous knowledge. Olivier (1989) also argues that teachers should be able to
predict the errors learners would typically make. They should explain how and why
learners make these errors and help learners to correct such misconceptions. In the
analysis of the learners' understanding, correct understandings, as well as misconceptions
in their mathematics were exposed. There also arose some cognitive conflicts that helped
learners to reconstruct their conceptions.
5
DECLARATION
I, Calisto Majengwa (209529036), declare that the research involved in my dissertation
submitted for the Masters of Education degree in Mathematics, entitled “An investigation
of Grade 11 learners’ understanding of the cosine function with Sketchpad ” represents
my own and original work.
__________________________________
Date:
6
ACKNOWLEDGEMENTS This work is dedicated to my wife Fadzai, my mum Patricia, my brother Clive and all my
children.
I would like to say to my supervisor Professor M. de Villiers, thank you for your
unwavering support, guidance, direction and inspiration.
It would not have been possible to carry-out this research without support from the
principal of school and the learners. I also thank the following for rendering their
assistance, knowingly or unknowingly; Joseline Nyakudyara, Dr. J. Naidoo, Dr. N. Amin,
Dr V. Mudaly, Busi Jokomo-Nyathi, Professor P. Pillay, and my class-mates Nomthy,
Introduction ............................................................................................................... 10 1.1 Background to the study ..................................................................................... 10 1.2 Research questions .............................................................................................. 14
1.3 Outline of the report ............................................................................................ 15 CHAPTER TWO .............................................................................................................. 17
The history of trigonometry ...................................................................................... 17 2.1 Overview ............................................................................................................. 17 2.2 Birth of the Cosine function ................................................................................ 23 2.3 A function orientation ......................................................................................... 24 2.4 More functions and tables ................................................................................... 25
CHAPTER THREE .......................................................................................................... 27
3.2 Two methods of introducing trigonometry ......................................................... 27 3.2.1The ratio method ............................................................................................... 28 3.3 The international debate ...................................................................................... 33 3.4 The function vs. unit circle approach .................................................................. 33 3.5 Difficulties in the learning of trigonometry ........................................................ 34
CHAPTER FOUR ............................................................................................................. 36
Theoretical framework: Theories of learning related to mathematics ...................... 36 4.1 Learning theories ................................................................................................ 36
4.1.1 The Behaviourist theory ................................................................................... 36 4.1.2 Constructivism ................................................................................................. 37
4.1.2.1 Misconceptions in mathematics .................................................................... 39 4.1.2.2 The learning of the cosine function .............................................................. 41 4.1.3 Van Hiele theory .............................................................................................. 42 4.1.3.1 Introduction ................................................................................................... 42 4.1.4 This study ......................................................................................................... 43
4.1.4.1 Van Hiele in relation to this study ................................................................ 44 CHAPTER FIVE .............................................................................................................. 45
Review of studies on trigonometry and teaching ...................................................... 45 5.1 Research studies .................................................................................................. 45 5.2 Symbols as process and objects .......................................................................... 46
8
5.3 The impact of methods and procedures on learners’ conceptions of ratio and function ..................................................................................................................... 47 5.4 The metaphor of a converter ............................................................................... 48 5.5 The scale factor method for solving triangles ..................................................... 49 5.6 The teaching of mathematics using a computer .................................................. 49 5.6.1 Micro worlds .................................................................................................... 49 5.6.2 Visual reasoning............................................................................................... 51 5.6.3 Computer-aided instruction ............................................................................. 53 5.6.4 Negative factors in computer implementation ................................................. 59
CHAPTER SIX ................................................................................................................. 60
Research design and methodology............................................................................ 60
6.1 Methodological framework ................................................................................. 60 6.2 The sample .......................................................................................................... 61 6.3 The interview and microteaching experiment ..................................................... 63 6.4 The interview task ............................................................................................... 64 6.5 The study ............................................................................................................. 70 6.6 Transcripts of interview ...................................................................................... 72
Analysis and results .................................................................................................. 74 7.1 Introduction ......................................................................................................... 74 7.2 Theoretical framework ........................................................................................ 74 7.3 A Ratio orientation .............................................................................................. 74
7.4 Methods and procedures ..................................................................................... 75 7.4.1 Analysis of the initial trigonometry test results ............................................... 75 7.5.2 Analysis of Sketchpad activity ......................................................................... 82 7.5.2.1 Interview Question 1.1: Do learners understand the cosine function as a relationship between input and output values and as a ratio of sides of a right-angled triangle in different quadrants? ................................................................................. 82 7.5.2.1.1 Category 1: x changes and r stays the same ............................................... 83 7.5.2.1.2 Category 2- Both x and r decrease, or x decreases and r remains the same................................................................................................................................... 85
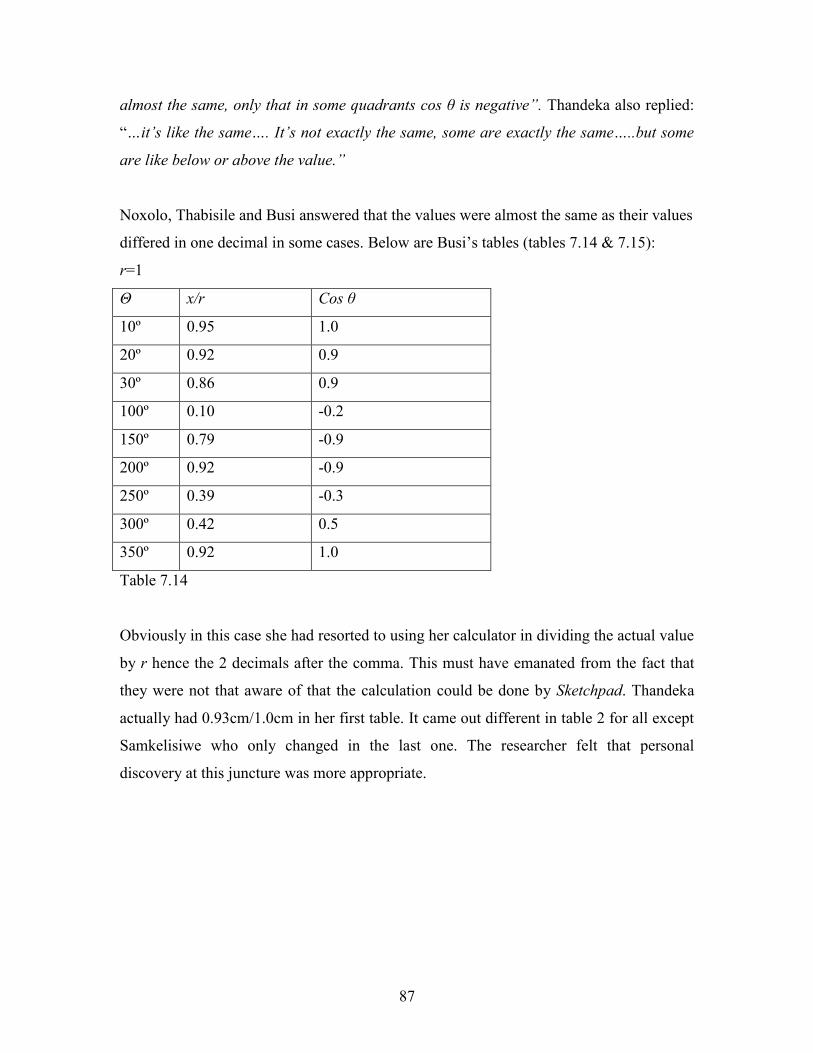
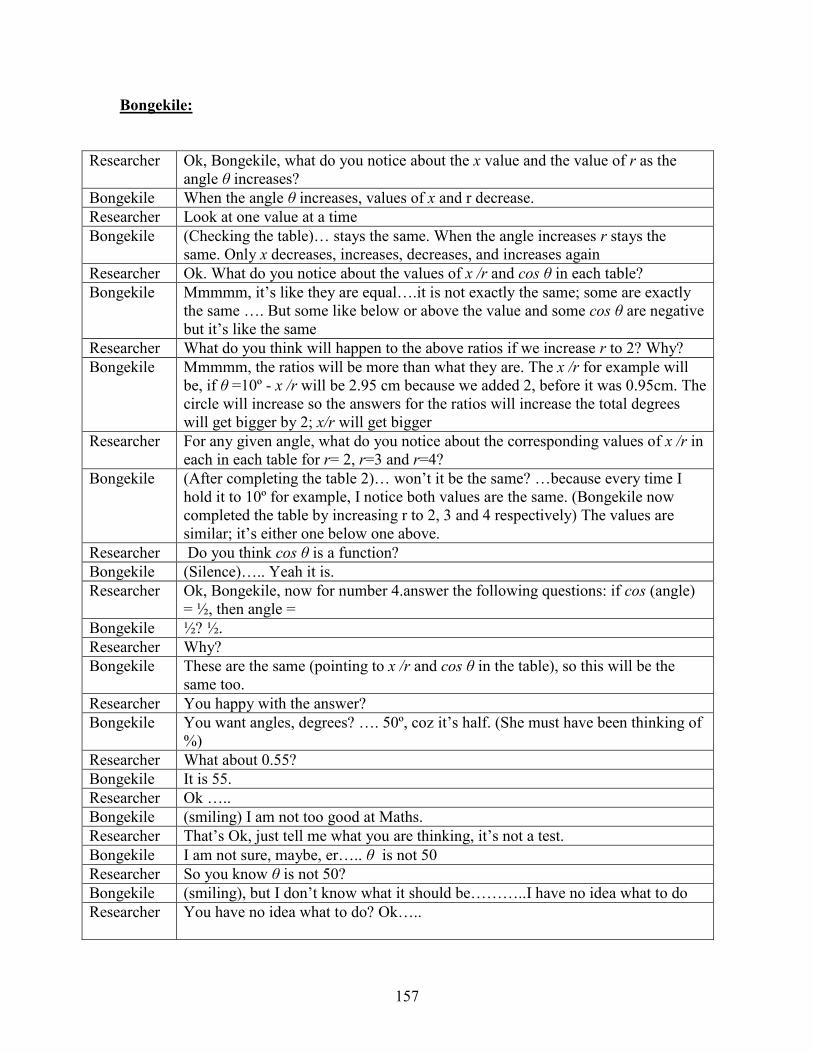
7.5.2.2 Interview Question 1.2: Do learners see cos θ as a ratio of two sides x and r?................................................................................................................................... 86
7.5.2.2.1 x/r and cos θ are the same .......................................................................... 86 7.5.2.2 Interview Question 2: Do learners see that cos θ is independent of r? ......... 88 7.5.2.2.1 The ratio x/r will increase .......................................................................... 89 7.5.2.3 Interview Question 3: Are learners are able to generalize that cosine θ is independent of r? ...................................................................................................... 90
7.5.2.4 Interview Question 4: Are learners able to estimate the size of an angle given a ratio only?............................................................................................................... 91 7.5.2.4.1 If cos (angles) = ½ then the angles are _____and______? ........................ 91 7.5.2.4.1.1 The use of Sketchpad .............................................................................. 91 7.5.2.4.1.2 The use of a table .................................................................................... 92 7.5.2.4.2 Estimating the value of the angles if x/r = 0.55 ......................................... 93
9
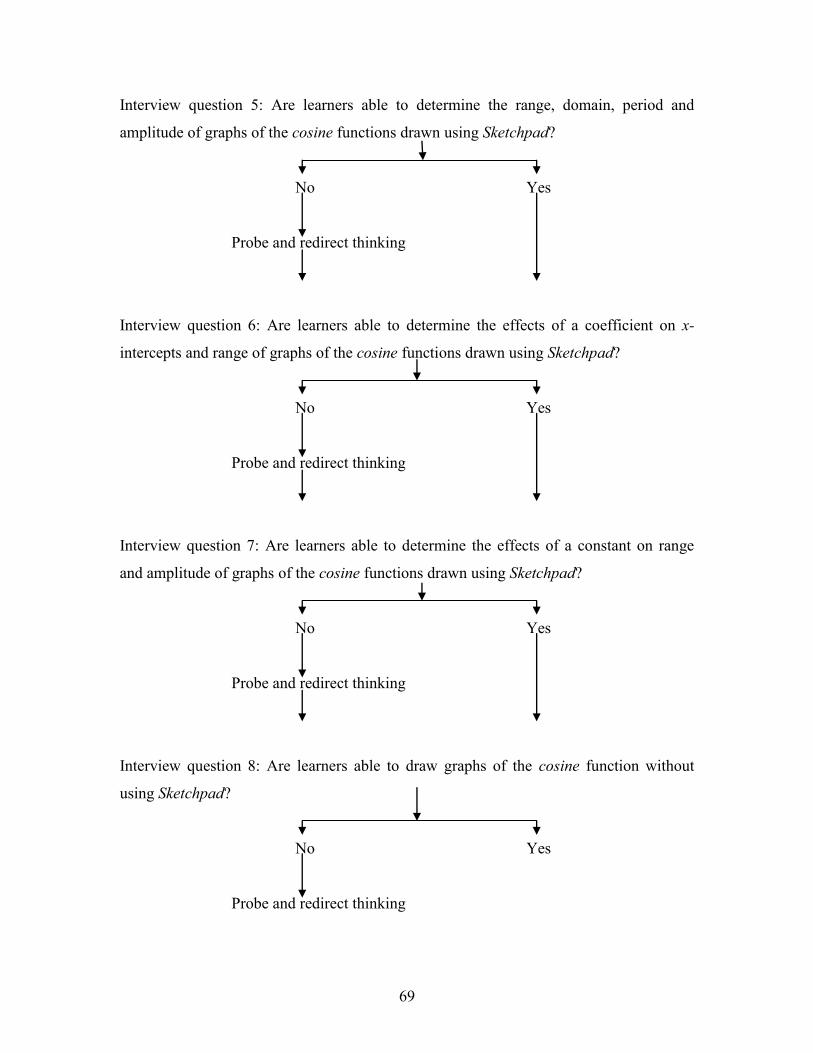
7.5.2.5 Interview Question 5: Are learners able to determine range, domain, period and amplitude of a graph of cosine? ......................................................................... 94 7.5.2.6 Interview Question 6: Are learners able to determine the effect of the coefficient of cosine (y = a cos x) on x- intercepts and range if it is increased, decreased, less than 0? .............................................................................................. 94 7.5.2.7 Interview Question 7: Are learners able to determine the effect of a constant (y = cos x + q) on amplitude and range of a cosine graph if it is greater or less than 0? ............................................................................................................................... 95 7.5.2.8 Interview Question 8: Are learners able to draw the graphs of y=cos x -2 and y=-2cos x without the aid of the computer? .............................................................. 96 7.5.3 Analysis of the final trigonometry test results ................................................. 96 7.5.4 Analysis of the research questions ................................................................. 103
Conclusions and recommendations......................................................................... 108 8.1 Introduction ....................................................................................................... 108 8.2 Summary of findings......................................................................................... 108 8.3 Overall findings ................................................................................................ 108 8.3.1 Initial Test Questions ..................................................................................... 110 8.3.2 Interview Questions during Sketchpad .......................................................... 110 8.3.3 Final Test Questions ...................................................................................... 112 8.4 Misconceptions and Constructivism ................................................................. 114 8.5 Van Hiele theory ............................................................................................... 115 8.6 Learners’ understanding of ratio ....................................................................... 116
8.7 Difficulties with learning trigonometry ............................................................ 117 8.7.1 Converting between angle and ratio .............................................................. 117 8.8 Recommendations ............................................................................................. 118 8.8.1 Classroom practice ......................................................................................... 118 8.8.1.1 Computer Software ..................................................................................... 118 8.8.1.2 Classroom strategies ................................................................................... 118 8.8.3 Changes to the curriculum ............................................................................. 119 8.9 Short-comings of my research .......................................................................... 120 8.10 Further research .............................................................................................. 121
1.1 Background to the study Curriculum reform appears to be pushing teachers to a paradigm shift in their practices
towards more participatory and inquiry-based methods (Pournara, 2001) where learners'
meanings are given greater credence. This places demand on teachers since they are
expected to understand learners' meanings and mediate between learners' personal
meanings and public mathematical meanings. It is therefore important, according to
Pournara (2001, p.2) "that we understand how learners make sense of mathematical
concepts in order to support teachers in making the transition to new pedagogical
approaches in the teaching of mathematics."
My broad personal experience of teaching trigonometry at Grade 10 to 12 level,
observation and discussion with other teachers support the findings that the mathematical
knowledge of secondary schools learners is dominated by content and teacher- centred
pedagogies. Learners have constantly indicated difficulty in learning trigonometric
functions whenever the topic is being done. Many a mathematics teacher also see it an
uphill task to aid learners to make sense out this topic. It is hoped that giving learners
some sort of visual intuition about circles, angles, and graphs, might help create more
meaningful relational understanding and, possibly, eliminate some unnecessary
misconceptions.
As a teacher of mathematics in high school, I am aware of the struggles learners face
when trying to understand this subject. I was looking for a way which would help
learners create concrete knowledge on their own. The idea was to expose the learners to a
picture of the unit circle with a right angle in it when they thought about the cosine
function. It was hoped that such a dynamic sketch would help learners gain first-hand
experience and conviction of relationships in trigonometry. A concrete example would be
why the cosine of a given angle changes depending on the given quadrant. This research
11
focused on learners' understanding of the cosine function, after some initial introduction,
hence the choice of Grade 11 level.
According to the constructivist perspective, the teacher is not able to pass on knowledge
as something complete without any flaws to learners. They ought to construct or
reconstruct concepts for themselves, as they do not easily accommodate or assimilate
knew ideas (Olivier 1989). Learning involves the interaction between a learner's
previously acquired knowledge and new knowledge or concepts. This internal activity
involves two interrelated processes according to Olivier (1989) called assimilation and
accommodation. Accordingly, the use of dynamic software accords the learners an
opportunity to experience varying conditions of aspects as they construct concepts
themselves.
Many learners appear to have little understanding (Pournara, 2001) of underlying
trigonometric principles. They resort to memorizing and applying procedures and rules
even though many are able to do this successfully. They tend to ignore conceptual aspects
of its objects. Skemp (1976), states that this has led many novice trigonometry learners to
develop an instrumental rather than a relational understanding. They concentrate on
trigonometry algorithms and learning ‘how to’ rather than ‘why’. This study (2010) was
mainly based on trying to find a way of changing the above scenario by using Sketchpad.
In most cases, to grasp an idea is basically to have it fit into an appropriate existing group
of ideas, a schema. Consequently, if the new idea is very different from any of the
available schemas, it would be impossible to stick to any of them. In such cases
assimilation and accommodation is impossible as the learner creates a new “box” and
tries to memorize the idea. This, according to Olivier (1989), is rote-learning. It is not
related to any previously acquired knowledge. It will be difficult for the learner to
understand this kind of knowledge. Such knowledge is isolated and cannot be recalled
whenever necessary. It can be argued then, that the cause of many mistakes in
mathematics is rote-learning. Learners try to recall things that they cannot fully
remember. In most cases they seem to fail to link the concept of trigonometry to any of
12
the previously learnt ones. It was then hoped that the use of dynamic computer software
could assist them in linking it with other functions.
The second International Mathematics Study suggests that secondary school learners
have not mastered the elementary pre-calculus topics of function, graphing and “teacher
centred’’ problem solving (Waits & Demana, 1998). Looking through recent research, it
is possible to note the increase of studies based on the constructivist point of view, using
the computer (Wenzelburger, 1992, Matthews, 2002, Powell & Kalina 2009). Also
documented are increased studies in mathematics in everyday life (Johnston-Wilder &
Pimm, 2005, Taylor, 2000) as well as studies encompassing both contexts (Magina,
1994). Graphing using Geometer’s Sketchpad is a lot easier and faster and gives a learner
the opportunity to concentrate on other aspects of graphs rather than the sketching itself
using free hand.
In trigonometry teaching, according to Hart (1981, p.22), “there have been attempts to
move away from a process-oriented style of teaching and learning which may have
prevented leaner understanding of important concepts”. Recent research has sought to
use computer software to improve understanding and simplification of concepts. This
research attempts to cement this and further spread it to other mathematical topics. In the
present curriculum, the topic of trigonometry has many aspects and takes a long time to
complete. Some of the time-consuming aspects are the static sketches and graphs made
by hand on chalk boards. This could easily be alleviated by the use of the computer.
Teacher education around the new curriculum has emphasized learner activity,
participation and group work as central aspects of classrooms (Brodie, 1998). Teachers
are encouraged to facilitate learning rather than provide instruction. A paradigm shift
from practices is urged. The past practice is characterized by being teacher-centred and
encouraging passive learners. The learners engage in individualized rote-learning rather
creative and flexible thinking (National Department of Education, 2002). Although e-
learning and e-classrooms are now a common sight in most private schools, they are still
rare species in most government schools.
13
In recent years, according to the NCTM (1989), mathematics educators have focused
attention on rethinking the process of mathematics education. Teachers and faculty are
urged to improve not only the cognitive side of instruction, but also the emphasis on non-
cognitive issues. These include learners’ feelings, attitudes, beliefs, interests, expectations
and motivations. Learners are most likely to change their attitudes towards mathematics
and could be motivated when given a chance to use the computer in class as they are
familiar with and enjoy playing games on computer, mobile phones and other gadgets.
Machado (1996, p.34) highlights that the teaching process might be contributing to errors
and failure in mathematics. The emphasis is on ‘‘formal procedures (algorithms and
rules)”, unrelated to the concept that supports them. This prevents the flexibility of
thought that is necessary for success in mathematics. The computer intervention comes in
handy as an alternative teaching process that might avert and alleviate the errors and
failure in this subject.
The importance of the use computers in mathematics is well researched (Tall, 1989;
Leinhardt, Zaslavsky et, al 1990; Duren 1991). In particular, the benefit of the use of the
computer software on learners’ understanding of the concept (Breindenbach, Dubinsky et
al 1992) and in developing a visual approach to transformation and graphs (Bloom,
Comber et, al 1986; 1992), have been demonstrated. Mudaly (2004) further supports the
use of computer software. He outlines that Sketchpad could be used effectively to answer
mathematical questions. Trigonometry is one of the areas of mathematics most
convenient for the use of a computer.
In most cases, in the day to day classroom teaching, when learners make errors,
corrections are handed down by the teacher as an external authority. Usually learners do
not use their own abilities to evaluate and correct their own work nor are they encouraged
to do so. Von Glasersfeld (1987, p.14) has noted that this kind of correction is “not
completely satisfactory” because it denies learners the opportunity to restructure their
own conceptual schemas. This does give them the opportunity to have meaningful
learning take place in their minds. They tend to give more importance to the answer than
14
the working procedure.
From a constructivist point of view, according to Von Glasersfeld (1987), it cannot be
assumed that simply telling someone that he/she has done something right results in
powerful cognitive satisfaction, as long as rightness is assessed by someone else.
‘Rightness’ should be viewed as something that comes from self-introspection if it is to
become a source of real satisfaction. It is argued that such cognitive satisfaction could be
gained through investigative work in learner-centred teaching, which is most effective
when mediated by a computer.
This study also sought to address the gap in the research literature on learners’
understanding on trigonometric concepts. Not much research has been done on various
content areas of mathematics internationally and locally. According to Pournara (2001), a
survey of Dissertation Abstracts internationally identified only two master’s
dissertations/doctorates in the area of trigonometry in the period 1995-1999. There are
some articles in mathematics teaching journals on methods of teaching trigonometry (e.g.
Dooley, 1968; Satty, 1976) which are generally based on personal opinions and
experiences rather than on empirical research, he adds. These have given little or no
attention given to learners’ thinking about trigonometry
1.2 Research questions The purpose of this study was to find out whether or not Sketchpad could be of some
importance as a mathematical tool for learners to better understand trigonometry. It also
sought to find out if learners are not laboring under a misapprehension of the concept.
This was done such that the researcher would not necessarily adopt an adversarial
position as the researcher was not teaching these learners in that grade. Since the topic is
introduced in Grade 10, the study does not completely throw cold water on efforts
previously undertaken, but as a matter of necessity, tries to demystify a topic that
deserves more than just a thoughtful consideration. Sketchpad was used to see if it could
make a significant difference, to provide an important contribution to mathematics
education.
15
The theoretical and empirical part of this research is focused on the following major
research questions:
1. What understanding did learners develop of the Cosine function as a
function of an angle in Grade 10?
2. What intuitions and misconceptions did learners acquire in Grade 10?
3. Do learners display a greater understanding of the Cosine function when
using Sketchpad?
More specifically, given the self-exploration opportunity within The Geometers'
Sketchpad, the study investigates the development of learners’ understanding and
misconceptions of the cosine function regards the following:
4. As a ratio of sides of a right angled triangles?
5. As a relation between the angle as input and a function value as output in
the specific context of graphs?
The study tried to answer the research questions 1 and 2 using a preliminary test which
was used as a control level. As the learners worked with Sketchpad to go through their
tasks, more answers to research questions 1 and 2 also emerged. Geometer’s Sketchpad
was used to answer research question 3 which provided data on the quality of responses
as the learners went through their research tasks, during probing and when they wrote the
final test. The study tools, the tests and Sketchpad were used in relation to 4 and 5.
1.3 Outline of the report Chapter two briefly discusses the importance of the history of mathematics for
understanding how human beings or mathematicians learnt mathematics in general. More
particularly, this chapter looks at the history of trigonometry and how it possibly provides
some guidelines to designing a trigonometry curriculum. It serves to highlight the
potential socio-cultural role a historical perspective of mathematics can have. It also
provides information on broad educational and social policy, as a guideline to the South
African curriculum, its guiding principles and frames of reference. The Revised National
Curriculum Statement (RNCS) (DoE, 2002, p.13) also acknowledges the importance of
the history of mathematics as it indicates that a Mathematics Learning Area should
16
develop “an appreciation for the diverse historical, cultural and social practices of
Mathematics”.
In chapter three some of the different approaches to trigonometry in the curriculum, are
discussed and analysed in order to provide a background to the research. The difficulties
of learning trigonometry are also discussed. Chapter four develops the theories of
learning and the theoretical frame work for this study which are constructivism and the
Van Hiele theory.
Chapter five deals with the review of the literature related to this study. Chapter six
addresses the research design and methodology while Chapter seven provides an analysis
and the results of the research. Chapter eight deals with a summary of the main points of
the analyses and looks at the implications of the findings for the teaching and learning of
trigonometry in some South African schools.
17
CHAPTER TWO
The history of trigonometry
2.1 Overview This chapter mainly focuses on how trigonometry and the concept of a function evolved
to be what they are today. The importance of knowing the history of these two and how
they emerged is also discussed. This is relevant to the teaching and learning process of
this topic and its aspects as the computer intervention in isolation would not make much
sense.
The definition of trigonometry is basically from the Greek words “trigono” which is
triangle, while “metria” is measure (Bressoud, 2010). The term trigonometry was
probably invented by the German mathematician Bartholomaeus Pitiscus whose work
was first published in 1595. According to De Villiers (2010, unpublished lecture notes),
the use of trigonometric functions arose from the use of chords of a circle in mathematics
and astronomy. The term trigonometry means “the study of triangles”. It was first used
by the ancient Greeks to aid in the study of astronomy. De Villiers (2010) also states that
evidence has been found in works from many other countries, including China and India.
Trigonometry was used as long ago as over 2000 years to calculate the height of
mountains, to navigate across seas, to survey large areas for farming and to determine the
distance between the earth and the moon.
The history of mathematics, however, cannot answer directly routine questions in the
teaching of mathematics (Fauvel, 1991). However, it normally serves to shed light the
relationship between mathematics and social policy in general. This approach serves to
uncover the relevant frames of reference. The use of the history of mathematics can also
illuminate guiding principles as well as other theoretical aspects which routine questions
might raise. In addition, the history of education provides some necessary knowledge for
the background principles, basic understanding and routine action in education.
18
Planning the curriculum involves more than choosing the facts and theories to be taught.
We must also foresee in what sequence and by what methods those facts and theories
should or could be taught (Polya, 1981). This shows that it is sometimes important for
learners to know some facts and theories of some mathematics topics for them to better
understand these topics.
Polya (1981) states that the learner should retrace the paths followed by the original
discoverers and rediscover what he/she has to learn. He further states that teaching can be
stated in various ways. In teaching a branch of science (a theory or a concept) we should
let the learner retrace the great steps of the mental evolution of human race. This helps
the educator to anticipate how the learner might assimilate the same knowledge.
There are thus two issues regarding the history of mathematics and trigonometry. Hull
(1969) states that the direct use of historical material can give learners a better cultural,
socio historical perspective on why and how trigonometry was developed. He also
supports the view that it may give an idea or good guideline on how the curriculum might
be structured. This suggests that the teaching of trigonometry has to be linked to its
historical background when imparted to learners in class.
According to De Villiers (2008), the history of mathematics can also lead to the
identification of some general patterns and trends by which mathematical content evolved
and was invented. These patterns and processes could then be utilized as possible
teaching approaches without any direct reference to the history of the particular content
being taught. He asserts that there are at least four ways in which a teacher can use the
history of mathematics:
1) As a concept, algorithm or theorem looking at its historical development.
2) As a historical development of the most significant moments in chronological order.
3) As an analysis of the historical development, with no historical material, of the
particular concepts, algorithms and theorems (the indirect genetic method)
19
4) As an attempt to simulate with the advantage of hindsight, how particular concepts,
algorithms and theorems might have been discovered and/or invented through typical
mathematical processes or ways of thinking.
The history of mathematics is not clearly presented in the current curricula. However,
there are some mathematics textbooks that do include information on important historical
figures and outstanding events. This information is not compulsory and is mostly
considered not that important by teachers when imparting mathematical knowledge.
Thus, this chapter highlights the importance of using the history of mathematics in the
classroom and explores the historical path of the emergence of the cosine function.
The National Council of Teachers of Mathematics (NCTM, 1989) views the history of
mathematics as important in the classroom. To that effect, material on the history of
mathematics has been produced in accordance to classroom needs. This is also supported
by John Fauvel (1991). He came up with a list of reasons to support the use of history of
mathematics in classrooms. The list had guide-lines on how a teacher could effectively
use history in mathematics.
Normally, a learner might not be in a position to understand some phrases and thought
patterns that uphold mathematical knowledge. In such cases the historical background
becomes a necessity. The learner might get it from a learning process that is directly
linked to the ancient way by which humankind worked its way up to mathematical
knowledge. Mathematics history can also motivate some learners through its beauty and
logical structure.
History also shows us how some of the definitions used today were developed. For
instance, the definition of a function developed as follows (De Villiers, 1984);
- The first definition only appeared after the Renaissance, when Jean Bernoulli in 1718
stated it as a unit comprised of a variable and constants.
- Then Euler in 1748 stated it as any analytic expression whatsoever made up of a
variable quantity including numbers or constants
20
- Euler in 1750 stated that quantities that are dependent on others, such that as the second
changes, so does the first, are said to be functions.
- Then Dirichlet in 1837, talked of a relationship between two variables, where numerical
values assigned to one will affect the other one. These definitions include the idea of
functional dependence; however the following does not.
- The formal set-theoretic definition of around 1880 used by John Venn, George Boole,
Auguste’ de Morgan and others that we use today (De Villiers 1984), where a function is
a seen as an ordered pair (a; b). The domain is represented by a, and the range by b. Each
element of a, belongs precisely to one ordered pair of the function and is thus uniquely
related to a single element of b. There are numerous other definitions that may be traced
backwards. This might be helpful to both educators and learners to take longer periods
when dealing with some topics and aspects of mathematics as they see the time it took
them to be where they are today.
A function can also be represented by tables and graphs. De Villiers (2010, unpublished
lecture notes) asserts that tables of values and the Cartesian graph did not exist at the time
of the Greeks because they did not have the co-ordinate system. This does not mean that
the concept of a function did not exist. Maybe it was not explicated and they did not
formulate it, but they certainly had an intuitive understanding. This is the whole
distinction by Tall (1989) between concept image and concept definition. Newton and
Leibniz did not have a concept definition for limits and functions, but they had a good
understanding of what a limit of a function is, even though they did not have a formal
definition.
Euclid, 300 BC, saw trigonometry as part of geometry. From the 1600s onwards, people
battled with the trigonometric/ algebraic function. The late historical development of the
co-ordinate system suggests that it may not be such an easy idea (De Villiers, 2010,
unpublished lecture notes). The co-ordinate system developed from physics, mechanics,
and astronomy. The more problems that involved periodic motion required the use of
functions, the more they needed to further concept of trigonometry.
21
The idea for the definition and concept of a function also developed later (De Villiers,
2010, unpublished lecture notes). There was a need for the concept of a function as
people were beginning more and more to apply mathematics and science to phenomena
that involved periodic function. This shows that the motivation for the development of
the function definition was from different kinds of practical consideration.
The quest to formally clarify what a function is arose from the dramatically increasing
application from the 1600s and onwards, of mathematical functions and calculus to
scientific problems of motion and forces (De Villiers, 2010, unpublished). In turn, this
had been made possible by the development in the 1600s of the algebraic symbolism and
nation. The Cartesian co-ordinate system, which simplified the antiquated methods of the
ancient Hindus, Greeks, and Arabs, also emerged. On the other hand, this late
development of the formalisation of the concept, also suggests it may be conceptually a
subtle and deep idea.
At times, we might have all the characteristics of a particular concept listed, but that
would not be an economical definition. A definition only selects a small subset of that, as
necessary and sufficient conditions, which become a concept definition (De Villiers,
1984). A definition does not include all the properties. One of the dangers and problems
of teaching is that people think that if they use the formal definition then they would have
covered all aspects. The circle definition, which was formalized over a number of stages,
includes a small portion of the kind of concept image that learners should have.
When learning trigonometry, learners should certainly have the concept image of a ratio
and of a right triangle. This would make it easier for them to solve application questions,
since that is the most useful concept for applications. A good example of the use of this
concept would be the need to model periodic functions in physics which we do not even
deal with at school. We do not deal with the practical aspects of periodic functions either.
This can only be possible maybe if we deal with pendulums that are regular or rotating
wheels, tides or the cycles of the moon and so forth. Evidently then, one must question
the idea of starting with the circle definition as it is a limited from a practical perspective.
22
It only abstracts and selects certain aspects that are useful for a certain perspective.
Drawing on the history of mathematics, it becomes clear that trigonometry was initially
used for practical applications. In terms of the teaching and learning process we come up
with the problem-centred approach which states that one should start with a practical
problem that motivates the development of new content. Historically, this is how
trigonometry developed. There was a practical need to build buildings, to find out the
time of the seasons and for astronomy and for that they needed some apparatus, the tool
they developed was trigonometry. This tells us that mathematics does not develop on its
own; it develops to solve practical and theoretical problems.
Much of the work of abstract algebra for example, field theory and ring theory as we
know them today, developed to solve some problems in ordinary algebra of the real
number system (Bressoud, 2010). For the solving of polynomials of higher order to
understand why they could not find the general form, it was necessary to develop abstract
algebra. There were theoretical reasons which tell us that if we want to follow the
problem-centred approach, we need to choose and select good starting problems that can
similarly motivate a learner to see the need for trigonometry and beyond.
According to Kennedy (1991) these developments originated in the general region of the
eastern Mediterranean, were recorded by people writing in Greek, and were well
established by the second century of the era. The centre of activity then shifted to India
(where the chord function was transformed into varieties of the sine), and thence it
moved part of the way back. In the region stretching from Syria to central Asia, and from
the ninth century up to the fifteenth, trigonometric functions were elaborately tabulated in
the form of sexadecimals. This development helped the emergence of the first real
trigonometry in the sense that only then did the object of study become the sides and
angles of spherical or plane triangles.
Kennedy (1991, p.359) also states that the Almagest is of interest to the mathematician
because of the trigonometric identities Ptolemy devised to help him in compiling his table
23
of chords (which is roughly equivalent to the sine table). Subsequently, as the locus of
activity in astronomy moved to Europe, so also did the new trigonometry. According to
Kennedy (1991), the same type of work occupied Oriental scientists whereas
development of tables and functions from the triangle continued in the West.
By the end of the eighteenth century, according to Fuhrer (1987), Leonard Euler and the
others had exhibited all the theorems of trigonometry as corollaries of complex function
theory. As a school subject, however, especially useful for surveyors and navigators,
trigonometry still keeps its separate identity.
Here the account is confined to the leaders in the field of working with triangles; their
predecessors and rank-and-file contemporaries operated on a more primitive level, but
they created the background without which these leaders could not have existed.
According to Kennedy (1991), knowledge of the subject was not smooth in terms of
growth. There was a lot of discontinuity though in series. Important advances made at
one time and place sometimes only spread slowly, sometimes not at all, sometimes
disappearing only to be rediscovered later.
2.2 Birth of the Cosine function According to De Villiers (2010, unpublished lecture notes), the cosine function is a co-
function of the sine function. The sine function itself emanated from the applications of a
chord (plane as well as spherical). Eventually they thought of calculating and using half
the chord of double an arc. Once this was done, the sine function had been born. He
further states that in the earliest days a scale diagram was used. This is the kind of
Sketchpad approach used today. Then in time of Euclid, they used the chord method. The
use of Ptolemy’s theorem later allowed them to calculate the sine ratios far more
efficiently and quickly, and to more decimal places.
The earliest sine tables turned up in India, where they originated (De Villiers (2010,
unpublished lecture notes). The Surya Siddhanta is a set of rules in Sanskrit verse. It was
composed around the fifth century A.D., but has been revised many times to the extent
24
that it is no longer easy to say which sections have withstood change and are still as they
were originally.
2.3 A function orientation A function orientation is based on the processing-output notion, similar to algebraic
functions (Pournara, 2001). A strong function orientation, he states, makes explicit that
the process links the output, and vice versa, whereas a weak function orientation does not
make the connection explicit.
A function orientation focuses on three aspects: the angle, the trigonometric operator (e.g.
sine, cosine, & tangent) and the function value. This orientation is dependent on an
understanding that the trigonometric operator maps an angle to a real number in a many-
to-one relationship. The trigonometric operator, according to Pournara (2001), is seen as
exactly that, an operator. In the function definition, function values are not related to the
sides of a triangle. He further goes on to say that a function orientation is more likely to
promote a dynamic view of trigonometry than would a ratio orientation. A function
orientation assumes that the independent variable, the angle in this case, can take on
many values. The resulting function value reflects clearly the effect of changing the
angle.
As stated by Pournara (2001), the mathematical elements of a function orientation
include the notions of periodicity, amplitude, asymptotes and discontinuity. Its other
elements are the representation of trigonometric functions by means of tables, equations,
or graph. It is possible that South African learners may develop a distorted view of
trigonometric functions because the trigonometric curriculum places a great deal of
emphasis on algebraic solutions of trigonometric equations and only studies the graph of
sine, cosine and tangent. As a result, learners may develop a function orientation that is
limited to the graphical representation of these functions. Pournara (2001) also argues
that this is too limited if learners need to develop a broader understanding of functions.
More so, they should be able to draw links between trigonometric functions and linear,
quadratic, cubic and exponential functions
25
According to Bressoud (2010), beginning with the ninth century, the number of people
working in trigonometry increased markedly. Astronomers lived and travelled widely
over a region reaching from India to Spain: the Iranian plateau, Iraq, Syria, Egypt, North
Africa and Spain. Indian scientific books were the first to receive the attention of Moslem
scholarship. Some were translated into doggerel Arabic verses in imitation of the Sanskrit
slokas. Later the available Greek works were translated. The sine function was quickly
adopted in preference to the chord. In fact, the etymology of the word "sine" indicates the
wide variation in background of those who dealt with the function it designates. The
Indians called the function ardhajya, Sanskrit for “half chord”. This was shortened to jya
and translated into three Arabic characters, jhb. This can be read as jayb, Arabic for
“pocket” or “gulf”. It was so read by Europeans, who translated it into Latin sinus,
whence English "sine" and its co-function, cosine.
2.4 More functions and tables The subject matter of the previous section is primarily geometrical. Its development,
according to Kennedy (1991), was accompanied by an accumulation of numeral and
computational materials and techniques. In the ninth century, tables of the (horizontally)
extended shadow were common. Al-Biriuni, a great scientist who lived in central Asia in
the eleventh century, wrote an exhaustive treatise on shadow lore. Among Orientals, he
asserts, it was customary to use a gnomon of a hand span of length. Rarely tabulated, but
explicitly defined and applied in Sanskrit as well as Arabic works, were relations called
the “hypotenuse of the shadow”.
Jugmohan (2004) points out that the motivation for the development of the function
definition of trigonometry was different from the original one. She further elucidates that
originally it was used within land surveying where simple triangulation sufficed, but by
the time it came to the Renaissance it was a different scenario. Then the practical
considerations being addressed with investigations were of the pendulum, and of the
movement of the planets around the sun. All these were periodic, and for that they needed
to come up with a more abstract definition for the trigonometric functions to model
periodicity. The concept of a function therefore became more developed and further
removed from the Greek view, which did not have any sort of formal or written
26
definition.
If we were to follow a historical approach, then maybe we should not start with the
definition of a function. The fact that it developed later suggests that it may be
sophisticated and might be more subtle for learners to understand. Furthermore,
- it would be against the historical order
- its usefulness is on modeling periodic functions which are not in the curriculum
- most applications require the right triangle definition
The practical problem is one aspect. The other aspect is the idea that the definition of a
function and the concept of a function were needed as people were beginning more and
more to apply mathematics within sciences. It was also necessary to have trigonometry
applied in cases that involved periodic functions.
27
CHAPTER THREE
Teaching trigonometry
3.1 Introduction This chapter looks at the teaching of trigonometry and the different methods that are
used. The basic idea on which the whole of trigonometry is based on is that of similarity.
Triangles can have the same shape but different sizes. Two triangles can be equal if their
angles are, and consequently their corresponding sides would be in proportion. Such
triangles are then said to be similar triangles. Trigonometry starts with a right-angled
triangle for which the side lengths are related by Pythagoras' theorem.
In a right-angled triangle, trigonometric functions relate the size of any angle to the ratio
of any two sides. Sine, cosine, and tangent are the basic functions of trigonometry. They
are based on right triangles with one common angle and are hence similar.
3.2 Two methods of introducing trigonometry Different approaches to trigonometry in the curriculum are discussed to provide a
background to the study.
In most countries like Canada (De Kee et al, 1996), the United States (Satty, 1976),
Australia (Willis, 1966), the United Kingdom (Collins, 1973) and in South Africa, school
trigonometry has traditionally been introduced by means of ratios and right-angled
triangles. According to Jugmohan (2004), the introduction of the "new Mathematics" in
the 1960's called for a shift in school trigonometry, from a ratio to a function approach
with particular emphasis on the unit circle. The unit circle swallows up the function
approach (Pournara, 2001) to the extent that one frequently reads about “unit circle
approaches” rather than the function approach to trigonometry.
When it all started, the ratio method was used to introduce trigonometry. In this case
trigonometric functions were demonstrated as the ratio of sides in a right triangle.
28
According to Trende (1962) around the early 1960s another “modern” way was
introduced and approved by some educationalists. This was viewed as more user friendly
for the understanding of learners (Willis, 1966). This method advocated having
trigonometric functions defined in terms of x and y. This was called the unit circle
approach, where a point with coordinates x and y is used. Most textbooks stick to solely
one method although there are some that try to blend both methods.
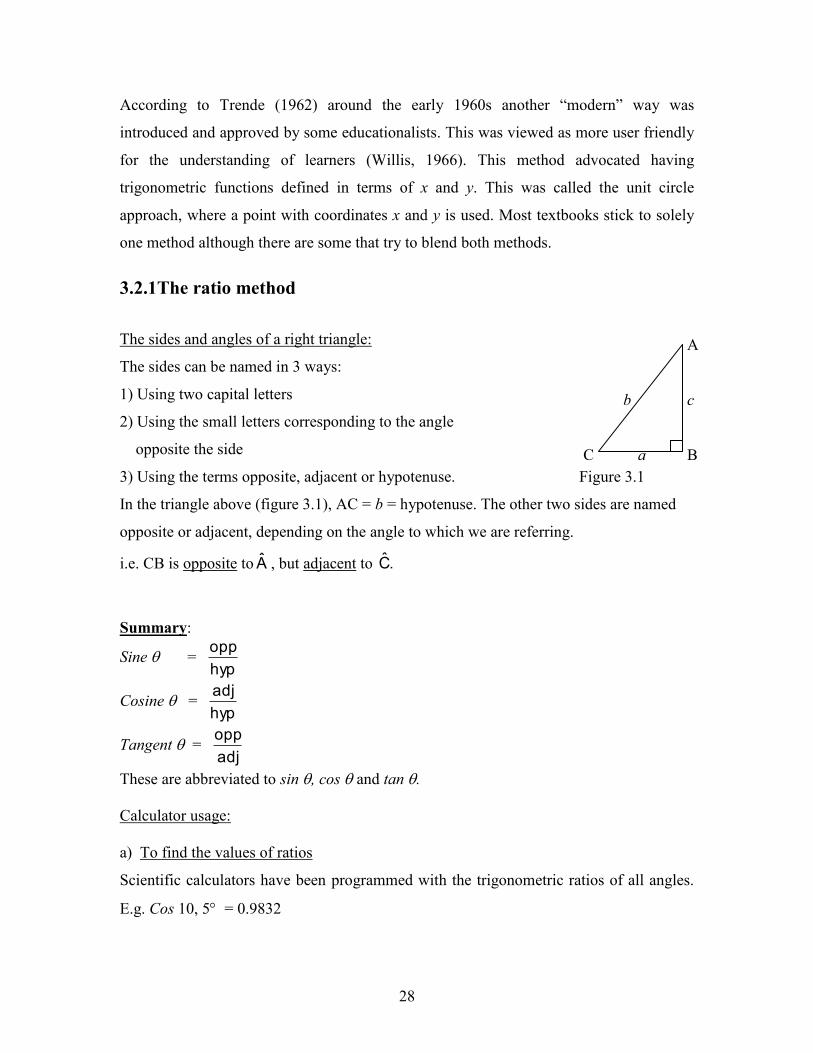
3.2.1The ratio method
The sides and angles of a right triangle:
The sides can be named in 3 ways:
1) Using two capital letters
2) Using the small letters corresponding to the angle
opposite the side
3) Using the terms opposite, adjacent or hypotenuse. Figure 3.1
In the triangle above (figure 3.1), AC = b = hypotenuse. The other two sides are named
opposite or adjacent, depending on the angle to which we are referring.
i.e. CB is opposite to A , but adjacent to .C
Summary:
Sine = hypopp
Cosine = hypadj
Tangent = adjopp
These are abbreviated to sin , cos and tan . Calculator usage:
a) To find the values of ratios
Scientific calculators have been programmed with the trigonometric ratios of all angles.
E.g. Cos 10, 5 = 0.9832
A b c C a B
29
b) To calculate an angle
When we need to find an angle, we use the inverse functions represented by the symbols
sin-1, cos-1 or tan-1, i.e. the second function of the sin, cos and tan buttons.
If we are given the value of the ratio, we simply enter the appropriate 2nd function, the
given value and then =.
Cos = 0.612, = 52, 27
Sine = opposite/hypotenuse,
Cosine = adjacent/hypotenuse,
Tangent = opposite/adjacent.
All this is summarized by SOHCAHTOA
3.2.2 The unit circle method The unit circle method, initially, emphasizes the nature of the trigonometry functions “as
function taking real numbers to real numbers” (Kendal, 1992, p.77).
If we draw an angle in one quadrant, with a radius r, the triangle formed will have x and y
as sides (figure 3.2).
y I r y x x
Figure 3.2
The unit circle method made solving triangle problems easier, “an interesting and useful
outcome” (Dooley, 1968, p.30). Kendal (1992) describes how unit circle approaches have
evolved since they were first introduced. Three different unit circle methods are
30
described. Kendal (1992, p.87) refers to these as functions of real variable, angle based
definition, and scale factor technique.
Most importantly, this method is not mainly centred on angles and triangles when
working with it. This fact is also supported by Kendal (1992, p.89) when he says that
“One of the aims of new Mathematics was to use mathematical language more precisely,
so this was thought to be a desirable feature. Cosine and tangent are similarly defined as
lengths”
Practical Applications Trigonometry enables us to calculate heights and angles that we would not be able to
reach. The angle of elevation starts from the horizontal upwards, and the angle of
depression is the angle measured from the horizontal downwards (figure 3.3).
Elevation Depression Figure 3.3
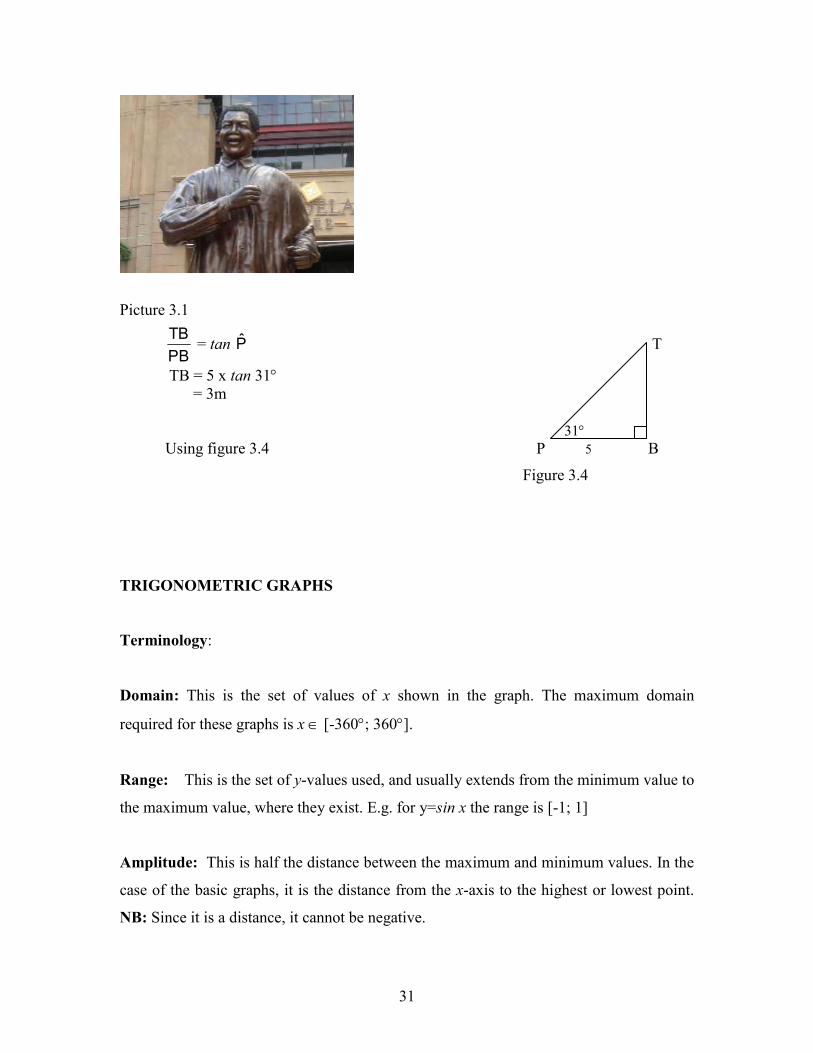
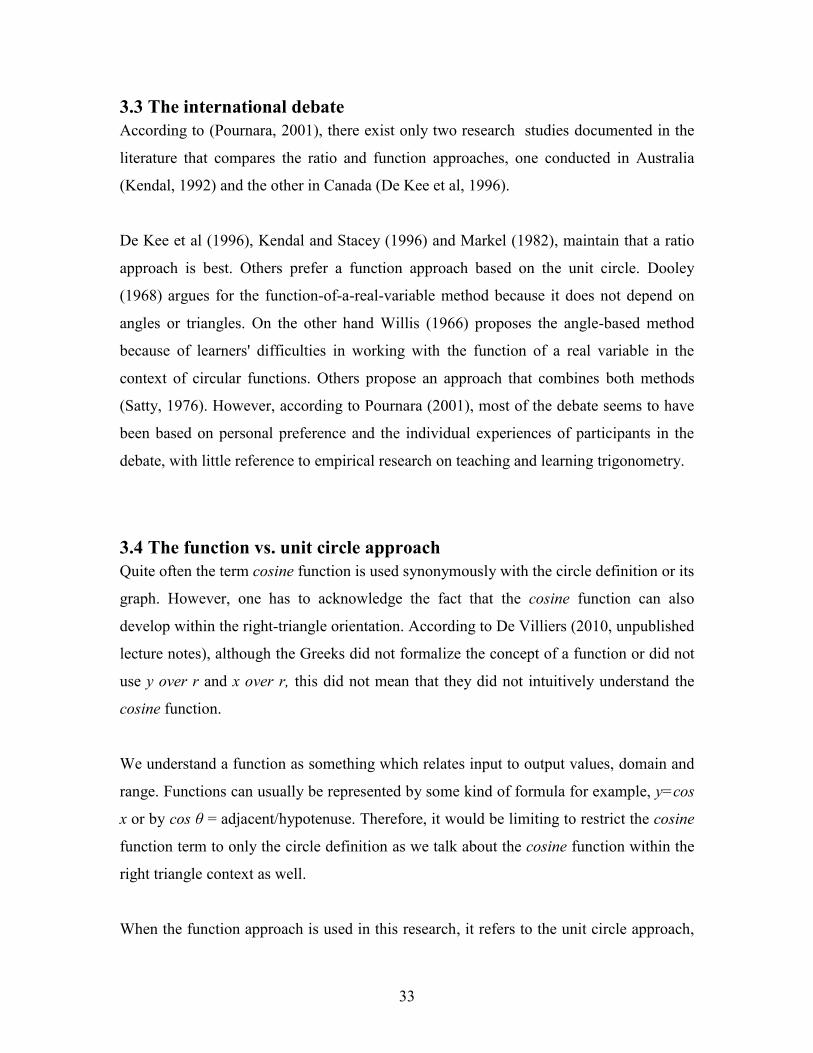
When standing 5m away from the base of the Nelson Mandela Statue (picture 3.1) in
Johannesburg, the angle of elevation to the top of its head is 31. Calculate the height of the
statue, to the nearest metre.
31
Picture 3.1
Figure 3.4
TRIGONOMETRIC GRAPHS
Terminology:
Domain: This is the set of values of x shown in the graph. The maximum domain
required for these graphs is x [-360; 360].
Range: This is the set of y-values used, and usually extends from the minimum value to
the maximum value, where they exist. E.g. for y=sin x the range is [-1; 1]
Amplitude: This is half the distance between the maximum and minimum values. In the
case of the basic graphs, it is the distance from the x-axis to the highest or lowest point.
NB: Since it is a distance, it cannot be negative.
PBTB = tan P T
TB = 5 x tan 31 = 3m 31 Using figure 3.4 P 5 B
32
Period: The interval over which the graph completes one cycle of its basic shape. In
other words, how often the graph repeats itself. It is expressed in degrees, and does not
have a starting point and endpoint, as it can be measured anywhere along the graph.
It is important to distinguish between domain and period, and between range and
amplitude.
Asymptote: A line which a graph approaches but never intersects.
Function of a real variable
Initially the unit circle method referred the trigonometric functions to functions of real
variable. According to Kendal (1992), learners had difficulty understanding these
definitions. This, combined with the need for angle based definitions to solve triangles,
led to the second unit circle method.
Scale factor method and angle-based method in trigonometry
There are two important differences (Pournara, 2001), between the scale factor method
and the angle-based method. Firstly, the scale factor method does not require learners to
transpose equations; hence the algebraic demands are reduced. The second difference lies
in the way the learner works with the two triangles. In the angle-based method, the
learner looks for corresponding sides and sets up equivalent ratios. In the scale factor
method, (Pournara, 2001), the learner views each triangle as a whole and treats the one
triangle as an enlargement of the other, hence the term scale factor. The other significant
mathematical difference between the two definitions is that the angle is measured in
radians in the first method and in degrees in the second method. There are vast
conceptual differences because learners work with reference triangles, derived from the
unit circles in the angle-based method. In the other method they use reference triangles.
Learners must focus on the lengths of the sides of triangles rather than on arc lengths as
in the previous method. This shows that it was necessary to come up with the second unit
method
33
3.3 The international debate According to (Pournara, 2001), there exist only two research studies documented in the
literature that compares the ratio and function approaches, one conducted in Australia
(Kendal, 1992) and the other in Canada (De Kee et al, 1996).
De Kee et al (1996), Kendal and Stacey (1996) and Markel (1982), maintain that a ratio
approach is best. Others prefer a function approach based on the unit circle. Dooley
(1968) argues for the function-of-a-real-variable method because it does not depend on
angles or triangles. On the other hand Willis (1966) proposes the angle-based method
because of learners' difficulties in working with the function of a real variable in the
context of circular functions. Others propose an approach that combines both methods
(Satty, 1976). However, according to Pournara (2001), most of the debate seems to have
been based on personal preference and the individual experiences of participants in the
debate, with little reference to empirical research on teaching and learning trigonometry.
3.4 The function vs. unit circle approach Quite often the term cosine function is used synonymously with the circle definition or its
graph. However, one has to acknowledge the fact that the cosine function can also
develop within the right-triangle orientation. According to De Villiers (2010, unpublished
lecture notes), although the Greeks did not formalize the concept of a function or did not
use y over r and x over r, this did not mean that they did not intuitively understand the
cosine function.
We understand a function as something which relates input to output values, domain and
range. Functions can usually be represented by some kind of formula for example, y=cos
x or by cos θ = adjacent/hypotenuse. Therefore, it would be limiting to restrict the cosine
function term to only the circle definition as we talk about the cosine function within the
right triangle context as well.
When the function approach is used in this research, it refers to the unit circle approach,
34
and when the terminology is used it simply refers to the cosine function as a whole. The
function value as a ratio, also changes as θ changes, so it has the idea of variability;
functional dependence. The graphs that the learners drew and the tables they completed
are just some of the methods of representing a function. Generally, the three methods of
representing a function are: graphically, tables and formula. This view of function
developed late. From mathematics history we note that it took 2000 years for the function
approach to trigonometry to develop, suggesting, to conclude, that maybe it is a lot more
complicated.
3.5 Difficulties in the learning of trigonometry Difficulties in learning trigonometry are closely linked to learners’ inability to understand
algebraic manipulations (Dwyer, 2010). As a mathematics educator, my experience of
teaching trigonometry has shown that the sources of learners’ difficulties in trigonometry
are more than just meet the eye. They range from the curriculum to the teaching and
learning, assessment, and from the teacher to the learners.
The present curriculum documents (Pournara, 2001) do not reflect a properly conceived
trigonometry that does pay sufficient attention to a notion of trigonometric functions. It
does not develop appropriate links between trigonometric ratio and trigonometric
function. Current assessment practices, particularly at grade 12 level reward procedural
and rule based thinking (Pournara, 2001). The teaching in trigonometry may not review
learners’ poor conceptual understanding in this area. These factors, combined with
learners' inability to perform to perform algebraic manipulation such as factorizing and
solving equations, and their under-developed spatial skills (Pournara, 2001), lead to
generally poor performance and difficulty in trigonometry. It would be rather unjust to
lay blame squarely on learners as at times the teachers themselves do not quite
understand the concept and tend to read it off textbooks, some of which also contain
errors!
According to Hart (1981), ratios in general prove to be very hard for learners to
understand. Changes have been made in some textbooks to try and lessen the burden of
35
learners by writing the sine of an angle only. In this case the radius is used as the
hypotenuse where learners are expected to be able to identify the triangle even if it is
rotated.
According to Blackett and Tall (1991, p. 13) “As an acute angle in the triangle is
increased and the hypotenuse remains fixed, so the opposite side increases while adjacent
side decreases” and “As the angles remains constant, the enlargement of the hypotenuse
by a given factor changes the other two sides by the same factor”. These are some of the
concepts learners are faced with when going through the topic of trigonometry. They also
state (1991, p. 15) “The traditional approach uses pictures in two different ways, each of
which had its drawbacks” This downgrades the role of pictures in the minds of the
learners. They will tend to think that rough sketches lead to wrong answers and dedicate
all their energy to accurate diagrams and not to changing relationships of the triangle.
The computer approach (Blackett and Tall, 1991) has the capability of changing this kind
of thinking as it gives the learner a chance to move the diagram anyhow. It allows the
learner to relate the shape to its randomly changing form and to the related numeral
concepts. This way the learner might understand better. The learner can focus on
important things since the computer would not take time to draw the diagram in any state.
Bruna (1996) says that the strengths of the learners can be played around with as another
way of facilitating learning. Nowadays most learners play around with cell phones and
even computers, this means that the use of the computer in learning mathematics could
alleviate problems learners have in some mathematical concepts. Bruna further goes on to
denote that learning is mostly through participation not being a spectator. It clearly shows
that learners need to participate as much as they can in order to understand most
mathematical concepts. This can be by working-out questions on their own which might
lead to discovering best methods to solve problems.
36
CHAPTER FOUR
Theoretical framework: Theories of learning related to mathematics This chapter seeks: a) to examine and outline two opposing learning theories, which will
illustrate different approaches to handling learners' understanding as well as their
misconceptions in mathematics and b) to discuss the theoretical framework for this study.
4.1 Learning theories There have been different perspectives that have been put in place and adopted as regards
teaching and learning of mathematics for quite some time. Some learning theories that
have influenced mathematics teaching and learning in South African classrooms are
Behaviourism and Constructivism. More emphasis, however, is on constructivism which
is part of the theoretical framework of this research.
4.1.1 The Behaviourist theory The behaviourist theory of learning is based on the empiricist philosophy of science. It
claims that knowledge entirely comes from experience. De Villiers (2010, unpublished
lecture notes) argues that even though experience plays a role, it is affected by what is in
the mind. The traditional empiricist motto was “there is nothing in the mind that was not
first in the senses”, according to Olivier (1989, p.37). The empiricists believe that it is
possible for a learner to acquire direct and complete knowledge of anything that is real.
They say that through the senses, the image of that reality corresponds exactly with
reality.
Behaviourism presumes that learners learn what is delivered to them by teachers, or part
of it. According to Olivier (1989, p.38), they claim that “knowledge can be transferred
intact from one person to another”. Jugmohan (2004) also writes that the behaviourists
see learning as the forming of habit, based on reinforcement. Something has to be
repeated over and over again in order for the learners remember what they would have
learnt for a long time. This suggests that rote-learning, drill and practice are important
37
factors in the learning mathematical knowledge according to them.
Behaviourists see the minds of learners as empty, waiting to be filled by knowledge,
transmitted by their teachers (De Villiers 2010, unpublished lecture notes). The learners
are seen as “a sponge absorbing the mathematical structures invented by others”
(Clements & Battista, 1990, p.33). Behaviourists, therefore, see knowledge as something
that learners are able to acquire from experience. They take it that what learners have
already acquired is unimportant to learning.
This type of acquiring knowledge does not allow for application of knowledge according
to Penchalia (1997). Skills acquired in this manner are not transferable and learners
become mathematically illiterate. Furthermore, Alder (1992, p.264) argues that school
mathematics is an activity having its own goals and means and cannot be “simply
transplanted into another activity”. The organisation of learning, according to
behaviourists’ principles must proceed from the simple to the complex, and exercise
through drill and practice (De Villiers 2010, unpublished lecture notes). He goes on to
say that from a behaviourist point of view, errors and misconceptions are not an issue
since previously acquired knowledge does not come into play when it comes to learning
new concepts.
4.1.2 Constructivism According to De Villiers (2010, unpublished lecture notes), constructivism is a type of
learning theory which assumes that learners construct meaning and that their
understanding is dependent on their pre-knowledge. Concepts are actively constructed by
learners and the teacher acts as a facilitator. However, this does not eradicate the
mushrooming of misconceptions. De Villiers (2010, unpublished lecture notes) asserts
that it is important that learners must be given experiences which conflict with their
learning as it is far more important than the rules. This shows that cognitive conflict is an
important aspect of assimilation in the education process.
From a constructivist’s view point, errors and misunderstandings by learners are of great
value to education, because they address a section of a learner's conceptual structure.
38
Olivier (1989, p.18) points out that, “errors and misconceptions are considered an
integral part of the learning process”. Misconceptions combine with new knowledge,
and play an important role in new learning mostly, according to him, in a negative way,
because they are the root cause of mistakes. The theory has its roots in a view that
“knowledge is made and not given; it is constructed by an active cognizing subject rather
than transmitted by a teacher or a text” (Adler 1992, p.29). Nickson and Noddings
(1997), state that since learners are internally motivated, they interpret and adjust
information to their personal mathematical schemas thereby constructing their own
mental representations of situations and concepts. The learner's ability to learn depends
on the ideas the learner brings to the experience. According to Muthukrishna and Rocher
(1999), the learners' pre-existing knowledge will influence the type of knowledge gained.
Socio-constructivists believe that learning is something that is based on communal and
personal activity. Olivier (1989) points out that there is an awareness of interaction
between a learner’s current schema and learning experience. The learner’s point of view
is taken into consideration. This also implies that mathematics teaching consists primarily
of mathematical interaction between the teacher and the learners. Learners at times also
communicate their ideas and interpretations with each other. An active self-reliant
attitude to learning is inculcated within the learner through discovery, negotiation and
reflection. Most learners develop their own methods rather than rely on methods taught
by the teacher.
According to De Villiers (2010, unpublished lecture notes), the character of a learner's
existing schemas determines what the learner gets from previous activities or acquired
knowledge and how it is grasped. Constructivists uphold the interaction between a
learner's current schema and past experiences with high esteem. Discussion,
communication, reflection, and negotiation are components of a constructivist approach
to teaching (De Villiers 2010, unpublished lecture notes). The constructivist also looks at
knowledge acquisition from the learner’s point of view in order for the teacher to come
up with suitable methods (Olivier 1989). The teacher has to consider the mental process
by which new knowledge is acquired.
39
This then shows why it was necessary to use Sketchpad in this study on what learners had
done in Grade 10. In a way it served to authenticate what they had previously learnt.
Even if they had any form of misconceptions, the intervention by dynamic software
would help with some form of cognitive conflict. Some of the things they thought they
had understood previously will be in contradiction with what they will discover from the
computer. This forms an interaction between the learner’s schema and current learning
experience with the computer which would be an important part in the learner’s
assimilation of the concept.
The researcher considered using constructivism as the theoretical framework for this
study because the study was based on the way in which individual learners constructed
knowledge. For learning to take place, the learners should reconstruct and transform
external, social activity into internal individual activity through a process of
internalisation (Wersch & Stone, 1986, p. 169). The formation of such consciousness,
according to Wersch and Stone, depends on social interaction and on "mastering
semiotically mediated processes and categories”.
4.1.2.1 Misconceptions in mathematics When learning takes place, the new ideas that the learners’ are exposed to, need to be
linked to the learners’ previous conceptions. This is what determines what the learner
understands. In this research, the analysis of the learners’ understanding, correct
intuitions as well as misconceptions in their mathematics were exposed.
The following points need to be further considered (Olivier, 1989, p. 18):
- correct new learning depends on previous correct learning
- incorrect new learning is often the result of previous incorrect learning
- incorrect learning is mostly the result of previous correct learning
Every misconception has its origin in some form of correct learning. Every
misconception is correct learning at least for some earlier activity previously done or
some previously worked on domain of the curriculum. Some misconceptions emanate
from what teachers say and some from “sloppy notation” during the teaching and
40
learning process. In some cases, teachers tend to use words loosely without considering
the negative impact it will have on the learners.
In one trigonometry introductory lessons observed in the Pinetown district, just outside of
Durban in May 2010, a qualified mathematics teacher wrote the following on the
chalkboard as he presented a Grade 12 revision lesson (picture 4.1):
Picture 4.1
As a result learners will frequently write things like cos = ½. They then find it hard to
relate their findings to an angle as it cannot be located anywhere. Sloppy notation like
this obscures the functional combination of the independent variable sin θ with the
dependent variable θ. At times instead of writing cos²θ, learners can write cos θ². Another
frequent error is where learners confuse cos 60º for cos multiplied by 60º.
Misconceptions mostly arise from an over-generalization of previously learnt
information (correct in that set of values), to an extended new set of values, where the
former is not valid. Information, states Olivier (1989), assimilated earlier and well
cemented is not easy to change. A learner will not easily accept and assimilate new
knowledge, nor is it easy to add new things to existing knowledge. Learners find it hard
to alter their already acquired knowledge. This is how errors are normally created.
Learners would try to fit new knowledge to what they already know and it becomes
distorted (Olivier, 1989). There is a blame-shifting for poor teaching methods right from
41
the university down to high school, to high school, to junior primary, down to the family.
It is not clear exactly where the problem really lies. Either learning basics must be
changed, states Olivier (1989), so as not to alter ideas later, or special effort must be
made later, to prevent or remediate learners’ misconceptions. Neither, according to
Olivier (1989), is easy.
Learners are not able to unpack knowledge on their own; they just categorize it into
related big units all with similar concepts. Olivier (1989) defined such a unit as a schema.
These, he states, are of vital importance intellectually as they can be accessed and applied
whenever necessary. At the end of the day the combination of the learner’s schemas and
new knowledge is important as it allows the learner to assimilate and accommodate
knowledge.
Constructivists have a very different way of looking at learning as compared to that of
behaviourists. They do not see it a matter of piling up new information on previously
acquired one. According to Olivier (1989), learning leads to changes in our schema.
During early learning, e.g. “multiplication makes bigger” is a result of expressing it as
another form of addition for easier understanding. Mostly the teacher is aware that the
learners are familiar with addition and in order to clearly explain this new concept of
multiplication begins with addition as it is the only easy way of introducing it (Olivier,
1989). Unfortunately this is not universal in all number dominions like fractions and
decimals and it could be the root of numerous other errors. Learners then begin to try and
relate all new concepts to one previously done.
4.1.2.2 The learning of the cosine function The conceptualization of the cosine function using Sketchpad provided a unique way of
dealing with this section and allowed for experimentation, questioning, reflecting,
discovering, inventing and discussing. According to De Villiers (2010, unpublished
lecture notes), any use of a system which denies the opportunity for reflection, discussion
and posing own questions must be seriously questioned. He further indicates that from a
practical point of view, teachers should be on guard against designing lessons that aim to
42
develop skills strictly through repetitive practice. This practice, according to Artigue
(1991), may have no meaning if learners are encouraged to use a computer, organized in
pairs, groups, or whole classes. They should be designed with both the mathematics in
mind and the learners’ developing conceptions of mathematics.
4.1.3 Van Hiele theory
4.1.3.1 Introduction This theory was developed in the doctoral dissertations of two students, Dina and Pierre
Van Hiele from Netherlands in 1957 (De Villiers, 1996). Pierre was mainly concerned
about why learners found it difficult to explain and describe shapes whilst Dina was
mainly worried about arranging geometric knowledge. The most outstanding
characteristics of this theory are the different categories they came up with. Four of them
are summarized as follows by (De Villiers 1996):
Fixed order - The way in which learners move from one level to another. A
learner can only move to the next level after having completed the previous one.
Adjacency – Ideas are inter-related according to levels. One concept that was
very important in some level becomes less important in the next one.
Distinction – Every level is different from another in terms of terminology,
relationships and symbols.
Separation – The reasoning is quite distinct at different levels.
In an outstanding way, the Van Hieles showed that the curriculum was operating at a far
higher level than that of learners (De Villiers, 1996). This led to the learners’ failure to
understand the geometric concepts, and leaving the teachers wondering why! The general
characteristics of each level, according to De Villiers (1996) are elaborated below:
Level 1: Recognition
Learners are able to see shapes and give the correct name but might not be in a position to
indicate the characteristics correctly.
43
Level 2: Analysis
Learners can be in a position to name and describe the properties of the shape but might
fail to establish the relationship between these and the shape in general.
Level 3: Ordering
Learners can arrange characteristics of figures in an orderly manner and generalize them
(e.g. class inclusions).
Level 4: Deduction
Learners can now understand proofs about shapes, basic theorems, and axioms about
shapes.
Level 5: Rigour
The learner is comfortable with an axiomatic system such as those for the non-Euclidean
geometries and different systems can be compared. They can analyse the consequences of
and manipulate different axioms and definitions. The learner understands the formal
aspects of deductions.
4.1.4 This study In this research two assumptions come into play. Firstly, learners actively construct
meaning and can change any form of misconceptions on their own as they engage with
mathematics. Secondly, knowledge construction must occur individually first and then
socially.
The Van Hiele and constructivist theories provide an appropriate tool for the
investigation of learners' thinking in this study. The strategy used was based on a
constructivist point of view which describes human beings as builders of theory and
structures (Balacheff, 1996; Schoenfeld, 1987). The Van Hiele theory served as a yard
stick to see the extent to which the learners could visualize, interpret and draw out
meaning from trigonometric shapes and graphs. An attempt is made below to conjecture
what levels 1, 2, 3, and 4 for trigonometry would be.
44
4.1.4.1 Van Hiele in relation to this study Level 1: Visualisation
The learner can identify a right-angled triangle in whatever form or stance and is able to
distinguish the difference between different forms of right-angled triangles in and out of
the unit circle. The ability to identify the opposite side, adjacent sides and the hypotenuse
of a triangle also involves visualisation. This includes being able to identify the cosine
graph.
Level 2: Analysis
In different right-angled triangles, if angles are the same, then the ratios between any two
sides would remain the same, no matter how big or small the triangle might be (which is
the concept of similarity). Learners are able to solve practical and theoretical problems
related to right angles. They should also be able to identify shifts of graphs.
Level 3: Definition
The discoveries given above are now formalized definitions in terms of the sides of right
triangles as ratios. Understanding develops of the changing nature of the trigonometric
functions in all four quadrants, as well as of their non-linear nature. The understanding of
the inverse also develops. In terms of graphs learners should be able to know the effects
of a constant in a given function.
Level 4: Circle definition
Conceptualising the definition of trigonometry in its abstract form develops in terms of
the unit circle and in terms of the trigonometric function. The unit circle to be defined as
function, which is independent of the right angled triangle, and its trigonometric
functions, are extended into the other three quadrants. In graphical concepts the learner
begins to understand the period and the shifts without plotting the graph.
The Van Hiele theory will therefore clearly show which level the learners are at with the
use of Sketchpad.
45
CHAPTER FIVE
Review of studies on trigonometry and teaching
5.1 Research studies De Kee et al (1996) used in-depth qualitative interviews with five Canadian learners who
were at the equivalent of the South African Grade 11 level. De Kee explored the learners’
understandings of sine and cosine as they relate to both trigonometric ratios and
functions. Overall, her findings showed that the learners had difficulties with both
approaches but were more comfortable with the ratio approach. The learners found the
work on the functions of real variables confusing. De Kee et al, as quoted in Pournara
(2001) identified four concept images of sine and cosine revealed by learners:
- A procedure whereby the length of two sides of a right angled triangle is
divided by each other, thus producing the sine or cosine of the triangle.
- The sine or cosine functions of a calculator.
- The typical undulating curves of the sine and cosine functions.
- The Cartesian coordinates of a point. Learners referred to these as the sine or
cosine of the point.
In a study by Kendal (1992), where the scale factor method and ratio method of
introducing trigonometry was compared, it was found that learners who were taught by
the ratio method were more successful in solving problems involving the solution of a
triangle. However, he argues that the focus of trigonometry in Australia is the solution of
right triangles and therefore the method employed to introduce trigonometry should
support this goal. He acknowledges that the study did not investigate conceptual
development in learners nor the extent to which either method laid foundations for future
work in trigonometry
Pournara (2001) observes that in recent years the focus in school mathematics has shifted
from formalist approaches with their emphasis on mathematical rigour, to approaches that
prioritize mathematical meaning. He argues that the general curriculum changes demand
46
a shift in focus in school trigonometry, from an emphasis on ratio and triangles to a focus
on trigonometric functions and modeling. However their call for a function is not related
to the unit circle (Pournara, 2001). Their focus is on the periodic sin and cos curves that
provide tools for analysing periodic phenomena, and hence applications in modeling.
They argue that this type of the function approach will broaden and deepen learners’
understanding of the concept of a function in general and hence strengthen connections
with algebraic functions.
5.2 Symbols as process and objects Pournara (2001) focuses on ways of working with trigonometric ratio and trigonometric
function, as well as the ways in which learners see these as processes and objects. The
notion of “procept” (Gray & Tall, 1994, p.53) provides a starting point for seeing
symbols in different ways. A procept is a “cognitive construct, in which the symbol can
act as a pivot, switching from a focus on process to compute and manipulate”. There are
many examples of procepts in mathematics; for example, Pournara (2001), mentions that
3\4 represents division of numbers and the notion of fractions; 3x+2 represents an
expression as the object and the process of multiplying 3 by x and then adding 2.
Gray and Tall (1994) consider all the trigonometric ratios to be “procepts”. The symbol
sin A= opposite/hypotenuse involves both the process of dividing the length of two sides,
and the product, which is the ratio of the two lengths. The symbol opposite/hypotenuse
(without sin A) is a process or an object (Pournara, 2001). As a process, it indicates a
method for calculating the ratio and as an object; it represents a ratio that can be used in
other calculations. The symbol of cos A can be taken to be either a ratio or a function. It
can be seen as a ratio because it is equivalent to adjacent/hypotenuse, but it can also be
seen as a function, it bears no relation to the fraction adjacent/hypotenuse. Within each of
these possibilities – ratio and function – the symbol can be seen as a process or an object.
It then follows, according to Pournara (2001), that cos A can be seen in four different
ways; as in Table 5.1.
47
PROCESS OBJECT
Cos A seen
as
a ratio
A process for calculating
a ratio
A ratio describing the
relationship between the
hypotenuse and the side
adjacent to A.
Cos A seen
as a function
A process whereby cos
operates on A to produce
an answer.
The result of cos operating
on A. e.g. the coordinate of a
point: (rcosA; rsinA)
Table 5.1
As quoted by Jugmohan (2004), Sfard (2000) argues that the introduction of a symbol
constitutes the “conception” of a mathematical object and not its birth. The symbol of cos
A can be viewed in multiple ways; firstly as a ratio or as function then as process or as
object. These views influence and are influenced by the operations that learners perform
with and on the symbol cos A.
5.3 The impact of methods and procedures on learners’ conceptions of ratio and function Trigonometry is a sub-domain of school mathematics that also relies on procedures and
methods (Pournara 2001). In most cases learners score high marks in the trigonometry
section of the Grade 12 examination if they apply correctly the procedures they have been
taught (De Villiers 2010, unpublished lecture notes). Thus the use of procedures when
teaching trigonometry should not be downplayed. However, Pournara (2001) argues that
some procedures are better than others in supporting a conceptual understanding of
trigonometric principles.
Pournara (2001) found that the conceptions of trigonometry ratio are closely tied to the
methods they use, particularly their methods for solving triangles. He stated that in some
cases, learners appeared to treat the ratio simply like part of working in the procedure for
solving triangles. The first step of the procedure is to set up a ratio of two sides: “what I
48
want over what I know”- and this he stated reflected the way in which they worked with
ratio.
Procedures and methods for solving trigonometric tasks provide an efficient means of
solving problems (Pournara, 2001), but learners do not necessarily understand the
meaning behind the procedures. However, at times, they are able to execute the
procedures successfully. Methods and procedures, he states are therefore both necessary
and problematic. He further states that learners need to “re-appropriate these and on a
personal level and they do so through participation in the mathematical culture of the
classroom”. Without the appropriate participation, the procedures will have no meaning
to the learners.
5.4 The metaphor of a converter According to Pournara (2001), the metaphor of the trigonometric operator as a converter
is one possible means for helping learners to shift orientations. Learners need to see cos
operating on an angle and converting it to a ratio. The idea of a converter, according to
Pournara (2001), may also help to deal with the cognitive discontinuity where the
learners expect the input and output numbers to be the same type of number. The notion
of a converter, according to Pournara (2001), has many physical applications and is
embodied in the slider-crank mechanism which converts between linear and rotary
motion.
Jugmohan (2004) suggests that some toys for learners provide an excellent illustration of
how circular movement is translated into vertical and horizontal movement. The
“popper” which consists of a dome-shaped chamber on wheels, is an illustrative example.
She goes on to say that the rotation of this popper can be related to the trigonometric
circle. When the wheel axle hits the spring-loaded mechanism, it has rotated through 90º
and is at its maximum displacement. This illustrates the conversion of circular movement
to linear motion – a change in angle (of rotation of the axe) produces a change in vertical
distance (of spring loaded mechanism and balls). In a similar way, Pournara (2001)
states, tan converts an angle of 41º to a ratio of 0.87. The tan button (or more correctly,
49
its second function) can also be used to convert from ratio of 0.87 to angle of 41º. If the
triangle contains an angle of 41º, then the ratio of the vertical to the horizontal side is
0.87. This notion of a converter (Pournara, 2001) may help learners when solving
triangles to see the how the angle and the ratio of sides are related.
5.5 The scale factor method for solving triangles Pournara (2001) suggests the scale factor method for solving triangles. He states that
although the scale method is very efficient, the role of the ratio in the algebraic
manipulation requires a deeper understanding of the fundamental principles of
trigonometry, the link between angle and ratio of sides. He also suggests that there are
two advantages of using the ratio as a scale factor. It promotes a structural conception of
ratio, and it requires that the learners shift between functions and ratio orientations.
Pournara (2001) states that this approach makes explicit the equivalence of cos 38º and
AB/AC. In doing so, it helps learners to see the ratio as an object; a scale factor that gives
the proportion of the sides. The method still requires learners to work with an operational
notion of ratio in doing the multiplication. The only algebraic manipulation required in
this method, he states, is to isolate the unknown in the ratio. This manipulation required
may not be essential because learners can reason “what over 12 gives me 0.788” and then
carry out the manipulation without actually doing the algebraic manipulation. Another
advantage of this approach, he states, is that it avoids the need for the reciprocal ratios in
the introductory stages of trigonometry.
5.6 The teaching of mathematics using a computer
5.6.1 Micro worlds In this study the micro world was provided by Sketchpad, which encompassed the
necessary data to provide a way and means not easily accessible to learners. A micro
world represents mathematical concepts in a peculiar way that can be close or far away
from the school mathematics. Hoyles and Noss (1993, p.84) had observed that “learners
frequently construct and articulate mathematical relationships which are general within
50
the micro world yet are interpretable and meaningful only by reference to the specific
(computational) setting”. One might conclude that simulations, micro worlds and
modeling are powerful implementations. They have enormous potential for the
enrichment of learning processes. Each one in its own way is capable of offering a
computer environment which supports exploration of the user’s ideas. Exploration may
happen at different levels. The nature of the software and the knowledge domain of the
user are likely to determine the kinds of exploration that can take place.
The notion of a computer-based micro-world for exploring mathematics in the classroom
situation appears to be the most attractive. The attraction lies in the ability to focus upon
a limited number of related concepts. Exploration of these concepts can take place
without the user having to waste time and effort in overcoming difficulties presented by
the computer language used. At the same time some access to the computer language is
allowed in order to change relationships or rules. It would be argued that a small
programme on a calculator, which generates a sequence from a given rule, is a micro
world in its simplest form.
Micro worlds are basically computational environments which embody mathematical
concepts and ideas. Yerushalmy et al (1990 suggest that learning mathematics should be
mainly centred on maintaining a climate of learner decision-making and exploration. A
micro world consists of software together with careful sequenced sets of activities on and
off the computer (Yerushalmy et al, 1990). It is organized in pairs and whole classes
designed with both the mathematics and learners’ developing concepts in mind. This
came into play in this study as obviously the group, even though familiar with the
computer, tends to live in a world almost completely divorced from its use.
However, learning processes can be enriched enormously through micro worlds,
simulations and modeling (Mudaly, 2004). Each one can offer a computer environment
which supports exploration of new ideas at different levels although mainly determined
by the nature of software and the user’s knowledge domain. Basically, these explorations
of concepts take place without the user having to waste time and effort in overcoming
51
difficulties presented by the computer language used, and alternatively small programmes
like those on calculators also come in handy.
5.6.2 Visual reasoning “The aim of the mathematics department is to provide interesting lessons for all learners,
in order to develop their mathematical skills and knowledge. A central way of achieving
understanding of mathematics is by talking, reading about it. In order to do this we must
provide learners with appropriate mathematics vocabulary and appropriate stimulus for
the use of language to take place” (Cox, Gammon et al, 1993, p.9). They believe that the
ease, with which the computer produces a visual image of function, and the need to retain
a picture of this image, pushes the learners into talking and describing, and hence using
“appropriate mathematical language”. Recent research in mathematics and especially in
trigonometry has shown that the concept of a function is most difficult to understand
(Pournara, 2001).
The use of Sketchpad or computers makes it possible to represent visual trigonometry or
mathematics more than any other visual display. Graphs are simple to plot and all their
attributes are easy to see. Vertical and horizontal shifts are easy to determine. Moreover,
the situation can be inverted. It is possible to also investigate the question as to which
actions will lead to a given change in the relationships. The result of such action often
can be dynamically implemented. Actions can be repeated at liberty, with or without
changing parameters of the action. Conclusions can be drawn on the bases of the
feedback given by the computer programme. The power of the computer for learning
visual reasoning in mathematics derives from these possibilities.
Like most, Cox, Gammon et al (1993, p.11) were impressed by the potential of
technology to make visual representations of mathematics widely available. At the same
time they were aware of learners difficulties with graphs described in the mathematical
education literature. Rather than approach learner difficulties as “misconceptions to be
uprooted”, they approached them as ideas they could change in the normal course of
52
learning and instruction, and as indications of “conventions in which their training blinds
them.”
The graph and the data represented on the computer seemed to enable some learners to
develop a better understanding of their graphs and so eventually to be able to give a fuller
interpretation of their meaning. Recent research on visualisation is concerned with the
effects of a visual versus a symbolic approach and how learners relate both (Dreyfus &
Eisenberg, 1991). There are studies that show the positive effects of visualising in
mathematical concept formation (Bishop, 1989) and give convincing arguments for
emphasizing visual components in the introduction of concepts in school. “There are
dangers in doing this carelessly because visual presentations have their own
ambiguities” (Goldenberg, 1988, p.122).
Tall (1989) reports on using the computer to encourage visually based concept formation
on calculus. He stresses that the goal is not only to provide solid visual intuitive support,
but to sow the seeds of understanding of the formal subtleties that later occur. This
implies that learners learn to reason visually with the details of screen representations of
concepts such as function, secant, tangent, gradient etc. Kaput and Thompson (1994)
have used concrete visual computer representations to build on natural actions in the
learners’ world with the aim of supporting the learning and application of multiplicative
reasoning, ratio and proportion. In particular, they aim to tie the visually concrete and
enactive operations on objects on the screen with more formal and abstract
representations of these operations. Thus learners’ visual operations are directly used in
the learning process.
Yerushalmy and Chazzan (1990) see it fit that learners should empirically generate the
geometric information and visually infer conjectures. Shama and Dreyfus (1991) have
used computer screen presentations of linear programming to allow learners to develop
their own solution strategies. Learners need to analyse the problems in terms of the
visually presented information. They should also aim for detailed analysis of the
53
relationship contained in the visual screen presentations and form reasoning based on
such analysis.
In computerized learning environments it is possible to directly address and overcome
some of the problems associated with visualisation (Tall, 1989). Some could be related to
lack of flexibility in the learners thinking. It is also possible to transfer a large measure of
control over the mathematical actions to the learner. The potential of computers for visual
mathematics does not by itself solve the more important problems which were mentioned
in the introduction. In every case, visual representations need to be carefully constructed
and their cognitive properties for learners need to be investigated in detail (Tall, 1989).
The adaptation and correction of features of these visual representations on the basis of
learner reaction to them is an integral part of the development. Tall’s choice of local
straightness rather than a limiting process for the derivative is a case in point.
Similarly, Kaput and Thompson (1994) describe how they have found dissonances
between learners’ visual experience and the semantic structure of the situation being
modeled and have consequently designed a way to avoid such difficulties. These
difficulties associated with visual representations can be overcome, but only if they are
systematically searched for, analysed and dealt with. In this endeavour, the design of
learner activities within the learning environment plays at least as important a part as the
design of the computerized environment itself (Dreyfus 1990).
5.6.3 Computer-aided instruction According to Papert (1980) as quoted by Ainley (1994) instruction and reference to
programming are somewhat out of fashion in educational discussion. The tension
expressed between computers being seen primarily as rigid and mechanistic tools for
teaching and as tools for learning is the current norm. Although the developments in the
technology have been enormous, the same ambiguity still causes anxiety for many
practitioners.
According to Ainley (1994), the above scenario is very complex in at least two-ways:
54
1. A lack of clarity about relative roles of teacher and computer (and, of course,
learner) is only one of a long list of factors which affect the extent and quality of
the use of computers in mathematics classrooms.
2. Issues to do with access to appropriate hardware and software, curriculum
constraints and assessment requirements, attitudes to technology and management
issues at both classroom and school level are all extremely significant.
Even when high levels of access are available, and curriculum pressure relaxed, teachers’
confidence in integrating technology within their existing classroom practice remains a
key issue.
A common teaching strategy in mathematics, according to Dugdale (1992), is the use of
graphical representations, mostly on the blackboard, but also on worksheets, textbooks
homework assignments or written examinations. Since microcomputers are more and
more accessible, there exists a new powerful tool to represent graphs and functions and
thus to study mathematics. The study by Dugdale (1992) is based on the “development of
graphical environments with computers”, which enable learners to discover and acquire
the concept of functions. The approach and rationale behind Dugdale’s study was
attempted in this research.
This study involved the cosine function. According to Dugdale (1992, p.28), “the
function concept is a central one in mathematics because of its potential to tie together
seemingly unrelated subjects like geometry, algebra and trigonometry”. It is also a very
complex concept which has various sub-concepts associated (Dreyfus, 1990, p.33). In
spite of efforts to teach functions by means of multiple representations, high school
learners show limited concept images of functions (Vinner & Dreyfus, 1989).
Wenzelburger, (1990, p.118) states that, “the computer plays an important role in
mathematics education, since it is considered a valuable tool to aid in the teaching
learning process in mathematics.” Tedious and complex computations can be done on
the computer. The learners remain free to concentrate on essential aspects of concepts.
Carefully designed graphing software, used thoughtfully, presents opportunities to teach
55
functions successfully. Such software, according to Goldenberg, (1988, p.17), makes use
of this possibility: “Computer environments seem to be an ideal to build a curriculum
from a constructivist point of view, which help learners with transitions between
algebraic and geometry representations.” Pea (1994, p.22) puts computers in the context
of “interactive cognitive technologies”. Computers can provide functions that promote
mathematical thinking. They fulfill the process functions of being a tool to integrate
different mathematical representations.
Garancon et al (1983) undertook a study to find out the use of the computer in a specific
activity. Their aim was to introduce the idea of line graphs in two ways, one making use
of the computer, and one relying on more traditional resources. The conjecture was that
learners who had used the computer will be better able to produce their own graphs by
hand, and to interpolate for them. Garancon et al (1983) gave the whole class a pre-test
in which data was presented in a tabular form and a graph of a learner’s growth drawn by
free hand; learners were asked to recognise specific points, and to interpolate. The results
from the pre-test were used to establish a base line of skills, and to divide the class into
two groups of matched pairs.
On reflection, Garancon et al (1983, p.385) conjectured that the learners were “able to
interpolate, handle scale, plot points and construct sensibly scaled axes because they did
not attempt to teach them these skills”. They see these as the process by which skills
reach a level at which we are able to function with them automatically, when they are
encountered in contexts and at levels subordinated to other tasks.
More traditional approaches to teaching line graphs would necessarily begin by teaching
construction skills; constructing suitably scaled axes and plotting points. If attention is
focused on these, it could be difficult for learners to keep in mind why the graph is being
drawn in the first place. Indeed the skills of constructing graphs are often taught in
isolation from meaningful context, and so appear to learners to be an end in them.
56
Using computers allows learners to have control: to select the data, which is appropriate
for their work, and to produce graphical images of that data quickly and easily. Garancon
et al (1983, p.387), state that “their experience suggests that, given that opportunity
young learners’ ability to work with line graphs is far greater than is generally
understood”. Another related study by Garancon et al. (1983, p.54), focused on “a
functional approach to the teaching of early algebra”. It made extensive use of
computer-assisted graphical representations as tools for solving a variety of problems.
The aim was to uncover areas of ease/difficulty experienced by seventh graders in
learning how to produce, interpret and modify graphs. They worked in pairs at a
computer during approximately 25 problem-solving sessions. Garancon et al. (1983,
p.387), describes the ways in which learners coped with the two types of infinity they
encountered in a dynamic graphing environment that plotted intervals of discrete points
rather than continuous curves. In addition to helping learners to become aware of the use
of graphical representations as problem solving tools, “the environment provided a rich
context for learning about density of points, infinity, continuity and other issues that tend
to be ignored until calculus”.
McDermott et al. (1987) conjectured that the computer plays a significant role in enabling
learners to gain access to work with line graphs. It allows learners to build on their
intuitive understanding to come up with the skills required to draw such graphs by hand.
In this study, learners were able to produce graphs without worrying much about the
problems of scaling axes and plotting points. This allowed learners to focus their
attention on using the graph in a meaningful way. One feature of the software seemed to
be potentially important: if the size of the frame within which the graph is drawn is
changed, the scale is altered to fit the new frame. McDermott et al. (1987) had a sense
that this might be powerful in implicitly drawing learners’ attention to significant features
of the graph, which did not change under these conditions.
Although there appears to be considerable difference in the results McDermott et al.
(1987) had obtained and those reported by these two papers, it is worth pointing out two
factors which they recognize as having considerable significance. The learners and their
57
project class were caring out within the context of a project they had been closely
involved with for some weeks. According to McDermott et al. (1987), the data they were
working with was, although artificial in the sense it referred to imaginary learners, real
and meaningful to them. This would not be the case in either of the studies referred to
above. Secondly, the line graphs the learners produced were ones in which the
appearance of the graph matched the phenomenon which was being graphed; the graph
goes up as the learner grows up. Kerslake (1981, p.132) suggests that “graphs of this type
are the easiest for learners to interpret, and it is not clear whether Padilla’s or
Swanton’s test items contained graphs of this kind”.
In traditional classroom teaching, corrections are handed down by external authority.
There is no way that learners can use their own abilities to correct their own work.
Dugdale (1992) has pointed out the principles that should be followed in designing
learning environments for mathematics, which were used in this study:
The environment should consist of a “working model” of the concepts to be
learned, in which the mathematics is intrinsic. Learners should be able to
explore and manipulate this model.
This environment should include a set of inherently-interesting problems
which can be explored by learners of varying abilities and inclinations.
This type of learning, according to Edwards, (1991), is constructivist, in that the learner
must build upon his or her existing knowledge, and the micro-world provides the tools
needed to correct and refine this knowledge. These environments also have the potential
to allow learners more independent and self-directed exploration of mathematical
patterns, in which learners can go beyond the goals of the game and continue to satisfy
their own desire to find meaning and order in their educational experiences.
What is significant about much of the learners’ activities in a computer environment is
the very much reduced traditional role of the teacher. It is not by design or a conscious
act on the part of the teacher to stay more in the background, it appears a thing to do
58
under the circumstances, which comes to prevail. Linked to this role change of the
teacher is an equal and opposite role change of the learner. “Comparisons of computer
use and conventional instruction reveal a 39% to 88% reduction in time taken to
complete a task” (Kulik, et al 1983, p.24). This may be due to the software itself, how
content is presented and solutions pursued, or it may simply be due to increased work by
the learners. A novelty effect may also contribute to an increased working rate. On the
face of it there seems to be sufficient evidence to support the use of computers as
instructional aides. At the same time, we should not over-estimate their effectiveness for
learning; neither should we equate reduced time on task with an increase in conceptual
knowledge.
According to Yerushalmy (1998, p.167), “the use of computers where there is some
control over graphic output is an area where it is difficult to argue that there are any
better ways of learning. Functions and their graphs, raw numerical data and bar or pie
charts, scatter diagrams or just manipulating shapes, all fall into this category”. The
essence of this work is in the control which the user has over the computer environment,
and the control being exercised by the teacher in demonstration-mode or by learners in a
workshop-mode. Learners can now draw graphs accurately, super-impose one on another,
change parameters to see the effect zoom in, zoom out, ‘see’ a limiting value, understand
what it is to talk about a point of inflexion. All manner of things can be presented in an
interesting way so that learners feel that they need to know about what is going on. A
balance needs to be maintained between what is explored, appreciated and expressed
using computers and how mathematics is encouraged, expressed and refined.
Proponents of computer-based group-work suggest that potential benefits include the
externalisation of ideas through interaction. The other benefits are the consideration of
alternative perspectives, a greater diversity of skills and knowledge enabling exchange of
information and ideas, and increased attentiveness and on-task behaviour. According to
Healy et al (1990), research has indicated higher levels of discussion in computer–based
mathematical environments as compared to paper and pencil environments. Research
59
studies into learning resulting from computer-based group-work have however produced
conflicting evidence.
5.6.4 Negative factors in computer implementation Some of the factors at present militating against computers realising their full potential
are (Yerushalmy, 1998, p.170):
Lack of potential in managing the resource
Identification of areas of the curriculum which can be enhanced by the use of
computers.
Integration into non-computer mathematics work
Status of mathematical programming and choice of languages
Evidently, there is also a possibility that over use of computer algorithms for solving
problems will retard or even eliminate some of the possible mathematical and critical
thinking essential in the process of learning. There is a possibility that learners might get
the notion that “only a computer can do it”.
60
CHAPTER SIX
Research design and methodology
6.1 Methodological framework Research in mathematics education, that focuses on trigonometry, in particular learners’
thinking about trigonometry, is limited. This study provides clear details rather than
generalities because it explores issues that have not yet been widely researched
(Erickson, 1986). The methods of data collection were determined by the research
questions and thus it was decided to use the method of qualitative analysis by means of
one-to-one- task- based interviews (Goldin, 2000) and interview schedules.
Research question 1: What understanding did learners develop of the Cosine function as
a function of an angle in Grade 10?
A test was given at the beginning of the research to find out what understanding learners
had developed of the Cosine function in Grade 10. The use of Sketchpad, task sheets and
probing also gave more information on where the learners stood in terms the aspect.
Research question 2: What intuitions and misconceptions did learners acquire in Grade
10?
The initial test showed some of the intuitions and some misconceptions the learners
acquired in Grade 10. More of them also surfaced when Sketchpad was used, task sheet
had been completed, and some probing had been done.
Research question 3: Do learners display a greater understanding of the Cosine function
when using Sketchpad?
When the learners used Sketchpad, answered the interview questions, and wrote the final
test, the results showed some improvement from the initial test in terms of marks.
61
Although this does not in the least sense demonstrate understanding it reveals some
degree of learners’ clarity in terms of the aspect.
This method made it possible to document most of the necessary information that
individual learners reveal about their sense making of situations and contexts. It was also
beneficial to the researcher as it allowed greater control to observe and take note of, how
each learner went through the task sheet.
6.2 The sample This research is based on a case study of a class of Grade 11 learners from a school
situated in KwaNdengezi, an African high density township west of Durban, and west of
Pinetown. The aim was to obtain insight into how learners at Grade 11 understood
different aspects of the cosine function from Grade 10 and what their misconceptions
were, if any. It was expected to see similarities and differences between the learners and
it was hoped that these would illuminate different aspects of learning and provide a
deeper understanding of issues surrounding the important issues of the cosine function.
Sketchpad was used as a tool and a context to probe their understanding.
The school was chosen due to the convenience of having easy access to the computer
laboratory. Arrangements could easily be made to interview the learners since the
researcher works there as a Grade 12 mathematics teacher. These learners were selected
by their mathematics teacher who chose those who are doing Computer Application
Technology (C.A.T.). They were randomly chosen from a group of 123 learners in May
2010. These learners were of different ability levels and no screening was done in this
respect although it was taken into consideration that they were not repeating Grade 11.
Six learners, all girls, were chosen. All the learners doing Mathematics and C.A.T. in this
grade were girls. The purpose of the research was explained to the learners before the
research was carried out.
The learners were mainly worried if any marks would be recorded and form part of the
end of term report. After a while we reached a mutual understanding that even no marks
62
were recorded and used in their school assessment, they were going to learn mathematics
in a more exciting way than the is the norm. Even though this forms part of their learning
activities in school, letters to inform their parent/guardians of the research and to obtain
permission to participate were given. In turn, permission was also sought from the
Principal who further instructed the Mathematics Head of Department, the Grade 11
Mathematics teacher and the C.A.T. teacher to assist me in every possible way. Besides,
the participants were given a choice of withdrawing at any stage of the investigation.
All of them were very enthusiastic and willing to be part of the research although as the
day neared one of them was developing cold feet. I then realized that I had to spend more
time with them for them to feel sufficiently relaxed. Eventually I had to draft in a seventh
participant as reserve, in case something happened.
A pilot test for the instruments was carried-out and several adaptations made thereafter.
This was done in the second term of the academic year; the learners had not yet done
trigonometry again in Grade 11. These learners were ideal for this study as the questions
were suited to their level of understanding, taking into account that the topic was dealt
with in their previous year. Learners had done trigonometry before and this was their first
experience with a computer in trigonometric concepts. Everything was well within the
capabilities of the Grade 11 learners.
Learners were not previously exposed to using computers when learning mathematics
and therefore also not to the use of Sketchpad. Thus the learners involved were brought
together for a period of 60 minutes in order to familiarize them with the general use and
application of this software before the resumption of the actual investigation. The fact
that the learners were not exposed to Sketchpad did not affect the experiment because
minimal knowledge was expected from the learners about the software. Each learner was
made to feel at ease before the interview commenced, in order to ensure that they would
respond in a way that would reflect their understanding of the task provided. They were
given some time to ponder and write down their answers first before being interviewed
and probed but were then not allowed to change or alter their answers later.
63
6.3 The interview and microteaching experiment This study relates to action research, as it was more a teaching experiment done in an
interview setting. This study was also different, as it was not done in a full classroom
setting; it also used an interview format. A microteaching experiment was designed,
using psychological interview techniques to study how each learner experiences and
conceptualizes each activity. They were given some time to ponder and write down their
answers first before being interviewed and probed but were then not allowed to change or
alter their answers later. The objective was to see if some learning took place, and to
analyse the nature and quality of that learning. These questions were relevant: Have the
learners managed to form some concepts of the cosine ratio and function? What is the
nature and quality of their understanding? What intuitions and misconceptions do
learners bring to the learning situation and what is their role in their learning? To what
extent did Sketchpad assist in their conceptualization?
The learner interviews involved mathematical problems and task-oriented interviews
(Goldin, 2000). One of the salient features of such interviews is that the interviewer and
interviewee(s) interact in relation to a task(s) that is/are presented by the interviewer in a
pre-planned way. This method of interview is, according to Goldin (2000), particularly
well-suited for exploring conceptual understanding, complex problem-solving and the
construction of meaning in mathematics. The “structured mathematical environment”,
according to Goldin (2000), can be controlled to some extent but also adapted where
necessary. Two important advantages of structured, task-based interviews are that they
provide access to the learners’ processes of thinking about a predetermined task, and
consequently provide opportunities to investigate some complex mathematical topics in
greater depth.
An important point to consider is that, although the interview setting provides a means of
exploring learner thinking in a controlled and systematic way that is not possible in the
classroom, the interview setting is not the classroom setting. A significant difference is in
the power relation between interviewer and interviewees that is considerably different to
the power relations between the teachers and learners. The interactions between the
64
interview and the interviewees are also different. In a task-based interview setting, the
focus is generally on learners’ thinking and so the correctness or not of the answer may
be of little consequence to the interviewer. In classroom interaction, however, the
teacher’s focus is to usually obtain the correct answer and so the teacher provides the
learner with appropriate response to indicate whether their answers are correct or not. The
researcher, playing the role of the interviewer, continuously probed the learners’
understanding but did not necessarily reveal whether their responses were correct or not
and avoided at all costs pushing the participants to an answer.
The purpose in selecting interviews as the means of collecting data was to gain deeper
insight into the learners’ initial conceptualization of the cosine function, in a bid to make
inferences about their thinking at a particular point in time.
It must also be pointed out that learning took place in the interview, as can be evidenced
in the analysis in chapter seven. It is also possible that the probing by the researcher
influenced the learners’ thinking and that this may have led to learning. When and how
learning took place and how it impacted on learner thinking in the interview is a very
important aspect of the analysis undertaken in chapter seven.
6.4 The interview task The interview focused on three types of task: procedural, conceptual and applicable.
Procedural: tasks that are generally solved by applying a particular method, which is
usually, taught by the teacher, for example, the majority of tasks in the existing text
books.
Conceptual: tasks that probe learners’ understanding of the fundamental principles of
mathematics.
Applicable: tasks that require learners to make use of their knowledge of mathematical
principles to solve them successfully.
A pilot interview was carried out. Several adaptations were made thereafter. The reason
for the choice by the researcher of different types of tasks was that it enabled him to
explore the extent to which learners could work correctly with trigonometric concepts.
65
The study also checked if learners understood the algorithms they learnt and practised,
and if they could apply their existing knowledge to a unique situation.
The introductory task to the cosine function that the learners had to work through was
based on a circle within a Cartesian-coordinate system. The learners were also given
ready-made sketch (figure 6.1), which they manipulated as required in terms of the first
four tasks, but they also had to make their own constructions in the other remaining three
tasks (graphs) using Sketchpad. This sketch was of a unit circle where the radius could be
changed in length and could be moved right round the circle using a mouse to change the
size of the angle. The sketch was drawn using Sketchpad. It would simultaneously draw
the graph of cosine, as participants changed the angles to fill in the tables. There was a
small table in the sketch that showed the value of the angle selected, its cosine value, the
radius, the side x, and the ratio of sides. The sketch also gave the learners a chance to
realize that as they would be changing the input to get an output it would automatically
translate that into a graph. This would give them a visual definition of a function which
most are familiar with and can easily identify. At the same time, this will somehow make
them more familiar with the cosine graph.
66
1.5
1
0.5
0.5
1
1.5
2
2.5
3
400 300 200 100 100 200 300
Angle cos Angle( ) x rxr
236.59° –0.6 1.18 cm 2.0 cm 0.6
0° = 360°
90°
270°
AO
C
Figure 6.1
The learners needed some guidance in getting to know Sketchpad. To build their
intuition, they needed to observe, reflect on and conjecture about their experiments.
The decision to present the diagram to them was based on the following reasons:
It would take each learner a long time to figure out how to construct a right triangle
dynamic in a circle within a Cartesian coordinate system because they were not
familiar with Sketchpad.
The construction of the sketch was not one of the objectives of this experiment. So
presenting the construction to them did not affect the essence of the experiment.
At the commencement of the interview, learners were put at ease by the researcher. They
were asked whether they understood the task and if they had any question at that stage.
67
The empirical part of this research focused on the understanding, intuitions, and
misconceptions the learners had in Grade 10. Given a self-exploration opportunity within
the Geometer’s Sketchpad, it also sought to see if the learners gained some understanding
of the cosine function in all the quadrants, during a first introductory activity. The study
was done in relation to the cosine function;
As a ratio of sides of a right-angled triangle
As a functional relationship between input and output values and as depicted in
graphs
In order to evaluate their understanding of the last category above (the functional
relationship), this study checked to see if learners could estimate the value of the cosine
function for an angle and if they could draw a rough sketch of some cosine function. It
also checked to see if learners had somehow improved their conceptualization of the
cosine function.
Learners in this investigation were introduced to the cosine function in a purely
mathematical way, without a real context. This situation may go against outcomes-based
education, which proposes that learning should start with a problem in the real–world and
then move on to the more theoretical, abstract aspects. In a modeling approach, scale
drawing could first be used to solve the problem and to introduce similarity (the constant
ratio) of corresponding sides as the basis of trigonometry. Thereafter, a formal definition
of the trigonometric functions in terms of a circle may be introduced. In this study,
however, my purpose was not to investigate modeling, but to concentrate on the learning
of the cosine function during a more formal stage, using Sketchpad.
The interview protocol that follows was redesigned after a trial run. This is what it finally
looked like:
68
Interview Question 1.1: Do learners understand the cosine as a relation between input and
output values by filling in tables of values and comparing these values?
No Yes
Probe and redirect thinking
Interview Question 1.2: Do learners see cos θ as a ratio of two sides i.e. x/r?
No Yes
Probe and redirect thinking
Interview Question 2 and 3: Do learners see that cos θ is independent of r and that it is a
function of θ?
No Yes
Probe and redirect thinking
Interview question 4: Are learners able to approximate or estimate the value of a cosine
function for an angle not included in the data or vice versa? (Using the table of values
from Sketchpad)
No Yes
Probe and redirect thinking
69
Interview question 5: Are learners able to determine the range, domain, period and
amplitude of graphs of the cosine functions drawn using Sketchpad?
No Yes
Probe and redirect thinking
Interview question 6: Are learners able to determine the effects of a coefficient on x-
intercepts and range of graphs of the cosine functions drawn using Sketchpad?
No Yes
Probe and redirect thinking
Interview question 7: Are learners able to determine the effects of a constant on range
and amplitude of graphs of the cosine functions drawn using Sketchpad?
No Yes
Probe and redirect thinking
Interview question 8: Are learners able to draw graphs of the cosine function without
using Sketchpad?
No Yes
Probe and redirect thinking
70
Each interview was approximately 60 to 90 minutes long and each was audio-taped.
Although these questions were structured around the critical questions, it also allowed for
variation in expected responses from the learners. Further probing was done in particular
cases where learners wrote out the answers to questions at each step of the experiment.
In the final stage, the data was analysed and tabulated. This required the systematic
grouping and summarizing of the responses. It also provided a coherent organising
framework that explained the way each learner produced meaning whilst working
through the tasks provided.
6.5 The study The learners were given a one-hour test, at the beginning of this study, on Grade 10
trigonometric concepts, to identify some of the misconceptions and gaps they have. The
test was not sufficient enough to establish all of these as that would be beyond the scope
of this study. At the end they were given again another similar test to the first one to see
if the activity had had a positive impact on their conceptualization of the cosine function.
The two tests together with the instrument were solely based on the main aspects covered
in Grade 10, which are basically the trigonometric ratios and the graphs only. The results
were tabulated.
Geometer’s Sketchpad was used for the task of creating visual intuition. Initially the
researcher showed the learners some of the basic tools of the programme such as how to
drag the mouse to change the radius, to move the radius to find different angles and
ratios. A demonstration on how to draw graph had to be done for them to understand and
be able to do it on their own. The exercise is quite simple for the computer does almost
everything as long as one follows the correct commands to draw graphs.
Participants were provided with a series of question for them to explore. They were then
asked to generalize from their findings. They were “rediscovering” the law of cosine for
themselves when they manipulated the sketch which automatically measured sides and
computed ratios. As they moved the radius to get to the desired angle, a graph of the
cosine function would be simultaneously drawn.
71
It was not an original discovery in the strictest sense of ownership. It felt like discovery
to them when they realized that from their own calculations it came out a constant ratio
for a given angle. This came out as they filled in the tables with different radii; for the
same angle the ratio was the same respective of the radius. In this study I also partially
took on the role of the teacher, in some instances, in order for me to guide learners
through the task. On the other hand, I also assumed the role of the researcher during and
after the problem-solving session and analysing the results. My interest was in what the
learners did and their conceptual understanding, not analysing the learning objectives.
The six learners’ first task was to complete a set of tables for r=1, up to r=4, see table 6.1.
All the tasks were completed individually; they would write them down first and then
were each interviewed and probed to get their thought patterns and assist them to
conceptualize wherever possible. The interview protocol was based on the interview
schedule (appendix B) and was merely a guideline to important questions, as some of the
questions were not written down.
Relationship between cos θ and x/r
R=1
Θ x/r cos θ
10º
20º
30º
100º
150º
200º
250º
300º
350º
Table 6.1
72
Completing the table
The researcher had to explain the following to each learner initially in a brief session,
which described the clicking and dragging to use Sketchpad:
ANGLE: Move the mouse until the tip of the cursor is over the end of the radius
and drag it to the desired size and take a reading.
RADIUS: Press the mouse right button on the centre and drag it then release
quickly if you reach the desired length.
GRAPH: Go to “File” and select “New sketch” and from “Graph” choose “Grid
form” drag the x–axis to 100 and the y-axis to 1, 2 and 3 and then from “Graph”
select “Plot new function” and select cosine function.
The learners were asked questions to ensure that they understood exactly what was
expected of them. The learners seemed to quickly grasp the clicking and dragging
operations of Sketchpad since they all do C.A.T. as a subject.
After the introduction, they were asked to complete a set of tables for r =1, r =2, r=3, and
r =4.
The Geometer’ Sketchpad Screen
The learners first completed table 6.1. Based on the information in this table and the
exposure to the software, they were then further interviewed (see question 1 in the
interview schedule, appendix B).
Before completing the table for r=2, they were also interviewed and required to complete
question two in the interview schedule (appendix B). Thereafter, they then completed the
rest of the tables, were interviewed and probed for their understanding and answered
questions in the interview schedule (appendix B).
6.6 Transcripts of interview The transcripts of the interview in this research form the primary source of the data for
the analysis of the learners’ understanding. The probing part was mostly in isiZulu and
73
English to unpack the questions and get what the participants were actually pondering on.
The interviews were recorded and the transcriptions of the interviews were done
completely by the researcher. According to Jugmohan (2004), it is important that one
does not assume that a transcript is an accurate reflection of the interview as there is a
great deal of information in the interview situation that an audio-recording cannot
capture, for example learners’ emotions, the power relations between the interviewer and
the interviewee, physical movement and facial expression. An important consideration in
transcripts of interviews is that it not a written down version of an audio-recording, it is
an interpretation of the audio-recording. There is great information, such as intonation,
length of pause, and verbal expressions that cannot be captured easily in a transcript. The
transcriber makes a decision about the manner of information that is transcribed by
giving meaning from tone of the speaker on the recording.
74
CHAPTER SEVEN
Analysis and results
7.1 Introduction In this chapter, the focus is on the level of understanding of the cosine function by
learners and how they engage conceptualization and visualize the cosine function while
working with the Geometer’s Sketchpad during an activity involving a formal circle
definition. Also discussed will be how learners’ procedures impacted on their thinking.
7.2 Theoretical framework The Van Hiele theory of geometric thought and aspects of the existence of levels,
properties of levels and moment from one level to the next as well as constructivism are
used as a framework. Tall and Vinner (1992) and their notion of concept definition are
also used in the analysis.
7.3 A ratio orientation According to Pournara (2001), the mathematical symbol most central to ratio orientation
is the right-angled triangle. Other mathematical elements, he states, include: definitions
of trigonometric ratios as the lengths of sides of a right-angled triangles; the relationship
between the ratios particularly the quotient ratios such as tan θ=sin θ/cos θ and the
inverse ratios such as sec θ= 1/cos θ; and typical Grade 10 tasks where learners are given
a point in the Cartesian plane and are asked to determine values of particular
trigonometric ratios and expressions involving these ratios.
Such problems, he states, usually require learners to set up a right-angled triangle and
make use of the theorem of Pythagoras. The angle is grounded in a ratio orientation and it
merely serves as a reference point to locate the opposite and adjacent sides of the triangle.
It must be positioned in the triangle before the opposite and adjacent sides are assigned.
Thereafter the angle plays no further part in the problem.
An important point made by Pournara is that the use of the phrase “the cosine ratio” may
cause misunderstandings on the part of learners. This statement is often used for
75
simplicity. In referring to “the cosine ratio” we hide the role of the angle and so when
learners work with notation such as cos 30º, they may not use the cos 30º as a single
object, a ratio. They tend to treat cos 30º separately (Pournara, 2001). They know that 30º
is an angle, so they treat cos as the ratio, hence the cos ratio. He further goes on to say
that such misconceptions are reinforced when we speak of “the cosine of an angle” if cos
is a ratio and 30º is an angle, then learners see no problem in the “cos of 30º” as “the
ratio of an angle”.
7.4 Methods and procedures In this section the methods learners employed to solve the interview tasks and how their
answers relate to their understanding of trigonometric ratio and function (see appendices
A, B, and C) are discussed. The instruments used were an initial test, Sketchpad, and a
final test, in that order. Using two different tests to test progress on learning related to
concept is the main instrument used in the education system of education in South Africa
and the world over. Similar instruments on Sketchpad have been used in mathematics
(Mudaly, 1999, 2004 & 2007, De Villiers & Govender, 2006, De Villiers, 2008) and in
trigonometry (Jugmohan, 2004). This shows that the instruments used in this study were
valid and reliable for they have been extensively tried and tested.
7.4.1 Analysis of the initial trigonometry test results The initial trigonometry test was meant to assess the participants’ level of understanding
before going into the entire research process. It comprised of five questions. Question one
was meant to test Van Hiele Theory’s level one, whilst two and three were for level two
and four and five were for level three. The analysis is divided into 3 categories, correct,
wrong and partially correct (where a learner shows that she knows what the question is
all about and comes up with correct working but fails to get the correct answer because of
an error of some sort)
76
Question 1: Which side is the hypotenuse, which one is the adjacent and which one is the
opposite in relation to the given angle in table 7.1, with reference to the triangles in
figures 7.1 & 7.2?
Q P R Figure 7.1: Non-standard right triangle L M N Figure 7.2: Standard right triangle
Angle Hypotenuse Adjacent side Opposite side P PR = q PQ = r QR = p R
L N
Table 7.1 Results analysis: Question 1 Standard right triangle
Hypotenuse Adjacent Opposite
All 6 learners managed
to identify the correct
hypotenuse.
All 6 learners identified the
correct adjacent side.
All 6 learners identified
the correct opposite side.
Table 7.2
P R
77
Non-standard right triangle
Hypotenuse Adjacent Opposite
- Only 1 learner
identified correctly the
hypotenuse side
- 5 failed to identify the
hypotenuse
- Only 1 learner was able
to identify the correct
adjacent side
- 5 failed to identify the
correct adjacent side
- 2 learners identified the
correct opposite side
- 4 failed to identify the
correct opposite side
Table 7.3
This question was not well done, and indicates that these learners have problems with
visualization, as shown in the tables of results above (tables 7.2 & 7.3). It was easier for
the learners to answer questions from the standard right triangle (table 7.2). Out of the
three questions on hypotenuse, only seven responses out of 18 were correct. The same
applied to the question on the adjacent side, and all were from the standard right triangle.
The opposite side had better results scoring 14 correct responses out of 18 though with a
mere two from the non-standard right triangle (table 7.3). No answer was partially correct
in the entire questions. Those who did not answer correctly just indicated that they could
not remember a thing from the topic, as shown by their verbal responses. If the learners
can identify the attributes of a right triangle only if it is in standard form, then it means
that the concept was not mastered to a great extent. The possibility of not having
understood the question does not come into play at this juncture because all the learners
were able to fill in correctly values for the standard triangle. This means that the learners
are struggling to visualize at Van Hiele theory’s level one.
Busi’ response (table 7.4)
Researcher I see you wrote that the hypotenuse is RQ=p when dealing with angle R in
triangle PQR. How did you arrive at the answer?
Busi I changed the vertices and moved them around…. (Giggles) θ was
missing...(pause)……it makes it clear
Table 7.4
78
A possible explanation for their poor visualisation could be the standard, prototypical
way in which right triangles are mostly presented in textbooks. It also proves beyond
reasonable doubt that the interaction between the learner and the object of study, in this
case the right triangle, was not sufficient to allow learners to construct meaning out of it.
The use of dynamic geometry software would give the learner varied positions of the
shape in a short space of time. The learner would also have the opportunity to move it to
desired positions and stance.
Question 2: Given 15 sin = 12 and tan < 0. Calculate the value of 1 - 15 cos
with the aid of a diagram
Results analysis: Question 2
Sketching a right
triangle with
hypotenuse 15 and
side 12
Missing Side Ratios Substitution
3 learners managed to
sketch and label
correctly and 1 learner
had a correct sketch
but did not label the
sides. 2 learners did
not respond
All the learners failed
to calculate the missing
side using Pythagoras
theorem
No learner
managed to
employ the
trigonometric
ratios
All the learners
seemed confused
about the context
Table 7.5
In order to answer correctly question two it was necessary for the learners to sketch a
diagram and be able to come up with the answers (table 7.5). Three diagrams were
properly drawn, one was partially correct and the other two did not attempt to do
anything at all. In response they indicated that they were not familiar with the use of a
79
diagram when responding to such questions. However, they may have simply forgotten
the work they had done in the previous year.
Researcher You didn’t answer question 2.
Busi I’m slow. Mathematics is difficult. I tell myself it is and so does everybody.
Table 7.6
This negative view (table 7.6) shows that learners tend to believe that they do not have to
do anything other than listen to the teacher as he/she speaks in class. This coincides with
Brousseau (1997)’s “didactical contract” where learners take the process of teaching and
learning to be tantamount to the tea-pot tea-cup relationship. They see themselves as
empty vessels that have to be filled up by the teacher with them watching passively.
Another participant, Thabisile had the following to say (table 7.7)
Researcher You got 19.2 as the length of the missing side in question 2. How did you
arrive at that answer?
Thabisile I said Adjacent=15²+12²
Researcher Which method did you employ?
Thabisile Theorem of …eh…can’t remember….ah (sigh)…Pythagoras.
Researcher Do you remember exactly when to use it?
Thabisile Yes. When you want an answer using square roots….If you add 2 sides you
get the other side…..when you want the hypotenuse…I’m really not sure
how to use it.
Table 7.7
Question 3: Given 5 cos A + 3 = 0 and A [180; 360]. Calculate the values of the
following with an aid of a diagram;
i) Tan A
ii) 3 tan A + 25 sin2 A
80
Results analysis: Question 3
Sketching a right triangle
with hypotenuse 5 and
side 3
Missing side Ratios Substitution
1 learner drew the correct
diagram and managed to
label it accurately whilst
another had a sketch with
no labeled sides. The other
4 learners did not attempt to
answer the questions.
No learner
managed to use
the Pythagoras
theorem to find
the remaining
side.
No learner
managed to
employ the
trigonometric
ratios.
All the learners
seemed confused
about the context.
Table 7.8
Even though question two and three are similar, the learners failed to connect them (table
7.8). They were actually surprised to discover that they are similar and had no reasons as
to why they found it difficult to draw the sketch in question three when they had managed
it in question two. It does appear that less attention might have been given to problems in
quadrants other than the first in Grade 10.
However, questions two and three indicate that though some of the participants were able
to identify right triangles, several still fall short when it came to Van Hiele Level 2
thinking; not seeing relationships between properties.
Question 4:
4) P is the point (-5; 11 ). Determine (figure 7.3): i) OP P (-5; 11 ) ii) 1 – cos2 iii) Sin2 O Figure 7.3
81
Results analysis: Question 4
Sketching a right
triangle by drawing a
line perpendicular to
the x-axis from point P
Label sides Ratios Substitution
None of the learners
indicted that a line could
be dropped from the
point to form a right
triangle with the axes.
All the learners did
not indicate any
dimensions of sides x
and y.
No learner
managed to
employ the
trigonometric
ratios.
All the learners
seemed confused
about the context.
Table 7.9
Performance on this question was poor (table 7.9). None of the learners were able to
solve the items correctly. Evidently, the learners could not come up with any method to
tackle it. All the learners just skipped the question with no attempt at all. After the test the
learners were even convinced that they had never come across this type of question at all.
Perhaps such questions were never done with them even though they are in the
curriculum. This could be so, because, at times when teachers see that their learners are
failing to understand some basic concepts they see no reason to take them to the next
level and postpone them to some later date.
Question 5: If = 63.7 and = 28.2, use a calculator and give your answers correct
to 2 decimal places to evaluate:
Cos ( -)
82
Results analysis: Question 5
Substitution Simplification Use of Calculator
Only 1 learner
managed to substitute
the values into the
formula
The same learner
failed to simplify
the expression
The same learner was the
only one who realized that a
calculator had to be used in
order to answer the
question. The rest of the
learners were confused by
the context.
Table 7.10
Only one learner was able to substitute correctly (table 7.10). This showed that she had
understood the question even though she did not actually get the correct answer through a
computational error. She tried to subtract the angles on her own first and got a wrong
answer. She then referred to the calculator to find the cosine of the angle. This is quite
common as learners even with a calculator in hand, tend to prefer simplifying numbers on
their own and only use the calculator where they think the numbers are complicated.
The rest of the learners did not attempt to answer the question as they found it
complicated. This serves to show that the theory is correct in terms of fixed order as
defined above.
7.5.2 Analysis of Sketchpad activity
7.5.2.1 Interview Question 1.1: Do learners understand the cosine function as a relationship between input and output values and as a ratio of sides of a right-angled triangle in different quadrants?
After the tables for r=1 was completed, the learners were asked interview question 1.1
(appendix B): What do you notice about the x and r value respectively as the angle θ
changes in size?” The reader is reminded that the table referred to all four quadrants.
83
This question tested if learners, for a given r, could observe and understand that x
changes as the angle changes also.
Four of the learners made a correct observation in this regard, while two learners could
not. Their responses are now discussed in more detail in two categories below:
7.5.2.1.1 Category 1: x changes and r stays the same After probing, four learners felt that x changes and r remains the same. When they had
previously written down their answers they had thought otherwise. They said they had
not understood the question initially. In most cases learners have a tendency of rushing
through their work without reading questions carefully.
Only Samkelisiwe was accurate in her answer when she wrote and then explained: “As it
increases, x gets smaller, bigger, smaller, and bigger again in each quadrant but r stays
the same”. Busi, Thabisile and Bongekile had to refer to their tables when answering this
question. Noxolo mistook the x/r in her table with the x and r value respectively and got
more confused the more questions were asked. When questioned about x and r, she
realized that they are not angles, but still failed to make the correct conjecture. Referring
to her completed table she replied: “x and r decrease as the angle increases”. When
asked what she meant, she replied “I don’t know; Maths is difficult”.
Thandeka correctly dragged the angle and answered: “r remains the same, but the x value
decreases”. She first described, for the r value: there are changes happening…. The ratio
is going further up from the x…. And the degrees and the ratio change. When asked
directly about the r and x value as the angle changes she responded: (smiling) “….x is
decreasing yes and r remaining the same”, but failed to realize the difference in the other
quadrants.
84
What do you notice about the values of x and r respectively as the angle θ increases?
Busi’s answer to interview question 1.1 (table 7.11): when first asked this question it was
clear she had not understood the question as evidenced by what she had written above.
Researcher Ok, Busi, what do you notice about the x value and the
value of r as the angle θ increases
Busi I don’t understand. They are decimal fractions.
Table 7.11
The researcher further probed the learner by focusing attention on only one variable first
(table 7.12).
Researcher Ok, what can you say about the x value as the angle
increases?
Busi x is that (pointing to the column x in the table)
Researcher Yes.
Busi The angle is changing. Yeah. Ah... x changes…I see, oh that
is the question! Ok.
Table 7.12
The researcher further questioned Busi to answer the original question (table 7.13):
Researcher
Ok, what do you notice about x value as the angle is
increasing?
Busi The x value decreases, increases, decreases and then
increases again. (dragging the radius in different
quadrants, somewhat surprised that she had failed to
notice it)
Researcher What do you notice about the r value as the angle is
increasing?
85
Busi Same.
Researcher As the angle is going up?
Busi Same.
Researcher Are you convinced?
Busi Yes, because this diagram is the one for r=1.
Table 7.13
Interestingly all the learners, except Samkelisiwe, referred back to Sketchpad and to the
table when answering this question. Conclusively, four out of the six learners correctly
observed and understood that, for a given r value, x decreases in the first quadrant,
increases in the second, decreases in the third and then increase again the fourth quadrant
as the angle increases. Thus they were successful in the conjectured Level 2 of the Van
Hiele Theory. The four learners, who answered correctly, referred to Sketchpad (Busi)
and to the tables (Thabisile and Bongekile) whilst Samkelisiwe relied on her memory and
what she had done on her own.
Noxolo replied that both decrease, not realizing that r did not. Thandeka replied that x
decreases and r remains the same only considering the first quadrant. Time permitting
more probing could have been done with these two learners. They also noted is that they
did not take time to check their responses using either Sketchpad or the table, they just
rushed through everything.
7.5.2.1.2 Category 2- Both x and r decrease, or x decreases and r remains the same Noxolo felt that both x and r decrease.
Example: She was quite convinced that both x and r decrease, for example, she responded
by saying that: “…..as the degrees get bigger, they both decrease………x and r decrease.
Haw, Maths is difficult, sir”. This is again the didactical contract discussed earlier on.
Learners expect teachers to give answers as they sit and watch. They do not have to
figure out anything.
Thandeka felt that x only decreases and r remains the same.
86
Example: Though she correctly dragged the angle, she failed to realize the difference in
the other quadrants. She answered: “r remains the same, but the x value decreases”. She
first described, for the r value: “There are changes happening…. The ratio is going
further up from the x…The degrees and the ratio change…x is decreasing yes and r
remaining the same”.
These two learners do not seem to have mastered Level 1 of the Van Hiele Theory yet,
namely correct visual observation of the displayed lengths. It is difficult to discover the
generalization from the constant ratio to the functional relationship, which is
characteristic of Van Hiele Level 2 without correct observation. However, at times the
learners can observe correctly but can have difficulty in expressing their observations in
words. Accurate description of one’s observations is a skill on its own and more of a
challenge for second language learners than for first language ones.
7.5.2.2 Interview Question 1.2: Do learners see cos θ as a ratio of two sides x and r? The learners were more confident and seemed clear about what was asked. Their
responses showed that they did not have any problems with answering this question.
7.5.2.2.1 x/r and cos θ are the same All the learners correctly observed that x/r and cos θ are the same or almost the same and
that in two quadrants cos θ would be negative. Most learners had gained confidence and
did not need to go to the table. Interestingly, the learners did not pick up on or chose to
ignore the small differences in the decimal displays. Even though the decimal differed in
some cases in the table because of the improper placement of the diagram when changing
the radius, learners observed the “sameness”.
The immediate reply was “They are the same” without looking at the table or computer
screen. When questioned why they did not refer back to the sketch on the computer
screen or the table, they said that they knew that from when they completed the table and
did not need to look. Busi also immediately said that: “answer for x/r and cos θ are
87
almost the same, only that in some quadrants cos θ is negative”. Thandeka also replied:
“…it’s like the same…. It’s not exactly the same, some are exactly the same…..but some
are like below or above the value.”
Noxolo, Thabisile and Busi answered that the values were almost the same as their values
differed in one decimal in some cases. Below are Busi’s tables (tables 7.14 & 7.15):
r=1
Θ x/r Cos θ
10º 0.95 1.0
20º 0.92 0.9
30º 0.86 0.9
100º 0.10 -0.2
150º 0.79 -0.9
200º 0.92 -0.9
250º 0.39 -0.3
300º 0.42 0.5
350º 0.92 1.0
Table 7.14
Obviously in this case she had resorted to using her calculator in dividing the actual value
by r hence the 2 decimals after the comma. This must have emanated from the fact that
they were not that aware of that the calculation could be done by Sketchpad. Thandeka
actually had 0.93cm/1.0cm in her first table. It came out different in table 2 for all except
Samkelisiwe who only changed in the last one. The researcher felt that personal
discovery at this juncture was more appropriate.
88
r=2
Θ x/r Cos θ
10º 1.0 1.0
20º 1.0 0.9
30º 0.9 0.9
100º 0.1 -0.2
150º 0.8 -0.9
200º 1.0 -0.9
250º 0.4 -0.3
300º 0.5 0.5
350º 1.0 1.0
Table 7.15:
This question demonstrated that all six learners, with the aid of a visual representation
(Sketchpad), were able to correctly observe that x/r and cos θ are the same where cos θ is
positive. Where it is negative, in the other 2 quadrants, the values would be distinctly
different because of the negative sign only. This is not to say that they could not have
discovered it in the same way using paper and pencil, but they might not have done it in
Grade 10. Through observation and experimentation the learners observed the
relationship between the “cosine of an angle” and the displayed values. All the learners
who were interviewed therefore achieved Van Hiele Level 2 (Analysis), with respect to
this task.
7.5.2.2 Interview Question 2: Do learners see that cos θ is independent of r? The main purpose of the following question was to establish if the learners were able to
make a conjecture regarding their observations, and generalize that the ratio would
remain unchanged for r = 2. The learners were asked in question 2 in the interview
schedule (Appendix B): “What do you think will happen to the above ratios if we
increase r to 2? Why?”
89
The reader must note that this question was asked after the first table for r = 1 and the
interview Question 2 were completed, and before r was dragged to 2 with Sketchpad.
7.5.2.2.1 The ratio x/r will increase Initially all learners replied that the ratio x/r will increase. This shows that despite having
been introduced to the cosine and other trigonometric functions in Grade 10, they firstly
did not know that the ratios remained constant. Secondly, this means that they probably
did not understand the underlying similarity of right triangles with the same reference
angle, which forms the basis of trigonometry.
Bongekile wrote: The x/r for example will be, if θ =10º - x/r will be 2.95cm because we
added 2, before it a 0.95.
In justification of her answer she said: “…the circle will increase so the answers for the
ratios will increase the total degrees will get bigger by 2; x/r will get bigger”.
Similar responses were given by Noxolo, Thabisile, Busi, Thandeka, and Samkelisiwe:
“If we change r to 2, the cos value and the x/r value will increase to that because the
circle will be bigger”
None of the six learners knew that the cosine of a given angle will remain constant,
irrespective of r, and all of them expected it to increase as r is increased. The researcher
had to allow and guide the learners discover for themselves the conjecture. The learners
did not see the relationship initially, but after completing the second table the room was
filled with giggles and whispers that the tables are the same. It seemed that they were
surprised by their finding which contradicted their expectations. This is similar to the
method of “cognitive conflict’ where meaningful learning requires learners’ false
conceptions to be contradicted by observed experience.
90
7.5.2.3 Interview Question 3: Are learners are able to generalize that cosine θ is independent of r? Interview question 3 (Appendix B) was given to them after completion of tables for r = 2,
r = 3 and r =4 using Sketchpad: “for any given angle, what do you notice about the
corresponding values of x/r in each table for r=2, r=3 and r= 4?” The learners answered
that the values remained constant without any form of hesitation. This can be evidenced
by their responses as shown below:
Bongekile replied: “The values are similar; they all begin and end with same number”.
So she correctly refers to the degree of accuracy in the decimals. Noxolo concurred.
Thabisile answered: “They are almost the same.” So did Thandeka and Samkelisiwe.
This again takes into account the correct values of decimals. Asked if they had observed
anything about the graph the answer was the similar: “It was the same through-out, it
never changed”. Asked if they thought cosine θ was a function: Noxolo answered: “It
drew a graph, it can be” and Bongekile “It has a graph”. Thandeka said: “The graph
shows it”. Samkelisiwe said she knew it from class.
Notably, these learners seem to have the conception that a graph is necessarily a function.
One wonders if they would take a bar graph of, say, income distribution grouped in
geographical areas as a function.
Busi had a slightly different answer: “They are the same. The values of x/r in each table
are the same”. She did not even look at her table to answer this question but rather
referred to the graph which was simultaneously drawn. When asked to explain this, she
replied: “Even the graph traced remains the same, it does not change”. When she was
asked if r=100, and for any r she replied: “yes”. Asked if she thought cosine θ was a
function she replied: “yes”. When she was asked to elaborate: “You can draw a table of
values of x and y and draw a graph” Are all graphs functions? “Most, but this one I know
it, it’s a function”.
91
All six learners answered correctly that for any given angle, the corresponding values of
x/r were the same in the table for r=2, r=3 and r=4. According to the levels of geometric
thought in Van Hiele Theory, they had achieved level 3, called informal deduction
(Ordering), where learners can come up with meaningful definitions.
7.5.2.4 Interview Question 4: Are learners able to estimate the size of an angle given a ratio only?
7.5.2.4.1 If cos (angles) = ½ then the angles are _____and______?
7.5.2.4.1.1 The use of Sketchpad This question gave the learners a lot of problems. They did not know what to find and
how to go about it. Only two learners, Thandeka and Samkelisiwe, asked if they could
use the computer for they felt they would do it better the second time around but still
failed to interpret the question to a level they understand. The truth of the matter was that
they were not sure of what exactly they were supposed to look for.
Samkelisiwe: Can I use the computer? I want to check my answer first?
Interviewer: How?
Samkelisiwe: I’ll drag the radius till I get 0.5 and then check the corresponding angle.
Interviewer: Show me then.
Samkelisiwe: There it is. (Pointing at 60º)
Interviewer: Is it the only one?
Samkelisiwe: (she then dragged the radius round all the way, with a lot of scrutiny, to the
fourth quadrant) there is the other one …300º (smiling triumphantly)
It was almost the same with Thandeka.
Thandeka: I prefer to use the computer. I have to check my answer again. I am not sure
Interviewer: How?
Thandeka: I’ll use diagram and see where there is 0.5 and then check the angle of it.
Interviewer: Show me then.
92
Thandeka: There it is. (Pointing at the diagram indicating 60º)
Interviewer: Is it the only one?
Thandeka: There could be 2 or more. Let me just find out…. There is the other one …so
they are 2.
7.5.2.4.1.2 The use of a table Two learners needed some assistance before going on to use their tables. The other two
got so confused by the question that the assistance by the researcher made no difference
and they gave up answering it without any further attempt.
Thabisile realized her mistake early but could not find a remedy at first.
Thabisile: ... it’s difficult sir
Interviewer: Can you try it using the previous exercise?
Thabisile: (checked her table first and located 0.5 in line with 300º)...ah... It’s easy
Interviewer: Is it the only angle?
Thabisile: Let me check…..it’s not there but I think since these values are decreasing
(pointing at 20º and 30º) it will be there.
Busi: I think it is 90º.
Interviewer: How did you get the angle?
Busi: I am thinking 90º, because that is the angle I know in a right triangle”.
She was not aware that she needed to refer to the previous exercise to come up with the
correct answer. The interviewer had to ask her if she thought the question was related to
the previous exercise. After that she went back to the exercise and then referred to her
table and eventually came up with 300º even though she failed to find the other value.
Noxolo and Bongekile found the question demanding and gave up without any attempt
regardless of the convincing verbal persuasion from the researcher. Once again we see
the didactical contract creeping in from the side of the learners, as explained earlier on.
Most learners are comfortable with the teacher telling them only the answer and not just
giving them clues.
93
Noxolo: Must I change it to decimal?
Interviewer: Are we referring to an angle here?
Noxolo: No we are talking about a fraction ……. So ……you can say ½ =0.5 so will give
you cos 0.5”.
Interviewer: Read the question again, this time slowly.
Noxolo: I have to find an angle! Oh so no … (silence)….. (Thinking)….. There could be a
way of doing it, but I don’t know.
Samkelisiwe and Thandeka realized that they needed to use the computer to find the
angles. This demonstrates that the learners had acknowledged its usefulness of a
computer in solving mathematical problems. Even though Thabisile and Busi used their
tables, it was still an indirect way of accepting the computer as a useful tool in the subject
for they could have tried to use calculators.
7.5.2.4.2 Estimating the value of the angles if x/r = 0.55
The answers the learners gave emanated from their answers to the previous question.
Those who had a correct answer found it simple to proceed to another correct one for it
was a simple continuation of whatever they had as the answer to the question. All the
four learners who had managed to make the correct conclusion made a conclusion that ½
was similar to 0.55 and that the angles would be different by a few degrees (57º and
303º).
One of the misconceptions that the learners had is that they had the belief, particularly at
Grade 10 level, that ALL functions are linear. This came out very nicely where they had
to estimate an angle of 0.55. Most of them used the assumption that the cosine function is
linear. They got an answer close to the correct one because within the small interval, it is
approximately linear. As a teacher, it is very important that one is aware that the learners
could be using incorrect reasoning. Teachers should be aware of this and should develop
strategies to alert them that the cosine function is not linear. Over a small interval, yes,
but over a larger interval, learners are bound to make mistakes. It is not only applicable to
the cosine function, but to the quadratic function as well.
94
In this question Noxolo and Thabisile were the only learners who were initially confused
by angles and ratios. The other learners at this point did not confuse the angles and ratios.
Thandeka and Samkelisiwe found it fit to use the Sketchpad even though they were only
geared to find only one angle initially. However when told that the ratios corresponded to
the cos (angle) they had in the tables, they quickly found the two values and correctly
answered the questions. Four out of six learners, that is Busi, Thandeka, Thabisile and
Samkelisiwe correctly noticed this and used the computer to find the two angles that
corresponded to the two given ratios each. According to the conjectured levels of
geometric thought, they have achieved Van Hiele Level 2. Here the emphasis is on ratio.
7.5.2.5 Interview Question 5: Are learners able to determine range, domain, period and amplitude of a graph of cosine?
All six learners had the correct cosine graph on the computer. The graph had been drawn
using Sketchpad to add some flavour to the study even though it was not the main task.
The researcher had to assist the learners through the steps in most cases as they had not
drawn any graphs before using this software.
The researcher had to guide the learners by reminding them of the definition of domain,
range, amplitude, and period. The learners had to identify these on their own from the
graphs without the use of Sketchpad. Some learners had written down wrong answers,
however, they were able to identify correct ones after the explanation.
7.5.2.6 Interview Question 6: Are learners able to determine the effect of the coefficient of cosine (y = a cos x) on x- intercepts and range if it is increased, decreased, less than 0?
The dynamic software, Sketchpad, was used to put together a group of different graphs
for the learners to clearly observe differences between them. The learners had to observe
the diagram and come up with the corresponding effects on their own without the use of
Sketchpad. The learners had varied ways of expressing themselves. Some preferred to
95
describe the effects in terms of amplitude and not range, others even used y. The
researcher had to guide them through the steps at times as they could not remember the
next step or so.
Bongekile had the following:
As the co-efficient of cos x increases: “Range increases”
As the co-efficient of cos x decreases: “Decreases”
Asked if she could show it from her graphs she replied: “There they are”. She referred to
the correctly drawn diagrams. Thandeka used y and so did Noxolo and Busi. Samkelisiwe
and Thabisile talked of amplitude instead.
It can be concluded that it seems as if all the learners succeeded in identify all the
attributes of the cosine graph but not the correct terminology. Some confused range with
amplitude. Perhaps not much had been done in Grade 10 along those lines. However,
according to levels of geometric thought in Van Hiele Theory, they have achieved Van
Hiele Level 2
7.5.2.7 Interview Question 7: Are learners able to determine the effect of a constant (y = cos x + q) on amplitude and range of a cosine graph if it is greater or less than 0?
Experience from the previous exercise helped as the problems in this one were very
minimal and they all managed to correctly observe the y or vertical shift of the graph.
This shows that the learners were able to benefit from the use of Sketchpad as a learning
tool. The fact that a number of similar exercises can be done in a short space of time is
yet another advantage of using dynamic software as shown by these two similar
activities. To summarize: it can be concluded that it seems as if all the learners succeeded
in identifying all the attributes of the cosine graph. According to levels of geometric
thought in Van Hiele Theory, they have achieved Van Hiele Level 2.
96
7.5.2.8 Interview Question 8: Are learners able to draw the graphs of y=cos x -2 and y=-2cos x without the aid of the computer?
This question was intended to check whether the learners could generalize from the
above graphs and draw the graphs on a piece of paper without using the computer. No
probing was done. The researcher just looked at the diagrams and asked a few questions
where necessary, to draw some conclusions.
Thandeka failed to draw the sketches as she claimed that she could only do it using the
computer. Busi and Thabisile had only one wrong one. Noxolo had one wrong and
another correct. Bongekile and Samkelisiwe had their diagrams correct.
Of the six learners, it can be concluded that three of them succeeded without using
Sketchpad in drawing the cosine graph and identifying all the attributes.
7.5.3 Analysis of the final trigonometry test results
The main objective of this test was to see if the intervention by Geometer’s Sketchpad
had in any way filled in some of the missing gaps in the learner’s understanding of the
cosine function and had given them a better conceptualization. The analysis is divided
into three categories, correct, wrong and partially correct (where a learner shows that she
knows what the question is all about and comes up with correct working but fails to get
the correct answer because of an error of some sort).
Question 1: Use the diagram (figure 7.4) (no calculator) to determine the value of:
y
Cos A
P (- 5 ; 2)
A x
Figure 7.4
97
Results analysis: Question 1
Sketching a right triangle by drawing a
line perpendicular to the x-axis from
point P
Cos A
All the learners indicted that a line could
be dropped from the point to form a right
triangle with the axes
2 learners managed to get the correct
value whilst 1 had the
hypotenuse/adjacent instead of vice-
versa. 3 other learners did not indicate
any dimensions of sides x and y
Table 7.16
This question regarding the use of a diagram was correctly done by all (7.16). The ratio
part had half getting it right and the other incorrect. Somehow the use of Geometer’s
Sketchpad had helped the learners observe that as the radius moved, from each point a
right triangle could be drawn. Clearly the learners showed that they were able to
assimilate the information given to them in the problem taking into account the relevant
data.
Question 2: 17 sin = - 15, (90°; 270°). Use a diagram to evaluate the value of
cos2. Do not use a calculator.
98
Results analysis: Question 2
Sketching a right
triangle with
hypotenuse 17 and
side 15
Cos θ Cos²θ
5 learners drew the
correct diagram and
managed to label it
accurately whilst only
1 failed to so.
2 learners managed to
get the correct value. 2
other learners had
hypotenuse/adjacent
instead whist the other 2
seemed confused by the
question.
2 learners went on to get the
correct value. 1 learner squared
the wrong hypotenuse/adjacent
whilst the other 3 did not
attempt the question at all.
Table 7.17
Only one learner failed to come up with a diagram which indicated that they somehow
tried to relate to the exercise with Sketchpad where they had to use the ratio of sides of a
right triangle (table 7.17). Four learners showed that they could find the values of cos θ
and three of cos²θ. Two learners had no idea on how to calculate cos θ and 3 failed to find
cos²θ. It appears that these 3 learners are still struggling at Van Hiele Level 2 and still
require more time and more practice in order to grasp the concept a little more. However,
there is some upward movement in terms of the attempt as compared to the similar
question in the first test.
Question 3: Calculate the values of:
Cos (123.4 - 86.1)
99
Results analysis: Question 3
Simplification to Cos 37. 3º Use of Calculator to get correct fraction
5 learners managed to simplify
what was inside the brackets to
37. 3º whereas only 1 learner
failed to do so.
2 learners got the correct value whilst 2 others
showed that they could not correctly use their
calculators. The other 2 learners thought it was
enough to get Cos 37. 3º and saw no reason to
proceed to finding the fraction.
Table 7.18
In this question the learners showed that they were able to assimilate the information
given to them in the problem and were able to use the calculator effectively (table 7.18).
Even though some committed some errors which impeded them from getting correct
answers, their working showed that they knew what they were doing and only 2 did not
do it the correctly.
Question 4: Solve for x: x [0; 90]
a) 2 cos x = 0.766
Results analysis: Question 4 (a)
Simplification to Cos x = 0.383 Use of Calculator to get correct angle
5 learners managed to simplify
the equation to Cos x = 0.383
whereas only 1 learner failed to
do so.
3 learners got the correct value and the other 2
used cos 0.383 instead of the inverse. The other
learner did not attempt the question.
Table 7.19
Only one learner failed to simplify the equation to get cos x = 0.383 (table 719). Their
algebraic manipulation showed that they were able to work correctly with the information
given to them in the problem. Some learners used cos 0.383 to find the value of x instead
100
of the inverse. This shows that the learners have problems in using the calculator
effectively. However half of the learners correctly found the value of x.
(b) Cos 2x = 0.766
Results analysis: Question 4 (b)
Simplifying to
2 x = cos-1 0.766
Simplifying to
x=(cos-1 0.766)÷2
Finding the value of
x
4 learners managed to simplify
the equation to
2 x = cos-1 0.766 whereas 2
learners failed to do so.
4 learners managed to get
the correct value. The
other 2 seemed confused
by the question.
Only 1 learner went
on to get the correct
value of x. The other 2
did not simplify their
answers to get x as
they did not divide by
the angle by 2. The
other 1 went on to
multiply the answer
by 2 whilst 2 learners
did not attempt the
question at all.
Table 7.20
Only two learners struggled with the algebraic manipulations (7.20). Only one dropped
off as she failed to obtain the value of x in the end. The other learner seemed to have
failed to notice the difference between this question and the previous one. However,
some minor calculations were made which cost the other two the correct answers. This
problem could be emanating from the fact that most learners in African schools do not
calculators and even if they do they only start using them in Grade 10. At times they
borrow them to use in mathematics tests and examinations and fail to operate them
properly.
101
Question 5:
Calculate Q (figure 7.5).
Figure 7.5
Results analysis: Question 5
Correctly identifying side PR
as the opposite side (11.5-opp)
Coming up with the
correct ratio
sin θ=(11.5/15.8)
Finding the value of
θ= sin-1 (11.5/15.8)
5 learners managed to identify
the opposite side with only 1
taking it for the adjacent one.
5 learners managed to get
the correct ratio whilst
the other used the wrong
opposite side.
Only 2 learners went
on to get the correct
value of θ= sin-1
(11.5/15.8). The other
2 did not simplify
their answers. Whilst
2 learners did not
attempt this part of the
question at all.
Table 7.21
Five learners were able to identify the sides with respect to the given angle but failed to
get to the bottom line of the question (table 7.21). One learner though could not figure out
that the side PR was opposite to the angle Q. Only two of them managed to make the
angle the subject.
Q 15.8 P 11.5 R
102
Question 6: A boy stands at A on top of a building AE, B
looking up at an airplane at B, through
an angle of elevation of 22.3°.
A C
He then looks down at a car at D through an
angle of depression of 37.8°at precisely
the moment that the airplane is directly
above the car. Calculate the height of the airplane
Question 6 was basically on the application of the concept in a real life situation (table
7.22). Only three learners did it correctly and the other three did not even attempt it.
Maybe this was because of the lexical density or readability or plain language problems
as they seemed to be comfortable with those questions with fewer words.
The learners had improved marks in the final test to show some improvement from where
the learners had started from. The fact that the learners knew that the activity was not
examinable could have had a negative impact on their performance and attitude.
However, half of the learners clearly had achieved Van Hiele Level 3; they were able to
deduce ratios when angles were given, angles when ratios were given, and diagrams from
103
given statements which shows that the use of Sketchpad helped in learning and in
reminding them of some concepts of the cosine function.
7.5.4 Analysis of the research questions
7.5.4.1 Research Question 1:
What understanding did learners develop of the Cosine function as a
function of an angle in Grade 10? From the test that was given at the beginning of the research learners showed that they
had understood very little of the Cosine function as a function of an angle in Grade 10.
However, the researcher could not fully establish if all the new understanding displayed
in the final test had emanated from the use of Sketchpad, task sheets and probing. It could
have been that they were now recalling some of the things they had done previously.
The first test showed that the learners could not identify satisfactorily the sides of a right
triangle given an angle. This test demonstrated that all six learners were struggling at Van
Hiele Level 1 and clearly needed some assistance to move to level 2 and 3. The learners
demonstrated that, from their Grade 10 trigonometry, they had mastered working with a
right triangle, only when it is standard.
Three of the learners could sketch a right triangle to answer trigonometric questions
given a point in a Cartesian plane, but they could not proceed to find the ratios necessary
to answer the questions. This showed that the learners had problems in finding a side or
an angle when given a point in a Cartesian plane or a trigonometric equation. Only one
learner was able to substitute values of angles into a given statement correctly, even
though she failed to carry-out the correct calculations to get to the required answer.
During the Sketchpad activity the learners showed that they were familiar with the ratio
of the cosine of an angle given as a fraction and not as a decimal. This was displayed
104
when they struggled to relate the given decimal to a ratio. The learners also knew that a
graph could be plotted using the cosine function, although not at a click of a button, as
they found out.
The use of visual dynamic software was expected to fill in these gaps as it did with the
different forms of the right triangle. It was then evident that the use of Sketchpad had
accorded the learners an opportunity to construct their own meaning of the cosine
function and improve their visualisation by working with non-rigid diagrams. The study
also gave the learners an opportunity of organizing and structuring what they had learnt
in Grade 10.
7.5.4.2 Research question 2:
What intuitions and misconceptions did learners acquire in Grade 10? The initial test showed some of the intuitions and some misconceptions the learners had
acquired in Grade 10. More of them also surfaced when Sketchpad was used, task sheets
had been completed, and some probing had been done.
Most learners showed that they thought that trigonometry was solely confined to a
standard triangle as they found it an uphill task to identify the sides of a non-standard
one. If they did, maybe, they just thought that it was something difficult to identify. This
also comes up as one of the misconceptions exposed by the test that the learners seemed
to assume that all right triangles should be standard only. The other possibility could be
that they have the notion of thinking that trigonometry deals with the standard right
triangle all the time and that it could be impossible to apply it to other forms of right
triangles. This is where the use of Sketchpad came in handy as working with the unit
circle gave them exposure to different forms of the right triangle as they dragged the
radius around in different quadrants.
The learners had also assumed that if the radius of a unit circle was changed, then so
should the ratios of sides. This clearly emanates from the fact that when the topic is done
105
in class the rigid shapes used to do not give room for change of radius. The relationship
between function of an angle and the ratio of sides was something not very clear to them.
Some thought that the function of an angle was one thing and the ratio of sides another
with no relationship whatsoever.
The learners had their own intuitions and misconceptions from the previous grade. This
made the entire study a meaningful learning process for them. Olivier (1989, p.18) points
out that, “errors and misconceptions are considered an integral part of the learning
process”. It is the starting point of knowledge acquisition by learners. A conflict is
created from within and they capitalize on that.
7.5.4.3 Research question 3:
Did learners display a greater understanding of the Cosine function
when using Sketchpad?
7.5.4.3.1 Were learners able to use the provided Sketchpad sketch
effectively to arrive at reasonable solutions? The learners were quite comfortable with the sketch provided. It never came out at any
stage, during the interview, that there were signs of not being able to use or understand
the Sketchpad sketch provided. The fact that they were able to fill in the tables showed
that they were able to work with the sketch to a reasonable extent. At times, of course,
they could not hold the cursor steadily to get the actual value of the angle but the error
was minimal.
After filling in the first table for r=1, when the learners were asked what they anticipated
would happen to the ratios when then radius was increased, they were quick to realize
that what they thought was not correct. The fact that they could recognize that the ratios
did not change when the radius did gives credence to the effectiveness of the Sketchpad
sketch.
106
7.5.4.3.2 Did learners display greater understanding of the Cosine
function when using Sketchpad? The researcher was able to draw some substantial general conclusions from the
interviews conducted because the preliminary test was used as the control level and yard
stick. Their performance in the final test was improved as compared to the first one. It
can be said that in the second test the learners were able to sketch the appropriate triangle
for the Cosine function. They did not just see a point in a Cartesian plane but were able to
relate it to trigonometric functions.
There are a few ways in which Sketchpad could have assisted in increasing their
understanding of the Cosine function:
- Sketchpad, without any doubt, helped in the visualisation of the unit circle and
how it is related to the Cosine function as the graph was simultaneously
drawn.
- The fact that learners could move around the radius of the unit circle and see
the values of the angle and of the ratio change gave them a sufficiently good
idea on the relation between angle and sides of a right-angled triangle.
7.5.4.3.3 Did learners acquire knowledge about trigonometric concepts
and graphs from Sketchpad without being told? When the learners went to the task sheet, using Sketchpad, the learners informally
acquired some information relating to the radius, the angle, ratios, graphs, and so on. The
learners became convinced that the ratios did not change when the radius did. They also
discovered that the sign of the cosine of an angle changed as the quadrant did. Learners
were also exposed to working with ratios in decimal form as opposed to the fraction
regularly used. They also learnt the graph of the Cosine function as it was drawn
simultaneously when they moved the radius of the circle.
107
The general usefulness of Sketchpad can be summarized as follows:
- The ease with which the diagram was manipulated and graphs constructed.
This allowed the researcher and the learners the freedom to drag, change the
radius and manipulate the figures as and when required. This may have been
impossible to achieve if pencil and paper were used.
- The use of buttons saved a lot of time and allowed learners to see changes at
the simple click of a button. Tedious and cumbersome constructions were
avoided by the use of the mouse.
- The graphs constructed using Sketchpad were clear and made
misinterpretation less likely. The use of pencil and paper might have resulted
in many errors besides the fact that they most likely could have failed to plot
them all.
- The shifts of graphs and the movement of the radius were clearly visible. In
many instances this was essential to their understanding. It could have been
time consuming if the learners had to show all the shifts on paper using a
pencil. Besides, the possibility of coming up with incorrect ratios was
eliminated.
- The manipulation and drawing of diagrams on the screen allowed the learners
to grasp properties and understand relationships easily.
It can be concluded that the study managed to answer all the research questions
successfully and that the instruments used were suitable and appropriate. The timing of
the research was also appropriate. The level of questions was up to standard as they are
similar to those found in mathematics textbooks used in schools in Grade 10. The
situation and site of the study also gave the learners the liberty to participate at ease as
they were in the familiar territory of their own school.
108
CHAPTER EIGHT
Conclusions and recommendations
8.1 Introduction The focus in this study was on Grade 11 learners’ understanding of the cosine function
this was probed with some Sketchpad activities. In this chapter, the findings from the
interview schedules are summarized. Further, some issues and difficulties in trigonometry
in general are discussed and recommendations are made
8.2 Summary of findings
8.3 Overall findings This research came up with some valuable results that could be used in the process of
teaching and learning of trigonometry, functions and mathematics in general. The mode
of instruction employed gave learners a greater and better understanding of the cosine
function. This research concentrated on the cosine function as a ratio and its graphical
representation. It also managed to expose some of the deeper misconceptions and
intuitions learners have on the cosine function after their first encounter with the topic at
Grade 10. The use of Geometer’s Sketchpad helped in exposing more of these whilst at
the same time working as a remedial and valuable tool for the learners to better grasp the
concept of trigonometry.
The learners continually asked for questions to be elaborated or to have the question read
for them. They seemed to be very dependent on the researcher for the direction of their
cognitive processes. I found that, if the learners were given time and probed further about
their thinking, it gave them an opportunity to think, even to correct themselves and come
up with their own answers. Most of the time the learners did not have the patience and
perseverance that are conducive and necessary to problem-solving. This also came
through when they read a question. They did not read it carefully enough and rather read
what they expected the question to ask. Another thing that was absent was the zeal to get
109
correct answers since they knew that the exercise did not, at the end of the day, have any
effect on their end of term mark.
The research also showed that some learners can not use a calculator effectively and
efficiently. This is evidenced by the fact that they could still get wrong answers in their
addition and subtraction even though they all had calculators. They would try to add or
subtract numbers on their own and only use calculators to find the cosine of angles (table
6.1). This had a negative effect on the performance of the learners. The main reason is
that most of them cannot afford to buy calculators and when they do, they opt for cheap
ones. They depend on borrowing a calculator when they find they cannot do an exercise
without one. In most cases their calculators do not last long and do not work properly as
they go through many hands. In this study it is possible that the learners could have
borrowed calculators from other learners and were therefore not familiar with how to
operate them properly.
However, past experiences with computers and previous knowledge about computers
helped the learners to feel comfortable with the use of GSP (global positioning systems)
in the study. The visual function of GSP helped to bring about a better understanding of
the abstract that they were asked in the interview and the questionnaire. In the beginning
of course, the use of GSP and the learners understanding seemed to be separate as shown
by the values they used in the first table. They were able to solve most of the problems as
they became more familiar with GSP. They could even change the value of r on their
own.
The use of the computer can change a learner’s understanding as it allows the learner to
move the picture and relate its changing state to the relevant numerical concepts (Blackett
and Tall, 1991, p.146). It is, by no doubt capable of improving understanding. This is
referred to by Blackett and Tall (1991) as the “principle of selective constructions”,
employing the computer to perform tedious and cumbersome constructions whilst the
learner concentrates on more important aspects.
110
The following statistics reveal the significant level of success that the learners obtained in
each test and the interview questions:
8.3.1 Initial Test Questions Test Questions 1: Out of the 3 questions on hypotenuse, 7 (38%) answers from 18 were
correct. Out of the 3 questions on the adjacent side, 7 (38%) answers from 18 were
correct. Answers on the problem related to the opposite side were better with 11 (62%)
out of 18 correct.
Test Question 2: Only 3 (50%) learners out of 6 managed to draw the correct diagram
and 1 (16,7%) partially correct and 2 (33,3%) incorrect. No one managed to come up
with the remaining side. No ratio was correct neither was the substitutions.
Test Question 3: Only 1 (16,7%) learners out of 6 managed to draw the correct diagram
and 1 (16,7%) partially correct and 4 (66,7%) incorrect. No one managed to come up
with the remaining side. No ratio was correct and only 1 (16,7%) partially correct in the
substitutions.
Test Question 4: None of the learners could do this question correctly. Two did not
attempt the question as they found it very difficult. There was no correct diagram. No one
managed to come up with the remaining side. No ratio was correct and neither was there
any correct in the substitutions.
Test Question 5: All 6 (100%) learners did not attempt the question as they found it very
difficult. There was no correct side. No one managed to come up with the other
remaining sides. No ratio was correct and neither was there any correct in the
substitutions.
Test Question 6: Only 1 (16,7%) learners out of 6 managed to do it correctly and 1 (16,
7%) partially correct and 4 (66,7%) did not attempt to do it.
8.3.2 Interview Questions during Sketchpad Interview Questions 1.1: Four (66,7%) of the learners interviewed correctly observed
and understood that as the angle increases the ratio changes and r stays the same.
Interview Question 1.2: All the learners (100%) correctly observed and understood that
x/r and cos θ are the same or almost the same and that in two quadrants cos θ would be
negative.
111
Interview Question 2: None of the learners (0%) interviewed at this stage of the
interview, could conjecture, without the use of Sketchpad or tables that the cosine of a
given angle would be independent of the radius.
Interview Question 3: The activity seemed to have addressed the noted misconceptions
in question 2, all six learners (100%) answered correctly that the value for any given
angle, the corresponding values of x/r were the same in the table for r=2, r=3 and r=4
after using Sketchpad.
Interview Question 4:
a) Four out of six learners (66, 7%) correctly observed and used the computer to find
the two angles that corresponded to the given ratio. However learners struggled
with ½ since all the other values they had used were in decimal form. Those who
obtained some other answer misinterpreted the ½ in cos (angle) =½, as an angle or
a fraction that needed to be changed to a decimal.
b) After some probing of the previous question, four out of six learners (66, 7%)
correctly observed that the answer to this question will be a few degrees different
from the previous one.
Interview Question 5: All six learners (100%) correctly drew the graph of cosine as it is
an easy exercise when using Sketchpad. The researcher had to guide them through the
steps in most cases at times as they could not remember the next step or so.
Interview Question 6: All the learners (100%) succeeded in using Sketchpad to draw the
graph of y=acos x and identify all the attributes.
Interview Question 7: All the learners (100%) succeeded in using Sketchpad to draw the
graph of y=cos x+ q and identify all the attributes.
Interview Question 8: It can be concluded that 3 (50%) of the 6 learners succeeded
without using Sketchpad in drawing the cosine graph and identify all the attributes.
It seemed that away from the computer the learners seemed at a loss of what to do, and
completely blank; it took a lot of probing for them to seem to understand the question.
112
8.3.3 Final test questions Test Question 1: All 6 (100%) of the learners managed to correctly draw or use the
diagram. Two learners (33%) came up with the correct ratio, 1 (16,7%) was partially
correct and 3 (66,7%) were incorrect.
Test Question 2: Five of the 6 learners (82,3%), managed to correctly draw or use the
diagram with only one failing to do so. Two learners (33%) came up with the correct
ratio, 1 (16, 7%) was partially correct and 3 (66,7%) were incorrect.
Test Question 3: Five of the 6 learners (82,3%), managed to correctly simplify the
values inside brackets with only one failing to do so. Two learners (33,3%) came up with
the correct fraction, 2 (33,3%) were partially correct and 2 (33,3%) were incorrect.
Test Question 4 a): Five (82,3%) of the learners managed to correctly simplify the
expression with only one failing to do so. Three learners (50%) came up with the correct
solution, 1 (16,7%) partially correct and 2 (33,3%) were incorrect.
Test Question 4 b): Four (66,7%) of the learners managed to correctly simplify the
expression with only 2 (33,3%) failing to do so. Four learners (66,7%) came up with the
correct angle, and 2 the correct solution, 1 (16,7%) partially correct and 3 (50%) were
incorrect.
However learners struggled to transpose terms correctly. This question was quite simple
as it only tested their understanding and recognition of the algebraic expressions and not
the deeper trigonometric equations which are required in Grade 11 and 12.
Test Question 5: Five of the 6 learners (82,3%), managed to correctly come up with the
opposite side with only one failing to do so. Five of the 6 learners (82,3%), managed to
come up with the correct ratio, where only one failing to do so. Two learners (33, 3%)
came up with the correct angle, 2 (33,3%) partially correct and 2 (33,3%) were incorrect.
Test Question 6: Three (50%) of the learners got the correct length for BC and 3 (50%)
again obtained the correct length of DC. The other half failed to do so.
If we look at the three sets of results we see a gradual upward movement from the
preliminary test results to the final one, even though the development was not that
113
remarkable. At its conclusion, the study managed to answer successfully all the research
questions. The methodology and the study instruments used proved to be appropriate and
suitable for the investigation. However, one of the factors which could have had negative
effect on the study is that the participants were aware that the exercise would not carry
marks for the final term mark or any meaningful evaluation. In any case it is still evident
that the use of GSP and understanding seem to go hand in hand for better understanding
of mathematics. Most of the Sketchpad activity was designed towards relational
understanding as opposed to the instrumental understanding from the chalk and talk
method they were exposed to in Grade 10. As the study came to an end, the learners’
attitude changed dramatically in favour of this type of exercise in their daily classrooms
(even mine as well, I now use Sketchpad in my lessons on trigonometry and graphs). The
learners were convinced that it is more convenient and easy to explore the trigonometric
questions with the aid of a dynamic sketch.
When learners get right answers in a test it could be because of understanding, but
unfortunately learners also got right answers with incorrect reasoning. One thing this
research showed is the pervasiveness of the idea that all functions are linear, for example,
when learners subtracted 3º from 60º to get the corresponding angle for cosine of 0.55
since that of 0.5 was 60º. Telling learners the correct answer will not help; activities such
as those used in the interview should be designed to place learners in cognitive conflict.
This has important implications for teaching. We need to do follow up for a deeper
understanding.
Since we are in a computer age, the computer environment is significant in changing the
traditional mathematical environment. Freed from routine performing mathematical
techniques, the problem solver can now focus on mathematical meaning, methods and
explanations (Pournara, 1991). By combining various representations of mathematical
problems, teachers can invent new ones.
Even though using the computer is proving to be very useful in mathematics instruction,
language remains a very serious problem in most black schools. In this study it was
114
evident that the learners were not fully engaged in the process as they looked somehow
distanced from the activity. It is different from their behaviour when you see them
playing outside, even in the presence of an educator. There are far too many things they
struggle to grasp, thereby hindering their full involvement and ownership, not only of this
one single activity; one has the impression that the entire system which is somewhat
divorced from their everyday way of life. Although this goes beyond the scope of this
study, there is a need for research which links this study with the broader problems of the
South African schooling system.
In general, computers give learners room for generalization. They are powerful problem-
solving tools in the hands of a proficient user, and learners need to acquire new skills in
order to work proficiently with them.
8.4 Misconceptions and constructivism Even though at the beginning of the study it had been proved beyond any reasonable
doubt that the learners had errors of misconceptions the study did not focus on uprooting
them (Olivier, 1989). The Geometer’s Sketchpad helped the learners’ change and correct
their misconception that “cos θ was dependent on r”. By changing or increasing r and
seeing that x also changed or increased with it, and that the ratio x/r remained constant,
participants made a realisation that was a surprise to them, and that resulted in an
important conceptual change. For example, in this study, when learners were asked to
calculate a ratio for an angle that was not in their completed tables (see analysis) this
produced some form of conflict. They were used to fractions. Again, given their
mathematics experience at Grade 10, some obtained incorrect answers by assuming that
the cosine function was linear, as shown, after a short interval, the cosine function is
approximately linear.
Learners also revealed gaps in their knowledge; especially their ratio and function
orientation needs to be improved. There is need for teachers to shift from implicit notions
of ratios and functions by assisting learners to develop a strong function orientation
which is explicit. The teacher needs to make the input-process-output mechanism explicit
115
so that learners can use it (Pournara, 2001). This may be done with the aid of a calculator,
showing how it takes an input and operates on it to produce the output.
Learners should be able to shift between ratio and function in order to solve trigonometric
tasks. Pournara (2001), states that teachers need to understand that sin 35º can be seen as
number (ratio) and that y=sin 35º may be considered a function, and that the orientation
which they adopt, will depend on the task, or sub-task at hand. It is therefore the duty of
teachers to make learners know that there are two orientations, both equally valid, and
then make use of this resource in their thinking. The orientations become explicit tools
that learners can draw on consciously. Pournara (2001) states that in making the
orientations explicit, they become objects of attention and therefore may become too
visible (Lave & Wenger, 1991) which leads to the dilemma of transparency (Alder,
2001). In making the orientations visible, learners may focus on the orientations as ends,
not means. Thus they may see the orientations, but not see them to be trigonometry
(Pournara, 2001). Through continuous use of the orientations in a variety of different
tasks, learners become familiar with them (Pournara, 2001), and ultimately the
orientations become implicit again. I believe this kind of state creates a conflict which in
turn makes them inquisitive and active participants with the desire of quenching their
curiosity.
8.5 Van Hiele Theory Since my participants were at Van Hiele Level 1 at the start, they needed a ready-made
sketch to work with. In this study, the learners relied a lot on visualisation as they
progressed from the first difficulty, which were, for example, recognizing angles and
ratios, (Van Hiele Level 1, visualisation), to looking at embedded properties (Van Hiele
Level 2) and then eventually to the generalizations that occurred in Question 3 and 8,
when the learners were asked about the cosine of an angle when r=2 to r=4. All the
learners seemed to understand that for a fixed angle, it does not matter what value r
assumed. That seems to indicate that the learners have progressed to Van Hiele Level 3
where they made a generalization from particular cases that were documented in the
116
tables that for r = 1 and so on, to the general case of any given value of r, the cosine of a
fixed angle will always be the same ratio.
8.6 Learners’ understanding of ratio Learners worked with the ratio in the initial test, the study, and the final test thus was in
different contexts. It seems as if the learners struggled each time the ratio changed from
decimal to fraction form. Noxolo and Thabisile had 0.5 for the angle from cos (angle) =½
and had most likely wrongly divided 0.55 by 2 to get the 20.5. Noxolo asked: “Must I
change it to decimal?” When asked if we were talking about an angle she replied: “No
we are talking about a fraction ……. So ……you can say ½ =0.5 so will give you cos
0.5”. If the question was in decimal fraction form, like the value in their table I believe
they could have come up with correct answers.
It is clear that some learners also did not fully understand ratio and proportion at the
beginning. Learners could not link the word to the relationship between two sides of a
triangle and thus could not explain why its value increased or decreased as the angle
changed in question 3.
The learners in the study, initially were taking the opposite side and the adjacent side to
be fixed, and did not move them even when the angle changes. Even though all the
learners made use of the theorem of Pythagoras, still this problem reared its head. These
tasks reinforce an operational view of ratio since learners focused on individual sides of a
triangle. Thus learners did not view their answers as ratios of an angle, but as common
fractions and got mesmerized when these were changed to decimal. Understood in this
manner, the numerator and the denominator are treated as separate entities that have
meanings independent of each other. This weakens the development of a concept of ratio.
The first activity illustrates “pseudo-structural conception” because, according to Sfard
and Linchevski (1994), learners were able to calculate the ratios for angle measurement.
They gave ratios in decimal form in the study; here the ratio was seen in the lengths of
sides of the right triangle. This suggests that the learners did not fully understand the
meaning of the ratio and its relationship to the angle or to the sides of the triangle. It
117
seems many learners did not understand that the process of dividing the length of the
adjacent side by the hypotenuse is equivalent to keying in an angle and pressing the cos-
button. Thus they were unable to take the output from the calculator and relate it to the
appropriate sides of the triangle.
On the Sketchpad screen display, the values for x/r and cos θ were in decimal form.
When learners worked with the ratio in decimal form, they may have got confused
because they had only one side in their view. However, the Geometer’s Sketchpad helped
the learners develop some better understanding of ratio and proportion. Finding an angle
whose cosine is equal to ½ which they had to change to 0.5, resulted in an important
conceptual understanding.
8.7 Difficulties with learning trigonometry Some of the factors that make trigonometry difficult to learn are: poor understanding of
trigonometric notation due to some sloppy notation form teachers themselves, difficulties
in the use of the calculator which the teacher should strive to explain to the learners, a
poor concept of ratio, and difficulties with algebraic manipulation, inadequate pre-
knowledge, confusing the ratio of sides with the actual length of sides, and the need to
understand the conversion between angle and ratio.
8.7.1 Converting between angle and ratio Most learners experience problems if different types of numbers are used (question 4 a)
in the interview schedule). Consider cos (angle) =½; the output can be seen either as a
ratio or simply a fraction that has to be changed to a decimal number, depending on the
orientation that is adopted (Pournara, 2001). This emanates from the fact that they have
been using decimal fractions in all the other exercises. This can cause cognitive
discontinuity (Tall et al, in press) if the learner is not firm in the concept knowledge.
Some recognized this as the question clearly asks for the angle. Thandeka subsequently
answers this question correctly: “I prefer to use the computer. I have to check my answer
again. I am not sure” When asked what how, she replied: “I’ll use diagram and see
where there is 0.5 and then check the angle of it”. “Show me then”. “There it is.
118
(Pointing)” Asked if it was the only one she replied: “There could be 2 or more. Let me
just find out. There is the other one …so they are 2”.
None of the learners clearly distinguished between input and output values to use the
inverse function in this question, but eventually the point got home since this method was
employed in the final test.
8.8 Recommendations
8.8.1 Classroom practice
8.8.1.1 Computer software The use of dynamic geometry software, such as Sketchpad, in the research paid some
valuable dividends in conceptualizing the cosine function. The instruction method used in
the research provided learners a greater, and more meaningful, understanding of the
cosine function and other functions.
The use of computers in mathematics instruction has several important benefits. Teaching
will take far less time than usual. Imagine if a teacher has to illustrate to learners how to
draw a cosine graph, how long it will take? Using Sketchpad is faster. The rest of the time
will be left to explanation and questions from the learners. More graphs can also be
plotted on the same axes for comparison’s sake and different colours used.
8.8.1.2 Classroom strategies The findings of this research have positive implications for the use of textbooks in the
classroom as well. Some textbooks are written at Van Hiele levels different from that of
learners and teachers unknowingly and trustingly use them without considering their
learners. Therefore teachers should become aware of these potential gaps in some
textbooks and exercises carried-out in lessons. Teachers should help develop strategies to
get as much as possible from the available textbooks.
119
Some suggested strategies are given below:
a) The teacher should be alert to possible misconceptions formed as a result of limited
visual examples.
b) The teacher should help learners understand trigonometric concepts where text book
presentations can be done dynamically by the computer or by manipulative models.
c) Teachers can use the textbook to reconcile more exploratory activities in trigonometry
d) To help learners progress to Level 1 thought, the teacher can use dynamic geometry
software and some exercises from the textbook to encourage learners to test many
examples to determine if properties are true or false. Teachers should ensure that learners
have exposure to a wide range of right triangles.
e) To help learners progress to Level 2 or 3 thought, the teacher can raise the level
required in many routine exercises by asking “why?”, and “explain your answer.”
8.8.3 Changes to the curriculum Hirsch et al (1991) proposed a trigonometry curriculum that is built around the graphing
calculator. Now that there is computer software like Geometers’ Sketchpad, Geogebra
and others, this would be the most appropriate tool to assist in the learning of this subject.
Thanks to various sponsors, most schools in South Africa now have computers; so this
intervention would be very possible in most schools.
The chalk and talk technique does not seem to be yielding any positive results in terms of
improving the pass-rate, so, we need to work harder to try other methods to assist in the
understanding of mathematics. When a learner discovers something on his/her own, it is
easier to recall and apply the concept as compared to just taking results for granted.
Computer added software like Sketchpad, provides visuals and easy to use techniques to
enhance discovery learning.
Of late, there have been many calls to abandon the OBE curriculum but none for change
in mathematical textbooks to involve more Level 1 and Level 2 thinking, and which are
more consistent with the Van Hiele model. The teachers’ guide might be more explicit in
identifying Van Hiele levels in some parts of the text, and in helping teacher’s plan
120
instruction to fill in levels and lead to higher levels of thinking. Still more attention
should be given to the selection of visual examples in lessons involving Level 1 thought.
There is a need to be more innovative in trying to use methods that will aid the
understanding of mathematics, making it easier to visualize that which is abstract.
8.9 Short-comings of my research - The study was done in one school, which provided a reasonably homogenous
group, with only six learners who happened to be all girls.
- The study did not focus on modeling trigonometry functions and how this might
motivate learners to learn trigonometry and aid conceptualization.
- It is difficult to test understanding since getting the correct answer does not
necessarily mean understanding.
- The study used task-based interviews with individual learners, which is very
different from a classroom context. This was just an introductory activity and
what is needed a longitudinal study.
- The learners had some familiarity with computers, so the findings may not
necessarily generalize to learners who were not familiar with computers let alone
those who do not have them.
- IsiZulu and English had to be used in the interviews which are not what might
happen in a normal classroom situation. This might be a hindrance when it comes
to exam questions.
- From facial expressions and general body language one could sense a reasonable
degree of reluctance of some sort which is not common in a normal classroom
situation or test. Some gave up far too soon. Most of them would actually take
action only after a lot of probing which, which indicates a lack of seriousness of
some sort in some cases. This could have emanated from the fact that they knew
that the exercise did not carry any marks for their term-end evaluation and was
not examinable.
- Culturally most Blacks take “not being open” as synonymous with “respect”,
which is not useful at this juncture. In most cases answers one can get are just “I
don’t know or I don’t know Mathematics”. The learners’ mindset is that they view
121
themselves as “passive recipients” according to G. Brousseau’s (1997) didactical
contract. This also has a negative impact even in their learning activities in
mathematics as the element of critical thinking is very remote, or missing. They
mainly rely on being spoon-fed and copying from the nearest learner and are
basically concerned about the “answer”. In most cases one has to do a lot of
examples in order to “kick start them” and still will get the usual request “Can you
please do number so and so for us, we don’t understand?” Some have even asked
to have questions explained to them during examinations!
The researcher had to spend more time talking to the learners to establish a mutual
understanding of each other at a social level to begin with. The researcher also took the
entire group to a Ministry of Transport schools competition on “Road Safety”, where
public presentation skills were tested in order for them to participate more freely.
8.10 Further research - Further research would indicate whether similar results could be obtained with a
classroom of learners plus non- homogeneous groups, instead of one-to-one interviews.
- An investigation to ascertain whether these results are also true for the graphing
calculator environment would be helpful. This would perhaps be more relevant to the
present classroom situation in many South African schools.
- In African schools it would be appropriate to conduct further research to indicate
whether similar or better results could be obtained when using the mother tongue in
trigonometry.
122
BIBLIOGRAPHY
Adler, J. (1992). Dilemmas and a paradox: Secondary mathematics teachers’ knowledge
of their teaching in multilingual classrooms. Teaching and Teacher Education, 11 (3),
263-274.
Adler, J. (1998). Lights and limits: Re-contextualizing Lave and Wenger to theorise
knowledge of learning and teaching school mathematics, in A. Watson, (Ed) Situated
cognition and the learning of mathematics (pp.161-177) Oxford: Centre of
mathematics education research, University of Oxford.
Ainley, J. (1994). Building on children’s intuitions about line graphs, J.P. da Ponte, & J.
F. Matos, (Ed), Proceedings of the eighteenth Annual Conference of the International
Group for the Psychology of Mathematics Education (pp.291-334) Lisbon. Portugal.
Amit, M., & Vinner, S. (1990). Some misconceptions in calculus: Anecdotes or the tip of
an iceberg? Paper presented at the Proceedings of PME 14, Mexico.
Arcavi, A., Meira, L., Smith, J., & Kessel, C. (in press). Teaching mathematical problem-
solving: A micro-analysis of an emergent classroom culture. Journal for Research in
Collegiate Mathematics Education.
Arcavi, A., Bruckeimer, M. & Ben-Zavi, R. (1987). “History of mathematics for teachers:
The case of irrational numbers”. For the Learning Mathematics, 7(2), 18-23.
Artigue M. (1991) Functions from an algebraic and graphic point of view: Cognitive
difficulties and teaching practices. In: E. Dubinsky, G. Harel (Eds.) The concept of
function. (pp.109-132). Mathematical Association of America.
123
Balacheff, N. (1990, June 1-3). Beyond a psychological approach to the psychology of
mathematics education. Plenary address. Fourteenth international PME conference.
Mexico, 181-197.
Balacheff, N. (1996). Treatment of refutations: Aspects of the complexity of a
constructivist approach to mathematics learning. In E. von Glasersfeld (Ed) Radical
constructivism in mathematics education. (pp.67-71) Dordrecht, Netherlands: Kluwe.
Bishop, A. I. (1989). Review of research on visualisation in mathematics education.
Focus on learning problems in mathematics, 11(1), 7-16.
Bishop, A. I. (1983). “Space geometry” In R. Lesh, M. London (Ed) Acquisition of
mathematics concepts and processes. New York. Academic press, 38-45.
Blackett, M. & Tall, H. D. (1991). Developing understanding of trigonometry in boys and
girls using a computer to link numerical and visual representations. Unpublished
Doctoral thesis. University of Warwick.
Bloom, L., Comber, G., et al. (1986). Use of the micro-computer to teach the
transformational approach to graphing functions. International Journal of
Mathematics Education, Science and Technology 17(1): 115-123.
Boaler, J. (1997). Experiencing school mathematics: Teaching styles, sex and setting.
Birmingham. Open University Press.
Breindenbach, D., Dubinsky, et al. (1992). Development of the process conception of
functions. Educational Studies in Mathematics 23, 247-285.
Bressoud, D. M. (2010). Historical reflections on teaching trigonometry. The
Mathematics Teacher, 104(2) 106.
124
Bruna, P. (1996). Can’t see the words for the tree: Interpretation and graphical
representations. In Proceeding of the colloquium on thinking with diagrams, London:
IEE.
Brodie, K. (1998, January). Teacher-or-leader-centred: How do mathematics teachers in
South Africa teach? Paper presented to the 6th annual meeting of SAARMSE.
Brousseau, G. (1997). Theory of didactical situations in mathematics. Retrieved 2
February 2011 from http://www.defimath.ca/mathadore/vol3num123.html.
Brown, M. (1981). Place value and decimals. In K.M. Hart (Ed.) Children’s
understanding of mathematics: (pp.11-16) London, John-Murray.
Clark, D. (1983). Secondary mathematics teaching: Towards a critical appraisal of
current practice. Vinculum, 21(4), 16-19.
Clements, D. & Batista, M. (1990). Translation difficulties in learning mathematics.
American Mathematical Monthly, 88(4), 32-41.
Cohen, L. & Manion, L. (2006). Research methods in education. New York: Routledge.
Collins, P. (1973). Introducing trigonometry. Mathematics Teaching, 63, 44-48.
Nickson, M. & Noddings, N. (1997). Politicizing the mathematics classroom. In
Mathematics, Politics and Pedagogy, 150-159.
Noss, R., Sutherland, R. & Hoyles, C. (1990). Teacher attitudes and interactions. Report
of the micro-worlds project (pp.7-20), London: Institute of Education, University of
London.
Novak, J. & Gowin, B. (1984). Learning how to learn. (1st ed.) New York: Cambridge
University Press.
134
Nunes, T., Light, P. et Mason J. (1993). Tools for thought: The measurement of length
and area. Learning and instruction.
Nunes, T. & Bryant, P. (1996). Children doing mathematics. Oxford: Brazil. Blackwell.
Olivier, A. (1989). Handling learners' misconceptions. Pythagoras 48, 17-25.
Olivier, A. (1984). Introductory algebra: In-service education course. Cape Town, South
Africa: Cape Education Department.
Pea, R. D. (1994). Distributed designs for intelligence. In G. Salomon (Ed) Distributed
cognitions. Cambridge: Cambridge University Press.
Penchalia, S. (1997). Young children’s intuitive solution strategies for multiplication and
division. Word problems in problem-centred approach. Unpublished master’s
dissertation, University of Durban-Westville, Durban, KwaZulu-Natal, South Africa.
Penglase, M. & Arnold, S. (1996). The graphics calculator in mathematics education. A
critical review of recent research, Mathematics Education Research Journal, 8 (1), 91-
96.
Piaget, J. (1970). Genetic epistemology. Chicago: University of Chicago Press.
Polya, G. (1981). Mathematical discovery on understanding, learning, and teaching
problem-solving. New York: John Wiley & Sons.
Ponte, J. & Carreira, S. (1992). Computer spreadsheet and investigative activities: A case
study of an innovative experience. In J. P. Ponte et al. (Eds) Mathematical problem-
solving and new information technologies: research in contexts of practice (pp. 68-81)
Berlin: Springer.
135
Porter, A. (1988). A curriculum out of balance: The case of elementary school
mathematics. Institute for Research on Teaching Research series.191. East Lansing,
MI: Michigan State University.
Pournara, C. (2001). An investigation into learners' thinking in trigonometry at Grade 10
level. Unpublished master's thesis. University of Witwatersrand, Johannesburg, South
Africa.
Powell, K. C. & Kalina, C. J. (2009). Cognitive and social constructivism: developing tools for an effective classroom. Education 130(2), 241-50.
Prestage, S. (1996). Teachers’ perceptions of sequencing and progression in the
Mathematics National Curriculum. In D. C. Johnson & A. Mallet (Eds) Implementing
the mathematics national curriculum (pp.58-75) London: Paul Chapman Publishing.
Resnik, L. B., Nesher, P., Leonard, F., Magone, M., Omanson, S. & Peled, M. (1989).
Conceptual bases of arithmetic errors: The case of decimal fractions. Journal for
research in Mathematics Education, 20, 8-20.
Romberg, T. A., Fennema, E., Carpenter, T. P. (Eds) (in press). Integrating research on
graphical representation of function. Hillsdale. N. J: Lawrence Erlbaum, Associates.
Ruthven, K. (1990). Influence of graphic calculator use on translation from graphic to
symbolic forms. Educational Studies in Mathematics, 21, 431-450.
Satty, G. (1976). Trigonometry revisited: a combined approach. Mathematics Teacher,
69(7), 557-560.
Saxes, G. B. (1991). Culture and cognitive and development. Mahwah, N. J: Erlbaum.
136
Schoenfeld, A. (1989). Explorations of learners’ mathematical beliefs and behaviour.
Journal for Research in Mathematics Education, 20(4), 338-355.
School Development Unit. University of Cape Town (2004). Maths for all grade 10
learners' book. University of Cape Town. Manzini. Swaziland: Macmillan Boleswa
Publishers.
Schwarz, B. & Dreyfus, T. (1989). Transfer between functional representations; a
computer model. Proceedings of PME 13, 143-150.
Sfard, A. (1991). On the dual nature of mathematical conceptions; reflections on
processes and objects as different sides of the same coin. Educational Studies in
Mathematics, 22, 1-36.
Sfard, A. (1992). Operational origins of mathematical objects and the quandary of
reification: the case of function. In G. Harel & E. Dubinsky (Eds) The concept of
function: aspects of epistemology and pedagogy (pp. 59-84) Mathematical Association
of America.
Shama, G. & Dreyfus, T. (1991). Spontaneous strategies for visually presented linear
programming problems. Theses proceedings.
Silver, E. A. (1993). On Mathematical problem-posing. Proceedings of the 7th
International Conference PME (pp.219-228) Kitakyushu, Japan.
Skemp, R. R. (1976). Intelligence, learning and action. New York, John Wiley & Sons.
Steffe, L. P. & Thompson, P. W. (2000). Teaching experiment methodology: underlying
principles and essential elements. In R. Lesh & A. E. Kelly (Eds.), Research designs
in mathematics and science education (pp.267-307) Hillsdale, NJ: Erlbaum.
137
Stols, G. (2007). Designing mathematical-technological activities for teachers using the
Technology Acceptance Model. Pythagoras 65, 10-17
Suydam, M. N. (1985). The shape of instruction in geometry: Some highlights from
research. Mathematics Teacher, 78, 481-486.
Swan, M. (1983). Teaching decimal place value. A comparative study of “conflict” and
“positive only” approaches. In R. Hershkowitz (Ed) Proceedings of the 7th
international conference for the psychology of mathematics education (pp.211-216).
Rehovot, Israel :Weizmann Institute of Science.
Tall, D. O. (1985). Using computer graphics as generic organizers for the concept image
of differentiation. Proceedings of PME 9, 105-110.
Tall, D. (1987). Algebra in computer environment. Proceedings of PME 11, 1987.
Tall, D. (1989). Concept images, generic organizers, computers, and curriculum. For the
Learning of Mathematics 9(3), 87-92.
Taylor, A. O. R. (2000). Teaching mathematics with ICT. London : Continuum 2000.
Taylor, N., & Vinjevold, P. (1999). Getting learning right. Johannesburg, South Africa:
Joint Education Trust.
Thomas, M. O. J. & Tall, D. O. (1988). Longer-term conceptual benefits from using a
computer in algebra teaching. Proceedings of the 12th conference of PME (pp.601-
608) Budapest, Hungary.
138
Thornton, R. K. & Sokoloff, D. R. (199)). Learning motion concepts using real-time
micro-computer based laboratory tools. American Journal of Physics, 58 (9), 858-
867.
Trende, E. (1962). I find this works! Introducing the triangle via the unit circle.
Vinculum. 1(2), 3-4.
Vinner, S. & Dreyfus, T. (1989). Images and definitions for concept of functions. Journal
for the Research in Mathematics Education, 20(4), 21-34.
Vinner, S. & Hershkowitz, R. (1983). On concept formation in geometry. Zentralblatt fur
Didaktik der Mathematik, 15, 63-78.
Von Glasersfeld, E. (1987). Learning as a constructive activity. In C. Janvier (Ed)
Problems of representation in the teaching and learning of Mathematics (pp.3-18)
Hillsdale, N. J: Lawrence Erlbaum Associates.
Vygotsky, L. (1962). Thought and language, Cambridge MA: MIT Press.
Waits, B. & Demana, F. (1998). The role of technology in teaching mathematics.
Mathematics Teacher, 83, 27-31.
Wenger, E. (1999). Communities of practice: Learning, meaning and identity.
Cambridge: Cambridge University Press, 51-71.
Wenzelburger, E. (1992). The learning of Trigonometric functions in a graphical
computer environment. Proceedings of PME 16, 106-113.
Wertsch, J. & Stone, C. (1986). The concept of internalization in Vygotsky’s account of
the genesis of higher mental functions. In Wersch, J. (Ed) Culture, communication
139
and cognition: Vygotskian perspectives (pp. 162-179) New York: Cambridge
University Press.
White, B. (1981). Designing computer games to facilitate learning. AI-TR-619. Artificial
intelligence laboratory. Massachusetts Institute of Technology.
Williams, S. R. & Baxter, J. (1993, April). Reconstructing constructivism: The dilemmas
of discourse orientated teaching. Paper presented at the annual meeting of the
American Educational Research Association, New Orleans.
Willis, G. (1966). Trigonometry: a new approach and trig-master dial calculator.
Vinculum, 3 (5), 4-8.
Yerushalmy, M. (1998). Emergency of new schemes for solving algebra word-problems:
The impact of technology and function approach. In E. Pehkonen (Ed) Proceedings of
the 21st conference of PME, (pp.165-178) Lahti, Finland.
Yerushalmy, M. & Chazan, D. (1990). Overcoming visual obstacles with the aid of the
Supposer. Educational Studies in Mathematics, 21(3), 199-219.
Yerushalmy, M. & Schwartz, J. (1993). Seizing the opportunity to make mathematically
and Pedagogically interesting. In Romberg, Fennema Carpenter (Ed) Integrating
research on the graphical representation of functions (pp.7-14) Hillsdale NJ:
Lawrence Erlbaum Associates.
140
Appendix A: GRADE 11 LEARNERS’ UNDERSTANDING OF THE COSINE FUNCTION WITH SKETCHPAD INTERVIEW SCHEDULE 1. (a) What do you notice about the values of x and r respectively as the angle θ
ii) On the range: ___________________________________________________________________ 8) Use what you have learned to draw graphs of the following for x [0; 180] below a) y = cos x – 2
b) y = -2 cos x
45 90 135 180 225 270 315 360
−2
−1
1
2
x
y
143
Appendix B:
Relationship between cos θ and x/r
r=1
θ x/r
Cos θ
10º
20º
30º
100º
150º
200º
250º
300º
350º
r=2
θ x/r
Cos θ
10º
20º
30º
100º
150º
200º
250º
300º
350º
144
r=3
θ x/r
Cos θ
10º
20º
30º
100º
150º
200º
250º
300º
350º
r=4
θ x/r
Cos θ
10º
20º
30º
100º
150º
200º
250º
300º
350º
145
Appendix C: Participants’ thought patterns Busi:
Researcher Ok, Busi, what do you notice about the x value and the value of r as the angle θ increases?
Busi … (Silence)…. I don’t understand. They are decimals fractions. Researcher Ok, what do you notice about the x value as the angle increases? Busi x is that (pointing to the column x in the table)
Researcher Yes. Busi The angle is changing. Yeah. Ah... x changes…I see, or that is the question. Ok.
Researcher Ok, what do you notice about x value as the angle is increasing?
Busi The x value decreases, increases, decreases and then increases again. (Dragging
the radius in different quadrants, somewhat surprised that she had failed to notice
it)
Researcher What do you notice about the r value as the angle is increasing?
Busi Same
Researcher As the angle is going up?
Busi Same
Researcher Are you convinced?
Busi Yes, because the this diagram is the one for r=1
Researcher Thank you. Now what do you notice about the values of x/r and cos θ in your
table?
Busi Answer for x/r and cos θ are almost the same, only that cos θ at times is negative .
Researcher Where exactly? Busi Let me check… (Referring to the table)…Here and here. Researcher Can you be more specific? Busi I don’t understand. Researcher Ok, how about in term of quadrants? Busi I think it is negative…2 and 3. I am not very sure…Let me check again. Ok.
It’s correct. Researcher What do you think will happen to the above ratios if we increase r to 2? Busi They will increase by 2 because r value is increasing (before tables 2, 3 and 4) Researcher (After completing tables 2, 3 and 4) For any given angle, what do you notice
about the corresponding values of x/r in each table for r=2, r=3 and r=4?
146
Busi They are the same. The values of x/r in each table are the same. Researcher Why? Busi Even the graph traced remains the same, it does not change. The radius does not
affect the angle Researcher Even if r=100? Busi Yes Researcher For any r? Busi Yes (confidently) Researcher Can you say Cosine is a function? Busi Yes Researcher Why? Busi You can draw a table of values of x and y and draw a graph Researcher Are all graphs functions then? Busi Most, but this one I know it, it’s a function Researcher If cos (angle) =½ then the angle is? Busi I think is 90º Researcher Why do you say 90º? Busi I am thinking 90º, because that is the angle I know in a right triangle Researcher Do you think the question is related to the previous exercise in any way? Busi ……(silence)…Let me read again Researcher What are we talking about here? Busi So I made a mistake. Let me use the table to find the angle with ½. …There...
(pointing at 300º) Researcher Is it the only one? Busi Let me continue…. (Searching)…would be here or there…ah…no…I don’t
know. Researcher Ok, let us draw the cosine graph from -180º to 180º Busi (Enthusiastically)…. …. (Working on the computer)…There. Researcher Look carefully at the diagram. What is the domain? Busi … Domain? ….the values of x? (rhetoric)…-180º to 180º Researcher Range? Busi Range?...-1 to 1 Researcher And amplitude? Busi ..½ this...1. Researcher Period? Busi 360º. It’s easy with computer. Researcher Let us draw the graph of y=2cos x, y=½ cos x and y=-cos x on the same axes? Busi Yes. ….(Working on the computer) Researcher I would like you to check on the coefficients of cos x. 2, ½ and -1 and then check
on their effect on the original cos x you drew earlier on… (Pause)... What changes occur as the coefficient increase?
Busi It gets taller…Like the y value increases up and down. Researcher What if it decreases? Busi Yes… it decreases Researcher Now, what if the coefficient is negative, doe it have an effect on the x-intercepts?
147
Busi No Researcher And on the range? Busi No... (Pause)If we are talking about this one, but it was only one. Researcher Can you draw the graph of y=cos x, y= cos x +½ and y=cos x-1 on the same axes? Busi Yes. ….(Working on the computer) Researcher I would like you to check on the numbers being added to cos x, ½ and -1 and then
check on their effect on the graph of cos x… (Pause)... What changes occur if the number is positive, for instance ½?
Busi ……(silence)…….mmmmm…the graph goes up by the same Researcher And if negative? Busi Goes down by same…Oh yeh. Researcher What do you think about the amplitude? Busi Does not change Researcher And range? Busi No change. Researcher Use what you have learnt to do question 8 Researcher Ok (she only managed to draw one diagram which was not correct) Researcher Thank you Busi Busi Ok, it’s my pleasure!
Thabisile:
Researcher Ok, Thabisile, what do you notice about the x value and the value of r as the angle θ increases?
Thabisile …………. (Silence) …. They are all less than 1 Researcher Ok, what do you notice about the x value as the angle increases? Thabisile (Referring to the table)…. Like if this is 1.0….. 0.34… (Pointing at the
ratios)….then this increases …. Here 0.2…. 0.4 er …it’s decreasing and here increase again. So it change here and here, and here …it change 4 times….. Ya!
Researcher ….oh ….ok what do you notice about the r value? If you increase the angle Thabisile I did not change r ….it’s the same Researcher Now what do you notice about the values of x/r and cos θ in your table? Thabisile (Referring to the table)…x/r and cos θ are almost the same, only that cos θ at
times is negative Researcher Where exactly? Thabisile (Looking at the table)…I don’t understand Researcher Where are the values of cos θ at times is negative and positive, say, in terms of
quadrants? Thabisile (Looking at the table)….. I cannot say…Let me try the diagram Researcher Ok Thabisile (Dragging the radius in different quadrants) …Here…positive 1…negative
2…negative 3 and positive 4. Researcher Ok, what do you think will happen to the above ratios if we increase r to 2?
Why?
148
Thabisile (Looking at the table)…. Each figure will increase about 2….yeh because r increased.
Thabisile completed the table by increasing r to 2, 3 and 4 respectively.
Researcher For any given angle, what do you notice the corresponding values of x /r in each table for r=2, r=3, and r=4.
Thabisile (Looking at tables) …. They not the same …no let me round off… it’s the same… certain points are the same …. Three points….. It’s different because of the decimal …. Can I check this one?....(rounds off the decimal fractions for table 2)
Researcher What made you do that? Thabisile Because all these are the same … the decimal… x /r and the cosine … I wanted
to come up with the same. Researcher Ok, coming back to our question, what do you notice about the corresponding
values of y/r in each table for r=2, r=3 and r=4. Thabisile They are the same figures. Researcher Now Thabisile, if r=100? Thabisile They will be same. Researcher For any r? Thabisile Yes (smiling) Researcher Can you say Cosine is a function? Thabisile Yes Researcher Ok, good. Any reason? Thabisile But I don’t know it, can’t remember it…. Researcher …. (Long pause)…. How do you define a function? Thabisile ….No, not easy…. I don’t know. Maybe if you put one value in an equation and
then you get a value or you draw a graph. Researcher Are all graphs functions then? Thabisile Can’t say. Researcher What do you think? Thabisile (silence)……(smiling)…This one I know it Researcher Let us look at question 4. If cos (angle) =½ then the angle is? Thabisile That is 0.5 Researcher Right, Why do you say 0.5? Thabisile Because it is ½ and the decimal is 0.5. It’s difficult sir. Researcher Can your try it using the previous exercise? Thabisile (Checked her table first and located 0.5 in line with 300º)...ah... It’s easy
Researcher Is it the only angle? Thabisile … Let me check…..it’s not there but I think since these values are decreasing
(pointing at 20º and 30º) it will be there. Researcher Ok, let us draw the cosine graph from -180º to 180º Thabisile …. …. (Working on the computer)…There. Researcher Look carefully at the diagram. What is the domain?
149
Thabisile Here to here (Pointing -180º and 180º) Researcher Very good. Now what is the range? Thabisile ……. (Silence)…….mmmmm… there (Pointing -1 and 1) Is it right? Researcher Is it right (smiling)….. What do you think? Thabisile It is... Now? Researcher Now? Amplitude. Thabisile Now …… there...1 Researcher Nice, ok, Period? Thabisile …….. (Pointing it with cursor) Researcher Yes, try y=2cos x, y=½ cos x and y=-cos x on the same axes. File-New sketch. Thabisile ……. (Working on the computer)…There Researcher I would like you to check on the coefficients of cos x. 2, ½ and -1 and then check
on their effect on the original cos x you drew earlier on… (Pause)... What changes occur as the coefficient increase?
Thabisile It gets bigger here (Pointing at the range) Researcher What if it decreases? Thabisile ….er … it decreases. Researcher Now, what if the coefficient is negative, doe it have an effect on the x-intercepts? Thabisile No. Researcher And on the range? Thabisile No. Researcher Let us draw the graph of y=cos x, y= cos x +½ and y=cos x-1 on the same axes? Thabisile (Working on the computer)…There Researcher Oh….OK. I would like you to check on the numbers being added to cos x, ½ and
-1 and then check on their effect on the graph of cos x… (Pause)... What changes occur if the number is positive, for instance ½?
Thabisile It goes up …….. Researcher Negative? Thabisile Down Researcher What do you think about the amplitude? Thabisile Same. Researcher And range? Thabisile Same Researcher Use what you have learnt to do question 8 Thabisile Ok (she drew one diagram which was not correct) Researcher ….. Ok, thank you Thabisile.
150
Samkelisiwe:
Researcher Ok, Samkelisiwe, what do you notice about the x value and the value of r as the angle θ increases?
Samkelisiwe (Silence)…. Can I use the table? Researcher You want to use the table… ok Samkelisiwe They decrease as well (writes angles x and r increases) Researcher Samkelisiwe, do you think x and r are angles Samkelisiwe … (Silence)….. Er they are lines…… Researcher So what do you notice about x and r as the angle increases? Samkelisiwe (Turns to the computer) can I try? Researcher Yes you should. Samkelisiwe (Drags to make the angle larger) r value remains the same, and x value decreases,
increases, decreases and increases. Researcher Ok, Good, what do you notice about the values of x /r and cos θ in your table? Samkelisiwe (Immediately without looking at the table). They change……. As the angle
increases x /r and cos θ decrease as well…here Researcher Ok, Samkelisiwe, if you look at the question it says: what do you notice about
the values of x /r and cos θ in table 1? Which means all of them Samkelisiwe (Looking at the table, then smiling) they are the same, only that some cos θ are
negative but equal. Researcher You are smiling … why? Samkelisiwe No …... because, when you read the question over and over, then you realize
what they are really asking. Researcher What do you think will happen to the above ratios if we increase r to 2? Why? Samkelisiwe Must I try it out or just give an answer? Researcher Ok, but first, what do you think will happen? Samkelisiwe Er ….. Increase by 2. The circle is getting bigger.
Samkelisiwe then continued to complete the table by increasing r to 2, halfway through the second table, she said (surprised):
Samkelisiwe Now I realize that the x /r will still have the same ratio, because when you increase the r to 2, for example, x will increase as well.
Researcher That’s a very good observation (Samkelisiwe now completed the table by increasing r to 2, 3 and 4 respectively)
Researcher For any given angle, what do you notice about the corresponding values of x /r in each table for r =2, r =3 and 4?
Samkelisiwe … (Silence)….. They are the same. The values of x /r, in each table is the same Researcher If I find it interesting, you know, when I ask you a question on the table, you
don’t look at it to answer. Why is that? Samkelisiwe I don’t know ……. I am not sure. I assume I take it for granted. The x /r in each
table, I know, is equal from the completion of the table, I remember. They are not talking about x alone and r alone? They are not talking about the ratio. I
151
know that r is increasing, and x will increase too. Researcher So …. Samkelisiwe It will increase …. It will remain the same. The value of x /r in each table is the
same Researcher Can you say Cosine is a function? Samkelisiwe Yeah… I know that from class. Researcher Ok. Let us look at question 4. If cos (angle) =½ then the angle is? Samkelisiwe Can I use the computer? I want to check my answer first? Researcher Hmmm … Samkelisiwe ….. (Silence) …… I’ll drag the radius till I get 0.5 and then check the
corresponding angle. Researcher Ok, tell me what you notice? Samkelisiwe There it is. (Pointing at 60º) Researcher What else do you have? Samkelisiwe (Dragging the radius all the way, with a lot of scrutiny, to the fourth
quadrant)…there is the other one …300º (smiling triumphantly) Researcher Ok, let us draw the cosine graph from -180º to 180º Samkelisiwe …. …. (Working on the computer)…Ok. Researcher Look carefully at the diagram. What is the domain? Samkelisiwe -180º; 180º Researcher Range? Samkelisiwe Ya,…..-1; 1 Researcher Amplitude? Samkelisiwe Mmmmm, this (smiling)…1 Researcher Period? Samkelisiwe 360º Researcher Yes, try y=2cos x, y=½ cos x and y=-cos x on the same axes. File-New sketch. Samkelisiwe (Working on the computer)…Ok. Researcher I would like you to check on the coefficients of cos x. 2, ½ and -1 and then check
on their effect on the original cos x you drew earlier on… (Pause)... What changes occur as the coefficient increase?
Samkelisiwe Amplitude increases Researcher Yes, so and if it decreases? Samkelisiwe So will it Researcher …… (Long pause) …. Ok fine, if it is negative, any effect on the x-intercepts? Samkelisiwe The graph is upside down but no effect Researcher On range? Samkelisiwe Ya ….. Ya. Researcher Let us draw the graph of y=cos x, y= cos x +½ and y=cos x-1 on the same axes? Samkelisiwe Ok…(Working on the computer) Researcher I would like you to check on the numbers being added to cos x, ½ and -1 and
then check on their effect on the graph of cos x… (Pause)... What changes occur if the number is positive, for instance ½?
Samkelisiwe It goes up. Researcher Ok …. If negative?
152
Samkelisiwe Down Researcher What do you think about the amplitude? Samkelisiwe ……. (Silence)…… it will not stay the same. (Measuring from x-axis) Researcher Do you take it from x-axis all the time or what is it? Samkelisiwe No…half this (pointing at the range)…so there it is no effect. Researcher On range? Samkelisiwe No Researcher Yes. Use what you have learnt to do question 8 Samkelisiwe Ok. (she drew 2 diagrams, 1 was correct and the other partially correct) Researcher Ok Thank you. Samkelisiwe Ok, thanks.
Noxolo:
Researcher Ok, Noxolo, what do you notice about the x value and the value of r as the angle θ increases?
Noxolo I don’t understand Researcher Ok, what do you notice about the x value as the angle increases? Noxolo x is that (pointing to x in the table) Researcher Yes Noxolo They are all less than 1 and when the angle increases value of x and r decreases. Researcher Ok, now, what do you notice about the x value as the angle increases? Noxolo x value? Increasing or decreasing? Researcher You must tell me, what do you notice the x value as the angle is increasing? Noxolo As the angle is going up or down? Researcher As the angle going up.(There was a total communication breakdown) Noxolo Can I check it from diagram? Researcher Yes Noxolo So this is x Researcher Yes Noxolo So when it goes up (dragging point up), the x value is decreasing. Researcher What do you notice about the r value? Noxolo The r value as the angle increases? Researcher As the angle increases Noxolo (Working on the computer) stays the same. When the angle increases r stays the
same Researcher What do you notice about the values of x/r and cos θ in your table? Noxolo They are equal. Only that cos θ is negative from here to there. (pointing at values
in the table) Researcher What do you think will happen to the above ratios if we increase r to 2? Why? Noxolo The x/r will increase to 2. If θ =10º then to x/r will be 2.95 because we added 2
before it was 0.95 Researcher Ok, complete the tables for r=2, 3, and 4
153
Noxolo (Works on the computer) Researcher What do you think will happen to the above ratios if we increase the value of r?
Why? Noxolo What I notice is that it starts with a value 0, 1 and end with 0, 1 that I notice
about r = 2, r=3, and r=4. Researcher I see 1.0 in your table Noxolo Sorry, 1.0 Researcher So for any given angle, what do you notice about the corresponding values of x/r
in each table for r=2, r=3 and r=4? Noxolo As x/r increases the value of cosine θ increase with it. Researcher So the x/r for each angle? Noxolo They don’t increase by much. Researcher Do you think cosine θ is a function? Noxolo Ya. It could be. It is... I know it Researcher In no.4 it says answer the following question if cos (angle) =½, then the
Angle = ? Noxolo Must I change it to decimal? 0.5 Researcher Then the angle = 0.5? Noxolo Er ….. (Silence)….. If cos is half ….. Then the angle …… you are asking how
many degrees the angle will be? Researcher Are we talking about length or angle? Noxolo No we are talking about a fraction ……. So ……you can say ½ =0.5 so will give
you cos 0.5 Researcher Can θ be in 0.5? Noxolo Ya. Researcher x and r represent length or angles? Noxolo Length Researcher So? Noxolo r is the hypotenuse? Can I use the Pythagoras Theorem? Researcher What do you think? Noxolo Yes, you use Pythagoras to find the hypotenuse, but I don’t remember…..
(silence) Researcher Can you use Pythagoras to find an angle of a right angled triangle, given the
hypotenuse and another side? Noxolo Our teacher showed us how to find the hypotenuse; he did not show us how to
find an angle. Researcher Ok. Can you please read the question again, slowly? Noxolo I have to find an angle! Oh so no … (silence)….. (Thinking)….. There could be a
way of doing it, but I don’t know Researcher What do you think? Noxolo I can’t do it. Researcher Ok, all right Noxolo…. That was interesting Noxolo It was bad Researcher It was bad? It happens Noxolo Because I didn’t get the answer
154
Researcher Ok, let us draw the cosine graph from -180º to 180º Noxolo Fine. (Works on the computer) Researcher Look carefully at the diagram. What is the domain? Noxolo ….. (Long silence) ……….(thinking)……can’t ….I don’t know Researcher ……. (Long pause)……Ok… What if I tell you it is from where your graph
begins to where it ends along the x-axis Noxolo Then this will be it (showing -180º to 180º) Researcher Right, thank you. Now what do you think will be the range? Noxolo This? (point at it) Is that what you are asking? Researcher Yes Noxolo We are talking about Y. It is here and here (pointing at -1 to 1) Researcher And amplitude? Noxolo ½?...1 Researcher Period? Noxolo Ok, it is this (pointing at the period with the cursor) Researcher Yes, try y=2cos x, y=½ cos x and y=-cos x on the same axes. File-New sketch. Noxolo Ok. (Works on the computer) Researcher I would like you to check on the coefficients of cos x. 2, ½ and -1 and then check
on their effect on the original cos x you drew earlier on… (Pause)... What changes occur as the coefficient increase?
Noxolo Coefficient? Researcher Yeah Noxolo Er ….. (Silence)….. What is coefficient of cos x? Researcher The number multiplying it Noxolo (Checking on the computer)…..mmmmm, it goes up. It gets bigger, taller I mean Researcher If it decreases? Noxolo Becomes smaller Researcher If negative? Noxolo It was like this (showing using a hand) and now this Researcher Yes. Any effect on the x-intercepts? Where it cuts the x-axis? Noxolo Ok. No Researcher On range? Noxolo (looking at the graph) No. Researcher Let us draw the graph of y=cos x, y= cos x +½ and y=cos x-1 on the same axes?
Remember to go to File, and then New sketch Noxolo Ok. (Works on the computer) Researcher I would like you to check on the numbers being added to cos x, ½ and -1 and
then check on their effect on the graph of cos x… (Pause)... What changes occur if the number is positive, for instance ½?
Noxolo It goes up Researcher If negative? Noxolo It goes down Researcher What do you think would be the effect on the amplitude? Noxolo No effect Researcher On range?
155
Noxolo Nothing. It is the same Researcher Yes. Use what you have learnt to do question 8 Noxolo Ok. (she drew 2 diagrams, 1 was not correct and the other partially correct) Researcher Yes ….. thank you Noxolo Noxolo Thank you.
Thandeka:
Researcher Ok, Thandeka, what do you notice about the x value and the value of r as the angle θ increases?
Thandeka It is decreasing Researcher You mean the x value and the value of r? Thandeka No, because I won’t be able to move the radius up and down Researcher Ok. What do you notice about the values of x/r and cos θ in your table? Thandeka (Immediately without looking at the table). They change……. As the angle
increases x /r and cos θ decrease as well…here Researcher Is it like that through-out the table? Thandeka At times they increase and like here cos θ value is negative but are the same. Researcher Ok, you are happy with your answer? Thandeka Ok Researcher What do you think will happen to the above ratios if we increase r to 2? Why? Thandeka They increase because r will increase Researcher Go to No. 3…. What do you think will happen to x /r and cos θ if we increase the
value of r? Why? Thandeka Same. Because you only change the circle. Researcher If r=π? Will it be still the same? Thandeka ….. (silence) Ya it will. Researcher Do you think cos θ is a function? Thandeka Ya it is Researcher Ok, Thandeka, now for number 4.answer the following questions: if cos (angle) =
½, then angle = Thandeka 60º Researcher How did you get it? Thandeka I used my calculator. I prefer to use the computer. I have to check my answer
again. I am not sure. There it is. (Pointing at the diagram indicating 60º) Researcher Is it the only one? Thandeka There could be 2 or more. Let me just find out. There is the other one …so they
are 2 Researcher Ok, let us draw the cosine graph from -180º to 180º Thandeka Ok. (Works on the computer) Researcher Look carefully at the diagram. What is the domain? Thandeka This? Researcher Yes
156
Thandeka -180º to 180º Researcher Range? Thandeka -1 to 1 Researcher Amplitude? Thandeka ….. (silence) Ya it will be 1. Researcher Why (Explain or justify your reasoning.) Thandeka Because it is half this (indicating with the cursor). Researcher And the period? Thandeka Here to there. Researcher Write it in your answer space Thandeka ….. (silence) ….(she wrote 360) Researcher Yes, try y=2cos x, y=½ cos x and y=-cos x on the same axes. File-New sketch. Thandeka Alright. (Works on the computer) Researcher I would like you to check on the coefficients of cos x. 2, ½ and -1 and then check
on their effect on the original cos x you drew earlier on… (Pause)... What changes occur as the coefficient increase?
Thandeka Y increases Researcher Right. If it decreases? Thandeka Y decreases Researcher Hmmmm….Any effect on the x-intercepts if it is negative? Thandeka No Researcher On range? Thandeka No Researcher Let us draw the graph of y=cos x, y= cos x +½ and y=cos x-1 on the same axes?
Remember to go to File, and then New sketch Thandeka Ok. (Works on the computer) Researcher I would like you to check on the numbers being added to cos x, ½ and -1 and then
check on their effect on the graph of cos x… (Pause)... What changes occur if the number is positive, for instance ½?
Thandeka It moves up positive for y Researcher If negative? Thandeka It moves down negative for y Researcher Any effect on amplitude? Thandeka No Researcher On range? Thandeka No Researcher Yes. Use what you have learnt to do question 8 Thandeka Ok. (she starred on the blank paper for quite some and then shook her head) I
can’t Researcher Ok, good, thank you very much Thandeka Ok. Thank you.
157
Bongekile:
Researcher Ok, Bongekile, what do you notice about the x value and the value of r as the angle θ increases?
Bongekile When the angle θ increases, values of x and r decrease. Researcher Look at one value at a time Bongekile (Checking the table)… stays the same. When the angle increases r stays the
same. Only x decreases, increases, decreases, and increases again Researcher Ok. What do you notice about the values of x /r and cos θ in each table? Bongekile Mmmmm, it’s like they are equal….it is not exactly the same; some are exactly
the same …. But some like below or above the value and some cos θ are negative but it’s like the same
Researcher What do you think will happen to the above ratios if we increase r to 2? Why? Bongekile Mmmmm, the ratios will be more than what they are. The x /r for example will
be, if θ =10º - x /r will be 2.95 cm because we added 2, before it was 0.95cm. The circle will increase so the answers for the ratios will increase the total degrees will get bigger by 2; x/r will get bigger
Researcher For any given angle, what do you notice about the corresponding values of x /r in each in each table for r= 2, r=3 and r=4?
Bongekile (After completing the table 2)… won’t it be the same? …because every time I hold it to 10º for example, I notice both values are the same. (Bongekile now completed the table by increasing r to 2, 3 and 4 respectively) The values are similar; it’s either one below one above.
Researcher Do you think cos θ is a function? Bongekile (Silence)….. Yeah it is. Researcher Ok, Bongekile, now for number 4.answer the following questions: if cos (angle)
= ½, then angle = Bongekile ½? ½. Researcher Why? Bongekile These are the same (pointing to x /r and cos θ in the table), so this will be the
same too. Researcher You happy with the answer? Bongekile You want angles, degrees? …. 50º, coz it’s half. (She must have been thinking of
%) Researcher What about 0.55? Bongekile It is 55. Researcher Ok ….. Bongekile (smiling) I am not too good at Maths. Researcher That’s Ok, just tell me what you are thinking, it’s not a test. Bongekile I am not sure, maybe, er….. θ is not 50 Researcher So you know θ is not 50? Bongekile (smiling), but I don’t know what it should be………..I have no idea what to do Researcher
You have no idea what to do? Ok…..
158
Bongekile I know it is not right. .. I’ll just guess anything ….. this is ½ and this is 0.55 (pointing at figures in the question), then, this is ½ or it will be 0.5
Researcher
So what you think it will be?
Bongekile It looks small……. I mean it looks too small for an angle, so I will go with 50 and this one will be 55.
Researcher
Ok, thank you. Let us draw the cosine graph from -180º to 180º
Bongekile Ok. (Works on the computer) Researcher
Look carefully at the diagram. What is the domain?
Bongekile This? Researcher
Yes
Bongekile -180º to 180º Researcher
Range?
Bongekile -1 to 1 Researcher
Amplitude?
Bongekile 1. Researcher
And the period?
Bongekile This. (Indicating with the cursor, correct one, even though she had 180º written). Researcher I would like you to check on the coefficients of cos x. 2, ½ and -1 and then check
on their effect on the original cos x you drew earlier on… (Pause)... What changes occur as the coefficient increase?
Bongekile The range increases Researcher Right. If it decreases? Bongekile Decreases Researcher Any effect on the x-intercepts if it is negative? Bongekile No Researcher On range? Bongekile Yeah Researcher Let us draw the graph of y=cos x, y= cos x +½ and y=cos x-1 on the same axes?
Remember to go to File, and then New sketch Bongekile Ok. (Works on the computer) Researcher I would like you to check on the numbers being added to cos x, ½ and -1 and then
check on their effect on the graph of cos x… (Pause)... What changes occur if the number is positive, for instance ½?
Bongekile It moves up Researcher If negative? Bongekile It moves down Researcher Any effect on amplitude? Bongekile No
159
Researcher On range? Bongekile No Researcher Yes. Use what you have learnt to do question 8 Bongekile Ok. (she came up with 2 correct diagrams with minimal errors) Researcher Ok, good, thank you very much Bongekile Bongekile Ok. Thank you, sir.