63
b y S a r a M a ste rs , M E d , M S IS C o m p u ti n g W o rk s h o p
| Date post: | 29-Apr-2019 |
| Category: |
Documents |
| Upload: | phungtuong |
| View: | 213 times |
| Download: | 0 times |
by Sara Masters, MEd, MSIS
Computing Workshop

AbstractIn a month-long annual Computing Workshop, an autistic HS
student was inspired by GIS to teach others and to pursue GIS studies, which will lead him to more advanced math courses than was previously expected.The first year, he began GIS and quickly understood its spatial dimensions and how it integrates many facts into visual images. As an autistic person, visual imagery is inherently important, sometimes eclipsing verbal communication. That summer and the next, he spent about 4 hours a week for several weeks learning GIS and was inspired to design a PowerPoint that neatly taught another special education student. Besides inspiring socialization and purpose in life, it specifically led him to consider taking an upward path in math, continuing with the second Algebra course in a series instead of dropping into the lowest math—only because he learned it was necessary if he wanted to continue with GIS studies.

Contents
-Visual / Spatial Learners-GIS and Spatial Skills-Implementing GIS
Using GIS to lead visual learners toward math and science careers
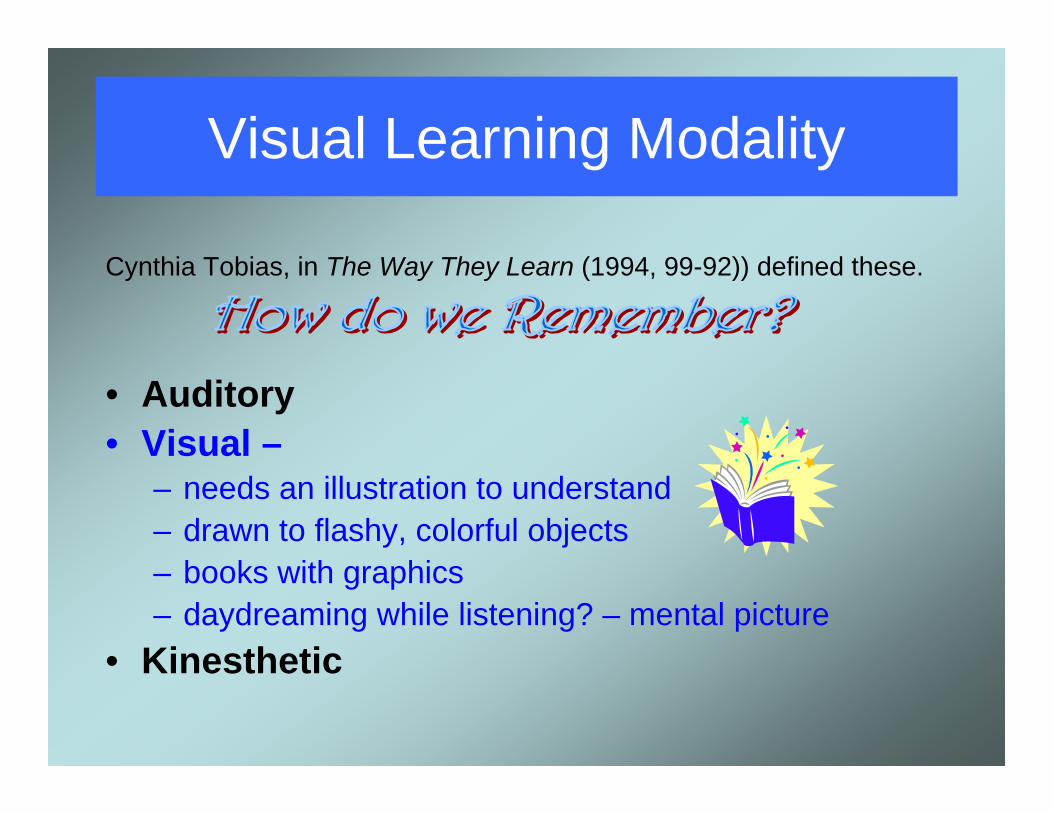
Cynthia Tobias, in The Way They Learn (1994, 99-92)) defined these.
• Auditory• Visual –
– needs an illustration to understand– drawn to flashy, colorful objects– books with graphics– daydreaming while listening? – mental picture
• Kinesthetic
Visual Learning Modality
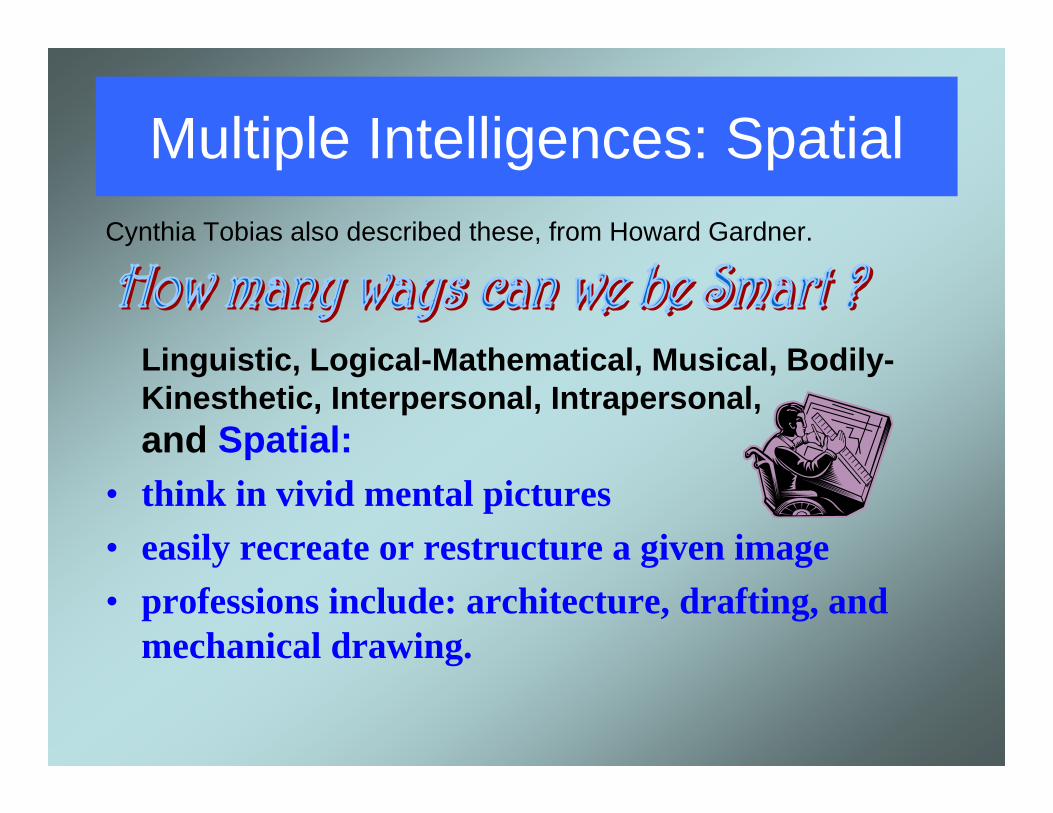
Cynthia Tobias also described these, from Howard Gardner.
Linguistic, Logical-Mathematical, Musical, Bodily-Kinesthetic, Interpersonal, Intrapersonal, and Spatial:
• think in vivid mental pictures• easily recreate or restructure a given image• professions include: architecture, drafting, and
mechanical drawing.
Multiple Intelligences: Spatial

- Giving these learners an explanation usingwords often fails
Tobias (152) says: “Many students who are struggling in school simply have learning styles that are incompatible with the structure of the traditional classroom and academic demands.”
+ On the other hand, aVisual/Spatialoverview of the whole picture may trigger spontaneous understanding
Learning modality or disability?
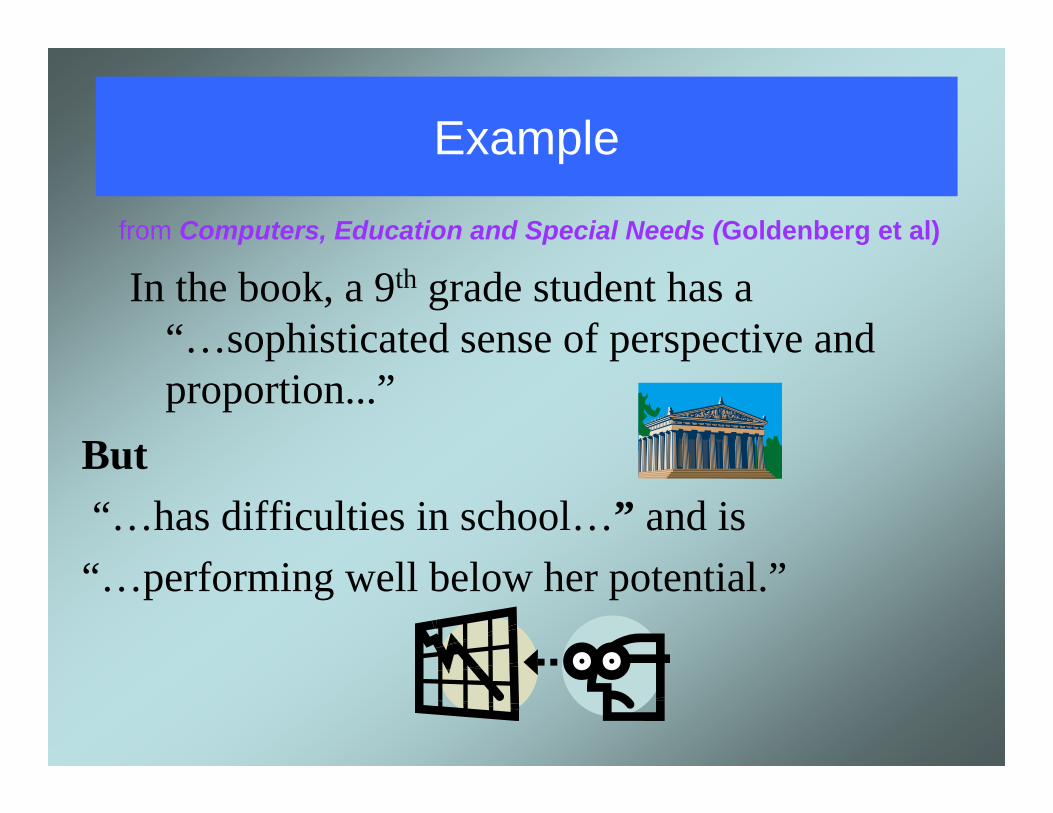
Example
In the book, a 9th grade student has a “…sophisticated sense of perspective and proportion...”
from Computers, Education and Special Needs (Goldenberg et al)
But“…has difficulties in school…” and is“…performing well below her potential.”
Case Study – 9th grade student
While work in mathematics is considered ‘borderline,’ “She almost always answered questions about length and angle correctly.”

Visual /Spatial Learner
606
360__
360==
sidesofnumber
Formula
Question:How many degrees in one interior angle of this equilateral figure ?
Answer: 60 degrees

Visual /Spatial Learner
606
360__
360==
sidesofnumber I could just tell it was 60.
Formula Visual
Question:How many degrees in one interior angle of this equilateral figure ?
Answer: 60 degrees
or
Some students are visual/spatial:Learning disabilities, Autistic spectrum. Artistic abilitiesBelittle themselves for not being smart Avoid math classes: No wonder. They’re placed in the most boring math classes, with no elegant shortcuts.
Math or Not?
Predicament:Unknown Math Potential Hidden
by Their Appearance!1. Not allowed to use computer labs, and2. Placed in lowest math tracksPerhaps Due to:• Slurred words• Lack of self-confidence• Unusual way of speaking• Won’t look people in the eye (autistic)• Distaste for words and equations, preferring
visual
Predicament:Unknown Math Potential Hidden
by Their Appearance!Problems Specific to Autistic Spectrum, in
different degrees:• No ability to take others’ perspective (a Theory
of Mind deficit)• Turn taking• Issues with the abstract• Visual learning instead of verbal lectures• Memory retention• Echolalia (repeating words)• Difficulty planning ahead

Engage these students with the visual then draw them toward standard, textual notation
Convey value of using text and numbers
GIS is a great medium for this!
Change the Curriculum:• Adjust learning modalities; speed up learning• Various needs, struggles • Goal – get them to successful careers.
• Many students with learning disabilities are visual learners.
• Autistic – visual + high math scores• I also notice that my online Art school
students – can do math, but have low self-esteem

Curriculum:
• Use a Visual mode, such as a game which designs Bridges, but demand measurement (or the Bridge will fall down!)
• Trick them into using their hidden Math abilities
GIS and Spatial Skills
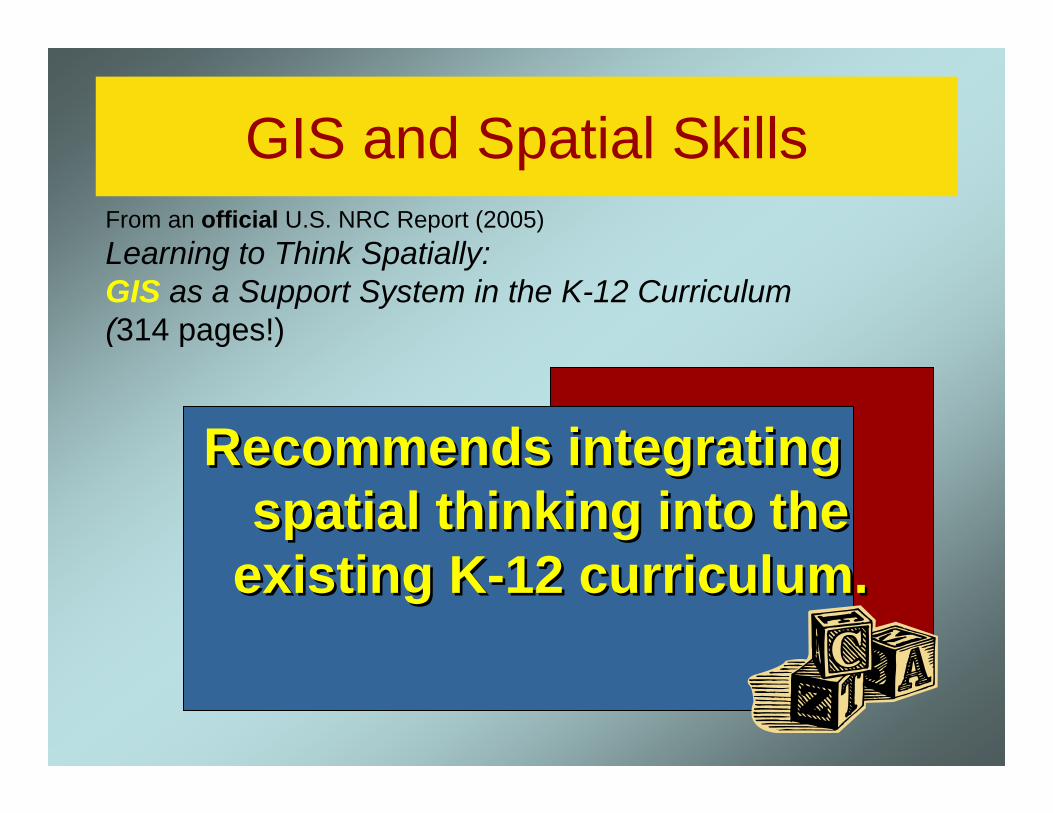
Recommends integrating spatial thinking into the
existing K-12 curriculum.
Recommends integrating spatial thinking into the
existing K-12 curriculum.
From an official U.S. NRC Report (2005)Learning to Think Spatially: GIS as a Support System in the K-12 Curriculum (314 pages!)

Spatial Thinking
“Spatial thinking is a skill used in everyday life, the workplace and science to solve problems using concepts of space, visualization,
and reasoning...”
“Spatial thinking is a skill used in everyday life, the workplace and science to solve problems using concepts of space, visualization,
and reasoning...”
Their examples
Spatial Thinking
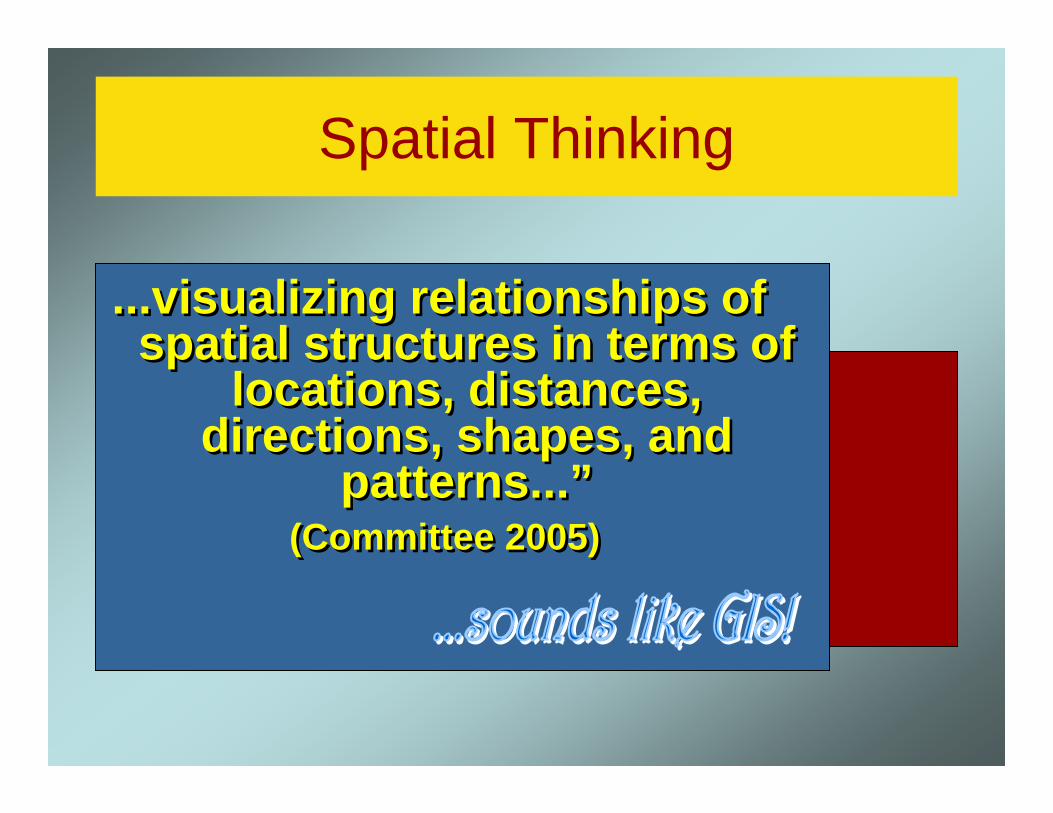
...visualizing relationships of spatial structures in terms of
locations, distances, directions, shapes, and
patterns...”(Committee 2005)
...visualizing relationships of spatial structures in terms of
locations, distances, directions, shapes, and
patterns...”(Committee 2005)

GIS and Spatial Skills
Spatial skills have long been linked to math and science abilities.
For instance, Elizabeth Fennema, (GEMS speech, 2002) said,
“We found that ... spatial visualization is positively correlated with mathematics achievement “

GIS and Spatial Skills
GIS is:-visually compelling-linked to accurate factual data
“GIS is a teaching tool that faculty can use to help students visualize complex spatial relationships in many disciplines.”
--July 2006 ArcUser, Ann Johnson

Capture their imagination
How can we capture the student’s imagination, while developing spatial abilities, navigation, and accurate measurement? Maybe VR, video games, CAD...?
Through GIS, visual /spatial learners can be influenced to learn more about math and science.
Implementing GIS
My opinion: • Allow students to work through the GIS
tutorials provided with the software, with minimal support in an open lab. An example follows.
• Create more lesson plans and curriculum integrated with other subjects.

GIS is inspirational
Autistic HS student learned math through GIS and now pursues GIS studies
*Photo by Mary Hart

Conclusion
GIS opens up new possibilities, expanding mathematical horizons for Special Needs and others.
Conclusion
Give them one-on-one experiences, where they can pursue their particular bent. If they are attracted to the visual layers of GIS and have hidden math abilities, finding success in an occupation would save the country millions of dollars (vs. welfare) and bring purpose and happiness to their lives.
Conclusion
As the student learns GIS, he/she will most likely gain confidence and TAKE MORE MATH and SCIENCE, which this country needs!
A student’s historyIn 2005, the author tutored a 9th grade Special Needs
student, using Cognitive Tutor: Algebra I (software and book) in order to make his return to public schooleasier for him. He had been in a special needs school for years.
He also studied GIS with the author, using tutorials from the book Getting to Know ArcGIS Desktop, 2nd edition, an ESRI book by Ormsby, Napoleon, Burke, Groessl, and Feaster. Because of his autism, he caught on quickly to the visual style of GIS and was very enthusiastic about it. For both combined, we spent about 4 to 8 hours/week together for 4 weeks.
As he wanted to become a teacher, he began to create a PowerPoint that would teach GIS to others. He designed everything himself. I showed him how to create screen shots, but he completed them himself and decided exactly what to put on each slide.
A student’s history - 2The second year, 2006, the author tutored him
again for several weeks of the month-long workshop. This included GIS and designing simple virtual reality environments and characters.
We were pleased to hear that he had completed the Algebra I course successfully with a B, during the intervening school year. Unfortunately, his family viewed his future as dim, so they were pushing him into the Business Math track, dropping Algebra II.

A student’s history - 3Wonderfully, the now 10th grade student began to ask
about how he could achieve a career in GIS. I showed him GIS career advice:
Careers in GIS --http://www.gis.com/jumppages/homepage/career1.html
Then we began to look at GIS majors at the college he is hoping to attend. When he discovered that a high level of math was required, he began to get excited about following a higher track of math, including Algebra II, which was reasonable, since he had passed Algebra I with a B. Suddenly, the possibilities for his life were set on a different course!

Description of WorkshopThe Computing Workshop for Special Needs Students is a
month-long, annual event that opens up career and educational opportunities for secondary level special needs students who have cognitive differences such as autistic spectrum disorder, mental retardation, and learning differences that otherwise block them from pursuing their computer interests (such as digital image editing, photography, animation, web design, programming, and virtual reality). Students are tutored one-on-one and in small groups. Social interaction and innovation are encouraged.
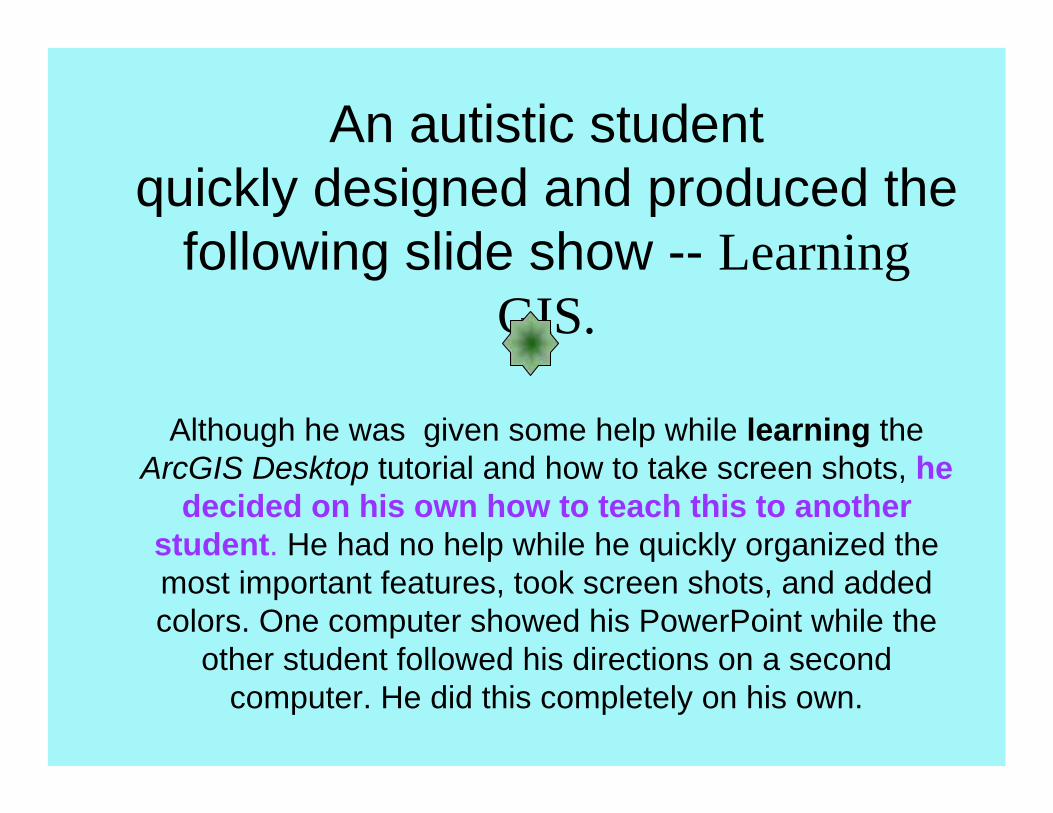
An autistic student quickly designed and produced the
following slide show -- Learning GIS.
Although he was given some help while learning the ArcGIS Desktop tutorial and how to take screen shots, he
decided on his own how to teach this to another student. He had no help while he quickly organized the most important features, took screen shots, and added colors. One computer showed his PowerPoint while the
other student followed his directions on a second computer. He did this completely on his own.

After learning GIS, he wrote: “I was on this career site and I was searching and I saw
this career that looked interesting. It was calledGIS specialist. It looked interesting because I like maps and computers, so I figure this career is perfect for me.
I am taking courses at my High School to help me get ready for this career. The courses I am taking are CAD (Computer Aided Drafting), and some other computer classes that I forget at the moment...
My second career choice if I can’t be in GIS is a sports writer.”
Intro to Slide Show - 2

Acknowledgments• I would like to thank Mary Hart for co-founding
the Computing Workshop for Special Needs Students, and allowing creative freedom and encouraging hope, for faculty and students in her annual workshop, and
• Friends and family, including Dan Ritchie, Chip McCormick, Noboru Matsuda, and Peter Brusilovsky for good advice on this Presentation, and
• ESRI for inviting me here.
Appendix A:Student slide show
“Teaching GIS”
Learning GIS 9.1
By *name omitted*2006

GIS LinksGIS video
http://www.gis.com/index.html
Learn GIS
careers IN GIS
http://www.gis.com/careers/geospatial_career.html

Opening a Map
1. Go to Start/Programs
2. Open ArcGIS
3. Go to ArcMap

Choose “Existing Map” and“Browse for maps”

Choose a ChapterCh 3Choose
C:\GTKArcGIS\Chapter03Click ex03a.mxd

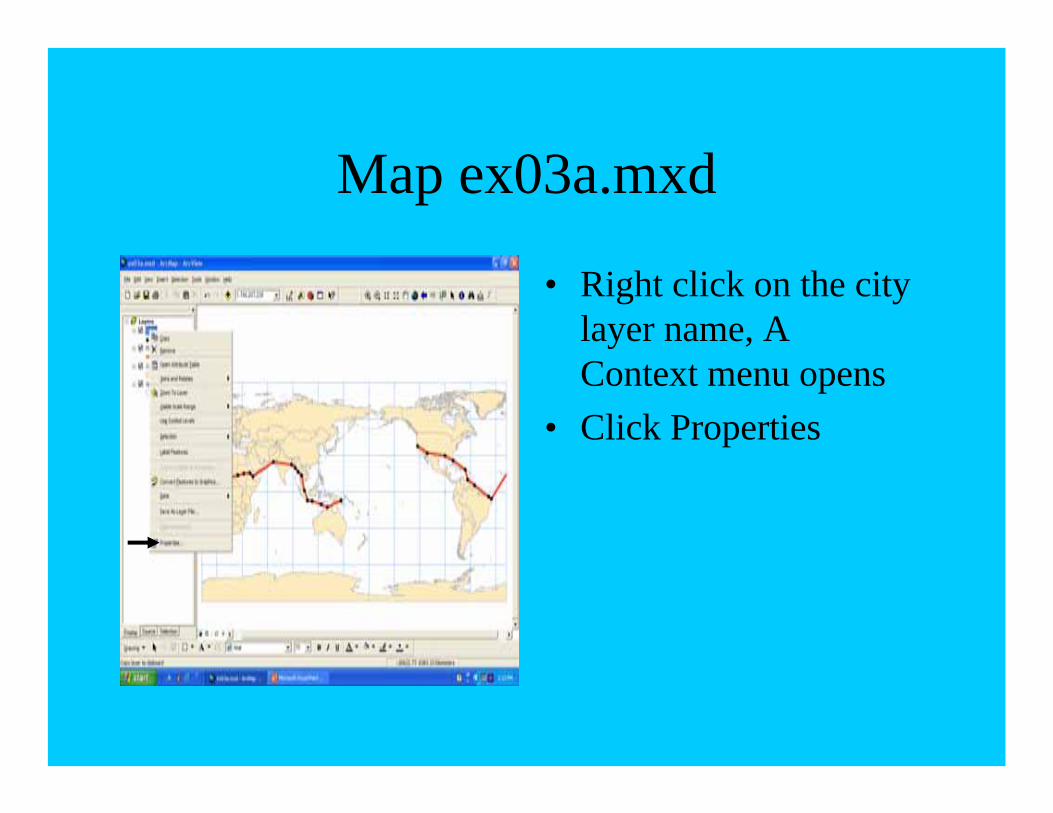
Map ex03a.mxd
• Click on the check box next to the countries layer to make it disappear

Map ex03a.mxd
• Click the Countries checkbox to make it reappear
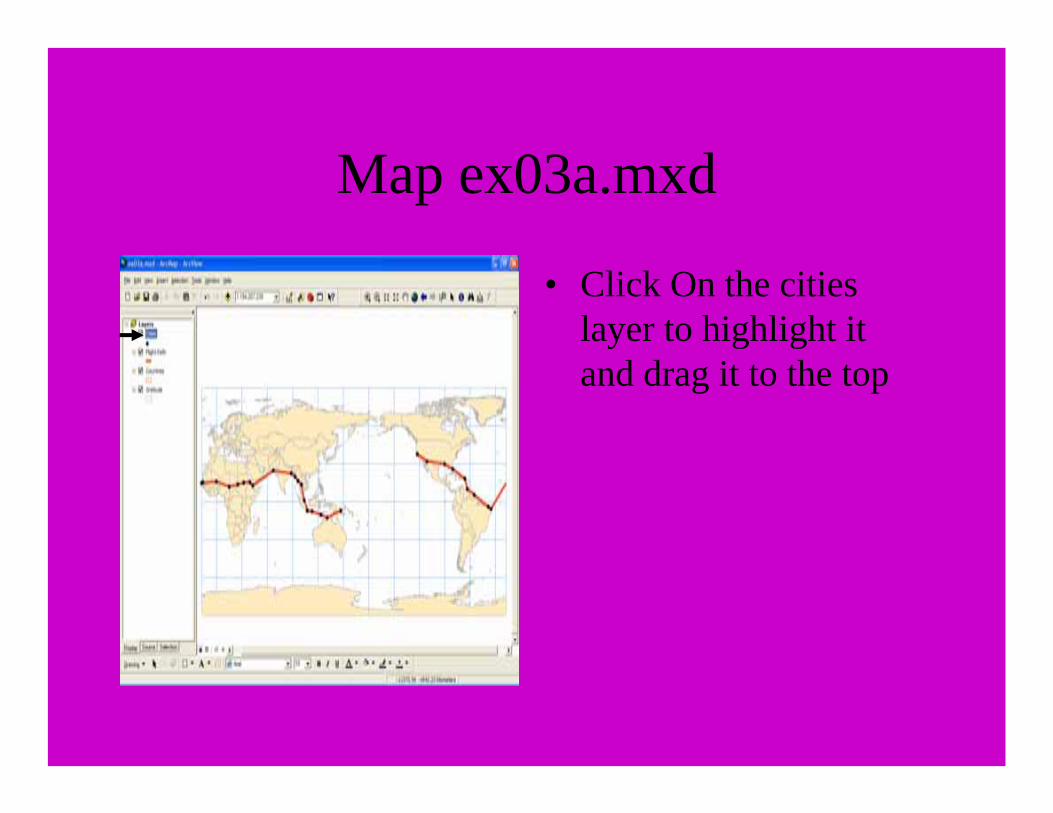
Map ex03a.mxd
• Click On the cities layer to highlight it and drag it to the top
Map ex03a.mxd
• Right click on the city layer name, A Context menu opens
• Click Properties

ToolsZoom In
Zoom Out
Fixed Zoom InFixed Zoom OutPanFull Extent
information
Previous ExtentNext Extent
Select Features
Select Elements
FindMeasure
Hyperlink
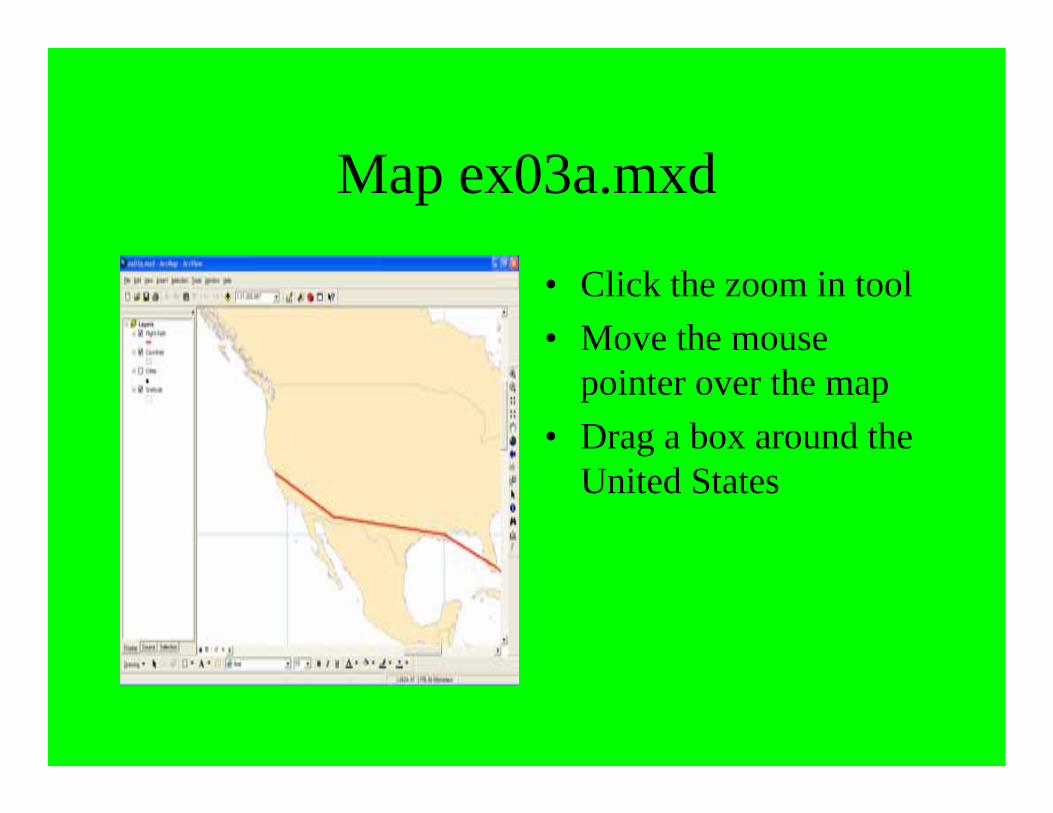
Map ex03a.mxd
• Click the zoom in tool• Move the mouse
pointer over the map• Drag a box around the
United States

Map ex03b.mxd
- After Map ex03b opens click the zoom in tool- Place the box over
Southeast Asia- Click on the PAM tool- Drag the display left to
follow the flight path
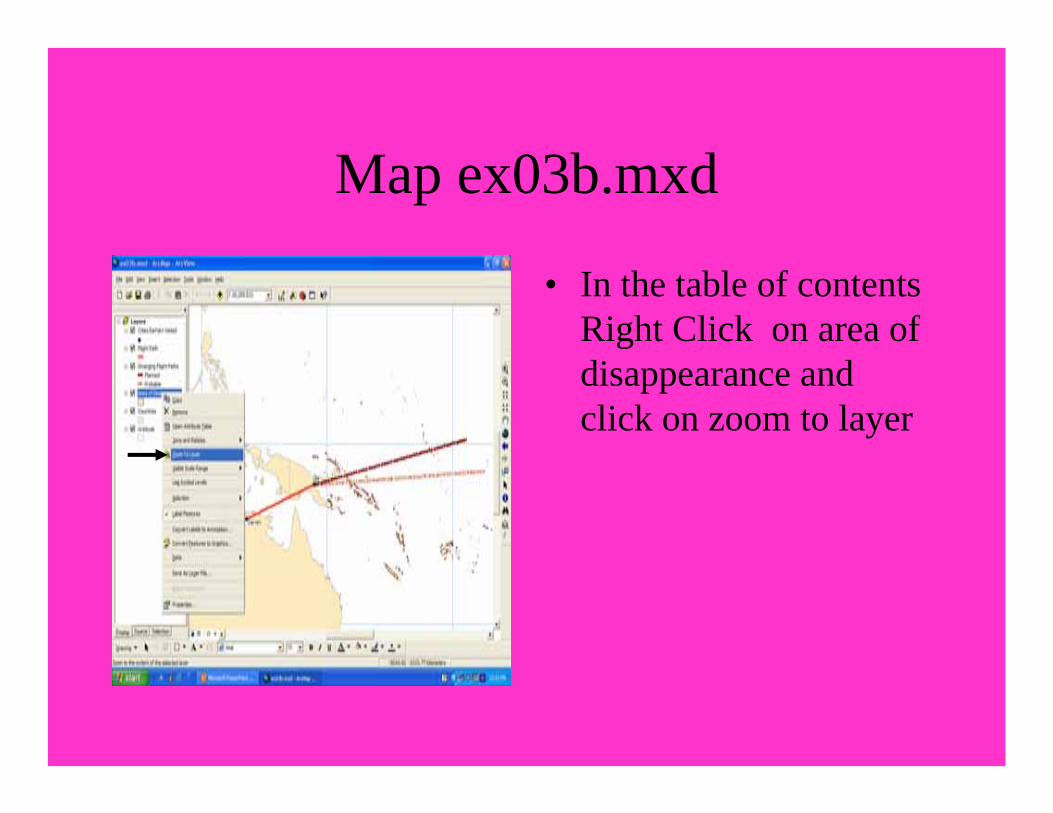
Map ex03b.mxd
• In the table of contents Right Click on area of disappearance and click on zoom to layer

Map ex03b.mxd
• On the tools toolbar,click the zoom in toolbar.
• On the map Draw a rectangle that includes the ends of both flight paths.

Map ex03b.mxd
• Click the view menu• Point to bookmarks • Click Create
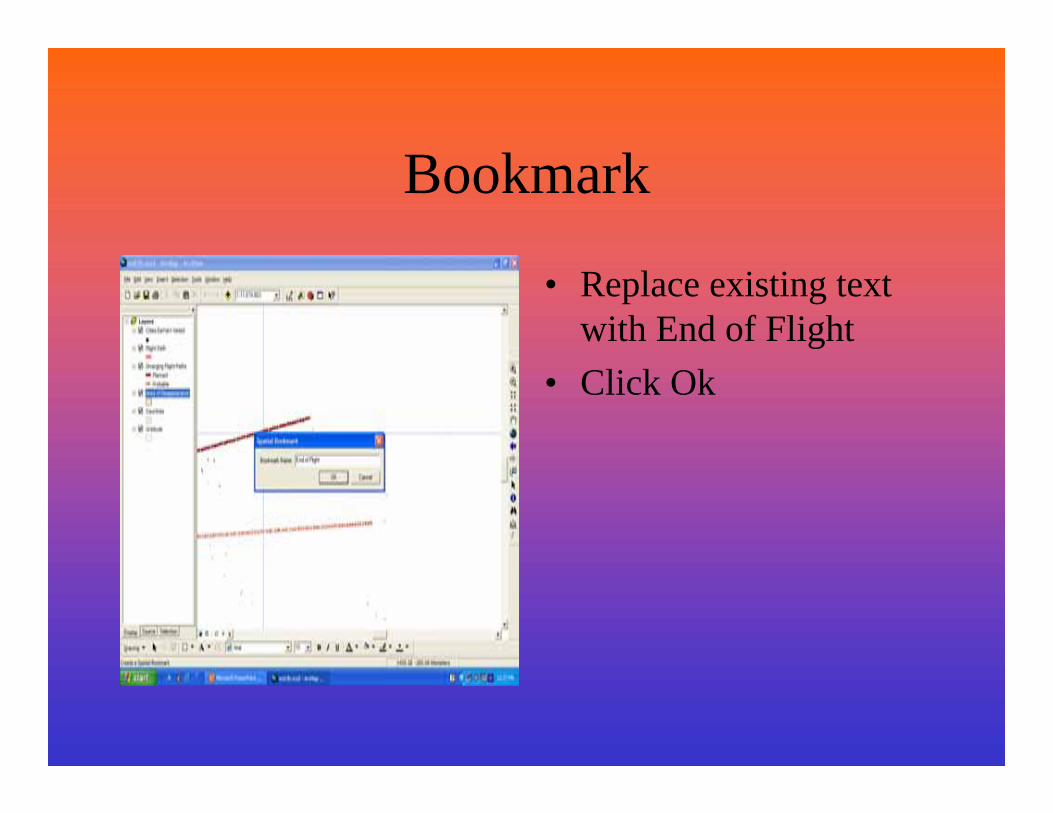
Bookmark
• Replace existing text with End of Flight
• Click Ok

Bookmark
- Go to View- Click Bookmarks- Click Howlard Island

Bookmark
• Again Go to View• Click Bookmarks• Click Nikumaroro
Island
Bookmark• Click View• Click End of Flight

Map ex03c.mxd
• In the Table of Contents Right click on cities Earheart visited
• Click on Attributes table

Map ex03c.mxd
• Place the mouse pointer on the vertical black bar between the name and capital
• Drag the curser to the left
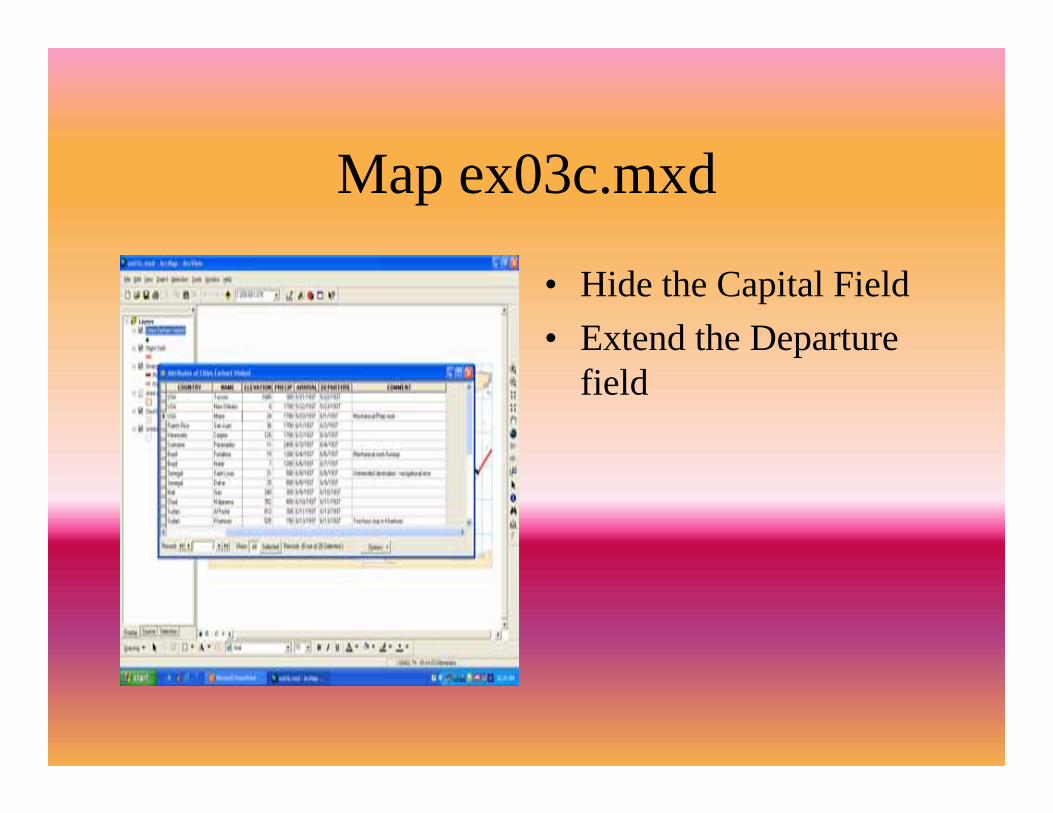
Map ex03c.mxd
• Hide the Capital Field• Extend the Departure
field
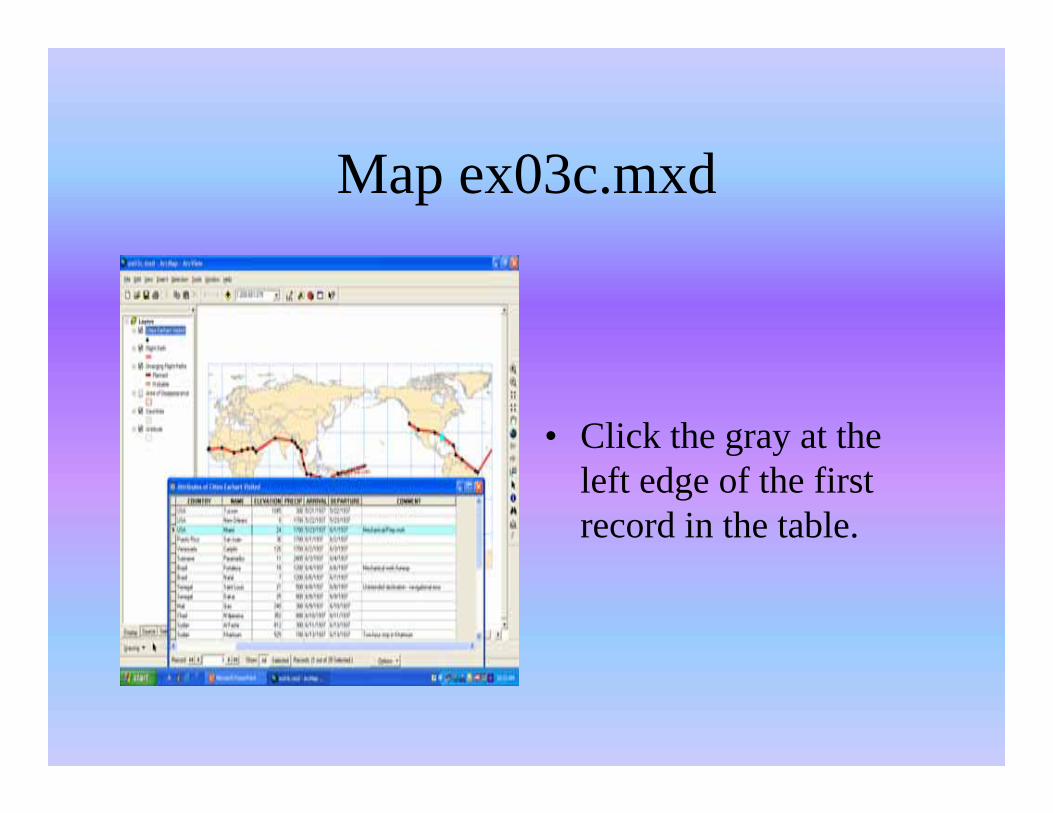
Map ex03c.mxd
• Click the gray at the left edge of the first record in the table.
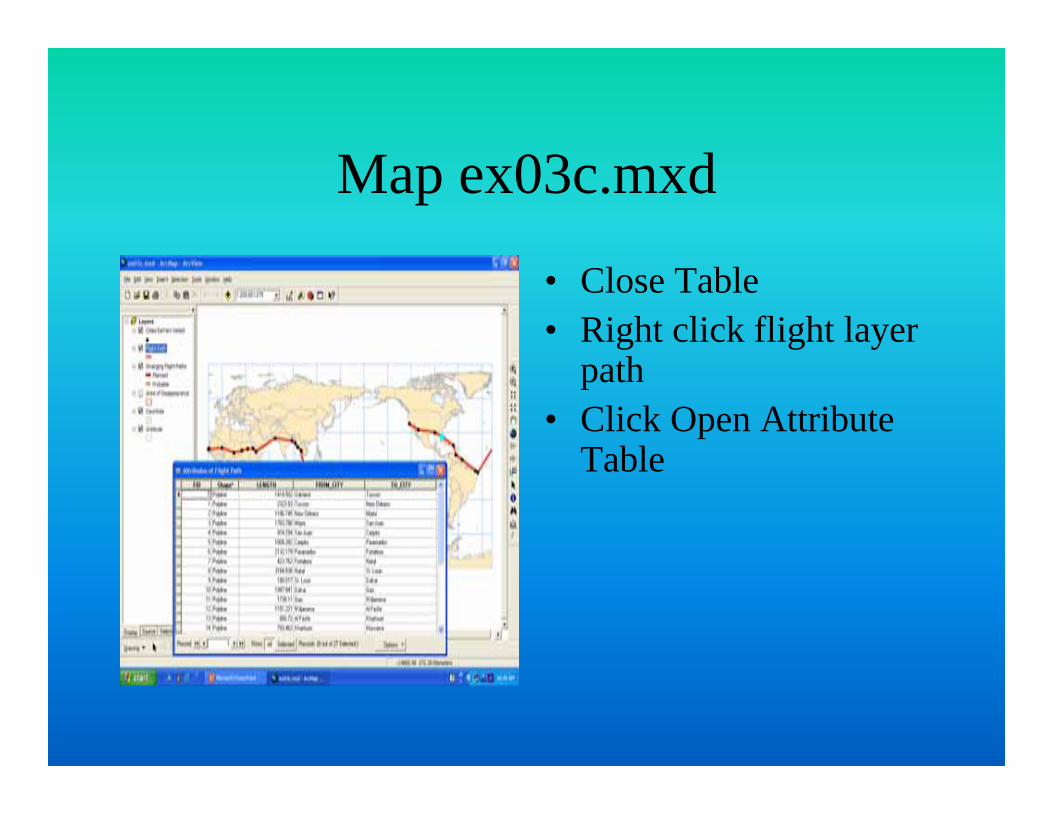
Map ex03c.mxd
• Close Table• Right click flight layer
path• Click Open Attribute
Table
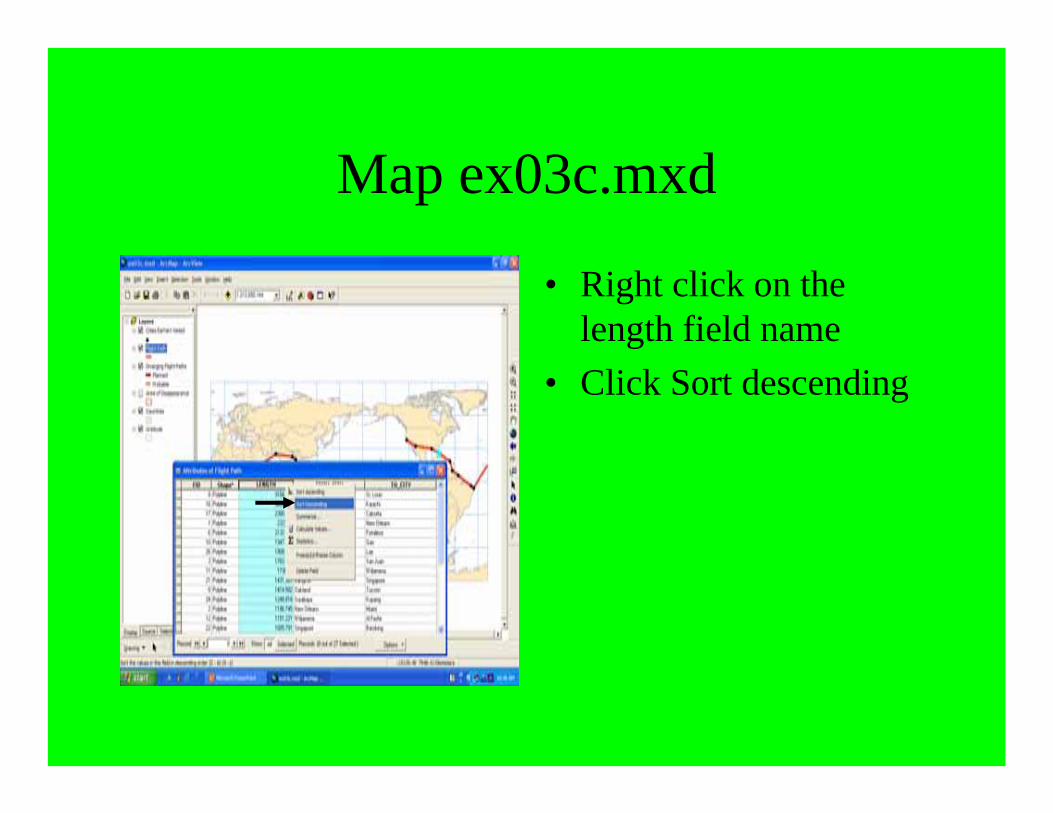
Map ex03c.mxd
• Right click on the length field name
• Click Sort descending
End Notes
• Screen shots in the student’s Slide Show: “Teaching GIS” included views of tutorial graphics from Getting to Know ArcGISDesktop, 2nd Edition (Ormsby et al, 2004).
• MS Clip Art was used for any clip art.• Other graphics were drawn by the author.

References• Committee on Support for Thinking Spatially: The Incorporation of GIS Across the K-12
Curriculum, National Research Council. 2005. Learning to Think Spatially: GIS as a Support System in the K–12 Curriculum. Washington, DC: National Academies Press. Book: http://www.nap.edu/catalog/11019.html . Report in Brief: http://dels.nas.edu/dels/rpt_briefs/learning_to_think_spatially_final.pdf
• Fennema, Elizabeth, speaking about her study (Fennema, E., & Tartre, L. (1985). "The use of spatial visualization in mathematics by boys and girls." Journal of Research in Mathematics Education, 16(3), 184-206. ) in Gender Equity for Mathematics and Science (GEMS) speech, 2002. http://www.woodrow.org/teachers/math/gender/02fennema.html)
• Goldenberg, E. Paul, Susan Jo Russell, and Cynthia J. Carter. 1984. Computers, Education and Special Needs. Reading, PA and Menlo Park, CA: Addison-Wesley.
• Johnson, Ann B. 2006. Spatial Thinking, Education, and the Workforce. ArcUser. July-September 2006. http://www.esri.com/news/arcuser/0706/spatial-think.html
• Ormsby, Tim, Eileen Napoleon, Robert Burke, Carolyn Groessl, and Laura Feaster. 2004. Getting to Know ArcGIS Desktop, 2nd Edition. Redlands, CA: ESRI Press.
• Tobias, Cynthia Ulrich. 1984. The Way They Learn. Colorado Springs, CO: Focus on the Family Publishing.
APPENDIX C: Author Information
Sara Masters has masters’ degrees in Math Education as well as Information Science. She is interested in using 3d computer graphics and maps to teach math and science. Currently, she is an online facilitator for the Art Institute Online and a local community college. Also, she does some copyediting and graphics.
For about five out of the last six years, she has assisted with the Computing Workshop for Special Needs Students, a month-long, annual event that opens up career and educational opportunities for secondary level special needs students (mostly autistic) who areotherwise blocked from entering the computer lab. Students are tutored one-on-one and in small groups. Social interaction and innovation are encouraged.
She also has grown children and enjoys playing music.Reach her at [email protected] .


