Learning Outcomes Assessment, PRESENTERS : STACI PROVEZIS, NATASHA JANKOWSKI, JULIA MAKELA, AND DEBBIE SANTUCCI RESEARCH TEAM : ANTWIONE HAYWOOD, JASON GOLDFARB, GLORIA JEA, AND MAHAUGANEE SHAW JUNE 2, 2010 Learning Outcomes Assessment, Transparency, and the Internet
Transcript
Learning Outcomes Assessment,
PRESENTERS : S T A C I P R O V E Z I S , N A T A S H A J A N K O W S K I , J U L I A M A K E L A , A N D D E B B I E S A N T U C C I
RESEARCH TEAM : A N T W I O N E H A Y W O O D , J A S O N G O L D F A R B , G L O R I A J E A , A N D M A H A U G A N E E S H A W
JUNE 2 , 2010
Learning Outcomes Assessment, Transparency, and the Internet
Overview of NILOA
� Why NILOA?
� Who are we?
� Who is funding the Project?
Why Webscan
� Survey Report
� Occasional Papers� Occasional Papers
� Case Studies
� Accreditation Study
� Web Scan Study
Concept of Transparency
� Accountability
� Communication
� Audience
Research Questions and Methods
Research Questions
� What does the institution display on its website � What does the institution display on its website regarding student learning outcomes assessment?
� On which web pages is information about assessment of student learning outcomes located?
Terminology
� Direct evidence of learning. (e.g., capstone)
� Indirect evidence of learning. (e.g., survey)� Indirect evidence of learning. (e.g., survey)
� Capacity building efforts. (e.g., faculty/staff development)
� Assessment purposes. (e.g., general education)
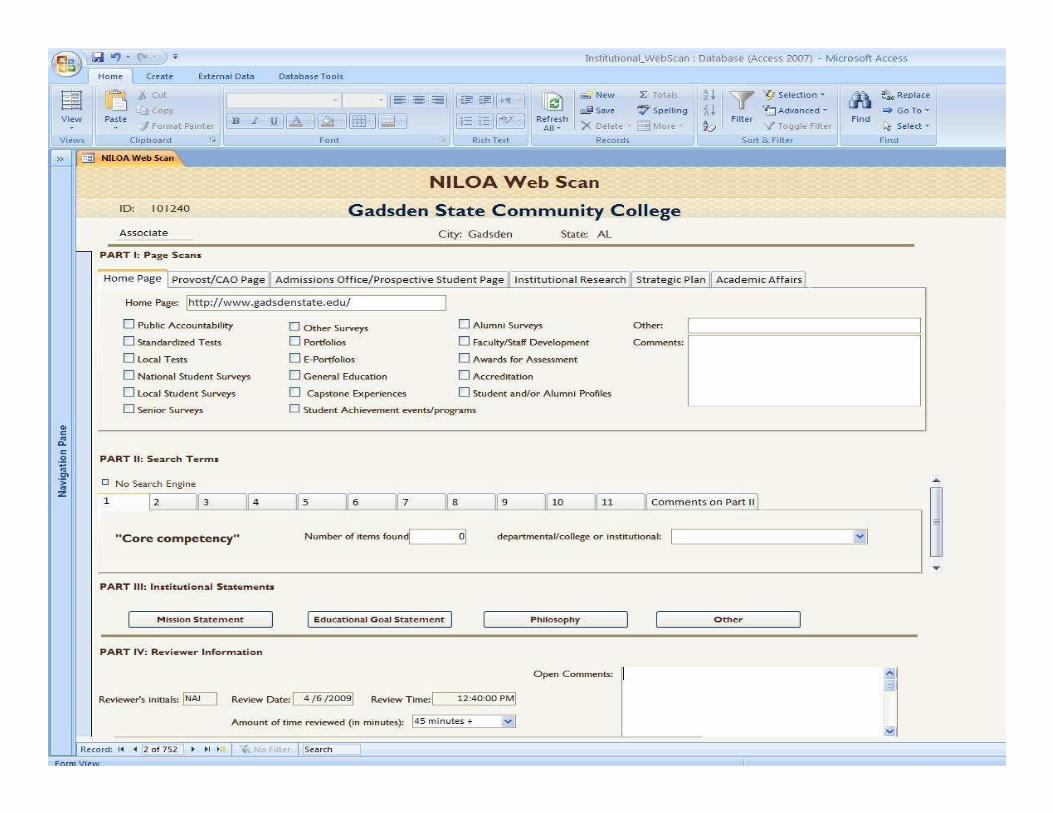
Methods
� Stratified random sample
� Part 1: Specific web page scan
� Part 2: Search engine� Part 2: Search engine
� Part 3: Reviewer information and mission
� Part 4: Reflection
Data Analysis
� Descriptive statistics
� T-tests
� Anova
� Chi-square
Limitations
� Confounding variables
� Website changes
� Website access
� Website finances and structure
� Researcher bias
Findings
Findings
� Who has Institutional Research websites?
� Say vs. Show(Differences between NILOA survey and web scan findings)(Differences between NILOA survey and web scan findings)
� Evidence types found
� Location and audience
� Password protection
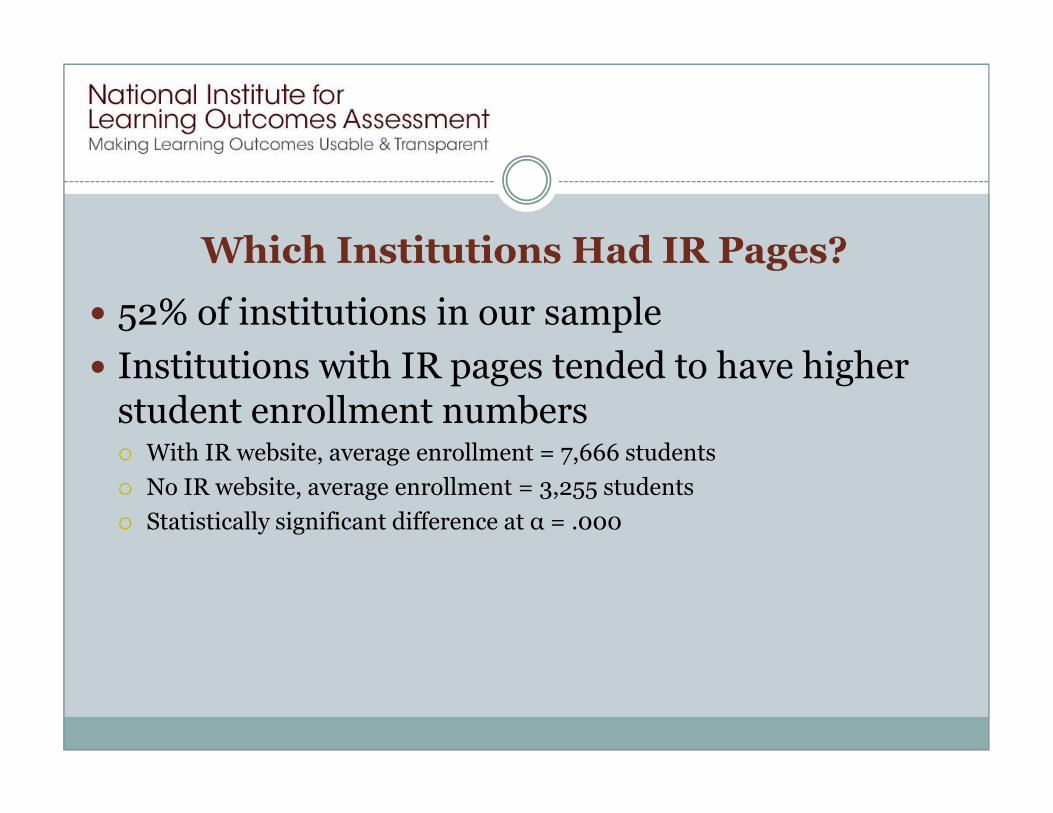
Which Institutions Had IR Pages?
� 52% of institutions in our sample
� Institutions with IR pages tended to have higher student enrollment numbersstudent enrollment numbers� With IR website, average enrollment = 7,666 students
� No IR website, average enrollment = 3,255 students
� Statistically significant difference at α = .000
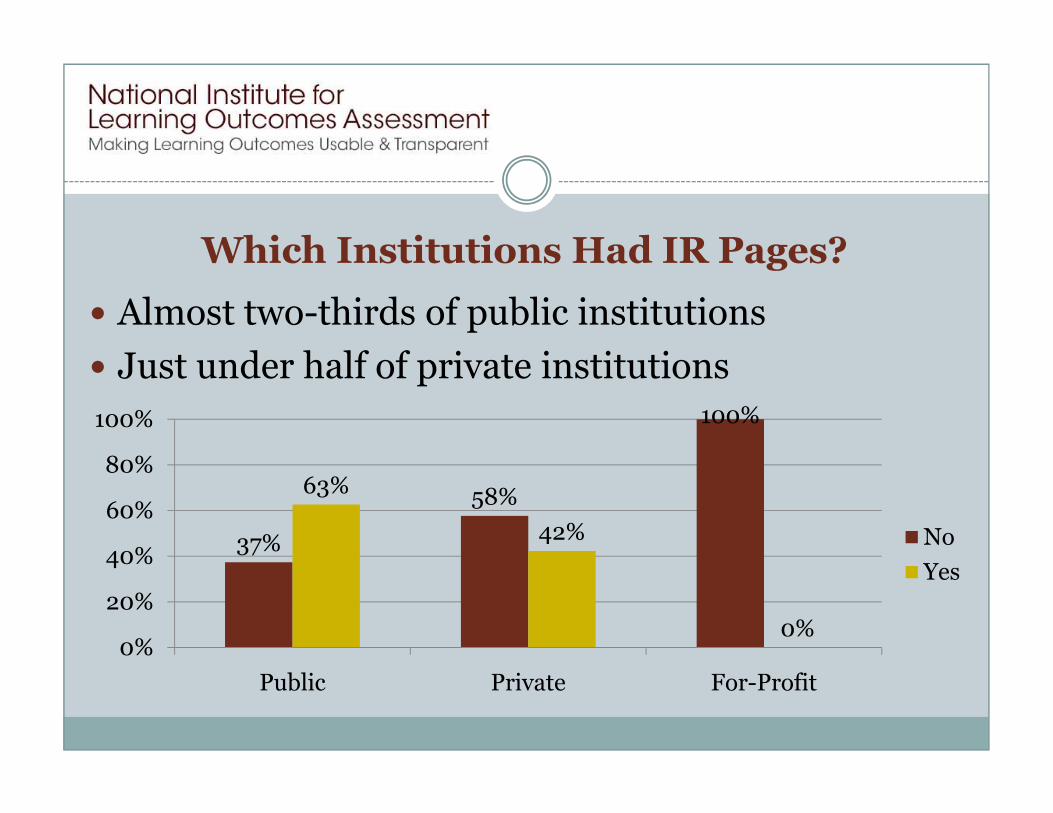
Which Institutions Had IR Pages?
� Almost two-thirds of public institutions
� Just under half of private institutions100%100%
37%
58%
100%
63%
42%
0%0%
20%
40%
60%
80%
100%
Public Private For-Profit
No
Yes
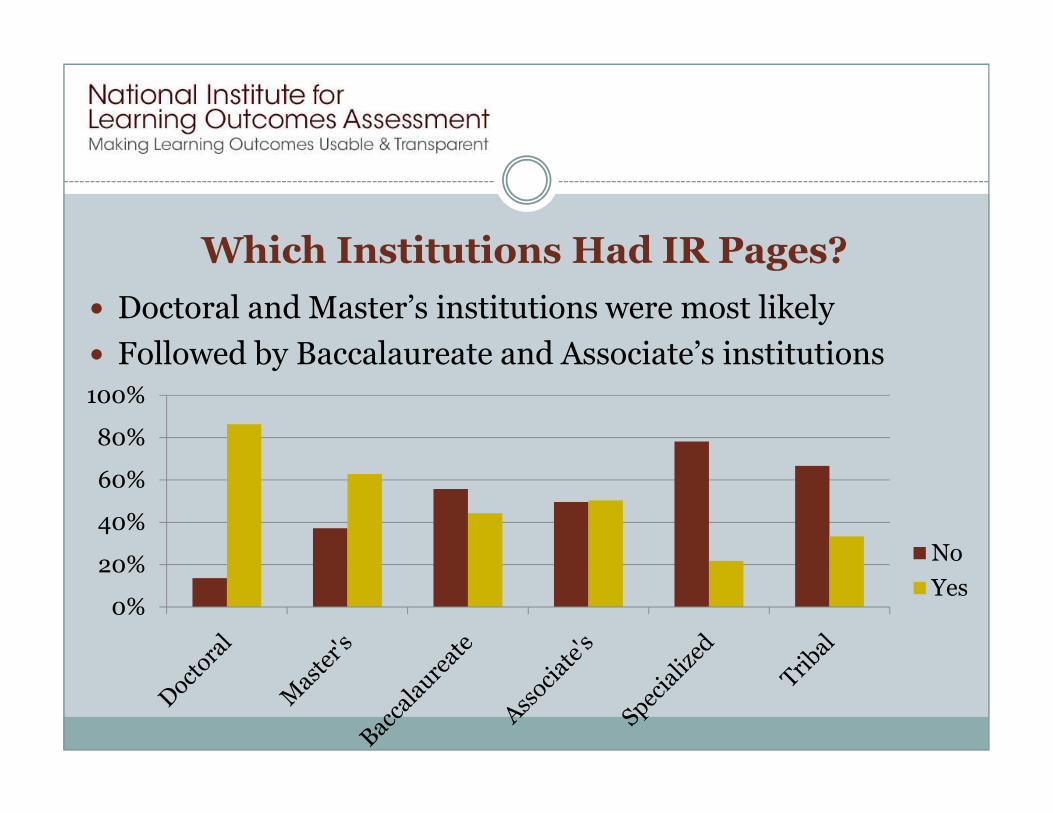
Which Institutions Had IR Pages?
� Doctoral and Master’s institutions were most likely
� Followed by Baccalaureate and Associate’s institutions
100%
0%
20%
40%
60%
80%
100%
No
Yes
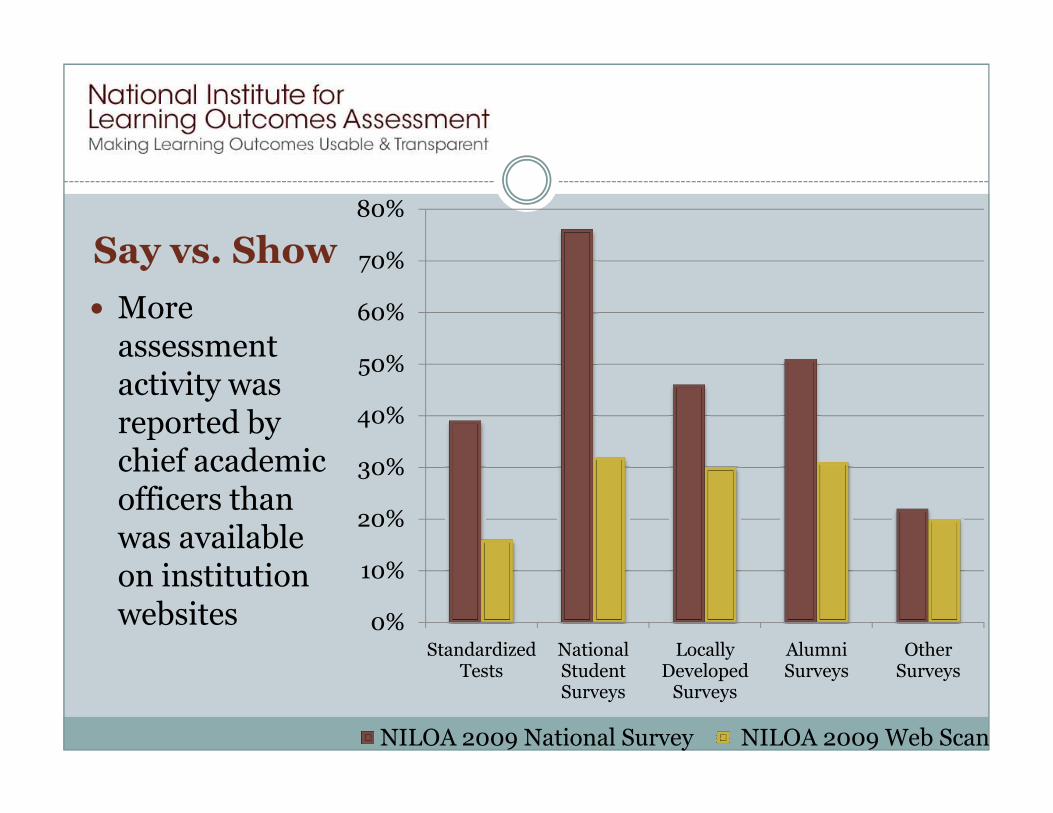
Say vs. Show
� More assessment activity was reported by 40%
50%
60%
70%
80%
reported by chief academic officers than was available on institution websites 0%
10%
20%
30%
40%
Standardized Tests
National Student Surveys
Locally Developed
Surveys
Alumni Surveys
Other Surveys
NILOA 2009 National Survey NILOA 2009 Web Scan
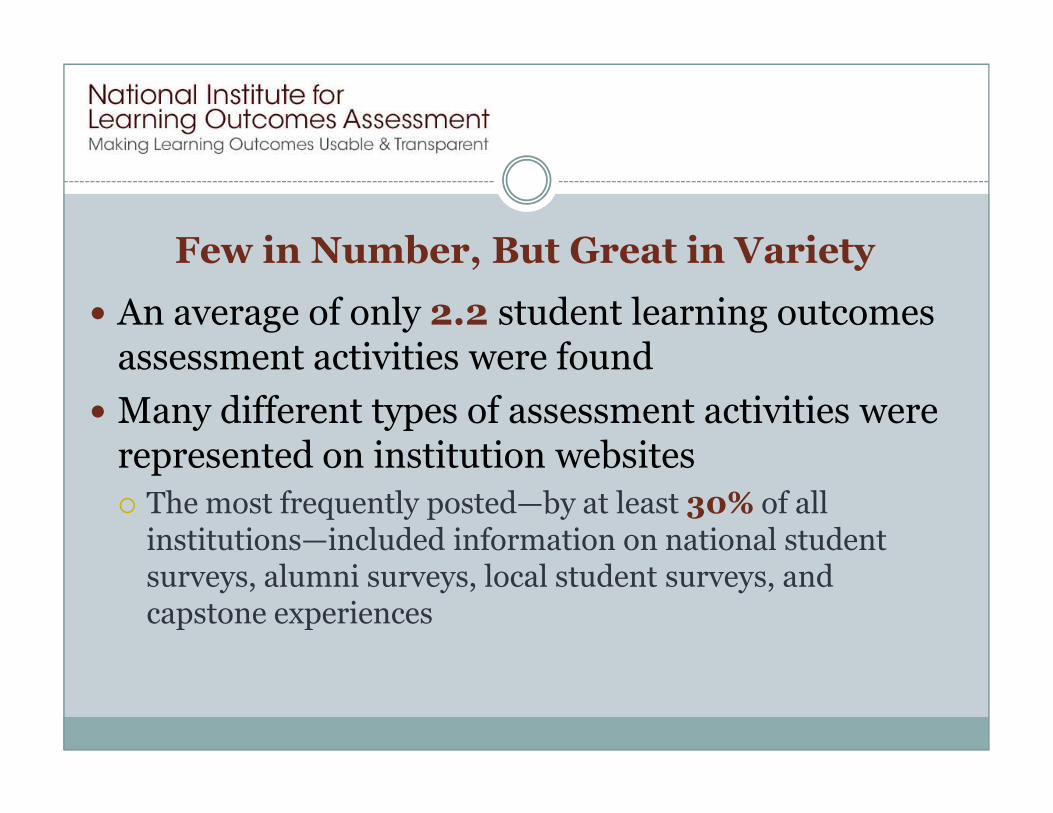
Few in Number, But Great in Variety
� An average of only 2.2 student learning outcomes assessment activities were found
� Many different types of assessment activities were � Many different types of assessment activities were represented on institution websites
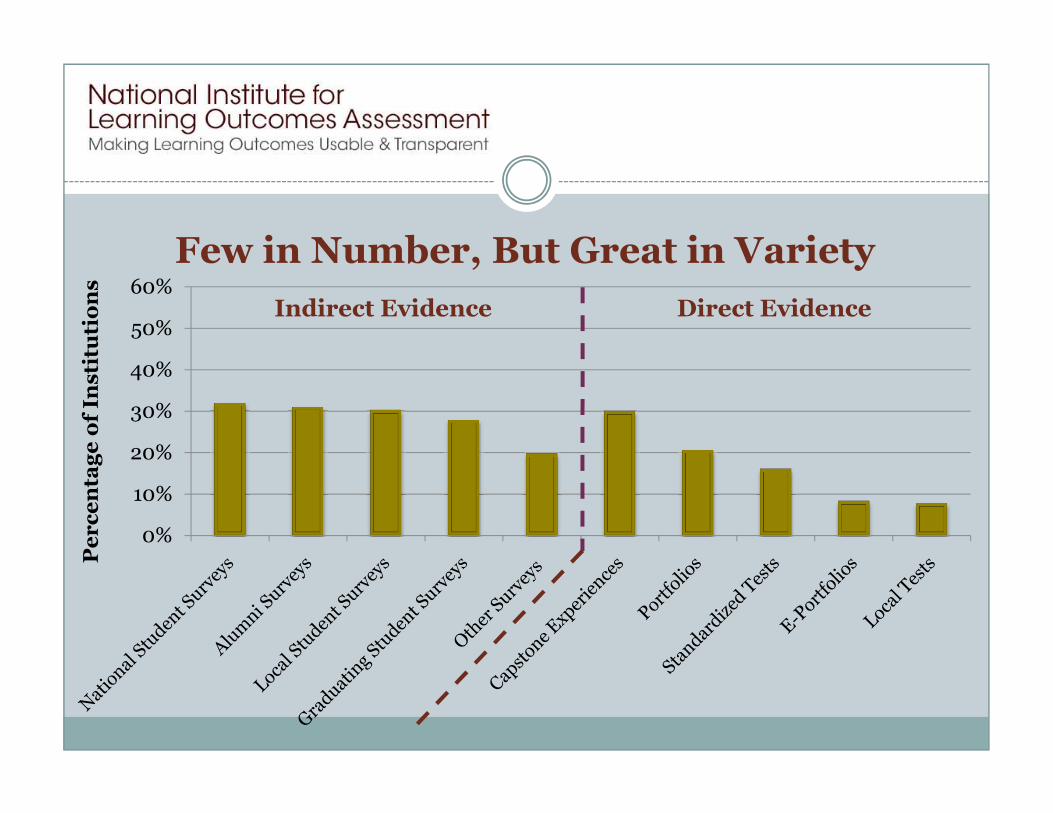
� The most frequently posted—by at least 30% of all institutions—included information on national student surveys, alumni surveys, local student surveys, and capstone experiences
30%
40%
50%
60%
Percentage of In
stitu
tions
Few in Number, But Great in Variety
Indirect Evidence Direct Evidence
0%
10%
20%
30%
Percentage of In
stitu
tions
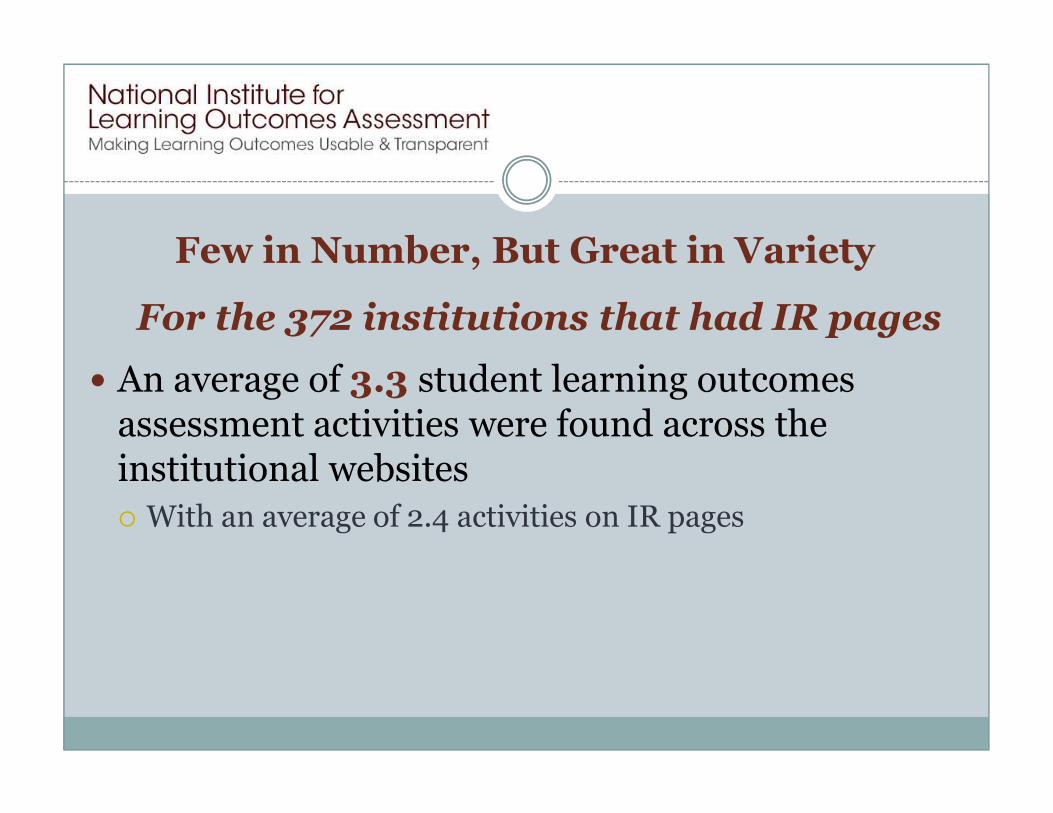
Few in Number, But Great in Variety
For the 372 institutions that had IR pages
� An average of 3.3 student learning outcomes assessment activities were found across the assessment activities were found across the institutional websites
� With an average of 2.4 activities on IR pages
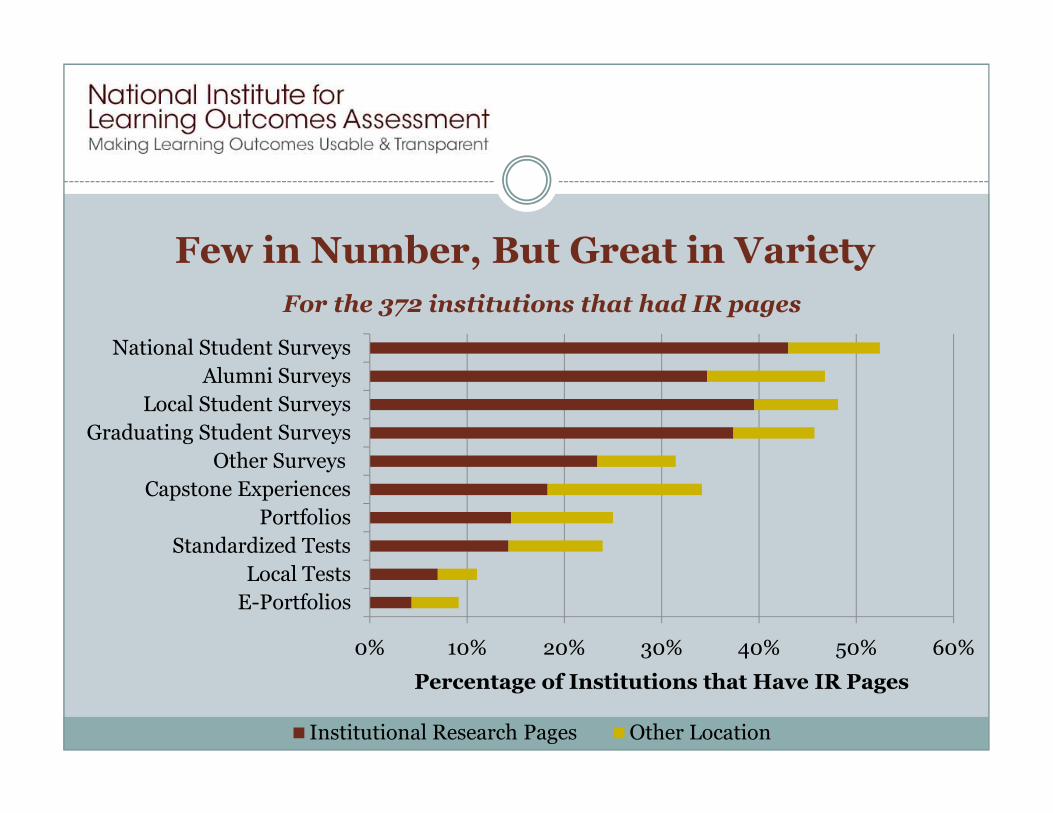
Few in Number, But Great in Variety
For the 372 institutions that had IR pages
Local Student Surveys
Alumni Surveys
National Student Surveys
0% 10% 20% 30% 40% 50% 60%
E-Portfolios
Local Tests
Standardized Tests
Portfolios
Capstone Experiences
Other Surveys
Graduating Student Surveys
Local Student Surveys
Percentage of Institutions that Have IR Pages
Institutional Research Pages Other Location
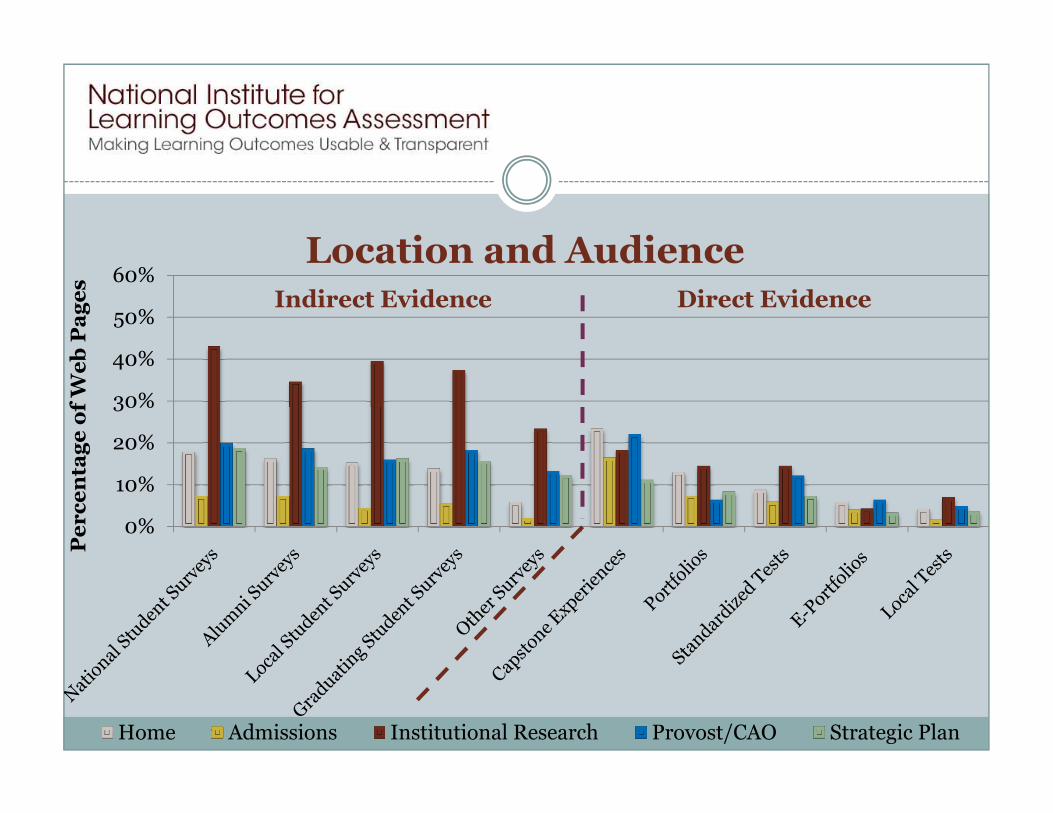
Location and Audience
� Student learning outcomes assessment information was most often available on web pages primarily targeting internal audiencesprimarily targeting internal audiences
30%
40%
50%
60%
Percentage of W
eb Pages
Location and AudienceIndirect Evidence Direct Evidence
0%
10%
20%
30%
Percentage of W
eb Pages
Home Admissions Institutional Research Provost/CAO Strategic Plan
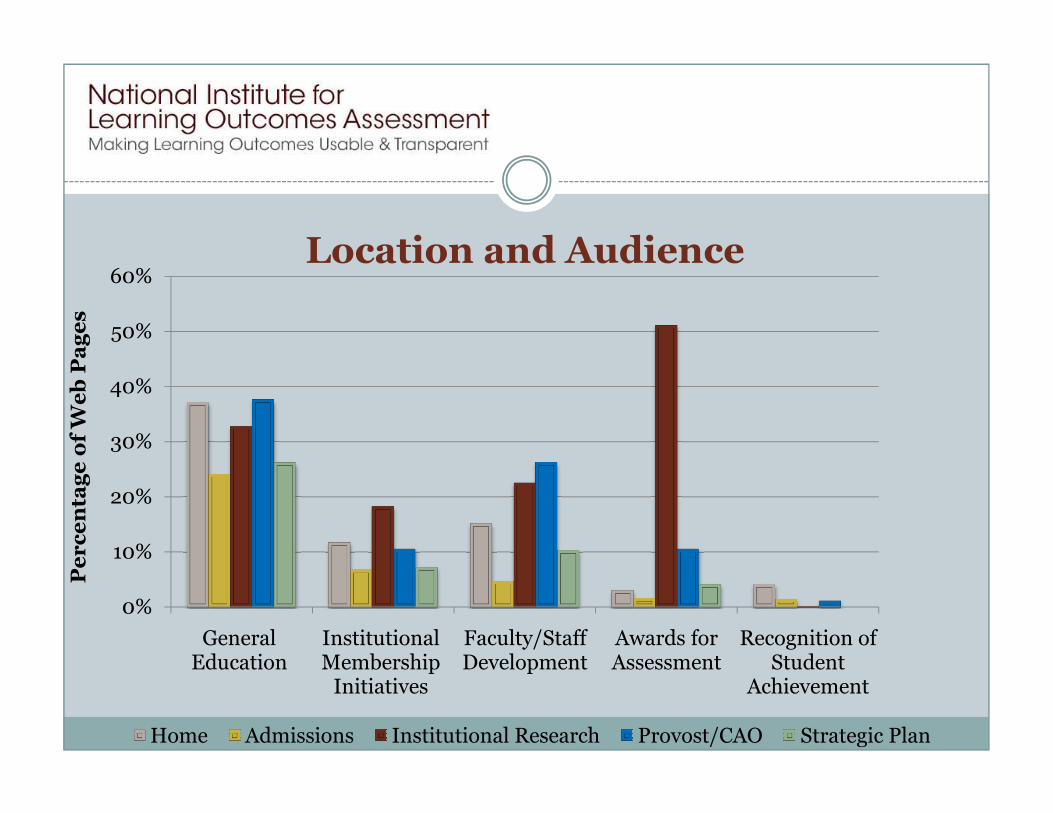
Location and Audience
40%
50%
60%
Percentage of W
eb Pages
0%
10%
20%
30%
General Education
Institutional Membership
Initiatives
Faculty/Staff Development
Awards for Assessment
Recognition of Student
Achievement
Percentage of W
eb Pages
Home Admissions Institutional Research Provost/CAO Strategic Plan
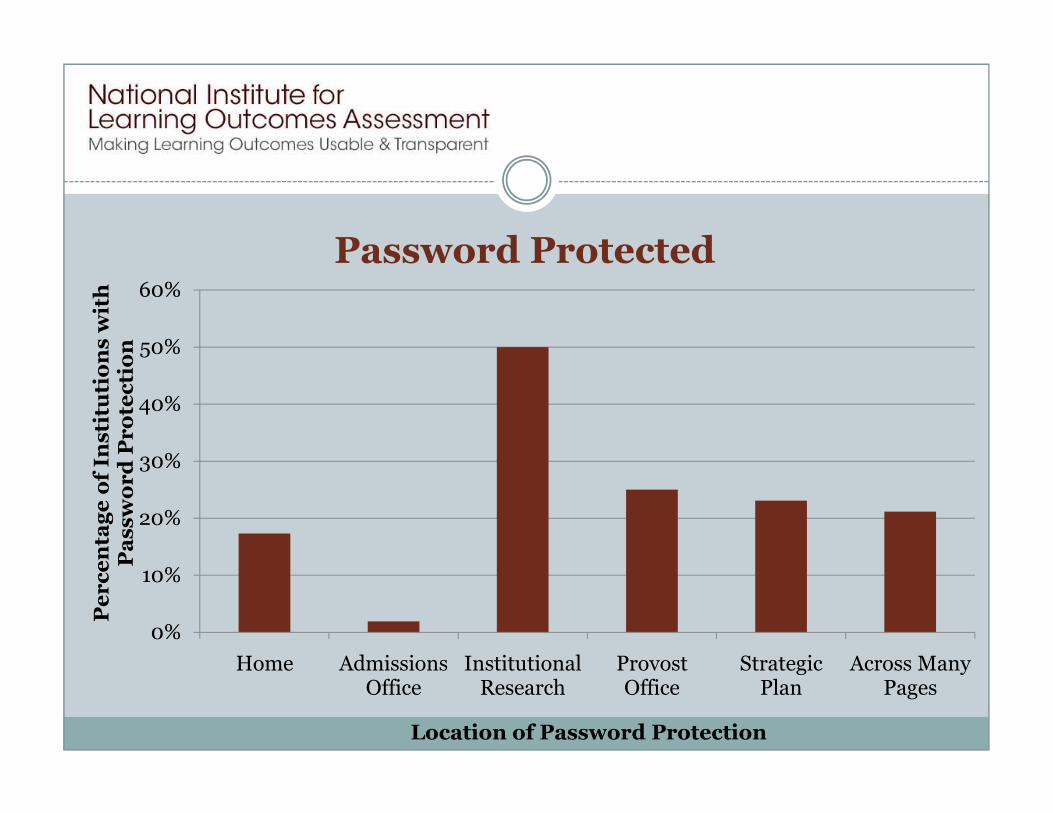
Password Protected
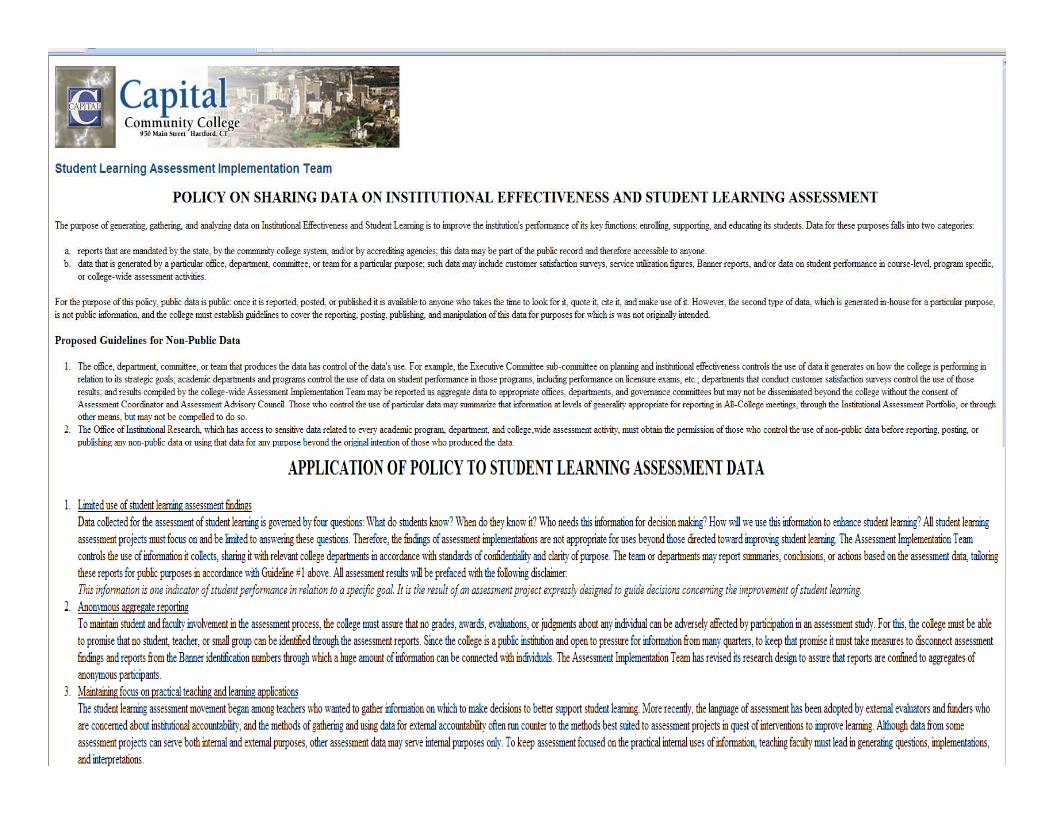
� For 7% of the institutions, password protection limited access to information regarding learning outcomes assessment activitiesoutcomes assessment activities
� Reasons for password protection included:
� Temporary password protection of draft documents
� Internal-only information, not for public consumption
� Student-level data
� In half of the cases, we could not determine what resided behind the password protection
Password Protected
40%
50%
60%
Percentage of In
stitu
tions w
ith
Password Protection
0%
10%
20%
30%
40%
Home Admissions Office
Institutional Research
Provost Office
Strategic Plan
Across Many Pages
Percentage of In
stitu
tions w
ith
Password Protection
Location of Password Protection
Recommendations
Recommendation #1
� Make assessment information more accessible � Make assessment information more accessible (Volkwein, 2010)
� Provide information on multiple web pages
� Collaborate with other campus stakeholders
� Update web pages regularly
Recommendation #2
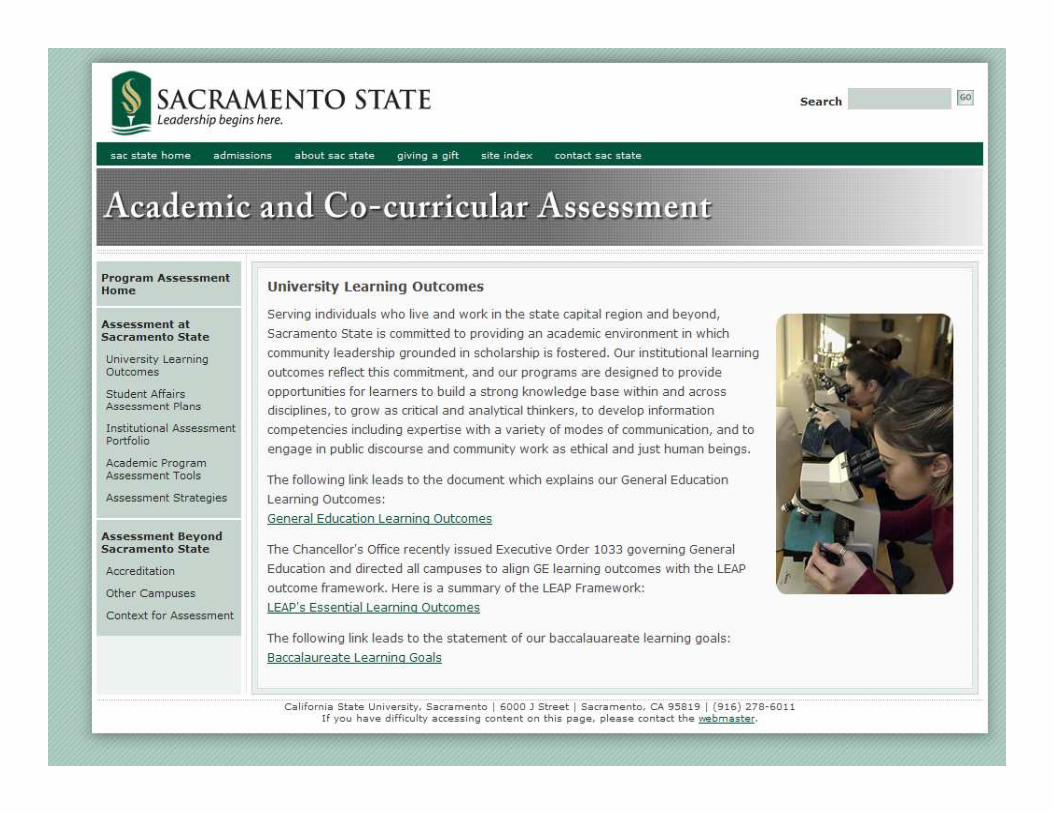
� Explicitly state assessment goals, activities, and initiatives on web pageson web pages� Ensure statements are understandable and transparent
Recommendation #3
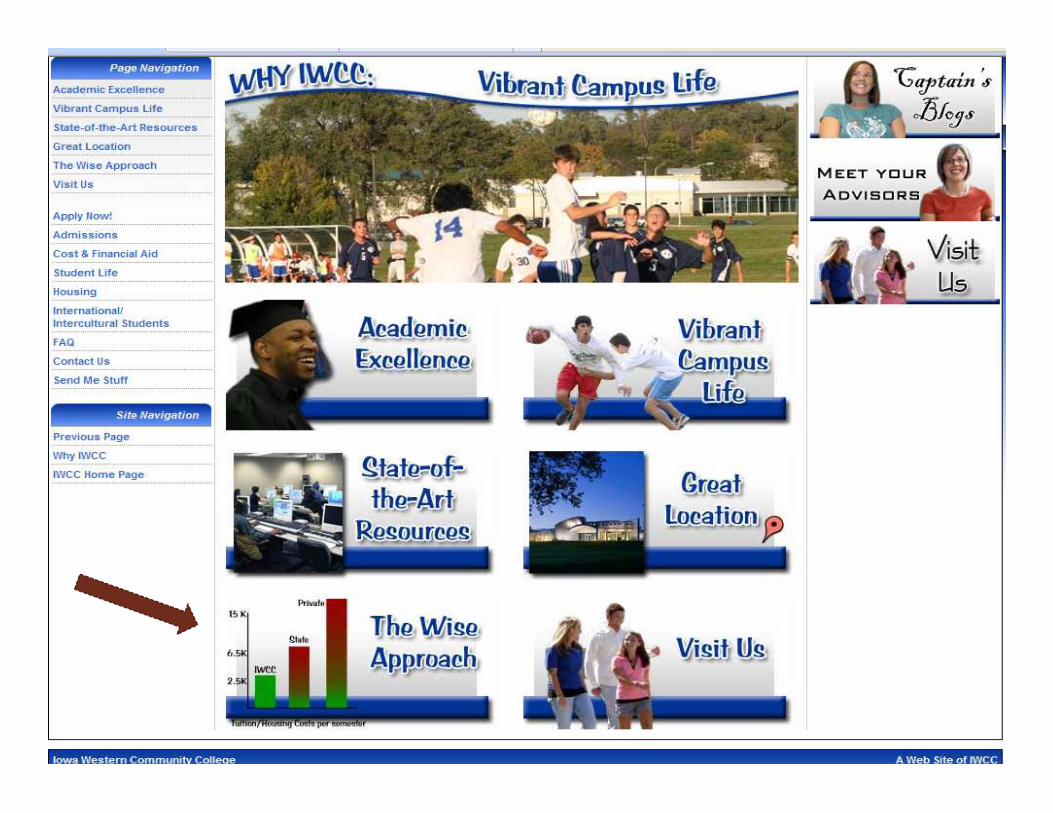
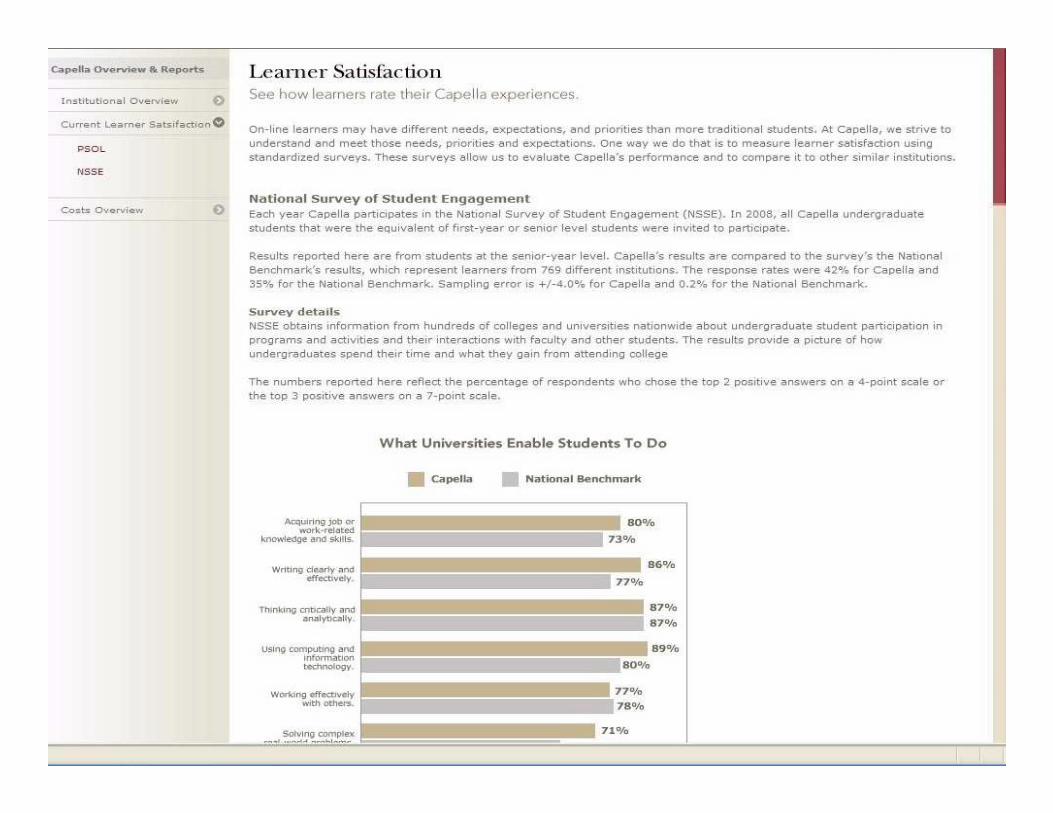
� Help audiences understand assessment activities � Help audiences understand assessment activities through simple examples and descriptions
� Explain data in layperson’s language (Middaugh, 2010; Volkwein, 2010)
� Use an outside reviewer
� POSSIBLY insert screenshot example of a web scan that applies to this recommendation
Recommendation #4
� Clarify the use of password protected web pages� What content is content being posted� What content is content being posted
� Varying web browsers, accessibility of software, etc
� File sizes (Pdf, Excel, SPSS outputs, etc) and download times
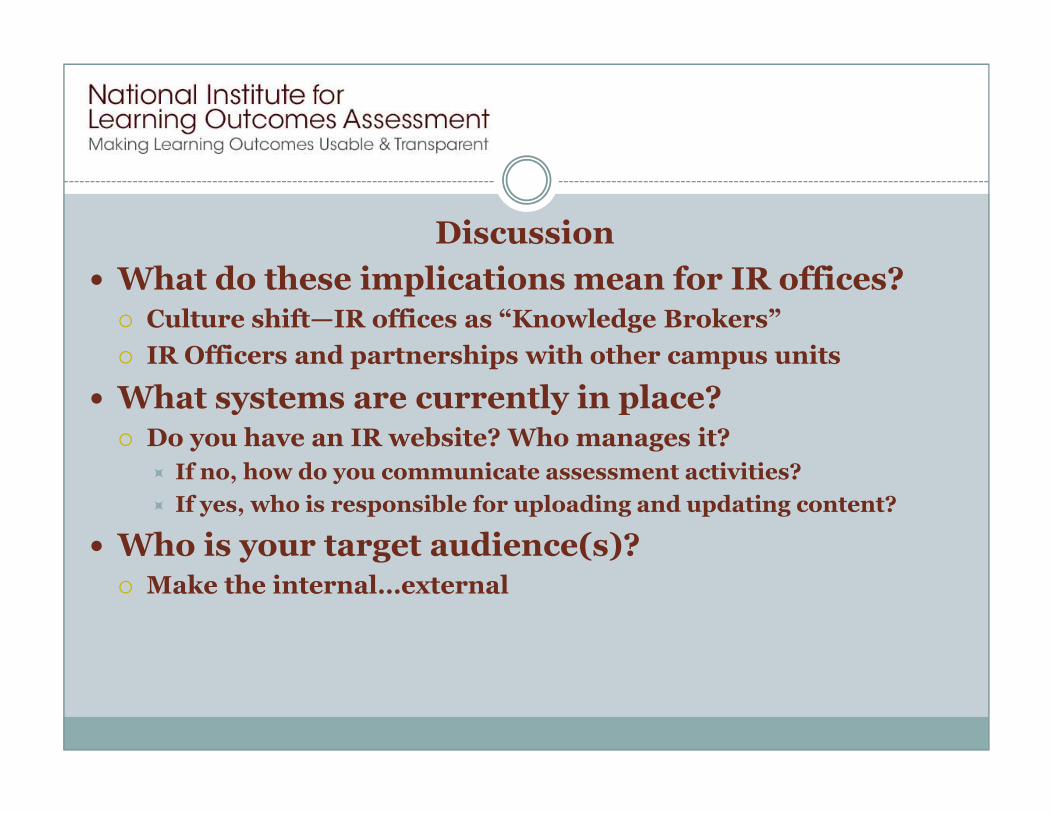
Discussion
� What do these implications mean for IR offices? � Culture shift—IR offices as “Knowledge Brokers”
� IR Officers and partnerships with other campus units
� What systems are currently in place?� What systems are currently in place?� Do you have an IR website? Who manages it?
� If no, how do you communicate assessment activities?
� If yes, who is responsible for uploading and updating content?
� Who is your target audience(s)?� Make the internal…external
� What are some additional strategies for increasing transparency?� What are the next steps for IR offices? For campuses at-large?
� What are some innovative communication examples from your campus or strategies you have examples from your campus or strategies you have heard of?� For web pages and off the web
Next Steps for NILOA
� Examination of posted results
� Greater emphasis on program/departmental � Greater emphasis on program/departmental
activities
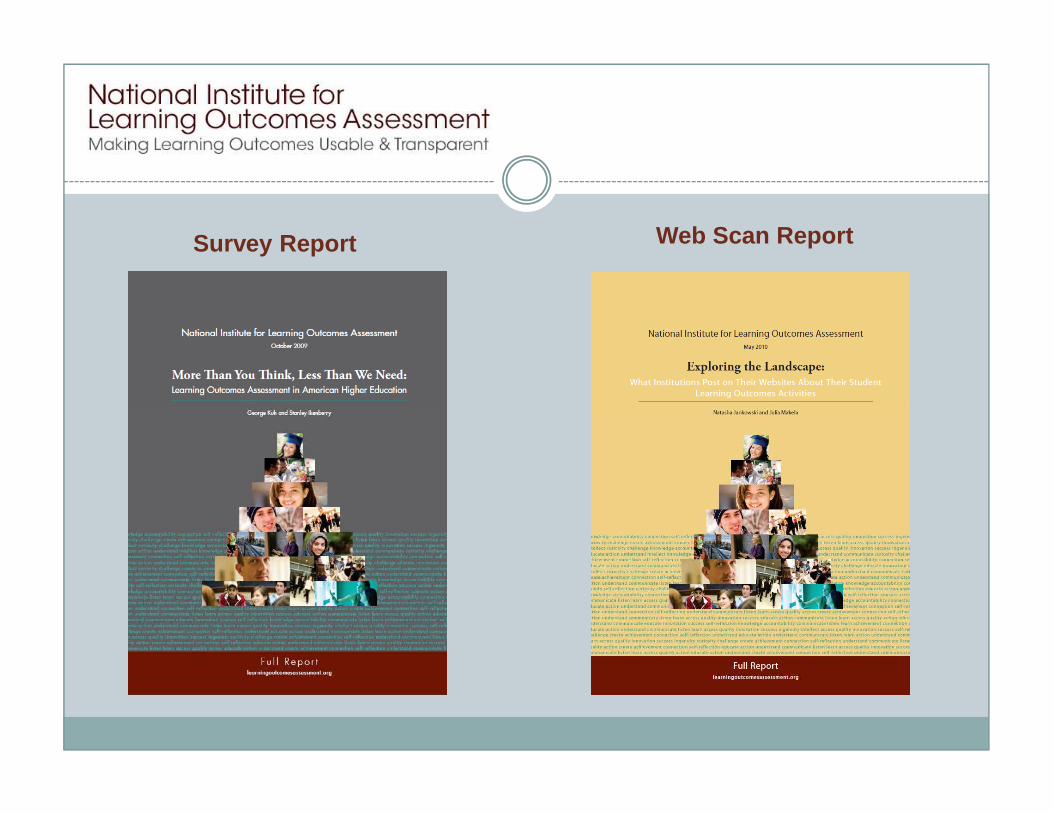
Web Scan ReportSurvey Report
References
Deane, C. (2005). Transparency of qualifications: Are we there yet? European Journal of Education, 40(3), 279-293.
Gambrill, E. (2007). Transparency as the route to evidence-informed professional education. Research on Social Work Practice, 17(5), 553-560.
Geissler, G. L., Zinkhan, G. M., & Watson, R. T. (2006). The influence of home page complexity on consumer attention, attitudes, and purchase intent. Journal of Advertising, 35(2), 69-80.
Kuh, G., & Ikenberry, S. (2009, October). More than you think, less than we need: Learning outcomes assessment in American higher education. Urbana, IL: University of Illinois and Indiana University. National Institute of Learning Outcomes Assessment.
Labre, M. P., & Walsh-Childers, K. (2003). Friendly advice? Beauty messages in websites of teen magazines. Mass Labre, M. P., & Walsh-Childers, K. (2003). Friendly advice? Beauty messages in websites of teen magazines. Mass Communication and Society, 6(4), 379-396.
Leimer, C. (2009, June). Creating and sustaining a culture of evidence and improvement: How can integrating institutional research, assessment, and planning help? Paper presented at the annual forum of the Association for Institutional Research, Atlanta, GA.
Middaugh, M. F. (2010). Planning and assessment in higher education: Demonstrating institutional effectiveness. San Francisco: Jossey-Bass.
Park, Y. A., & Gretzel, U. (2007). Success factors for destination marketing websites: A qualitative meta-analysis. Journal of Travel Research, 46(1), 46-63.
Pike, G. R. (2002). Measurement issues In outcomes assessment. In T. W. Banta & Associates (Eds.), Building a scholarship of assessment (pp. 131-164). San Francisco, CA: Jossey-Bass.
Shneiderman, B., & Plaisant, C. (2004). Designing the user interface: Strategies for effective human-computer interaction(4th ed.). Reading, MA: Addison Wesley.
Volkwein, J. F. (2010). Reporting research results effectively. New Directions for Institutional Research, S1, 155-163.