1 Learning Policy Directorate, HRSDC ALL 2003 Key Research Findings and HRSD Implications Presented by Satya Brink, Ph.D. Director, National Learning Policy Research Learning Policy Directorate May 11, 2005
Transcript
1
Learning Policy Directorate, HRSDC
ALL 2003 Key Research Findings and
HRSD ImplicationsPresented by
Satya Brink, Ph.D.
Director, National Learning Policy Research
Learning Policy Directorate
May 11, 2005
2
Learning Policy Directorate, HRSDC
Policy Research Questions
• What is the level of literacy proficiency in the Canadian working age population?
• How do we compare internationally?• How proficient are Canadians in different
component skills ?• How is literacy performance distributed in the
Canadian population?• What are the factors affecting literacy proficiency
in the competencies?• How have Canadians improved or not?
Introduction
3
Learning Policy Directorate, HRSDC
IALS • Conducted in 1994-1998 • Domains:
Prose
Document
Numeracy
• Participating countries: 22
• In Canada, 4500 respondents aged 16-65 representing 18,450,260 adults
ALL• Conducted in 2003• Domains:
Prose
Document
Numeracy (modified)*
Problem solving*
• Participating Countries: 6 (first round) Canada, Bermuda, Italy, Norway, Switzerland, United States
• Countries participating in the second round (2005) :
Australia, Netherlands,
New Zealand, Hungary, South Korea
• In Canada, 20,000 respondents age
16-65 representing 21,360,683 adults
Introduction
Measurement of adult competencies
4
Learning Policy Directorate, HRSDC
Comparisons between IALS and ALL
• Limited international comparisons
• Limited over time comparisons:
• Prose and document domains only
• Modified numeracy instrument between the two surveys
• Problem solving was added to ALL 2003
• Better population coverage:
• Over sampling of immigrants, Canadian official language minorities. North was included.
Introduction
5
Learning Policy Directorate, HRSDC
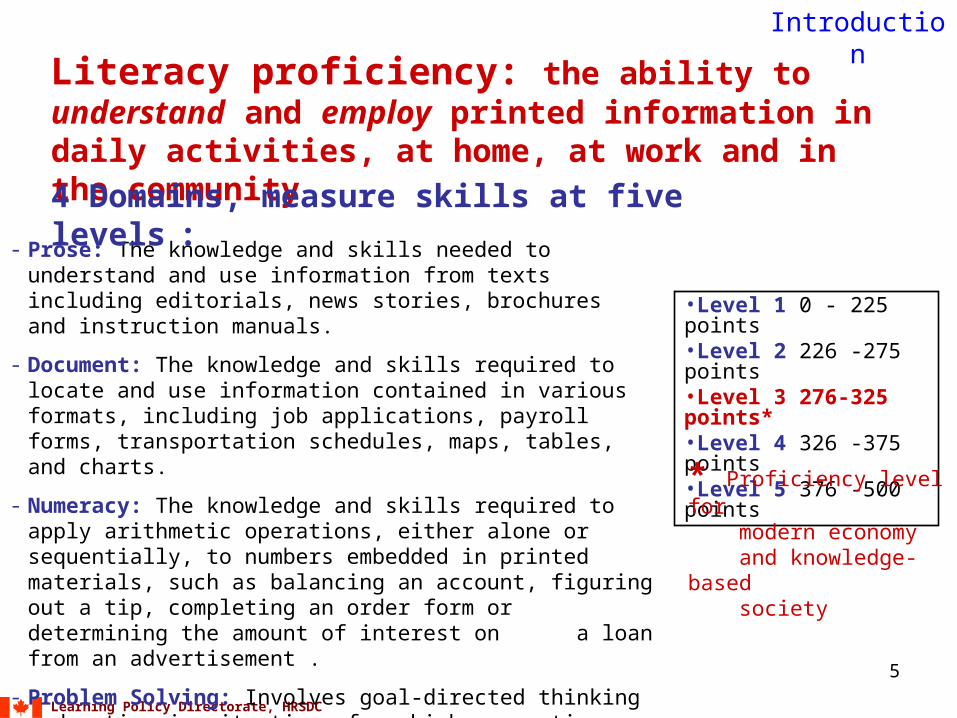
Literacy proficiency: the ability to understand and employ printed information in daily activities, at home, at work and in the community
- Prose: The knowledge and skills needed to understand and use information from texts including editorials, news stories, brochures and instruction manuals.
- Document: The knowledge and skills required to locate and use information contained in various formats, including job applications, payroll forms, transportation schedules, maps, tables, and charts.
- Numeracy: The knowledge and skills required to apply arithmetic operations, either alone or sequentially, to numbers embedded in printed materials, such as balancing an account, figuring out a tip, completing an order form or determining the amount of interest on a loan from an advertisement .
- Problem Solving: Involves goal-directed thinking and action in situations for which no routine solution procedure is available. The understanding of the problem situation and its step-by-step transformation, based on planning and reasoning constitute the process of problem solving.
* Proficiency level for modern economy and knowledge-based society
Introduction
6
Learning Policy Directorate, HRSDC
Indicators of Canadian performance in international ALL results
• Average score and international standing
• Areas of improvement/decline since 1994
• Performance of sub-groups:
- Youth
- Immigrants
- Men-Women
- Labour force
Introduction
7
Learning Policy Directorate, HRSDC
No change in average prose or document scores of Canadians between 1994 and 2003
Level 3 range
in IALS & ALL
IALS
1994
ALL
2003
Prose 276 - 325 278.8 280.8*
Document276 - 325 279.3 280.6*
Numeracy276 - 325 --- 272.3
Problem Solving 276 - 325 --- 273.8
Source: ALL, 2003; IALS, 1994-1998
Canadian literacy performance
* Change from 1994 is not statistically significant.
8
Learning Policy Directorate, HRSDC
Percent of Canadian population (16 to 65) at each prose literacy level, in IALS and ALL
Source: ALL, 2003; IALS, 1994-1998
14.60%
24.80% 27.30%
36.4% 38.6%
22.30% 19.50%
16.60%0%
20%
40%
60%
80%
100%
Level 1 Level 2 Level 3 Level 4/5
3.1 million
4.6 million
6.7 million
4.1 million 4.2 million
8.2 million
5.8 million
3.1 million
Total: 18.4 million Total: 21.4 million
* Differences at each level between IALS and ALL are not statistically significant
Canadian literacy performance
IALS ALL
9
Learning Policy Directorate, HRSDC
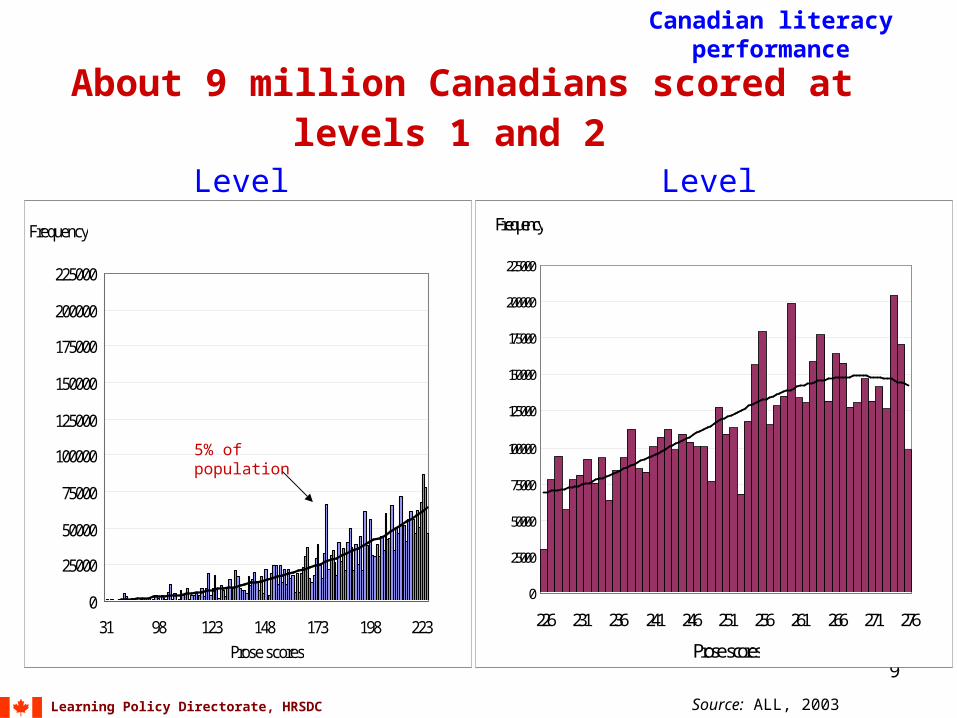
About 9 million Canadians scored at levels 1 and 2
Canadian literacy performance
Source: ALL, 2003
Level 1 Level 2
0
25000
50000
75000
100000
125000
150000
175000
200000
225000
31 98 123 148 173 198 223
Prose scores
Frequency
0
25000
50000
75000
100000
125000
150000
175000
200000
225000
226 231 236 241 246 251 256 261 266 271 276
Prose scores
Frequency
5% of population
10
Learning Policy Directorate, HRSDC
Three countries did not change their prose literacy performance
• Similar trend also observed for document literacy
• Decline in U.S. and Italian speaking Switzerland
• Improvement in German speaking Switzerland
255
260
265
270
275
280
285
290
295
300
255 260 265 270 275 280 285 290 295 300
Canada
IALS
ALL
Norway
Switzerland (Italian)
Switzerland (French)
Switzerland (German)
United States
Source: ALL, 2003; IALS, 1994-1998
International comparison
11
Learning Policy Directorate, HRSDC
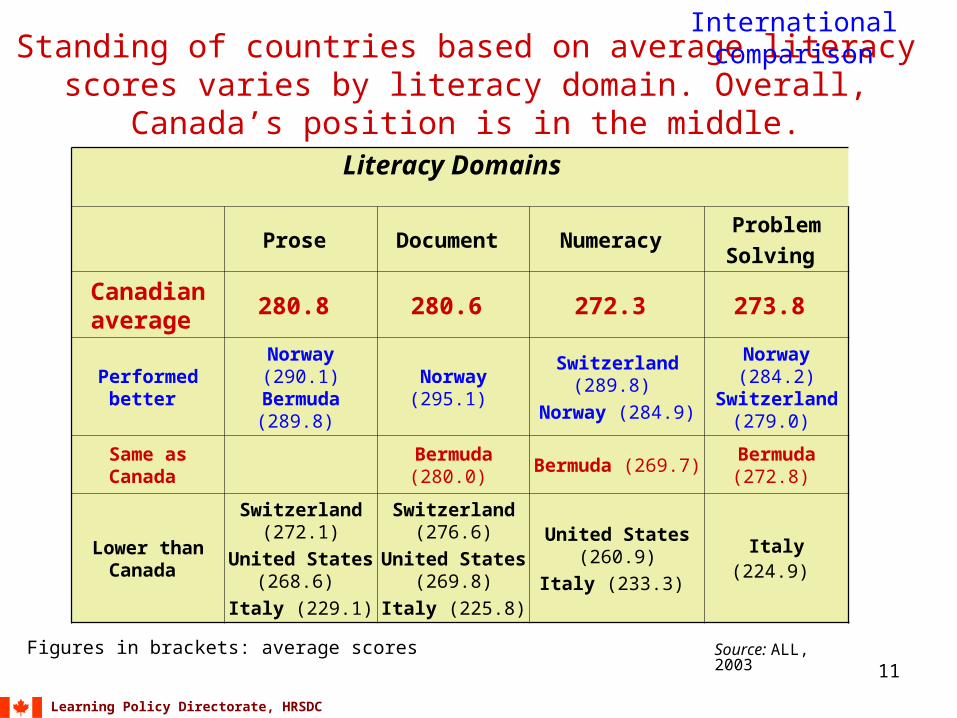
Standing of countries based on average literacy scores varies by literacy domain. Overall, Canada’s position is in the middle.
Literacy Domains
Prose Document Numeracy Problem
Solving
Canadian average
280.8 280.6 272.3 273.8
Performed better Norway (290.1)
Bermuda (289.8) Norway (295.1)
Switzerland (289.8)
Norway (284.9)
Norway (284.2) Switzerland
(279.0)
Same as Canada Bermuda (280.0) Bermuda (269.7) Bermuda (272.8)
Lower than Canada
Switzerland (272.1)
United States (268.6)
Italy (229.1)
Switzerland (276.6)
United States (269.8)
Italy (225.8)
United States (260.9)
Italy (233.3) Italy (224.9)
Source: ALL, 2003 Figures in brackets: average scores
International comparison
12
Learning Policy Directorate, HRSDC
Source: ALL, 2003
International comparison
58% of Canadians performed at level 3 or higher
42% of Canadians performed at prose levels 1 and 2 compared to 34% in Norway
Proportion of adults 16-65 performing at level 1,2 ,3 and 4/5 in each country at prose literacy
12.5
47.0
7.9
15.9
20.0
25.6
32.5
26.2
36.3
32.6
35.6
17.0
45.3
35.7
34.6
26.3
3.5
20.6
12.1
12.8
14.6 27.3 38.6 19.5
0% 10% 20% 30% 40% 50% 60% 70% 80% 90% 100%
Bermuda
Canada
Italy
Norway
Switzerland
United States
Level 1 Level 2 Level 3 Level 4/5
13
Learning Policy Directorate, HRSDC
Increase in average document literacy scores among low scoring Canadians, and slight decline among high scorers
Bottom 5 %
Average ScoresTop 5 %
Average Scores
IALS ALL IALS ALL
Canada 127.4 178.3 * 379.6 361.5 *
United States 124.0 174.3 * 367.9 352.5 *
Switzerland (German) 117.1 199.7 * 358.3 358.9
Switzerland (French) 153.7 198.7 * 355.1 345.7 *
Norway 203.3 205.8 371.9 372.3
Switzerland (Italian) 164.6 192.6 * 347.2 332.8 *
Mean scores at the 5th and 95th percentiles on document scale, population 16 to 65
* Significant changeSource: ALL, 2003; IALS, 1994-1998
International comparison
14
Learning Policy Directorate, HRSDC
Mean prose scores with .95 confidence interval and scores at the 5th, 25th, 75th and 95th
percentiles, 16- 65
Source: ALL, 2003; IALS, 1994-1998
International comparison
Equity improved in Canada through a change in distribution though the average prose literacy scores did not change
0 50 100 150 200 250 300 350 400 450 500
Switzerland (Italian)
Norway
Switzerland (French)
Switzerland (German)
United States
Canada
Scale scores
IALS 1998
ALL 2003
ALL 2003
ALL 2003
ALL 2003
ALL 2003
ALL 2003IALS 1998
IALS 1994
IALS 1994
IALS 1994
IALS 1994
Ideal
15
Learning Policy Directorate, HRSDC
Source: ALL, 2003
International comparison
The proportion of Canadians performing at levels 1 and 2 varied across literacy domains
Per cent of adult populations performing at levels 1 and 2 in ALL 2003
41.9% 42.6%49.8%
68.5%
0
20
40
60
80
100
Prose Document Numeracy Problem Solving
%
Canada
United States
Sw itzerland
Norw ay
Italy
Bermuda
Good
Poor
16
Learning Policy Directorate, HRSDC
In most countries, men performed better than women in numeracy and in document literacy
Standard score differences in mean skills proficiencies between men and women on the prose, document, numeracy and problem solving scales, 2003
Source: ALL, 2003
Subgroups - Gender
-20 -15 -10 -5 0 5 10 15 20
Bermuda
Canada
Italy
Norw ay
Sw itzerland
United States
Problem Solving
Numeracy
Document
Prose
Points
Women Men
17
Learning Policy Directorate, HRSDC
Source: ALL, 2003
Subgroups - Youth
Younger Canadians scored higher in document literacy and have larger proportions at levels 4 & 5
Per cent of populations aged 16 to 25, 26 to 45 and 45 to 65 at each level on the document scale
22.2
13.0
30.4
25.1
25.4
33.3
37.4
42.1
14.1
24.5
23.09.5
0% 20% 40% 60% 80% 100%
46 to 65
26 to 45
16 to 25
Age
Level 1
Level 2
Level 3
Level 4/5
18
Learning Policy Directorate, HRSDC
Source: ALL, 2003
Subgroups - Youth
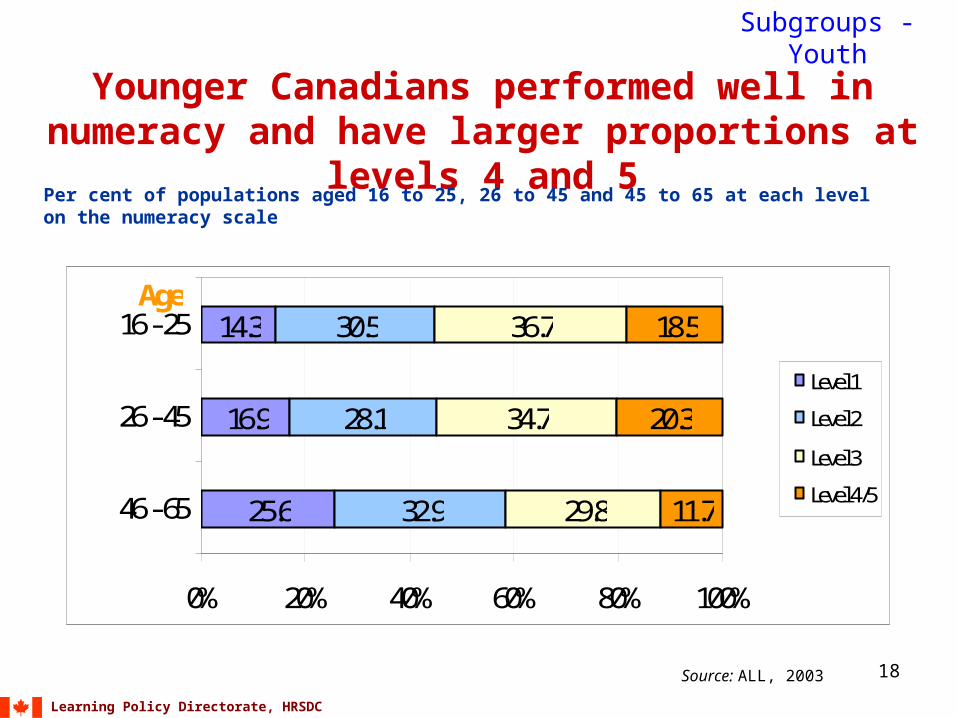
Younger Canadians performed well in numeracy and have larger proportions at levels 4 and 5
Per cent of populations aged 16 to 25, 26 to 45 and 45 to 65 at each level on the numeracy scale
25.6
16.9
14.3
32.9
28.1
30.5
29.8
34.7
36.7
11.7
20.3
18.5
0% 20% 40% 60% 80% 100%
46 - 65
26 - 45
16 - 25Age
Level 1
Level 2
Level 3
Level 4/5
19
Learning Policy Directorate, HRSDC
There is an inverse relationship between age and literacy performance, even after controlling for
educational attainmentRelationship between age and literacy scores on the document literacy scale, with adjustment for level education, 2003
Source: ALL, 2003
Subgroups - Youth
200
225
250
275
300
325
10 20 30 40 50 60 70
Age
Scale score
Canada Sw itzerland Italy Norw ay Bermuda United States
Canada Norway
20
Learning Policy Directorate, HRSDC
Per cent of populations aged 16-65 at each level of educational attainment, by recent vs established immigration status, 2003
Source: ALL, 2003
1 = Recent immigrants (<= 5 years)
2 = Established immigrants (> 5 years)
3 = Native born
Subgroups- Immigrants
Recent immigrants have higher education in Bermuda and Canada
0
10
20
30
40
50
60
70
80
90
100
1 2 3 1 2 3 1 2 3 1 2 3 1 2 3
Bermuda Canada Switzerland United States Norway
Percent
Less than upper secondary Upper secondary Higher than upper secondary
21
Learning Policy Directorate, HRSDC
Per cent of adults (16 to 65) at each level on the prose scale by their native tongue status, 2003
1= Immigrant whose mother tongue is different from the language of the test
2= Immigrant whose mother tongue is the same as the language of the test
3=Native born
Source: ALL, 2003
Higher proportion of immigrants scored at level 1 and 2 if their mother tongue was different from the language of test
Subgroups - Immigrants
100 80 60 40 20
020406080
100
1 2 3 1 2 3 1 2 3 1 2 3 1 2 3 3
Norw ay Canada Sw itzerland United States Italy
Per cent
Level 2 Level 1 Level 3 Level 4/5
Bermuda
22
Learning Policy Directorate, HRSDC
In Canada, low scoring adults are 2.5 times more likely to experience six or more months of labour force inactivity
compared to those scoring at level 3 or higherOdds ratios showing likelihood of experiencing labour force inactivity for 6 months or more in thelast 12 months compared to being employed all year, by numeracy levels, (16-65), excludingstudents and retirees, 2003
Source: ALL, 2003
Subgroups - Labor force
0
1
2
3
4
Ita ly N o rw a y C a n a da U n ite d S ta te s S w itz e rla n d B e rm ud a
L e v e ls 1 & 2 L e v e ls 3 o r h ig h e r
O d d s (X t ime s )
23
Learning Policy Directorate, HRSDC
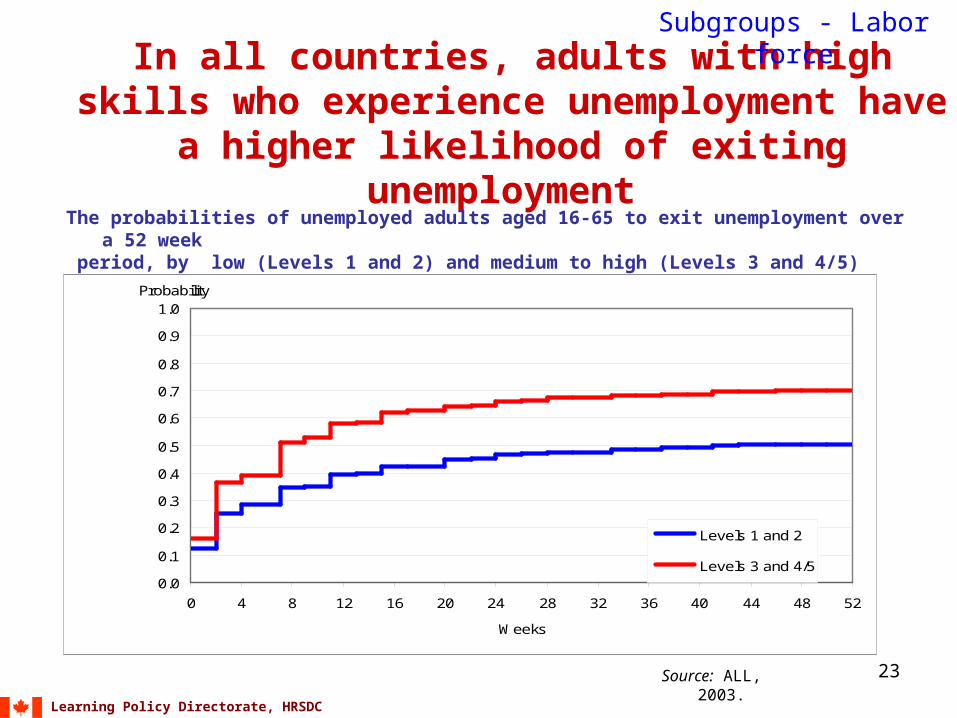
In all countries, adults with high skills who experience unemployment have a higher
likelihood of exiting unemployment
Source: ALL, 2003.
The probabilities of unemployed adults aged 16-65 to exit unemployment over a 52 week period, by low (Levels 1 and 2) and medium to high (Levels 3 and 4/5) skills, document scale,2003
Subgroups - Labor force
0.0
0.1
0.2
0.3
0.4
0.5
0.6
0.7
0.8
0.9
1.0
0 4 8 12 16 20 24 28 32 36 40 44 48 52
Weeks
Probability
Levels 1 and 2
Levels 3 and 4/5
24
Learning Policy Directorate, HRSDC
In general, knowledge intensive sectors have higher proportions of adults with medium and high literacy
Norway Bermuda Canada United States Switzerland Italy
Per cent
Level 3 Level 4/5
25
Learning Policy Directorate, HRSDC
Positive relationship between education and numeracy skills
Mean numeracy scores on a scale with range 0-500 points, by level of educational attainment, 16-65, 2003
1 Less than upper secondary
2 Upper secondary
3 Post-secondary, non-tertiary
4 Tertiary type B or higher
The countries are ranked by the mean of the numeracy score of those completed upper secondary
Source: ALL, 2003
Factors - Education
0
50
100
150
200
250
300
350
400
450
500
1 2 4 1 2 3 4 1 2 3 4 1 2 3 4 1 2 3 4 1 2 3 4
Sw itzerland Norw ay Canada United States Bermuda Italy
4
1
3
2
5
L
26
Learning Policy Directorate, HRSDC
The relationship between parental education and literacy skills in Canada changed among youth
(16-25) over the nine year period
Factors – Education
Relationship between respondent’s prose literacy scores and parents’education in years, population 16-65, IALS 1994/1998 and ALL 2003
Source: ALL, 2003; IALS, 1994-1998
Canada
Level 4
Level 3
Level 2
Level 1
Prose Literacy score350
300
250
200
6 7 8 9 10 11 12 13 14 15 16 17 18
Years of parent education
27
Learning Policy Directorate, HRSDC
Not all young people whose parents had low levels of education had low literacy scores
Factors - Education
Relationship between respondent’s prose literacy scores and parents’ education in years, population 16-65, 2003
Source: ALL 2003
400
350
300
250
200
150
100
Canada
Level 5
Level 4
Level 3
Level 2
Level 1
6 7 8 9 10 11 12 13 14 15 16 17 18
Years of parent education
28
Learning Policy Directorate, HRSDC
50% of Canadian adults participated in organized education and training in 2003, an increase of over one-third since 1994
Percent of populations (16-65) receiving adult education and training during the year preceding the interview, IALS 1994/1998 and ALL 2003
Source: ALL, 2003; IALS, 1994-1998
Factors - Adult training
Around half of them were funded by employers.
37
48
33
45
42
36 49
38
53
48
61
55
0 10 20 30 40 50 60 70
Switzerland Italian
Norway
Switzerland French
Switzerland Germany
United States
Canada
Per centIALS 1994/1998 ALL 2003
29
Learning Policy Directorate, HRSDC
Percentage changes in the per cent of adults (16-65) in adult education and training betweenIALS 1994/1998 and ALL 2003, by document literacy levels
Source: ALL, 2003; IALS, 1994-1998
The increase in participation rate in Canada was evident across all proficiency levels particularly
those at level 1, 2 and 3
Factors - Adult training
Canada
44
17
50 50
0.0
20.0
40.0
60.0
Level 1 Level 2 Level 3 Level 4/5
%
30
Learning Policy Directorate, HRSDC
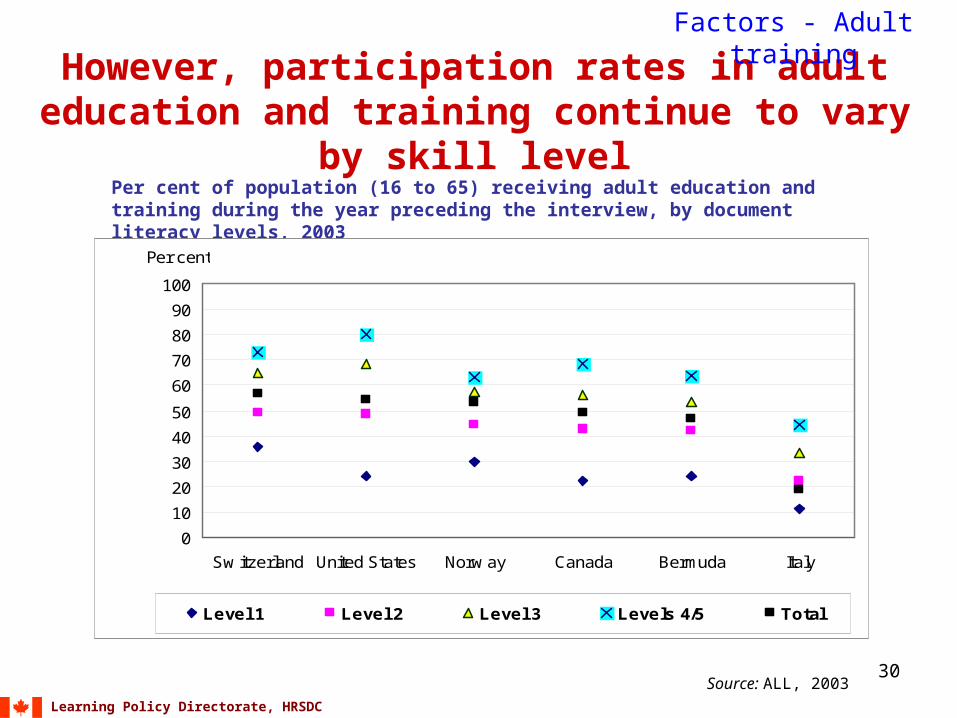
However, participation rates in adult education and training continue to vary by skill level
Source: ALL, 2003
Per cent of population (16 to 65) receiving adult education and training during the year preceding the interview, by document literacy levels, 2003
Factors - Adult training
0
10
20
30
40
50
60
70
80
90
100
Sw itzerland United States Norw ay Canada Bermuda Italy
Per cent
Level 1 Level 2 Level 3 Levels 4/5 Total
31
Learning Policy Directorate, HRSDC
Computer users have higher prose literacy scores compared to non-users in all countries
Mean scores on the prose literacy scale ranging from 0 to 500 points, by whetherrespondents are computer users or non-users, populations aged 16-65, 2003
Source: ALL, 2003
Factors- ICT use
289249
278280297 294
214 202207232222 239
0
100
200
300
400
500
Bermuda Norway Canada Switzerland UnitedStates
Italy
Scale scores
Computer user Non-user
32
Learning Policy Directorate, HRSDC
In all countries, adults at levels 4/5 are more than twice as likely to be high intensity computer users.
Adjusted odds ratios showing the likelihood of adults (16-65) of being high intensitycomputer users, by prose literacy levels, 2003
Source: ALL, 2003.
Factors - ICT use
0.0 0.5 1.0 1.5 2.0 2.5 3.0 3.5 4.0
Sw itzerland
United States
Italy
Canada
Norw ay
Bermuda
Odds (x times)Levels 1/2 Level 3 Levels 4/5
33
Learning Policy Directorate, HRSDC
Conclusion
• What is the level of literacy proficiency in the Canadian working age population?
– 58% of Canadian adults (16-65) performed at level 3 or higher in ALL 2003.– The Canadian average in prose and document literacy was at level 3 which
is required for the knowledge economy. The average for numeracy and problem solving was just below level 3.
• How do we compare internationally?
– Among the six countries participating in the first round of ALL, Canada’s performance was in the middle.
– Canada did better than US in all literacy domains except problem solving in which the US did not participate.
• How proficient are Canadians in different component skills?
– Canadians performed better in prose and document literacy than in numeracy or problem solving.
– A similar trend was also observed in most other countries.
34
Learning Policy Directorate, HRSDC
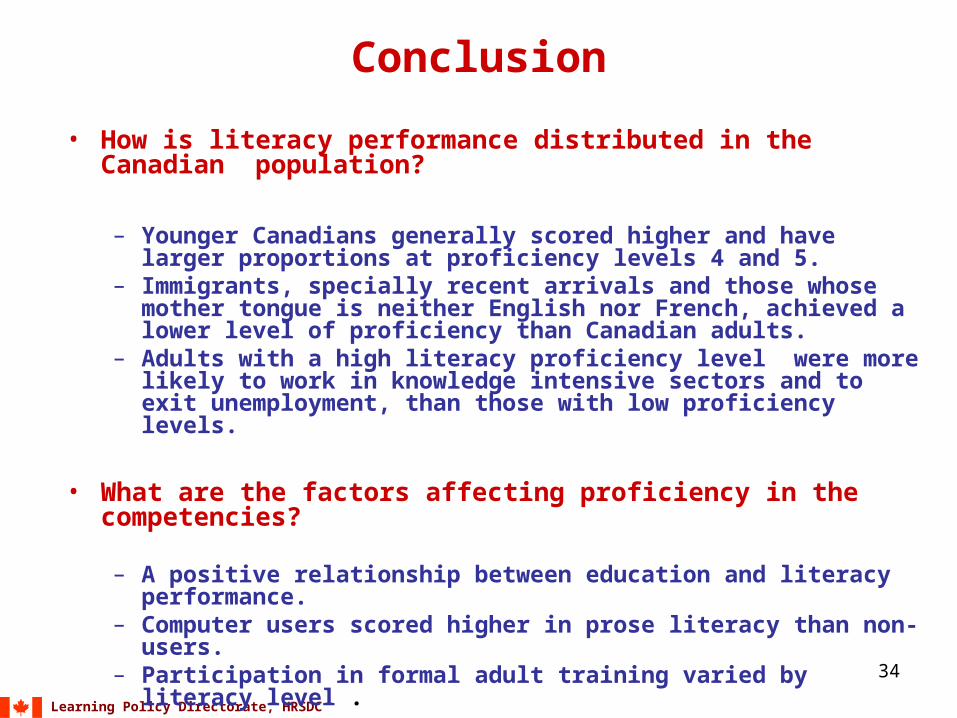
Conclusion
• How is literacy performance distributed in the Canadian population?
– Younger Canadians generally scored higher and have larger proportions at proficiency levels 4 and 5.
– Immigrants, specially recent arrivals and those whose mother tongue is neither English nor French, achieved a lower level of proficiency than Canadian adults.
– Adults with a high literacy proficiency level were more likely to work in knowledge intensive sectors and to exit unemployment, than those with low proficiency levels.
• What are the factors affecting proficiency in the competencies?
– A positive relationship between education and literacy performance.– Computer users scored higher in prose literacy than non-users.– Participation in formal adult training varied by literacy level .
35
Learning Policy Directorate, HRSDC
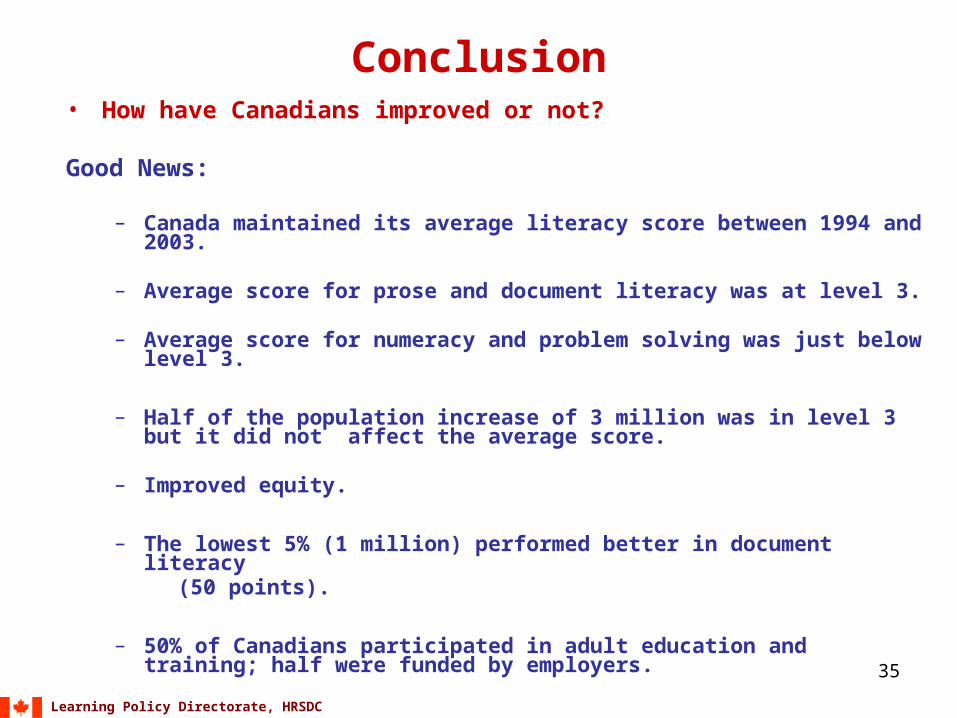
Conclusion• How have Canadians improved or not?
Good News:
– Canada maintained its average literacy score between 1994 and 2003.
– Average score for prose and document literacy was at level 3.
– Average score for numeracy and problem solving was just below level 3.
– Half of the population increase of 3 million was in level 3 but it did not affect the average score.
– Improved equity.
– The lowest 5% (1 million) performed better in document literacy (50 points).
– 50% of Canadians participated in adult education and training; half were funded by employers.
36
Learning Policy Directorate, HRSDC
Conclusion
Not so good news:
– Proportion of Canadians in levels 1 and 2 did not change but the number of people rose to 9 million; so any improvement was slower than population change
– Of the 9 million Canadians, only those with very low literacy (1 million) have improved. Since there was no improvement in the
remaining 8 million, there was no change in the proportion of Canadians in levels 1 and 2.
– The average literacy scores for level 4 and 5 were lower in 2003, contributing to equity.
– Immigrants, particularly recent immigrants and immigrants whose mother tongue is neither English nor French, did poorly.
– Performance in problem solving was the worst among the 4 literacy domains.