82
Lebanon: Integrated Assessment of the Association Agreement with the EU With a focus on the olive oil sector
Lebanon: Integrated Assessment
of the Association Agreement
with the EU
With a focus on the olive oil sector

�
Preface
With greater implementation of trade liberlization agreements throughout the world, the interlinked issues of Trade, Environment and Poverty have become increasingly important for all countries, especially developing ones. Policies to reduce the negative impact of trade liberlization on specific groups and the environment are being developed throughout the world. Lebanon too is exploring new ways to ensure that trade liberlization does play key roles in enhancing the standard of living in rural areas and promoting environmentally friendly production practices.
In June 2002, Lebanon signed the EU-Lebanon Association Agreement (AA) and, in December the Agreement was ratified by the Lebanese Parliament. The objectives of the AA were to provide an appropriate framework for political dialogue between the parties; establish the conditions for the gradual liberalization of trade in goods, services, and capital; and promote economic, social, cultural, financial and monetary cooperation.1 An Interim Agreement entered into force in March 2003 allowing for immediate implementation of the economic and trade-related provisions of the AA while awaiting parliamentary ratification from all EU member states. The AA was then selected for integrated assessment because it remains a comprehensive agreement and all the studies conducted so far for it have assessed only its economic impacts but omitted social and environmental characteristics or probable inter-linkages between all three impact areas.
The study focuses on the olive oil subsector due to its importance for poverty reduction, employment creation, migration, trade, growth potential, the rural landscape, environmental implications such as waste generation and disposal, and because of willingness of stakeholders to provide necessary information and data. In 2002, the economic value of olive farming was estimated at US$176 million, or approximately 20 per cent of the value of Lebanese agricultural plant production (SRI, 2004). The assessment team surveyed procedures and agents involved in olive oil production in Lebanon (from farming to milling to marketing), determined baseline scenarios and areas of concern, and identified action plans to help the subsector reap all the benefits of the AA.
A number of major policies and projects are related to the current study and were consulted. These include the Strategic Environmental Assessment Project of the Ministry of Environment conducted in 2005, the World Bank country assessment strategy outlined in 1997, and the various programmes under the Association Agreement such as the quality project and the Small and Medium Enterprise (SME) project. Furthermore, a large number of pilot projects targeting the olive oil sector have also been carried out, including a study for the Ministry of Industry entitled “The Impact of the Euro-Mediterranean Agreement on the Olive Oil Industry in Lebanon” (Mirza, 2004).
1 Article 1 of the AA
��
Integrated Assessment of the Assoc�at�on w�th the EU - w�th a focus on the ol�ve o�l sector
The report is divided in five chapters, the first of which introduces the report and project in general. Chapter 2 briefly assesses the Lebanese socio-economic and political situation, and specifically focuses on agriculture and the olive oil sector.
Chapter 3 reviews trade liberlization policies and agreements between Lebanon and the EU as well as agreements with other countries or organizations. Chapter 4 presents the integrated assessment, forming two alternative scenarios: a baseline scenario where Lebanon does not take full advantage of the increased quota of 1,000 tonnes of olive oil to be exported duty free to the EU, and a second scenario where all necessary quality improvements are undertaken enabling these 1000 tonnes to be exported. Chapter 5 draws conclusions, makes recommendations and identifies a necessary action plan to improve the sector’s performance and increase readiness for more trade.
���
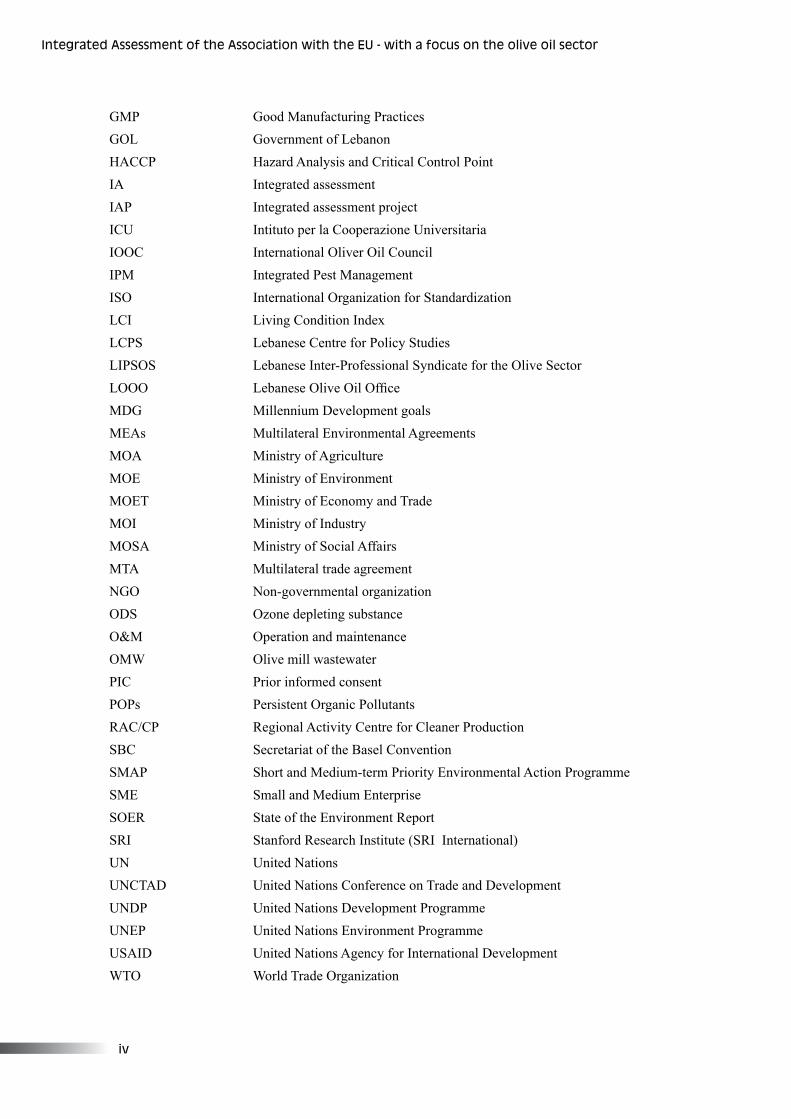
Acronyms and abbrev�at�ons
AA Association Agreement
ADP Agriculture Development Project
BOD Biological oxygen demand
CAC Codex Alimentarius Commission
CAS Central Administration of Statistics
CBA Cost benefit analysis
CBTF Capacity Building Task Force
CCIAB Chamber of Commerce, Industry, and Agriculture of Beirut and Mount Lebanon
CCT Common Customs Tariffs
CITES Convention on International Trade in Endangered Species
COD Carbon oxygen demand
DTIE Division of Technology, Industry and Economics
EC European Commission
EFTA European Free Trade Agreement
EIB European Investment Bank
ELARD Earth Link and Advanced Resources Development
ELCIM Euro-Lebanese Centre for Industrial Modernization
ENI European Neighbourhood Instrument
ENP European Neighbourhood Policy
ESCWA Economic and Social Commission for Western Asia
ESE Economic, social and environmental
ESFD Economic and Social Fund for Development
ETB Economics and Trade Branch
EU European Union
FAO Food and Agriculture Organization
FTA Free trade agreement
GAFTA Greater Arab Free Trade Area
GAP Good agricultural practices
GDP Gross Domestic Product
GHG Greenhouse gas
GMO Genetically modified organism
�v
Integrated Assessment of the Assoc�at�on w�th the EU - w�th a focus on the ol�ve o�l sector
GMP Good Manufacturing Practices
GOL Government of Lebanon
HACCP Hazard Analysis and Critical Control Point
IA Integrated assessment
IAP Integrated assessment project
ICU Intituto per la Cooperazione Universitaria
IOOC International Oliver Oil Council
IPM Integrated Pest Management
ISO International Organization for Standardization
LCI Living Condition Index
LCPS Lebanese Centre for Policy Studies
LIPSOS Lebanese Inter-Professional Syndicate for the Olive Sector
LOOO Lebanese Olive Oil Office
MDG Millennium Development goals
MEAs Multilateral Environmental Agreements
MOA Ministry of Agriculture
MOE Ministry of Environment
MOET Ministry of Economy and Trade
MOI Ministry of Industry
MOSA Ministry of Social Affairs
MTA Multilateral trade agreement
NGO Non-governmental organization
ODS Ozone depleting substance
O&M Operation and maintenance
OMW Olive mill wastewater
PIC Prior informed consent
POPs Persistent Organic Pollutants
RAC/CP Regional Activity Centre for Cleaner Production
SBC Secretariat of the Basel Convention
SMAP Short and Medium-term Priority Environmental Action Programme
SME Small and Medium Enterprise
SOER State of the Environment Report
SRI Stanford Research Institute (SRI International)
UN United Nations
UNCTAD United Nations Conference on Trade and Development
UNDP United Nations Development Programme
UNEP United Nations Environment Programme
USAID United Nations Agency for International Development
WTO World Trade Organization
v
Execut�ve summary
This integrated assessment of the Lebanon-EU Association Agreement (AA), which focuses on the Lebanese olive oil sector, is an all-embracing project to assess the socio-economic and environmental implications of opening up local subsectors to freer trade. The assessment was initiated in December 2004 and was headed by Lebanon’s Ministry of Economy and Trade (MOET) in collaboration with the Ministry of Environment (MOE), and with the technical assistance of the United Nations Environment Programme (UNEP). The project focused on the olive oil sector because of the important role it plays in the Lebanese economy, local communities and the environment.
The project aims to identify national priorities and outline action plans for Lebanon in line with European Neighbourhood Policy (ENP) guidelines. The report is targeted at policymakers and advocates (public sector bodies, private stakeholders, syndicates, cooperatives and NGOs) and aims to raise awareness of the importance of taking a more integrated approach to the design of trade policies. It therefore introduces a methodology and a framework to be used in planning, implementation and monitoring. The study illustrates how the IAP approach has been adapted to the Lebanese context but can be used in other sectors or planning processes.
The assessment process used scenario building to project the impacts (economic, social and environmental) of exporting the full quota of olive oil allowed under the EU-Lebanon Agreement and compared it to a “business as usual” baseline. Two scenarios were defined as follows: Scenario 1 accepted the state of the olive oil sector as it were, without policy measures to encourage increased duty-free exports to the EU; and Scenario 2 assumed that needed olive oil quality improvements were made in Lebanon to take full advantage of the 1,000-tonne quota, once farmers and millers are shown the benefits of the improvements. Quantitative analysis in the form of a “rapid” cost-benefit analysis was undertaken to assess the economic issues.
The findings clearly indicate that most Lebanese olive oil growers were not taking advantage of the duty-free export quota and that a range of necessary measures are urgently needed to achieve the benefits of the AA. In line with the Steering Committee recommendations, a list of priority action plans to enhance the quality of Lebanese olive oil and achieve the benefits of Scenario 2 is provided here. These action plans will need to be implemented to strengthen the sector before undertaking any further trade liberalization negotiations. The plans fall mainly within the scope of a sustainable regulatory framework that will create the incentive to produce extra-virgin olive oil by upgrading mill operations and promoting better agricultural practices.
The study also shows that the economic benefits of applying the requirements for Scenario 2 are truly substantial when considering the full implications of producing extra-virgin olive oil, above and beyond fulfilling the quota. The increase in revenues from bigger exports is perhaps insignificant in absolute terms, but when compared to revenues under Scenario 1, it is relatively considerable, reaching up to 23.8 times (US$3,500,000 projected compared to 2004’s actual revenue of US$147,000).
v�
Integrated Assessment of the Assoc�at�on w�th the EU - w�th a focus on the ol�ve o�l sector
Recommendations to improve the olive oil sector are drawn upon the identification of key bottlenecks and the views of the Steering Committee. They consist of different complementary measures to implement the action plans and successfully push reform of the sector by the EU, the Lebanese Government, the private sector and NGOs. These measures are partly in the form of continuing technical and financial assistance from the EU within the framework of the European Neighbourhood Policy (ENP), which is a commitment to enforce stakeholders’ commitment to a public-private partnership. Trade regulations such as quality standards, as well as duties and their gradual elimination, should also be communicated to all parties involved, as this ensures efficiency and lowers the incidence of rejected products. Furthermore, technical and non-trade barriers such as lengthy bureaucratic procedures should be revised and eliminated when unnecessary.
The Government of Lebanon should encourage each region in Lebanon to regionally brand its products as “unique” or “distinct” to better target niche markets (such as that of the Lebanese diaspora). The EU can encourage this endeavour by helping to create these geographic “lines” in Lebanon and also by financing the promotion of such products at European trade fairs and exhibitions. However, the major contribution should come from Lebanon’s relevant Ministries as well as the different municipalities and cooperatives concerned with olive oil production. Well within its prerogatives, the Government can create an enabling environment by improving inter-ministerial coordination. It should upgrade and certify existing testing laboratories, disseminate information to stakeholders, and build databases. It should also provide training for farmers and mill operators (such as training on good agricultural practices and good manufacturing practices), facilitate by-product management, and provide access to capital. For example, the treatment of vegetable water ought to be financed and implemented by the Government.
Centralizing decision-making on olive oil (by forming a National Olive Oil Office, for example) will go a long way in addressing all the concerns and priorities of the various stakeholders. A national policy (with respective action plans) can be formulated in which the various stakeholders are given specific responsibilities to improve the sector. The policy should be moving towards the production of better quality olive oil by decentralizing quality checks and enforcing necessary laws (on hygienic milling conditions and olive oil quality categorizing, for example).
The private sector will play a major role in achieving economies of scale, promoting fair competition, disseminating information and proposals, investing in newer technologies and production techniques, maintaining a competitive edge, coordinating with NGOs, and promoting the public-private partnership. Finally, NGOs should continue to work with the private sector to maintain efforts in raising awareness, training farmers, enhancing inter-NGO networking, disseminating information and facilitating public-private partnerships.
Lebanon’s olive oil sector is currently facing tremendous hardships in the form of high production costs, regional competition, sub-standard quality output which does not permit exports (including to Europe), and a lack of proper coordination and management by the main actors in the field. Such hardships exacerbate the already severe socio-economic concerns in the region like unemployment, poverty, a weakening quality of life and rural-urban migration. The findings of the assessment have stressed the need to strengthen the sector by implementing a number of key regulatory and policy improvements that bring the olive oil sector up to export quality standards. Many of the initiatives proposed will also have positive environmental implications and optimize the socio-economic benefits of the AA.
v��
Acknowledgements
This publication is based on the results from the Integrated Assessment and Planning (IAP) project implemented in Lebanon from January 2004. UNEP would like to begin by thanking all institutions and individuals who provided help throughout the duration of the project and also extend its deepest gratitude to the Ministry of Agriculture and the Ministry of Environment for their support and willingness to share and provide all the necessary information throughout the project.
UNEP would also like to acknowledge Joey Ghaleb, the Project Manager, for his devotion and efforts during the project, and Alissar Chaker, UNDP project manager at the Ministry of Environment and Makram Malaeb, Senior Policy Component Manager at the Ministry of Economy and Trade for all the valuable information and time they gave throughout the project.
Acknowledgements also go to individuals in the Ministry of Agriculture, particularly Myriam Eid, Agrofood production expert; Rania Bizreh at the Lebanese Chamber of Commerce; Sleiman Dagher, president of LIPSOS; Karim Hamoud, olive oil production expert at LIPSOS; Jose Antonio Villaverde, Resident Representative; Hussain Hoteit, agrofood engineer at the Instituto par la cooperazione Universitaria (ICU), and James Billing Director of the SRI in Lebanon.
UNEP also wishes to gratefully acknowledge all the people who shared ideas, time and opinions with the project team including Francisco Acosta Soto, European Union; Carol Chouchani Cherfane, ESCWA, and Lamia Chammas from the Ministry of Environment. UNEP also expresses its deepest appreciation to the millers and farmers involved in this project for their cooperation. UNEP thanks all the stakeholders for their active participation in the workshops.
An international group of experts provided important input to the project. UNEP would like to express its gratitude to members of this group: Jiri Dusik, Jan Joost Kessler, Barry Sadler and Salah el Serafy, for their time, effort, and advice, including comments on the draft version of this report.
UNEP also wishes to gratefully acknowledge the Norwegian Ministry of Foreign Affairs and the Government of the United States of America for their financial support, through the mechanism of UNEP-UNCTAD Capacity Building Task Force on Trade, Environment and Development (CBTF), which made the project in Lebanon possible. At UNEP, the project was initiated and under the overall supervision of Hussein Abaza. Maria Cecilia Pineda, Fulai Sheng and Asad Naqvi coordinated this project and provided technical support. Desiree Leon facilitated the processing of the report for editing and typesetting. Rahila Mughal provided administrative support for the project.
v���
Integrated Assessment of the Assoc�at�on w�th the EU - w�th a focus on the ol�ve o�l sector
UNEP’s appreciation also goes to Andrea Smith for editing the report and to Ho Hui Lin of iPublish Pte Ltd for providing editorial and typesetting services.
Notwithstanding the valuable contributions of many acknowledged here, the full responsibility for the content of this report remains with the authors.
�x
Un�ted Nat�ons Env�ronment Programme
The United Nations Environment Programme (UNEP) is the overall coordinating environmental organization of the United Nations system. Its mission is to provide leadership and encourage partnerships in caring for the environment, by inspiring, informing, and enabling nations and people to improve their quality of life without compromising that of future generations. In accordance with its mandate, UNEP works to observe, monitor, and assess the state of the global environment; improve the scientific understanding of how environmental change occurs; and in turn, determine how such change can be managed by action-oriented national policies and international agreements. UNEP’s capacity building work thus centres on helping countries strengthen environmental management in diverse areas, which include freshwater and land resource management; the conservation and sustainable use of biodiversity, marine and coastal ecosystem management; and cleaner industrial production and eco-efficiency, among many others.
UNEP, headquartered in Nairobi, Kenya, marked its first 30 years of service in 2002. During this time, in partnership with a global array of collaborating organizations, UNEP achieved major advances in the development of international environmental policy and law, environmental monitoring and assessment, and our understanding of the science of global change. This work also supports the successful development and implementation of the world’s major environmental conventions. In parallel, UNEP administers several multilateral environmental agreements (MEAs), including the Vienna Convention’s Montreal Protocol on Substances that Deplete the Ozone Layer, the Convention on International Trade in Endangered Species of Wild Fauna and Flora (CITES), the Basel Convention on the Control of Transboundary Movements of Hazardous Wastes and their Disposal (SBC), the Convention on Prior Informed Consent Procedure for Certain Hazardous Chemicals and Pesticides in International Trade (Rotterdam Convention, PIC), the Cartagena Protocol on Biosafety to the Convention on Biological Diversity, and the Stockholm Convention on Persistent Organic Pollutants (POPs).
Division of Technology, Industry and EconomicsThe mission of the Division of Technology, Industry and Economics (DTIE) is to encourage decision makers in government, local authorities and industry to develop and adopt policies, strategies, and practices that are cleaner and safer, make efficient use of natural resources, ensure environmentally sound management of chemicals, and reduce pollution and risks for humans and the environment. In addition, it seeks to enable implementation of conventions and international agreements and encourage the internalization of environmental costs. UNEP DTIE’s strategy in carrying out these objectives is to influence decision-making through partnerships with other international organizations, governmental authorities, business and industry, and NGOs; facilitate knowledge management through networks; support implementation of conventions; and work closely with UNEP regional offices. The Division, with its Director and Division Office in Paris, consists of one centre and five branches located in Paris, Geneva and Osaka.
x
Integrated Assessment of the Assoc�at�on w�th the EU - w�th a focus on the ol�ve o�l sector
Economics and Trade Branch The Economics and Trade Branch (ETB) is one of the five branches of DTIE. Its mission is to enhance the capacities of developing countries and transition economies to integrate environmental considerations into development planning and macroeconomic policies, including trade policies. ETB helps countries develop and use integrated assessment and incentive tools for achieving poverty reduction and sustainable development. The Branch further works to improve our understanding of environmental, social, and economic effects of trade liberalization and the effects of environmental policies on trade, and works to strengthen coherence between Multilateral Environmental Agreements and the World Trade Organization. ETB also helps enhance the role of the financial sector in moving towards sustainability. Through its finance initiatives, ETB also helps enhance the role of the financial sector in moving towards sustainability.
For more information on the general programme of the Economics and Trade Branch, please contact:
Hussein AbazaChief, Economics and Trade Branch (ETB)Division of Technology, Industry and Economics (DTIE)United Nations Environment Programme (UNEP)11-13 Chemin des Anemones1219 Chatelaine/GenevaTel : 41-22-917 81 79Fax : 41-22-917 80 76http://www.unep.ch/etb
x�
Table of contents
Preface ..................................................................................................................................... i
Acronyms and abbreviations ...................................................................................... iii
Executive summary .......................................................................................................... v
Acknowledgements .......................................................................................................... vii
United Nations Environment Programme ........................................................... ix
Table of contents ............................................................................................................... xi
List of tables ......................................................................................................................... xiii
List of figures ....................................................................................................................... xiii
List of boxes ......................................................................................................................... xiv
Map ............................................................................................................................................. xiv
1. Introduction .................................................................................................................... 1
1.1 About this report ............................................................................................................. 1
1.2 Background to the project .............................................................................................. 1
1.2.1 Project objectives ............................................................................................... 2
1.2.2 Assessment team ................................................................................................ 3
1.3 Development of methodology ....................................................................................... 4
1.3.1 Scenario analysis ................................................................................................ 4
1.3.2 Cost-benefit analysis .......................................................................................... 4
1.4 Lebanon: A brief introduction ........................................................................................ 5
1.4.1 Agriculture and the agri-food industry in Lebanon ............................................ 5
2. Trade liberalization in Lebanon ........................................................................... 9
2.1 Lebanese-EU AA ........................................................................................................... 10
2.2 European Neighbourhood Policy (ENP) ........................................................................ 12
2.3 Other trade agreements .................................................................................................. 13
3. Overview of olive oil production in Lebanon .............................................. 15
3.1 Socio-economic characteristics of olive producers ........................................................ 16
x��
Integrated Assessment of the Assoc�at�on w�th the EU - w�th a focus on the ol�ve o�l sector
3.1.1 Poverty as indicator ............................................................................................ 17
3.1.2 Education as indicator ........................................................................................ 18
3.1.3 Employment and migration as indicators ........................................................... 19
3.2 Production, hectarage and yields ................................................................................... 20
3.3 Costs, prices and profits ................................................................................................ 21
3.3.1 Farming and milling costs .................................................................................. 21
3.3.2 Domestic and international pricing strategies .................................................... 22
3.4 International trade patterns ............................................................................................ 24
3.4.1 Export volumes and trends ................................................................................. 24
3.4.2 Import volumes and trends ................................................................................. 25
3.5 Quality cooperation between mills and farmers ............................................................ 25
3.6 Environmental issues ..................................................................................................... 26
3.6.1 Environmental concerns from olive oil production ............................................ 26
3.6.2 Environmental concerns from olive oil milling ................................................. 28
4. Integrated assessment ........................................................................................ 31
4.1 Scenario 1 ....................................................................................................................... 31
4.1.1 Social impacts .................................................................................................... 32
4.1.2 Environmental impacts ....................................................................................... 33
4.2 Scenario 2 ....................................................................................................................... 34
4.2.1 Economic impacts .............................................................................................. 36
4.2.2 Social impacts .................................................................................................... 37
4.2.3 Enviromental impacts ......................................................................................... 41
4.3 Summary of the scenario analysis .................................................................................. 44
4.4 Cost-benefit analysis ...................................................................................................... 44
5. Integrated assessment ........................................................................................ 47
5.1 General recommendations ............................................................................................. 47
5.2 Specific recommendations to support implementation of action plans ......................... 48
5.3 Conclusions .................................................................................................................... 49
5.4 Follow-up ....................................................................................................................... 50
References ............................................................................................................................... 51
Annex 1: Outline of quality management systems - HACCP & IS0 9001:2000 .................... 54
Annex 2: Treating olive mill wastewater and pomace technologies ...................................... 56
Annex 3: Cost categories of applying ELCIM assumptions .................................................. 59
Annex 4: Identification of key bottlenecks, possible action plans and expected
outcomes of scenario 2 ........................................................................................................... 63
Annex 5: Steering Committee members and stakeholder contact details ............................... 65
x���
List of tables
Table 1: Agricultural output (thousand tonnes) ...................................................................... 6
Table 2: Active Lebanese population (%) working in the agricultural sector ........................ 7
Table 3: Living condition index based on degrees of satisfaction .......................................... 18
Table 4: Illiteracy rates in Lebanon, 2001 .............................................................................. 19
Table 5: Youth migration intentions ........................................................................................ 19
Table 6: Percentage (%) of total crop output in each province in Lebanon ............................ 20
Table 7: Olive production indicators (1997-2002) ................................................................. 21
Table 8: Costs of olive production in Lebanon (US$ per ha) ................................................. 22
Table 9: Olive oil retailer and consumer prices (1999-2004) ................................................. 23
Table 10: Price chain .............................................................................................................. 23
Table 11: Lebanese olive oil exports ...................................................................................... 25
Table 12: Lebanese olive oil imports ...................................................................................... 25
Table 13: Use of agricultural pesticides in Lebanon (2000) ................................................... 26
Table 14: Pesticide use per hectare: A comparative view ....................................................... 27
Table 15: Mass balance of the three olive oil extraction systems............................................ 28
Table 16: Common Customs Tariffs (CCT) ............................................................................ 31
Table 17: Net economic benefits from fulfilling the full EU quota ......................................... 36
Table 18: Lebanese olive oil distribution for 2002 ................................................................. 37
Table 19: Environmental protection through good agricultural practices .............................. 41
Table 20: Framework for Integrated Pest Management (IPM) ............................................... 42
Table 21: Indicator matrix under two alternative scenarios .................................................... 44
Table 22: Total costs of applying ELCIM assumptions .......................................................... 45
Table A1.1: Principles of ISO9001:2000 ................................................................................ 55
Table A2.1: Olive mill wastewater treatment technologies .................................................... 56
Table A2.2: Favourability matrix for the selection of OMW treatment techniques ............... 57
Table A2.3: Treatment technologies and end-uses of pomace and their costs ........................ 58
List of figures
Figure 1: Agriculture added value to total GDP ..................................................................... 6
Figure 2: Base salary in agriculture and by districts ............................................................... 7
Figure 3: Percentage of worker’s income from various sources: A comparative illustration . 8
Figure 4: Trade trends in Lebanon .......................................................................................... 9
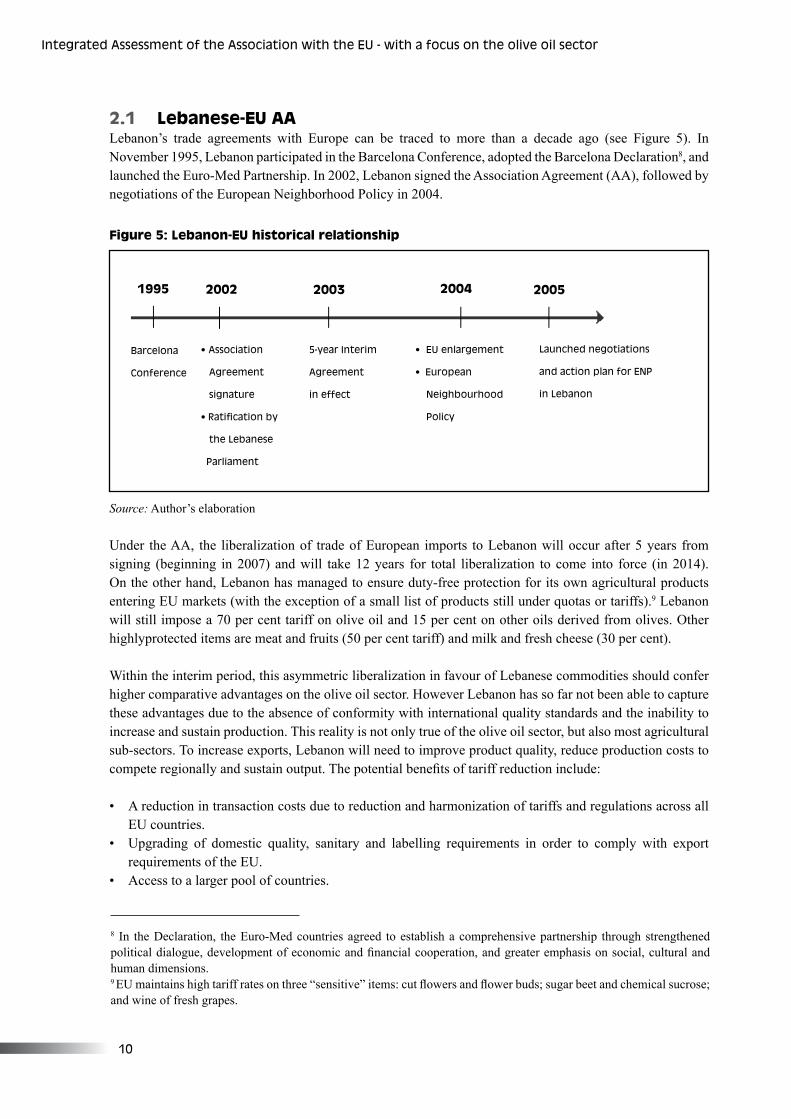
Figure 5: Lebanon-EU historical relationship ........................................................................ 10
Figure 6: Production chain and respective stakeholders ......................................................... 16
Figure 7: Consumption and production of olive oil by EU .................................................... 24
Figure 8: Lebanese virgin olive oil exports to the EU ............................................................ 32
Figure 9: Impact of each production stage on quality ............................................................ 36
Table of contents
x�v
Integrated Assessment of the Assoc�at�on w�th the EU - w�th a focus on the ol�ve o�l sector
Figure 10: Poverty in the olive oil sector ................................................................................. 38
Figure 11: Household distribution and budget allocation ........................................................ 39
Figure 12: Youth unemployment rates by region (2002) ......................................................... 40
Figure 13: Mapping of organizational issues ........................................................................... 49
List of boxes Box 1: Project on integrated management of olive oil production waste ............................... 29
Box 2: Case study: Impacts of olive oil processing in the Hasbaya region ............................ 34
Map Map 1: Geographic distribution of olive cultivation areas ..................................................... 17
�
�. Introduct�on
1.1 About this report This report presents the results of an integrated assessment of the impacts of trade liberalization on Lebanon’s olive oil sector, specifically the projected effect of the Euro-Mediterranean Association Agreement (AA) between the EU and Lebanon signed in 2002. The AA permits 1,000 tonnes of duty-free olive oil to be exported from Lebanon to the EU, but Lebanon has so far not taken full advantage of this market opportunity. In order to do so, Lebanon needs to improve product quality, reduce production costs and sustain output volume and consistency. The aim of the report is thus to present an analysis of the situation and outline a clear set of policy recommendations and measures necessary to strengthen the olive oil sector, and improve the quality and quantity of olive oil produced including exports.
The report is divided into 5 chapters. Chapter 1 introduces the project and provides a brief background of the Lebanese socio-economic and political situation with detailed focus on agriculture and the olive oil sector. Chapter 2 discusses Lebanon’s approach to trade liberalization and reviews the agreements between Lebanon and the EU as well as relevant agreements with other countries or organizations. Chapter 3 presents an overview of Lebanon’s olive oil subsector and describes the production chain from farming to processing to marketing. Chapter 4 discusses the results of the integrated assessment and Chapter 5 outlines recommendations and measures to be undertaken to improve the sector’s performance and increase readiness for more trade liberalization. Finally, some general conclusions and suggestions for follow-up are summarized.
The report is targeted at policymakers and advocates (public sector bodies, private stakeholders, syndicates, cooperatives and NGOs) to raise awareness of an integrated approach to the design of trade policies that takes into account key social and environmental issues in addition to economic concerns.
1.2 Background to the projectThe project was initiated in December 2004 by the Ministry of Economy and Trade (MOET) in collaboration with the Ministry of Environment (MOE) and United Nations Environment Programme (UNEP). In June 2002, Lebanon signed the EU-Lebanon Association Agreement (AA) and, in December the Agreement was ratified by the Lebanese Parliament. The objective of the AA was to provide an appropriate framework for political dialogue with Europe; establish the conditions for the gradual liberalization of trade in goods, services, and capital; and promote economic, social, cultural, financial and monetary cooperation.1 An Interim Agreement entered into force in March 2003 allowed for the immediate implementation of economic and trade-related provisions of the AA while awaiting parliamentary ratification from all EU member states. The AA was selected for integrated assessment because it was created as an comprehensive agreement and allows study of economic, social and environment impacts and inter-linkages beyond all earlier studies.
1 Article 1 of the AA.
�
Integrated Assessment of the Assoc�at�on w�th the EU - w�th a focus on the ol�ve o�l sector
The project focused on the olive oil sector because of the important role it plays in the Lebanese economy, local communities and the environment, including poverty reduction, employment generation, migration, magnitude of trade, growth potential, the rural landscape, and environmental implications such as waste generation and disposal. Moreover, the keen willingness of stakeholders in the olive oil industry to provide necessary information and available data smoothed the way for an assessment. In 2002, the economic value of olive farming was estimated at US$176 million, or approximately 20 per cent of the total value of Lebanese agricultural plant production (SRI, 2004). The procedures and agents involved in olive oil production in Lebanon (from farming to milling to marketing) were surveyed to identify areas of concern and accordingly, action plans.
A number of major policies and projects are related to the current study and were studied. These included the Strategic Environmental Assessment Project of the Ministry of Environment (MOE) conducted in 2005, the World Bank country assessment strategy outlined in 1997, and the various programmes under the Association Agreement. Furthermore, a large number of pilot projects targeting the olive oil sector have also been carried out, for example a study for the Ministry of Industry (MOI) entitled, “The Impact of the Euro-Mediterranean Agreement on the Olive Oil Industry in Lebanon” (Mirza, 2004).
The Euro-Lebanese Centre for Industrial Modernization (ELCIM) also undertook an evaluation of necessary action plans to improve quality of olive oil, disseminate better farming practices (including the introduction of Integrated Pest Management) and enhance marketability of Lebanese olive oil. This study also features a comprehensive inventory of the costs involved in implementing such action plans. Moreover, the Stanford Research Institute (SRI) conducted a rapid appraisal of the olive oil sector in Lebanon (SRI, 2004), and unveiled ways to produce a higher proportion of extra-virgin olive oil. SRI is also intensively involved in various projects to improve olive oil quality, and enhance its marketability and export potential.
Furthermore, a Lebanese National Agricultural Policy termed the “Green Plan” was initiated in 1995 to provide assistance to farmers and rural communities in agricultural land development and in rural road construction, in line with environmental protection. On one hand, land development activities were undertaken through cost sharing arrangements with the farmer who would complete a land reclamation and assistance application and pay a percentage contribution before start-up of works. On the other hand, agricultural roads executed by the Green Plan were usually short roads that improved access of rural communities to their land.
The contribution of the current IAP project over previous studies is that it takes a holistic approach to the assessment of the olive oil sector by integrating socio-economic implications with environmental ones as the consequences of opening up trade through the AA.
1.2.1 Project objectives• Identify national priorities and action plans to increase exports under the AA• Propose complementary measures to support implementation of action plans• Promote cooperation between relevant government entities• Enhance active stakeholder participation • Develop a country-specific methodology that can be replicated in other sectors or planning processes.
�
1.2.2 Assessment teamThe assessment team was led by MOET in collaboration with MOE, and with technical support from UNEP. A Steering Committee was established to coordinate the work and two workshops were held to permit thorough and on-the-ground understanding of the sector as a whole.
Members of the Steering Committee were as follows:
• Georges Khoury, Director General by intermediary, Ministry of Industry • Marilyse Chehab, Economic Researcher, Ministry of Industry • Ghazi Freij, Ministry of Social Affairs • James Billings, Director, Lebanon Office SRI International • Mariam Eid, Agro-food production expert, Ministry of Agriculture • Rabih Sabra, Head of agriculture/agroindustry department, CCIB • Saleem Hamadeh, Regional Coordinator, UNDP-Ministry of Environment • Karim Hammoud, SILO advisor and coordinator Vitech consulting s.a.l • Sleiman El-Daher, President SILO.
A multi-disciplinary team comprising of a wide range of stakeholders was established, and included representatives from the following organizations and institutions:
• Association of Lebanese Industrialists - Saad Ouyeenni • Central Administration of Statistics (CAS) - Ziad Abdallah • Chamber of Commerce, Industry and Agriculture of Beirut
o Rabih Sabra, Head of Agriculture/Agro Industry Departmento Rania Bizri, Economic Researchero Nassima Ghanem, Head of Library and Documentation Departmento Albert Nasr, EU Experto Hana Haidar, EU Database
• Cortas Trader - Raja Cortas • Economic and Social Fund for Development (ESFD)
o Lara Abou Saifan, Communication and Public Relations Officer o Racha Chahine o Hassam Omar
• European Commission Delegation - Fransisco Acosta, Economic and Political Coordinator• Instituto par la cooperazione Universitaria (ICU; Italian NGO)
o Jose Antonio Villaverde, Resident Representative o Hussain Hoteit, Agrofood Engineer
• Ministry of Agriculture - Myriam Eid • Ministry of Environment
o Saleem Hamadeh, Regional Coordinatoro Alissar Chaker, Project Managero Lamia Chamas
• Ministry of Industry o Georges Khoury, Acting Director General o Marilyse Chehab, Economic Researcher
Introduct�on
�
Integrated Assessment of the Assoc�at�on w�th the EU - w�th a focus on the ol�ve o�l sector
• Ministry of Social Affairs o Joumana Kalot, NGO Liaison Officer o Hachem el Hussein, Technical Expert o Mazhar Haraké, Project Managero Ghazi Freij
• Rene Moawad Foundation o Fady Yarak, Executive Director o Delphine Copain
• Lebanese Interprofessionnal Syndicate of Olive Oil (SILO) - Sleiman El-Daher, SILO President• SRI International - James Billings, Director, Lebanon Office• Syndicate of Agro-Food - George Nasraoui • Vitech Consulting s.a.l - Karim Hammoud, SILO Advisor and Coordinator.
1.3 Development of methodologyThis study is an ex ante assessment of the projected impacts of increasing olive oil exports under the EU-Lebanon AA, which permits Lebanon to export 1,000 tonnes of extra-virgin olive oil to the EU duty-free while allowing the country to impose a 70 per cent tariff rate on EU olive oil.
Lebanon does not currently take full advantage of the terms offered under the AA, exporting only 27 tonnes to the EU in 2005.2 In order to achieve the maximum increase in exports, certain policy measures will need to be implemented. A scenario analysis was carried out to determine the projected impacts (economic, social and environmental) of exporting the full quota of olive oil allowed under the EU-Lebanon Agreement and compared it to a “business as usual” baseline. Due to limited data availability, both qualitative and quantitative techniques were used in the analysis. A rapid cost-benefit analysis was also performed to assess the economic impacts using quantitative data found in the action plans funded by ELCIM.3
1.3.1 Scenario analysisTwo scenarios were defined as follows:
• Scenario 1 accepted the state of the olive oil sector as it currently stands, without policy measures to encourage increased duty-free exports to the EU.
• Scenario 2 assumed that needed olive oil quality improvements are made in Lebanon to take full advantage of the 1,000-tonne quota, once farmers and millers are shown the benefits of the improvements.
The scenario analysis was based on qualitative data compiled from comprehensive stakeholder consultations, focus group meetings, fieldwork and literature reviews.
1.3.2 Cost-benefit analysis A ‘rapid’ cost benefit analysis was carried out to assess the economic impacts using quantitative data from the ELCIM study which outlined 7 action plans to improve the quality and export potential of Lebanon’s olive oil.
2 For comparison, Lebanon exported 42 tonnes of virgin olive oil to the EU in 2004. 3 Daher S., Dragotta A., Gabr M. and Hammoud K. (2004) prepared these action plans for the Lebanese Inter-Professional Syndicate for the Olive Sector (LIPSOS). They were funded by The European Commission Delegation. These actions plan will be referred to as “ELCIM”.
�
1.4 Lebanon: A brief introduction Lebanon is a relatively small country with a diverse population of about 4 million inhabitants (including 17 different ethnic and religious communities). It is a Republic with 3 branches of government: the Legislative, the Executive, and the Judiciary with positions distributed among the different religious and sectarian groups (Euro-Med Partnership, 2002).
The Lebanese civil war spanned a period of 15 years (1975-1990), damaging the socio-economic conditions of Lebanese citizens and destroying most of the country’s infrastructure. Since the cessation of war in 1990, substantial progress has taken place in rehabilitating and expanding war-torn physical infrastructure. All major public services are operating again (although not very efficiently), including basic education and health care. Internal security is also restored. A sound banking system and a resilient small and medium-scale manufacturing sector have facilitated this economic recovery. Family remittances, banking services, exports and international aid are the main sources of foreign exchange.
The Government of Lebanon (GOL), however, still faces serious challenges. It has funded reconstruction by borrowing heavily, mostly from domestic banks. Debt stands currently at over US$37 billion, or over 167 per cent of annual GDP. In the meantime, it has not managed to privatize many of its inefficient public sector services. The servicing of the public debt and the relatively large portion of the national budget allocated to salaries and wages, along with known geo-political realities, have taken its toll on unemployment. Significant poverty and income disparities exist as the society is increasingly split between the very rich and the poor. According to the World Bank’s crude Living Condition Index which measures the degree of satisfaction with basic needs, 32 per cent of Lebanese households were at the low end of the index, 42 per cent were at the intermediate level while 26 per cent were at the high end.4 A UN study calculated that 35 per cent of the population lacked basic needs, i.e. they lived below a poverty line of minimum living standards.5 There are an estimated one million poor in Lebanon today, of whom 75 per cent are urbanized. Economic growth and reconstruction have favoured some regions, notably parts of the Beirut region, at the expense of large parts of the country. Growth has also favoured the services sectors over the more traditional labour-intensive activities in agriculture and industry.
Unemployment, officially given as 8 per cent, is at least double this figure according to some studies, and is highest amongst the young.6 Tight monetary policy, a narrow tax base and economic recession have led to declining real incomes of many salary earners. Illiteracy rates range from 11 per cent to 15 per cent (see forward to Table 4) in the more disadvantaged areas of the Bekaa, and South and North Lebanon, and is most grave amongst women (Kasparian, 2002).
Public welfare programmes and social safety nets, largely non-existent in Lebanon, are narrowly based, and often subject to mismanagement. Remittances from expatriates go some way to alleviating the situation amongst underprivileged communities. There is no national health care policy. The system favours equipment, curative and tertiary services driven by the supply of an abundant private sector, rather than primary health care and prevention (Euro-Med Partnership, 2002).
1.4.1 Agriculture and the agro-food industry in Lebanon Agriculture in Lebanon plays an important (albeit declining) role in the Lebanese economy, contributing 5.8 per cent of GDP (MOET, 2002), employing about 6.7 per cent of the total labour force (USJ, 2002)
4 Ministry of Social Affairs – UNDP Lebanon, 1998.5 ibid.6 CAS, 1997.
Introduct�on
�
Integrated Assessment of the Assoc�at�on w�th the EU - w�th a focus on the ol�ve o�l sector
% of GDP
�.�0
�.�0
�.�0
�.00
�.80
�.�0
�.�0
�997 �998 �999 �000 �00� �00�
Nature of crop product �997 �998 �999 �999 �99� �99�
Cereals 88.� �0�.� 9�.7 ��0.� �7�.0 ���.9
Legum�nous �0.� �0.� ��.8 ��.0 ��.� ��.�
vegetables
Vegetables ����.7 ����.� ���0.0 ��07.7 �07�.9 ��0�.�
Plants for ��9.7 ���.0 �8�.� ���.� �0.9 ��.�
manufactur�ng
Fru�ts ��0�.� 98�.7 �0��.0 899.� 8��.� 8��.�
Ol�ves 9�.� �0.� ��.� �89.� 8�.� �8�.�
Others ��.8 - - �9.� ��.� �9.8
Total ��00 �87� �8�9.� �78�.� ��0�.7 ����.�
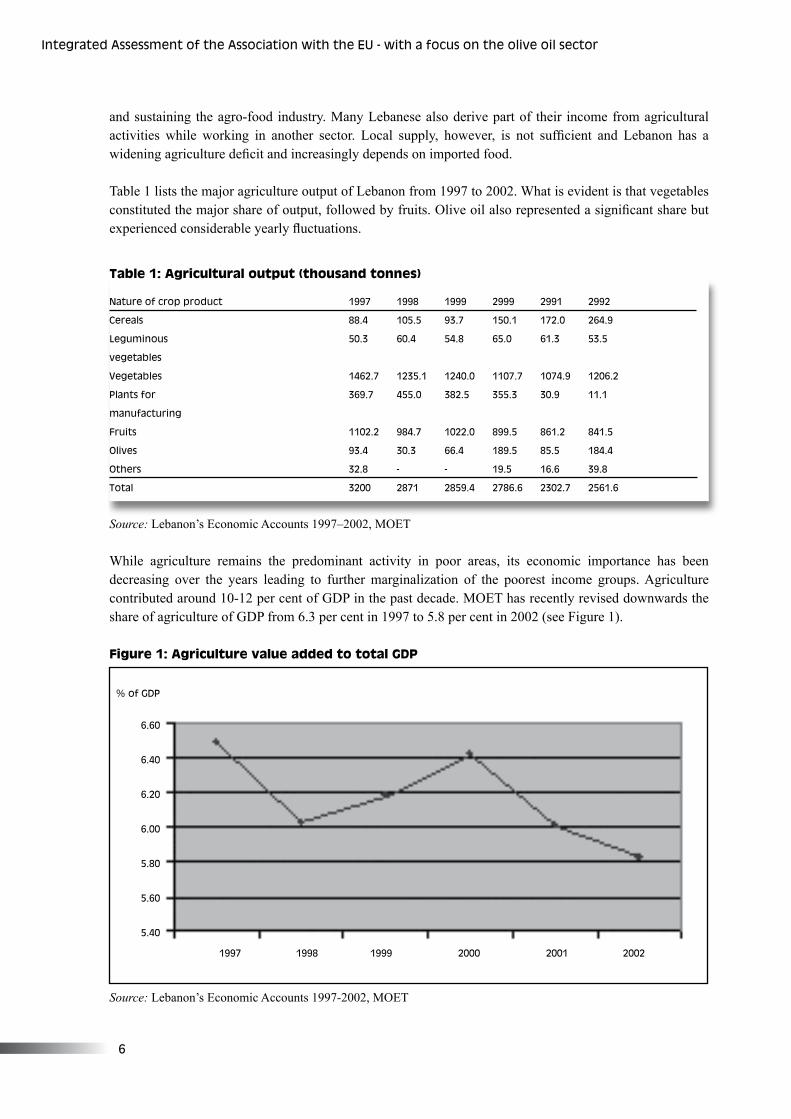
and sustaining the agro-food industry. Many Lebanese also derive part of their income from agricultural activities while working in another sector. Local supply, however, is not sufficient and Lebanon has a widening agriculture deficit and increasingly depends on imported food.
Table 1 lists the major agriculture output of Lebanon from 1997 to 2002. What is evident is that vegetables constituted the major share of output, followed by fruits. Olive oil also represented a significant share but experienced considerable yearly fluctuations.
Table 1: Agricultural output (thousand tonnes)
Source: Lebanon’s Economic Accounts 1997–2002, MOET
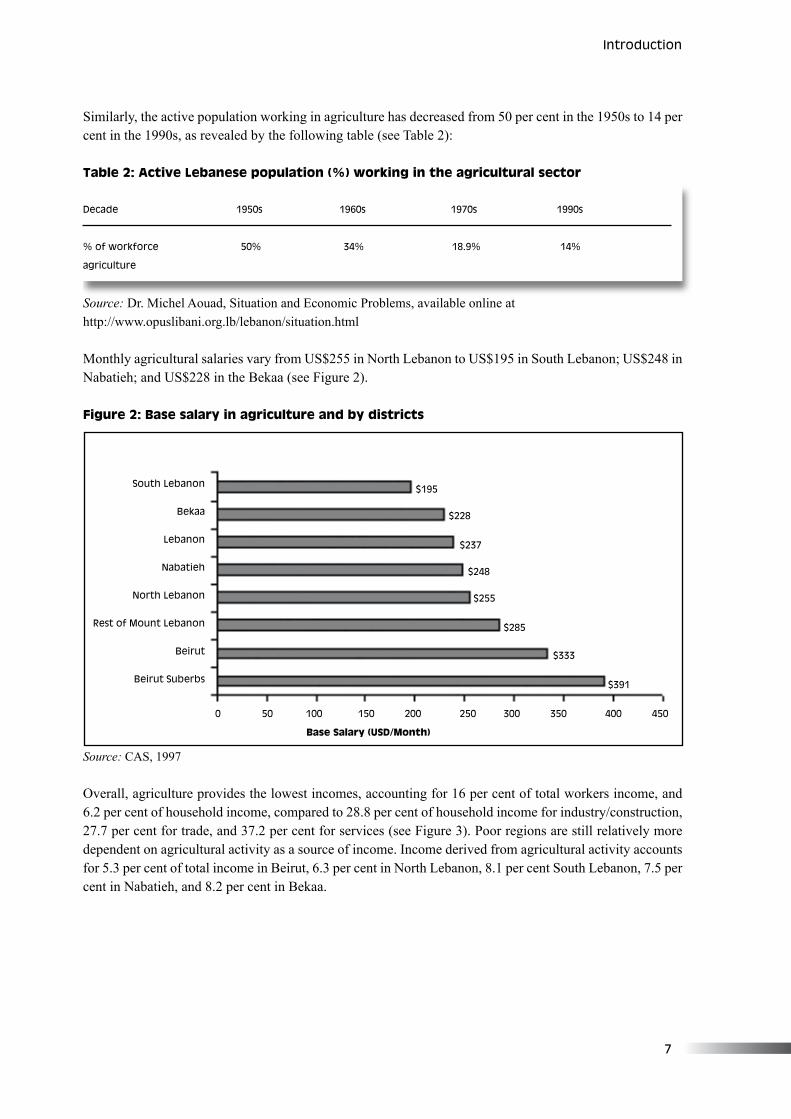
While agriculture remains the predominant activity in poor areas, its economic importance has been decreasing over the years leading to further marginalization of the poorest income groups. Agriculture contributed around 10-12 per cent of GDP in the past decade. MOET has recently revised downwards the share of agriculture of GDP from 6.3 per cent in 1997 to 5.8 per cent in 2002 (see Figure 1).
Figure 1: Agriculture value added to total GDP
Source: Lebanon’s Economic Accounts 1997-2002, MOET
7
Similarly, the active population working in agriculture has decreased from 50 per cent in the 1950s to 14 per cent in the 1990s, as revealed by the following table (see Table 2):
Table 2: Active Lebanese population (%) working in the agricultural sector
Source: Dr. Michel Aouad, Situation and Economic Problems, available online at http://www.opuslibani.org.lb/lebanon/situation.html
Monthly agricultural salaries vary from US$255 in North Lebanon to US$195 in South Lebanon; US$248 in Nabatieh; and US$228 in the Bekaa (see Figure 2).
Figure 2: Base salary in agriculture and by districts
Source: CAS, 1997
Overall, agriculture provides the lowest incomes, accounting for 16 per cent of total workers income, and 6.2 per cent of household income, compared to 28.8 per cent of household income for industry/construction, 27.7 per cent for trade, and 37.2 per cent for services (see Figure 3). Poor regions are still relatively more dependent on agricultural activity as a source of income. Income derived from agricultural activity accounts for 5.3 per cent of total income in Beirut, 6.3 per cent in North Lebanon, 8.1 per cent South Lebanon, 7.5 per cent in Nabatieh, and 8.2 per cent in Bekaa.
Decade �9�0s �9�0s �970s �990s
% of workforce �0% ��% �8.9% ��%
agr�culture
South Lebanon
Bekaa
Lebanon
Nabat�eh
North Lebanon
Rest of Mount Lebanon
Be�rut
Be�rut Suberbs
$�9�
$��8
$��7
$��8
$���
$�8�
$���
$�9�
0 �0 �00 ��0 �00 ��0 �00 ��0 �00 ��0
Base Salary (USD/Month)
Introduct�on
8
Integrated Assessment of the Assoc�at�on w�th the EU - w�th a focus on the ol�ve o�l sector
Figure 3: Percentage of worker’s income from various sources: A comparative illustration
Source: Lebanon’s Economic Accounts 1997- 2002, MOET
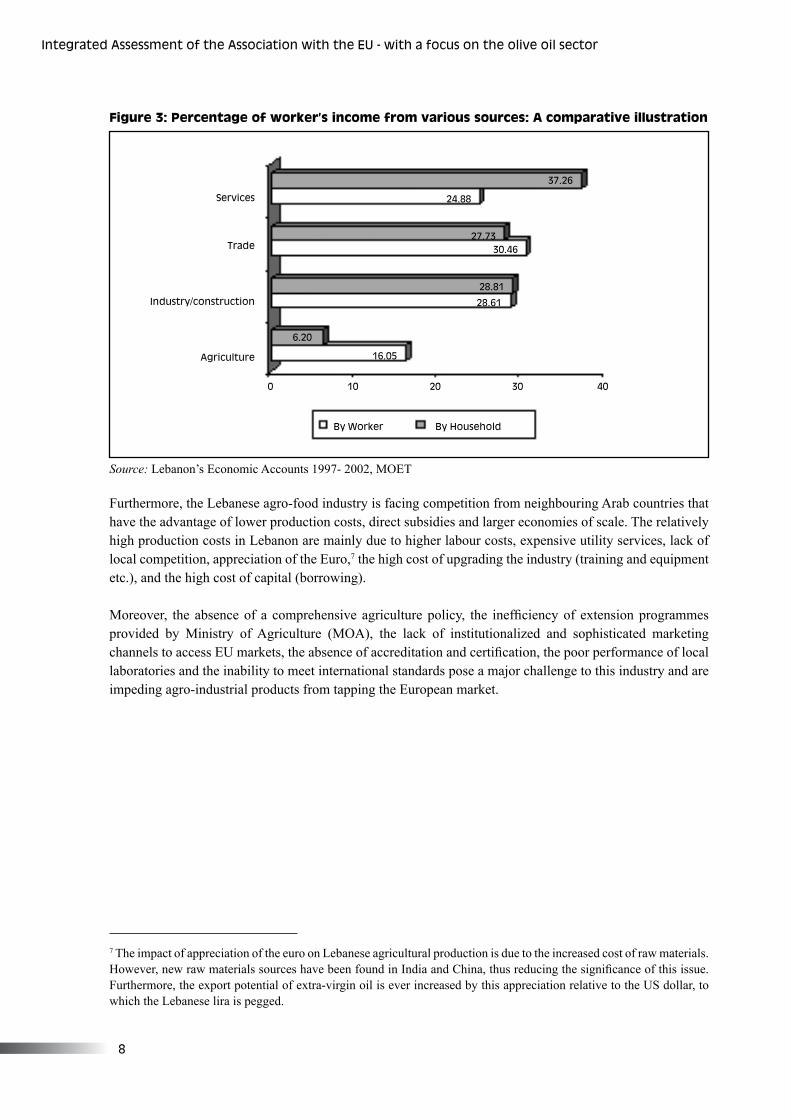
Furthermore, the Lebanese agro-food industry is facing competition from neighbouring Arab countries that have the advantage of lower production costs, direct subsidies and larger economies of scale. The relatively high production costs in Lebanon are mainly due to higher labour costs, expensive utility services, lack of local competition, appreciation of the Euro,7 the high cost of upgrading the industry (training and equipment etc.), and the high cost of capital (borrowing).
Moreover, the absence of a comprehensive agriculture policy, the inefficiency of extension programmes provided by Ministry of Agriculture (MOA), the lack of institutionalized and sophisticated marketing channels to access EU markets, the absence of accreditation and certification, the poor performance of local laboratories and the inability to meet international standards pose a major challenge to this industry and are impeding agro-industrial products from tapping the European market.
Serv�ces
Trade
Industry/construct�on
Agr�culture
�7.��
��.88
�7.7� �0.��
�8.8�
�8.��
�.�0
��.0�
By Worker By Household
0 �0 �0 �0 �0
7 The impact of appreciation of the euro on Lebanese agricultural production is due to the increased cost of raw materials. However, new raw materials sources have been found in India and China, thus reducing the significance of this issue. Furthermore, the export potential of extra-virgin oil is ever increased by this appreciation relative to the US dollar, to which the Lebanese lira is pegged.
9
�. Trade l�beral�zat�on �n Lebanon
��,000.000
�0,000,000
8,000,000
�,000,000
�,000,000
�,000,000
-�997 �998 �999 �000 �00� �00� �00� �00� �00�
Total exports Total �mports
9,�9�,9�� 9,��9,8�9
7,��8,�98
�,���,77�
7,�9�,07�
�.�0�,���7,0��,�9�7,���,�7�
���,�8� ��0,9�9 �7�,777 7��,��� 889,�99 �,0��,�9��,���,9�� �,7�7,0�9 �,879,7��
�.��7,9�0
The Lebanese Government is a strong advocate of trade liberalization. A number of trade agreements have been agreed bilaterally and regionally, for example the Association Agreement with Europe (AA), the European Neighbourhood Policy and the Greater Arab Free Trade Area (GAFTA), as well as multilateral mechanisms such as the expected accession to the World Trade Organization (WTO) in 2006.
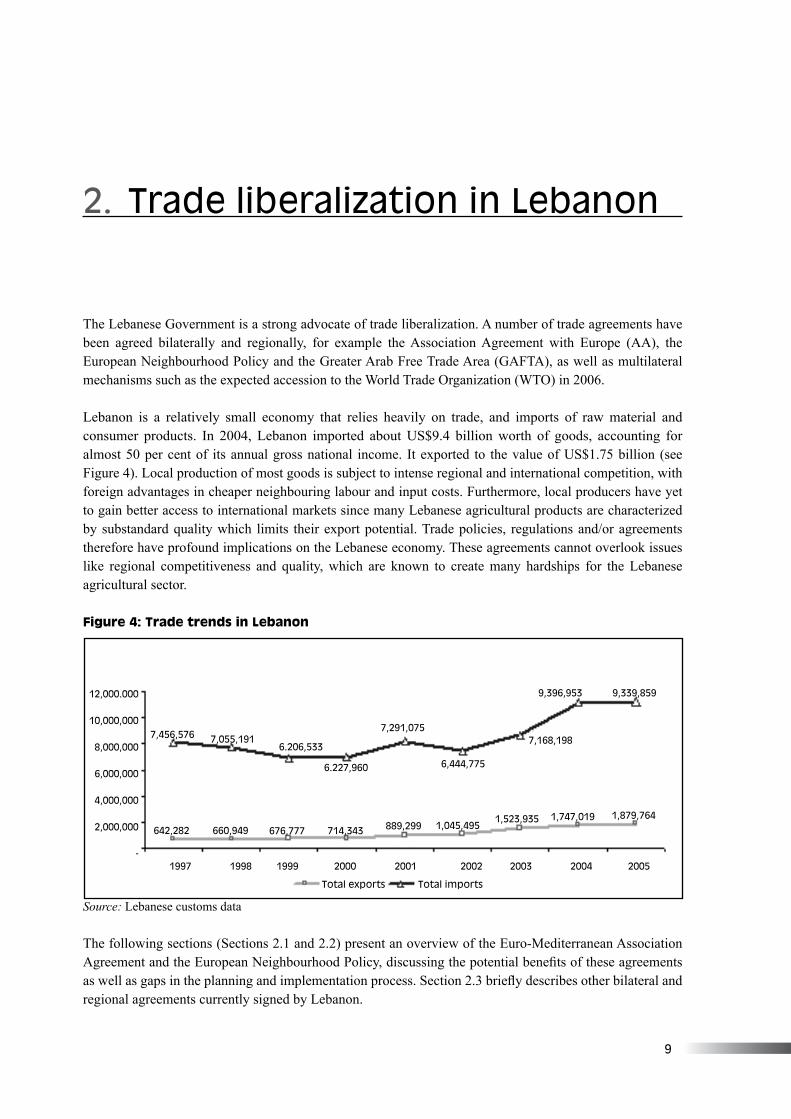
Lebanon is a relatively small economy that relies heavily on trade, and imports of raw material and consumer products. In 2004, Lebanon imported about US$9.4 billion worth of goods, accounting for almost 50 per cent of its annual gross national income. It exported to the value of US$1.75 billion (see Figure 4). Local production of most goods is subject to intense regional and international competition, with foreign advantages in cheaper neighbouring labour and input costs. Furthermore, local producers have yet to gain better access to international markets since many Lebanese agricultural products are characterized by substandard quality which limits their export potential. Trade policies, regulations and/or agreements therefore have profound implications on the Lebanese economy. These agreements cannot overlook issues like regional competitiveness and quality, which are known to create many hardships for the Lebanese agricultural sector.
Figure 4: Trade trends in Lebanon
Source: Lebanese customs data
The following sections (Sections 2.1 and 2.2) present an overview of the Euro-Mediterranean Association Agreement and the European Neighbourhood Policy, discussing the potential benefits of these agreements as well as gaps in the planning and implementation process. Section 2.3 briefly describes other bilateral and regional agreements currently signed by Lebanon.
�0
Integrated Assessment of the Assoc�at�on w�th the EU - w�th a focus on the ol�ve o�l sector
Source: Author’s elaboration
Under the AA, the liberalization of trade of European imports to Lebanon will occur after 5 years from signing (beginning in 2007) and will take 12 years for total liberalization to come into force (in 2014). On the other hand, Lebanon has managed to ensure duty-free protection for its own agricultural products entering EU markets (with the exception of a small list of products still under quotas or tariffs).9 Lebanon will still impose a 70 per cent tariff on olive oil and 15 per cent on other oils derived from olives. Other highlyprotected items are meat and fruits (50 per cent tariff) and milk and fresh cheese (30 per cent).
Within the interim period, this asymmetric liberalization in favour of Lebanese commodities should confer higher comparative advantages on the olive oil sector. However Lebanon has so far not been able to capture these advantages due to the absence of conformity with international quality standards and the inability to increase and sustain production. This reality is not only true of the olive oil sector, but also most agricultural sub-sectors. To increase exports, Lebanon will need to improve product quality, reduce production costs to compete regionally and sustain output. The potential benefits of tariff reduction include:
• A reduction in transaction costs due to reduction and harmonization of tariffs and regulations across all EU countries.
• Upgrading of domestic quality, sanitary and labelling requirements in order to comply with export requirements of the EU.
• Access to a larger pool of countries.
1995
Barcelona
Conference
• Assoc�at�on
Agreement
s�gnature
• Ratification by
the Lebanese
Parl�ament
2002 2003
�-year Inter�m
Agreement
�n effect
• EU enlargement
• European
Ne�ghbourhood
Pol�cy
2004
Launched negot�at�ons
and act�on plan for ENP
�n Lebanon
2005
8 In the Declaration, the Euro-Med countries agreed to establish a comprehensive partnership through strengthened political dialogue, development of economic and financial cooperation, and greater emphasis on social, cultural and human dimensions.9 EU maintains high tariff rates on three “sensitive” items: cut flowers and flower buds; sugar beet and chemical sucrose; and wine of fresh grapes.
2.1 Lebanese-EU AA Lebanon’s trade agreements with Europe can be traced to more than a decade ago (see Figure 5). In November 1995, Lebanon participated in the Barcelona Conference, adopted the Barcelona Declaration8, and launched the Euro-Med Partnership. In 2002, Lebanon signed the Association Agreement (AA), followed by negotiations of the European Neighborhood Policy in 2004.
Figure 5: Lebanon-EU historical relationship
��
For the Lebanese economy, the AA constitutes an important milestone in the development of a more dynamic trade and economic partnership with the EU. The agreement will help Lebanon realize a greater part of its export potential. Furthermore, Lebanon will benefit from technology transfer and EU know-how resulting from foreign direct investments as well as from technical and financial cooperation projects. The agreement is expected to help strengthen the Lebanese economy and serve as a catalyst for reform.
The implementation phase of the AA has increasingly involved key stakeholders through a series of mise-à-niveau workshops and projects aimed at maximizing the benefits of trade liberalization. The projects address the quality of exported goods, consumer protection, intellectual property rights, upgrading, small and medium enterprise, and rules of origin aimed at facilitating trade.
For olive oil, the AA should increase the incentive of farmers, mill operators and traders to meet international standards and compete in foreign markets. There is now greater potential for high quality Lebanese olive oil to enter niche markets in Europe and other regions in the world (North America and Australia). Because trade liberalization is unilateral, Lebanon should take this opportunity to develop its olive oil sector. From olive growers to millers, wholesalers, retailers, exporters, and consumers, the AA is an opportunity for a new production dynamic with good agricultural practices, pricing incentives, and local and regional economic development.
Improving the quantity and quality of olive oil supply will require the labour force to be educated on better agricultural practices, technology where applicable (e.g. pruning machinery), and coordination between farmers and mill operators. Socially, the AA offers a multifaceted framework for social and cultural cooperation. It aims at promoting social security, healthcare systems and the empowerment of women. The projects major issue addressed in the AA is the improvement of labour relations and work conditions. Moreover, many EU funded projects aim at improving poverty reduction in Lebanon’s most deprived regions, which will contribute to improving living conditions in rural areas.
Environmentally, the AA seeks to protect water quality in the Mediterranean Sea and manage water resources. The agreement entails specific policies oriented towards improving wastewater treatment facilities, reducing industrial pollution, raising environmental awareness and developing a sound environmental policy.
Throughout the negotiation process of the AA, the Government of Lebanon engaged the main agro-food stakeholders through regular consultations as well as direct involvement in the negotiation process. Moreover, the Government now promotes the agro-food sector in foreign markets through export fairs and involves delegations in events aimed at facilitating market access to Lebanese products.
However, the following gaps in the planning process have been identified:
• When assessing the impact of trade liberalization on the economy, the social and environmental dimensions were overlooked, resulting in an absence of accompanying measures to address those concerns.
• Follow-up consultations with the private sector are not regular.
• The dissemination of information needs to be improved, including a need to clarify the EU regulations on agro-food export for producers.
• There is an absence of monitoring and assessment of the initial impact of trade liberalization on the agro-food industry.
Trade l�beral�zat�on �n Lebanon
��
Integrated Assessment of the Assoc�at�on w�th the EU - w�th a focus on the ol�ve o�l sector
• Regulatory and lengthy bureaucratic procedures have led to delays in technical assistance aimed at facilitating trade through upgrading programmes.
• There is a lack of financial incentives and other necessary measures to address private sector requirements, hindering the efficiency of the AA policy.
2.2 European Neighbourhood Policy (ENP) The enlargement of the EU (with the entry of ten new countries in May 200410) created opportunities, posed challenges and affected Europe’s geopolitical relations with its neighbours, including Lebanon. There was no doubt that enlarging the EU would increase diversity and bring with it a different outlook on important issues such as labour market policies and trade agreements (with non-EU members). This would necessitate an efficient decision-making and governance mechanism that would ensure that “more” did not mean “less”. Hence the ENP was developed to address this new reality and build upon existing cooperation with Mediterranean partners. The EU has proposed a new and developed mechanism to govern its relations with its immediate ring of neighboring countries, and is also offering a stake in its internal market in return for closer integration and harmonization.
The ENP policy, first outlined by the European Commission in its Communication on Wider Europe in March 2003, demonstrates the high priority that the EU accords to future relations with its neighbours. Substantially increased financial assistance and a single dedicated European Neighbourhood and Partnership Instrument support implementation of this policy. The ENP’s objective (implemented through country Action Plans) is to share the benefits of the enlargement with neighbouring countries for the benefit of all parties concerned. It is designed to prevent the emergence of new dividing lines between the enlarged EU and its neighbours and offer greater political, security, economic and cultural cooperation.11 The Lebanese Government has officially welcomed the ENP for deepening of bilateral and regional integration.
The method to implement the ENP is to define with each partner country a national set of priorities, whose fulfillment will bring them closer to the EU without offering membership. These priorities are incorporated in jointly agreed Action Plans. These action plans build on mutual commitment to common values such as the rule of law, good governance, the respect of human rights, and the promotion of market economy and sustainable development. Engagement is introduced progressively and is conditional on mutually agreed targets for reform. Action Plans are revised approximately every 3 years and progress is monitored through a set of benchmarking indices, to ensure consistent approaches.
While the historic relationship between Lebanon and the EU has been strengthened by the AA, the ENP will bring about considerable value in all aspects of sustainable development. The ENP stands to offer Lebanon an even larger window of opportunities. It is expected to:
• Offer a higher stake in the EU internal market• Upgrade the scope and the intensity of political cooperation• Harmonize economic legislation and eliminate all trade barriers• Increase financial support, including infrastructure investment support through the European Investment
Bank (EIB)• Provide technical assistance
10 Poland, Czech Republic, Slovakia, Hungry, Latvia, Lithuania, Estonia, Cyprus, Malta and Slovenia. 11 Available from: http://europa.eu.int/comm/world/enp/policy_en.htm.
��
• Develop the transport, energy and information society sectors and networks• Strengthen cooperation in science and technology.12
The Mesures d’Accompagnement (MEDA) programme is the main financial assistance instrument for Mediterranean partner countries to implement the Partnership and Action Plans. As of 2007, a new financial instrument will be created amalgating all existing instruments. The new European Neighborhood Instrument (ENI) will build on existing cross-border programmes such as partnership, multi-annual programming and co-financing. Its main elements will be the promotion of sustainable development; coordinating action against common challenges such as environment, public health and the prevention and fight of organized crime; ensuring efficient and secure common borders; and promoting exchanges. The planning process for ENP is in its early stages at the time of writing.
2.3 Other trade agreements Two other major trade agreements are important to Lebanon:
• Greater Arab Free Trade Area (GAFTA). GAFTA was launched to promote a free trade area among 17 Arab countries, and was implemented in January 2005. All other non-trade barriers (administrative, quotas and monetary) are eliminated through the GAFTA agreement. Agro-food products are duty-free, but must meet standards of quality, certification and administration required of GAFTA. Lebanese exports to the EU (through the AA) are heavily influenced by the implications of trade liberalization with GAFTA. The competition faced by domestic producers of olive oil is crippling, and therefore weakens the capacity and incentive to export to the EU. The need to survive has led domestic producers to undertake severe cost minimizing strategies, often undercutting the quality of the olive oil and thus the credentials to enter the highly taste and certification-conscious EU markets.
• World Trade Organization (WTO). In February 1999, the Lebanese Government submitted its application for accession to the WTO. Since then MOET has led the negotiations by formulating a masterplan for accession and establishing a department to supervise the process expected to take shape at end of 2006.
12 Available from: http://www.dellbn.cec.eu.int/en/pev/information.htm.
Trade l�beral�zat�on �n Lebanon

��
�. Overv�ew of ol�ve o�l product�on �n Lebanon
The olive oil sector was selected for analysis because it remains an important economic and cultural, not to mention traditional, activity in many regions in Lebanon. Each region in Lebanon prides itself on indigenous olive trees and therefore a distinct type of olive oil. The environment (soil, altitude, climate and cultural practices) also produces special characteristics and tastes distinct to each region. Farmers favour olive tree growing because it does not require much management and day-to-day care once the seedlings are established, and also no irrigation since most areas under cultivation are rain-fed. Therefore, olive oil production is often associated with regions with poor access to water.13
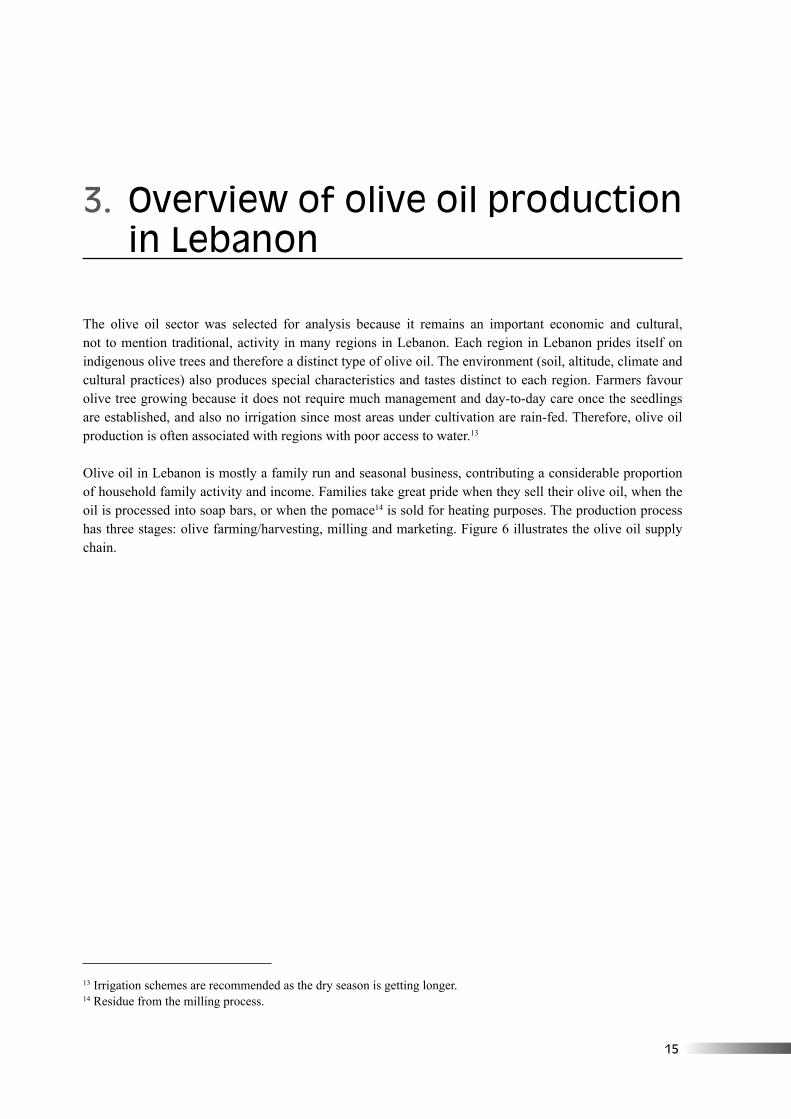
Olive oil in Lebanon is mostly a family run and seasonal business, contributing a considerable proportion of household family activity and income. Families take great pride when they sell their olive oil, when the oil is processed into soap bars, or when the pomace14 is sold for heating purposes. The production process has three stages: olive farming/harvesting, milling and marketing. Figure 6 illustrates the olive oil supply chain.
13 Irrigation schemes are recommended as the dry season is getting longer. 14 Residue from the milling process.
��
Integrated Assessment of the Assoc�at�on w�th the EU - w�th a focus on the ol�ve o�l sector
Figure 6: Production chain and respective stakeholders
Source: MOET
The growing world demand for ethnic and health-oriented food products has allowed Lebanese olive oil to make inroads into international markets and occupy niche positions, although supply has not increased to take full advantage of the demand. Moreover, many important socio-economic implications related to olive oil production have been identified, including the participation of women and minority groups in the labour force, rural-urban migration, and poverty alleviation.
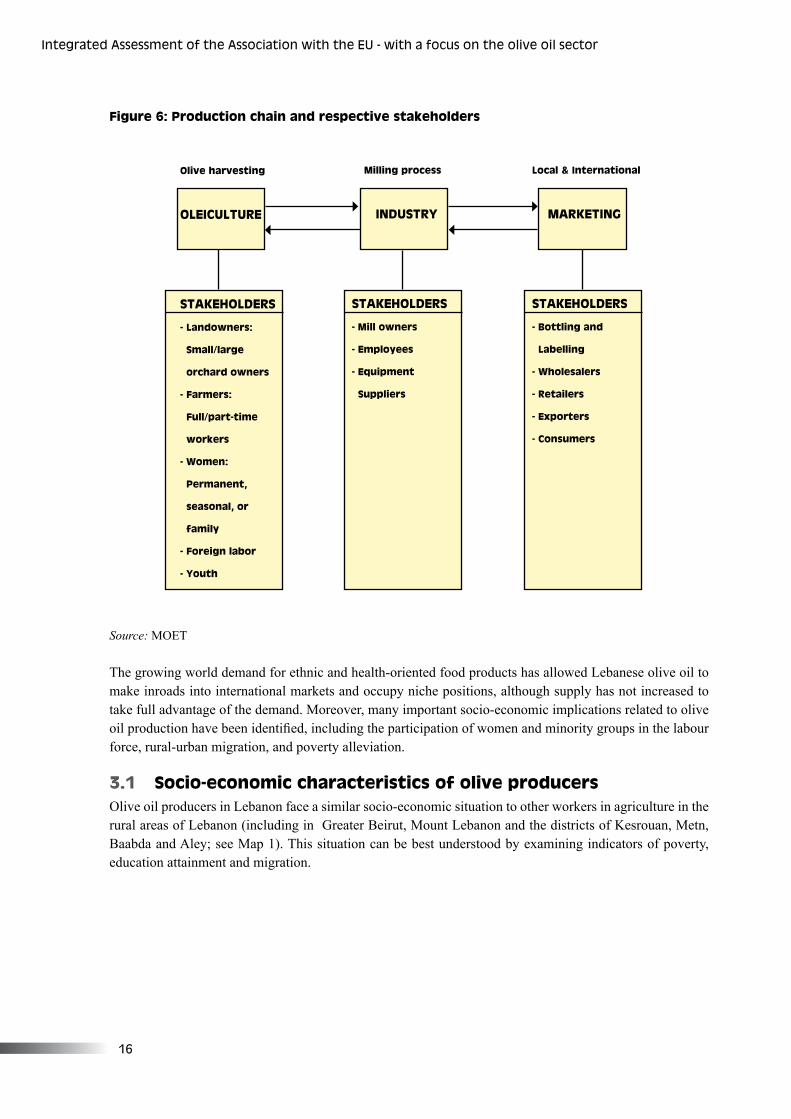
3.1 Socio-economic characteristics of olive producers Olive oil producers in Lebanon face a similar socio-economic situation to other workers in agriculture in the rural areas of Lebanon (including in Greater Beirut, Mount Lebanon and the districts of Kesrouan, Metn, Baabda and Aley; see Map 1). This situation can be best understood by examining indicators of poverty, education attainment and migration.
Olive harvesting
OLEICULTURE
STAKEHOLDERS
- Landowners:
Small/large
orchard owners
- Farmers:
Full/part-time
workers
- Women:
Permanent,
seasonal, or
family
- Foreign labor
- Youth
Milling process
INDUSTRY
STAKEHOLDERS
- Mill owners
- Employees
- Equipment
Suppliers
Local & International
MARKETING
STAKEHOLDERS
- Bottling and
Labelling
- Wholesalers
- Retailers
- Exporters
- Consumers
�7
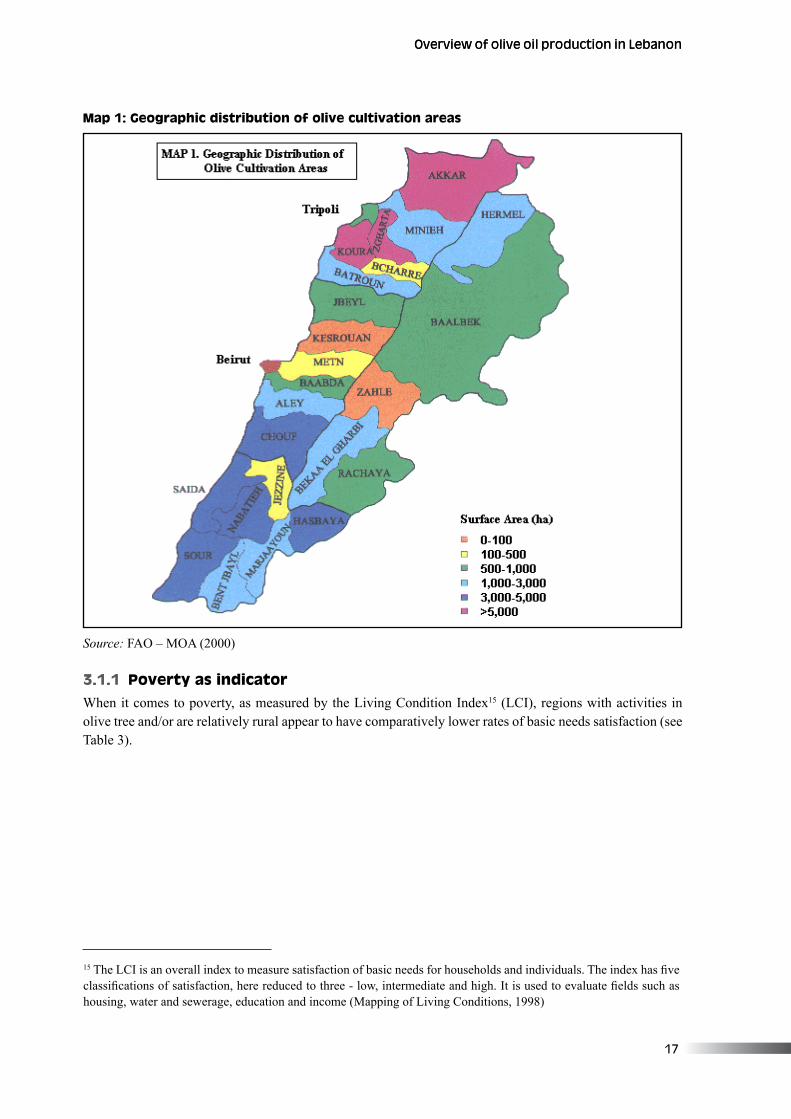
Map 1: Geographic distribution of olive cultivation areas
Source: FAO – MOA (2000)
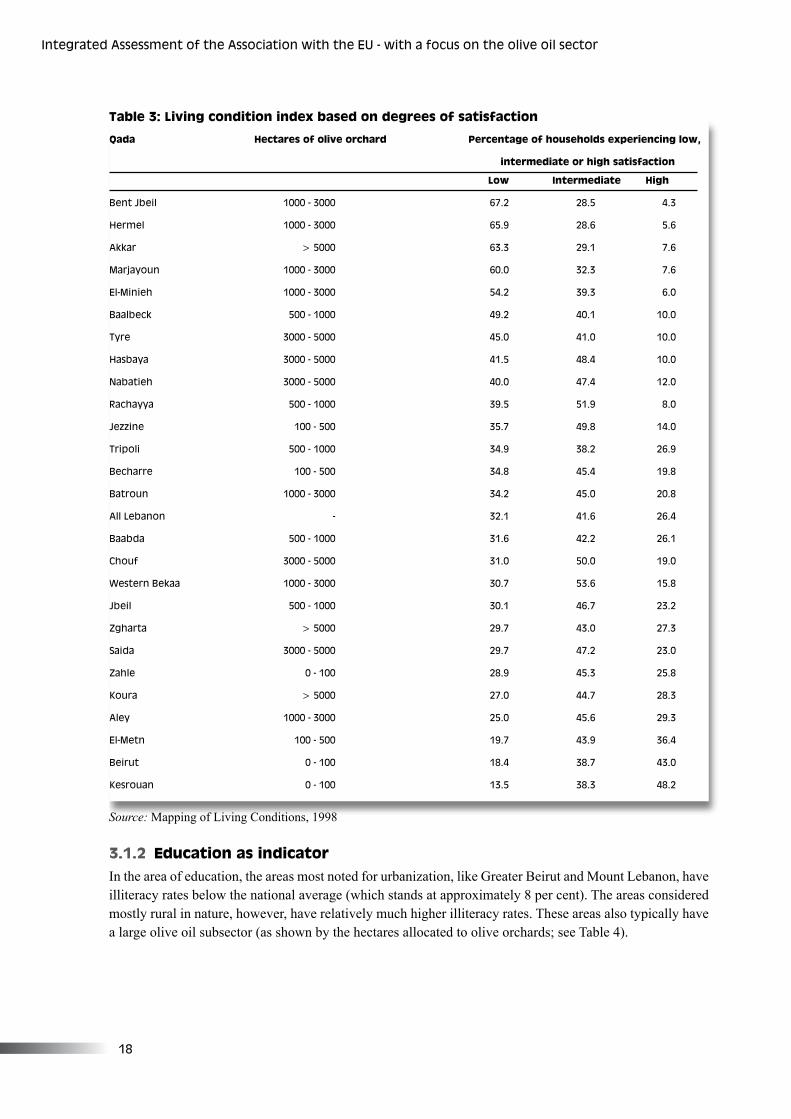
3.1.1 Poverty as indicatorWhen it comes to poverty, as measured by the Living Condition Index15 (LCI), regions with activities in olive tree and/or are relatively rural appear to have comparatively lower rates of basic needs satisfaction (see Table 3).
15 The LCI is an overall index to measure satisfaction of basic needs for households and individuals. The index has five classifications of satisfaction, here reduced to three - low, intermediate and high. It is used to evaluate fields such as housing, water and sewerage, education and income (Mapping of Living Conditions, 1998)
Overv�ew of ol�ve o�l product�on �n LebanonOverv�ew of ol�ve o�l product�on �n Lebanon
�8
Integrated Assessment of the Assoc�at�on w�th the EU - w�th a focus on the ol�ve o�l sector
Qada Hectares of olive orchard Percentage of households experiencing low,
intermediate or high satisfaction
Low Intermediate High
Bent Jbe�l �000 - �000 �7.� �8.� �.�
Hermel �000 - �000 ��.9 �8.� �.�
Akkar > �000 ��.� �9.� 7.�
Marjayoun �000 - �000 �0.0 ��.� 7.�
El-M�n�eh �000 - �000 ��.� �9.� �.0
Baalbeck �00 - �000 �9.� �0.� �0.0
Tyre �000 - �000 ��.0 ��.0 �0.0
Hasbaya �000 - �000 ��.� �8.� �0.0
Nabat�eh �000 - �000 �0.0 �7.� ��.0
Rachayya �00 - �000 �9.� ��.9 8.0
Jezz�ne �00 - �00 ��.7 �9.8 ��.0
Tr�pol� �00 - �000 ��.9 �8.� ��.9
Becharre �00 - �00 ��.8 ��.� �9.8
Batroun �000 - �000 ��.� ��.0 �0.8
All Lebanon - ��.� ��.� ��.�
Baabda �00 - �000 ��.� ��.� ��.�
Chouf �000 - �000 ��.0 �0.0 �9.0
Western Bekaa �000 - �000 �0.7 ��.� ��.8
Jbe�l �00 - �000 �0.� ��.7 ��.�
Zgharta > �000 �9.7 ��.0 �7.�
Sa�da �000 - �000 �9.7 �7.� ��.0
Zahle 0 - �00 �8.9 ��.� ��.8
Koura > �000 �7.0 ��.7 �8.�
Aley �000 - �000 ��.0 ��.� �9.�
El-Metn �00 - �00 �9.7 ��.9 ��.�
Be�rut 0 - �00 �8.� �8.7 ��.0
Kesrouan 0 - �00 ��.� �8.� �8.�
Table 3: Living condition index based on degrees of satisfaction
Source: Mapping of Living Conditions, 1998
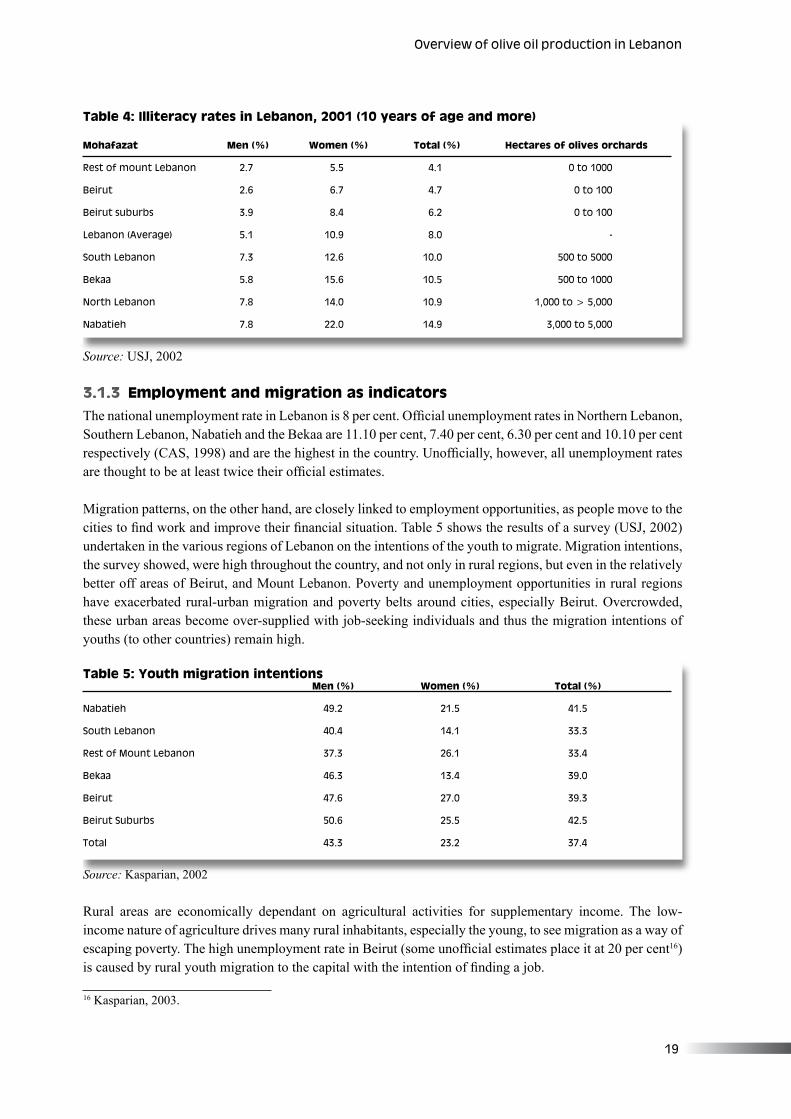
3.1.2 Education as indicatorIn the area of education, the areas most noted for urbanization, like Greater Beirut and Mount Lebanon, have illiteracy rates below the national average (which stands at approximately 8 per cent). The areas considered mostly rural in nature, however, have relatively much higher illiteracy rates. These areas also typically have a large olive oil subsector (as shown by the hectares allocated to olive orchards; see Table 4).
�9
Mohafazat Men (%) Women (%) Total (%) Hectares of olives orchards
Rest of mount Lebanon �.7 �.� �.� 0 to �000
Be�rut �.� �.7 �.7 0 to �00
Be�rut suburbs �.9 8.� �.� 0 to �00
Lebanon (Average) �.� �0.9 8.0 -
South Lebanon 7.� ��.� �0.0 �00 to �000
Bekaa �.8 ��.� �0.� �00 to �000
North Lebanon 7.8 ��.0 �0.9 �,000 to > �,000
Nabat�eh 7.8 ��.0 ��.9 �,000 to �,000
Men (%) Women (%) Total (%)
Nabat�eh �9.� ��.� ��.�
South Lebanon �0.� ��.� ��.�
Rest of Mount Lebanon �7.� ��.� ��.�
Bekaa ��.� ��.� �9.0
Be�rut �7.� �7.0 �9.�
Be�rut Suburbs �0.� ��.� ��.�
Total ��.� ��.� �7.�
16 Kasparian, 2003.
Table 4: Illiteracy rates in Lebanon, 2001 (10 years of age and more)
Source: USJ, 2002
3.1.3 Employment and migration as indicatorsThe national unemployment rate in Lebanon is 8 per cent. Official unemployment rates in Northern Lebanon, Southern Lebanon, Nabatieh and the Bekaa are 11.10 per cent, 7.40 per cent, 6.30 per cent and 10.10 per cent respectively (CAS, 1998) and are the highest in the country. Unofficially, however, all unemployment rates are thought to be at least twice their official estimates.
Migration patterns, on the other hand, are closely linked to employment opportunities, as people move to the cities to find work and improve their financial situation. Table 5 shows the results of a survey (USJ, 2002) undertaken in the various regions of Lebanon on the intentions of the youth to migrate. Migration intentions, the survey showed, were high throughout the country, and not only in rural regions, but even in the relatively better off areas of Beirut, and Mount Lebanon. Poverty and unemployment opportunities in rural regions have exacerbated rural-urban migration and poverty belts around cities, especially Beirut. Overcrowded, these urban areas become over-supplied with job-seeking individuals and thus the migration intentions of youths (to other countries) remain high.
Table 5: Youth migration intentions
Source: Kasparian, 2002
Rural areas are economically dependant on agricultural activities for supplementary income. The low-income nature of agriculture drives many rural inhabitants, especially the young, to see migration as a way of escaping poverty. The high unemployment rate in Beirut (some unofficial estimates place it at 20 per cent16) is caused by rural youth migration to the capital with the intention of finding a job.
Overv�ew of ol�ve o�l product�on �n Lebanon
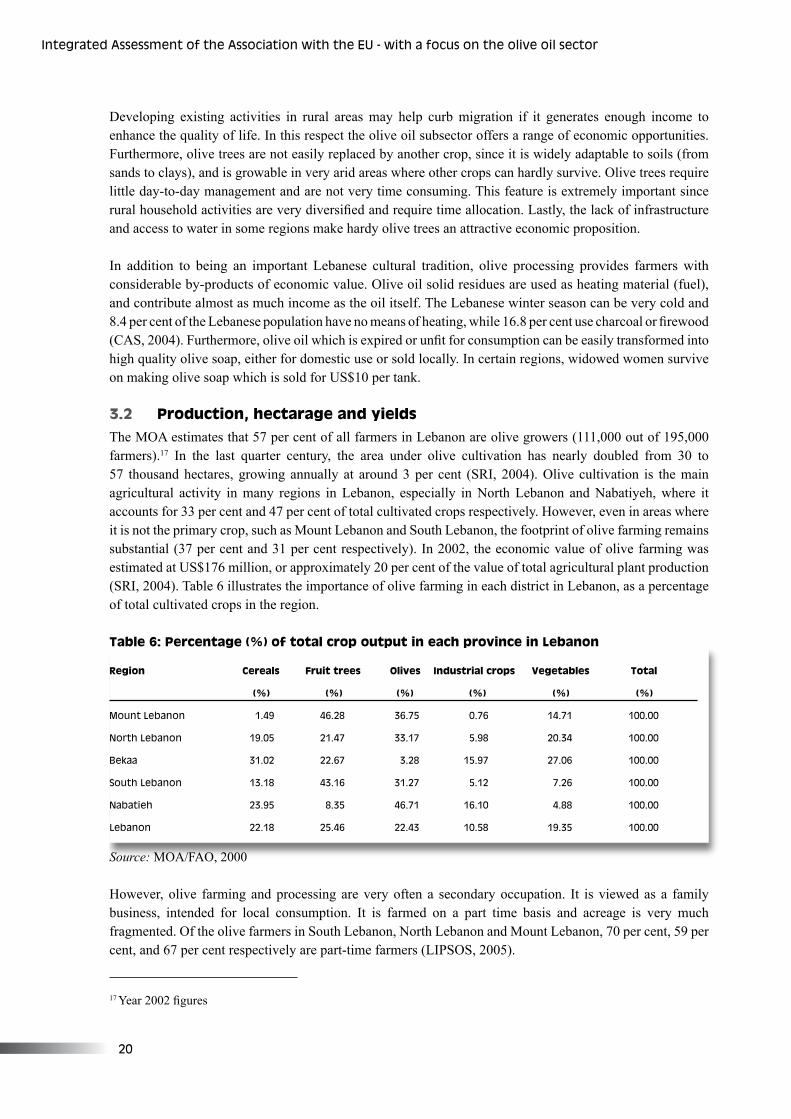
�0
Integrated Assessment of the Assoc�at�on w�th the EU - w�th a focus on the ol�ve o�l sector
17 Year 2002 figures
Region Cereals Fruit trees Olives Industrial crops Vegetables Total
(%) (%) (%) (%) (%) (%)
Mount Lebanon �.�9 ��.�8 ��.7� 0.7� ��.7� �00.00
North Lebanon �9.0� ��.�7 ��.�7 �.98 �0.�� �00.00
Bekaa ��.0� ��.�7 �.�8 ��.97 �7.0� �00.00
South Lebanon ��.�8 ��.�� ��.�7 �.�� 7.�� �00.00
Nabat�eh ��.9� 8.�� ��.7� ��.�0 �.88 �00.00
Lebanon ��.�8 ��.�� ��.�� �0.�8 �9.�� �00.00
Developing existing activities in rural areas may help curb migration if it generates enough income to enhance the quality of life. In this respect the olive oil subsector offers a range of economic opportunities. Furthermore, olive trees are not easily replaced by another crop, since it is widely adaptable to soils (from sands to clays), and is growable in very arid areas where other crops can hardly survive. Olive trees require little day-to-day management and are not very time consuming. This feature is extremely important since rural household activities are very diversified and require time allocation. Lastly, the lack of infrastructure and access to water in some regions make hardy olive trees an attractive economic proposition.
In addition to being an important Lebanese cultural tradition, olive processing provides farmers with considerable by-products of economic value. Olive oil solid residues are used as heating material (fuel), and contribute almost as much income as the oil itself. The Lebanese winter season can be very cold and 8.4 per cent of the Lebanese population have no means of heating, while 16.8 per cent use charcoal or firewood (CAS, 2004). Furthermore, olive oil which is expired or unfit for consumption can be easily transformed into high quality olive soap, either for domestic use or sold locally. In certain regions, widowed women survive on making olive soap which is sold for US$10 per tank.
3.2 Production, hectarage and yieldsThe MOA estimates that 57 per cent of all farmers in Lebanon are olive growers (111,000 out of 195,000 farmers).17 In the last quarter century, the area under olive cultivation has nearly doubled from 30 to 57 thousand hectares, growing annually at around 3 per cent (SRI, 2004). Olive cultivation is the main agricultural activity in many regions in Lebanon, especially in North Lebanon and Nabatiyeh, where it accounts for 33 per cent and 47 per cent of total cultivated crops respectively. However, even in areas where it is not the primary crop, such as Mount Lebanon and South Lebanon, the footprint of olive farming remains substantial (37 per cent and 31 per cent respectively). In 2002, the economic value of olive farming was estimated at US$176 million, or approximately 20 per cent of the value of total agricultural plant production (SRI, 2004). Table 6 illustrates the importance of olive farming in each district in Lebanon, as a percentage of total cultivated crops in the region.
Table 6: Percentage (%) of total crop output in each province in Lebanon
Source: MOA/FAO, 2000
However, olive farming and processing are very often a secondary occupation. It is viewed as a family business, intended for local consumption. It is farmed on a part time basis and acreage is very much fragmented. Of the olive farmers in South Lebanon, North Lebanon and Mount Lebanon, 70 per cent, 59 per cent, and 67 per cent respectively are part-time farmers (LIPSOS, 2005).
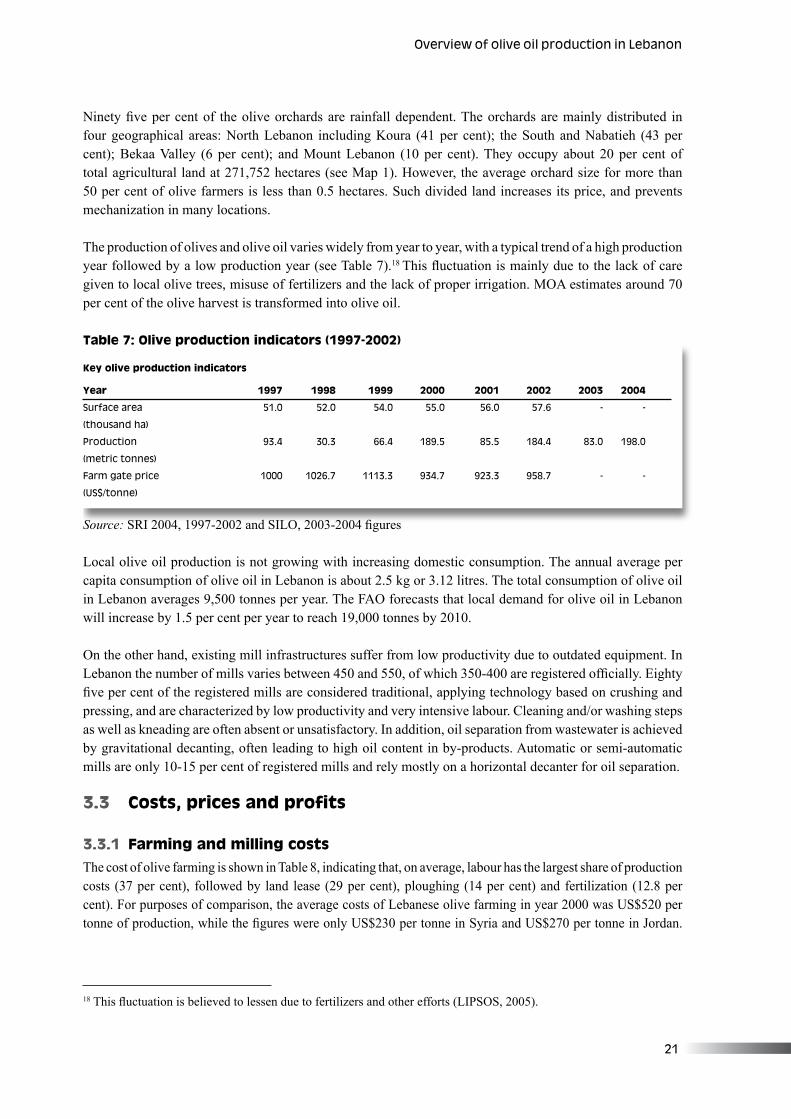
��
Key olive production indicators
Year 1997 1998 1999 2000 2001 2002 2003 2004
Surface area ��.0 ��.0 ��.0 ��.0 ��.0 �7.� - -
(thousand ha)
Product�on 9�.� �0.� ��.� �89.� 8�.� �8�.� 8�.0 �98.0
(metr�c tonnes)
Farm gate pr�ce �000 �0��.7 ����.� 9��.7 9��.� 9�8.7 - -
(US$/tonne)
18 This fluctuation is believed to lessen due to fertilizers and other efforts (LIPSOS, 2005).
Ninety five per cent of the olive orchards are rainfall dependent. The orchards are mainly distributed in four geographical areas: North Lebanon including Koura (41 per cent); the South and Nabatieh (43 per cent); Bekaa Valley (6 per cent); and Mount Lebanon (10 per cent). They occupy about 20 per cent of total agricultural land at 271,752 hectares (see Map 1). However, the average orchard size for more than 50 per cent of olive farmers is less than 0.5 hectares. Such divided land increases its price, and prevents mechanization in many locations. The production of olives and olive oil varies widely from year to year, with a typical trend of a high production year followed by a low production year (see Table 7).18 This fluctuation is mainly due to the lack of care given to local olive trees, misuse of fertilizers and the lack of proper irrigation. MOA estimates around 70 per cent of the olive harvest is transformed into olive oil.
Table 7: Olive production indicators (1997-2002)
Source: SRI 2004, 1997-2002 and SILO, 2003-2004 figures Local olive oil production is not growing with increasing domestic consumption. The annual average per capita consumption of olive oil in Lebanon is about 2.5 kg or 3.12 litres. The total consumption of olive oil in Lebanon averages 9,500 tonnes per year. The FAO forecasts that local demand for olive oil in Lebanon will increase by 1.5 per cent per year to reach 19,000 tonnes by 2010.
On the other hand, existing mill infrastructures suffer from low productivity due to outdated equipment. In Lebanon the number of mills varies between 450 and 550, of which 350-400 are registered officially. Eighty five per cent of the registered mills are considered traditional, applying technology based on crushing and pressing, and are characterized by low productivity and very intensive labour. Cleaning and/or washing steps as well as kneading are often absent or unsatisfactory. In addition, oil separation from wastewater is achieved by gravitational decanting, often leading to high oil content in by-products. Automatic or semi-automatic mills are only 10-15 per cent of registered mills and rely mostly on a horizontal decanter for oil separation.
3.3 Costs, prices and profits
3.3.1 Farming and milling costs The cost of olive farming is shown in Table 8, indicating that, on average, labour has the largest share of production costs (37 per cent), followed by land lease (29 per cent), ploughing (14 per cent) and fertilization (12.8 per cent). For purposes of comparison, the average costs of Lebanese olive farming in year 2000 was US$520 per tonne of production, while the figures were only US$230 per tonne in Syria and US$270 per tonne in Jordan.
Overv�ew of ol�ve o�l product�on �n Lebanon
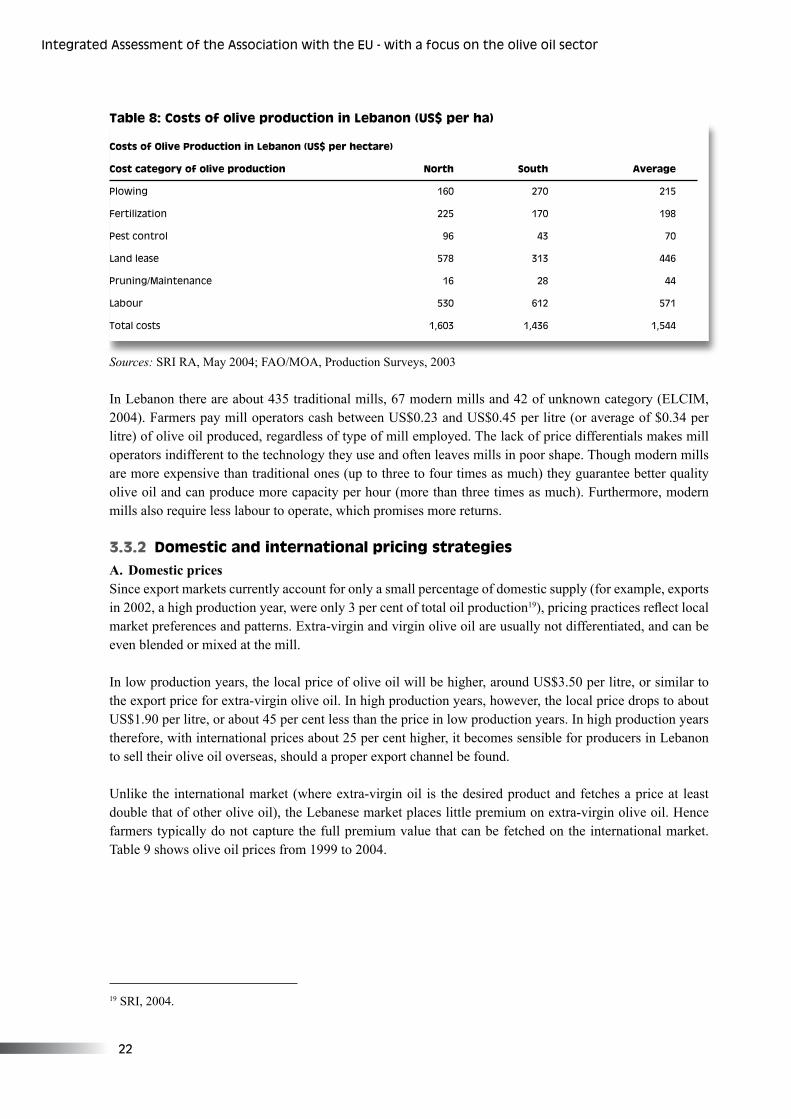
��
Integrated Assessment of the Assoc�at�on w�th the EU - w�th a focus on the ol�ve o�l sector
Costs of Olive Production in Lebanon (US$ per hectare)
Cost category of olive production North South Average
Plow�ng ��0 �70 ���
Fert�l�zat�on ��� �70 �98
Pest control 9� �� 70
Land lease �78 ��� ���
Prun�ng/Ma�ntenance �� �8 ��
Labour ��0 ��� �7�
Total costs �,�0� �,��� �,���
19 SRI, 2004.
Table 8: Costs of olive production in Lebanon (US$ per ha)
Sources: SRI RA, May 2004; FAO/MOA, Production Surveys, 2003
In Lebanon there are about 435 traditional mills, 67 modern mills and 42 of unknown category (ELCIM, 2004). Farmers pay mill operators cash between US$0.23 and US$0.45 per litre (or average of $0.34 per litre) of olive oil produced, regardless of type of mill employed. The lack of price differentials makes mill operators indifferent to the technology they use and often leaves mills in poor shape. Though modern mills are more expensive than traditional ones (up to three to four times as much) they guarantee better quality olive oil and can produce more capacity per hour (more than three times as much). Furthermore, modern mills also require less labour to operate, which promises more returns.
3.3.2 Domestic and international pricing strategies A. Domestic prices Since export markets currently account for only a small percentage of domestic supply (for example, exports in 2002, a high production year, were only 3 per cent of total oil production19), pricing practices reflect local market preferences and patterns. Extra-virgin and virgin olive oil are usually not differentiated, and can be even blended or mixed at the mill.
In low production years, the local price of olive oil will be higher, around US$3.50 per litre, or similar to the export price for extra-virgin olive oil. In high production years, however, the local price drops to about US$1.90 per litre, or about 45 per cent less than the price in low production years. In high production years therefore, with international prices about 25 per cent higher, it becomes sensible for producers in Lebanon to sell their olive oil overseas, should a proper export channel be found.
Unlike the international market (where extra-virgin oil is the desired product and fetches a price at least double that of other olive oil), the Lebanese market places little premium on extra-virgin olive oil. Hence farmers typically do not capture the full premium value that can be fetched on the international market. Table 9 shows olive oil prices from 1999 to 2004.
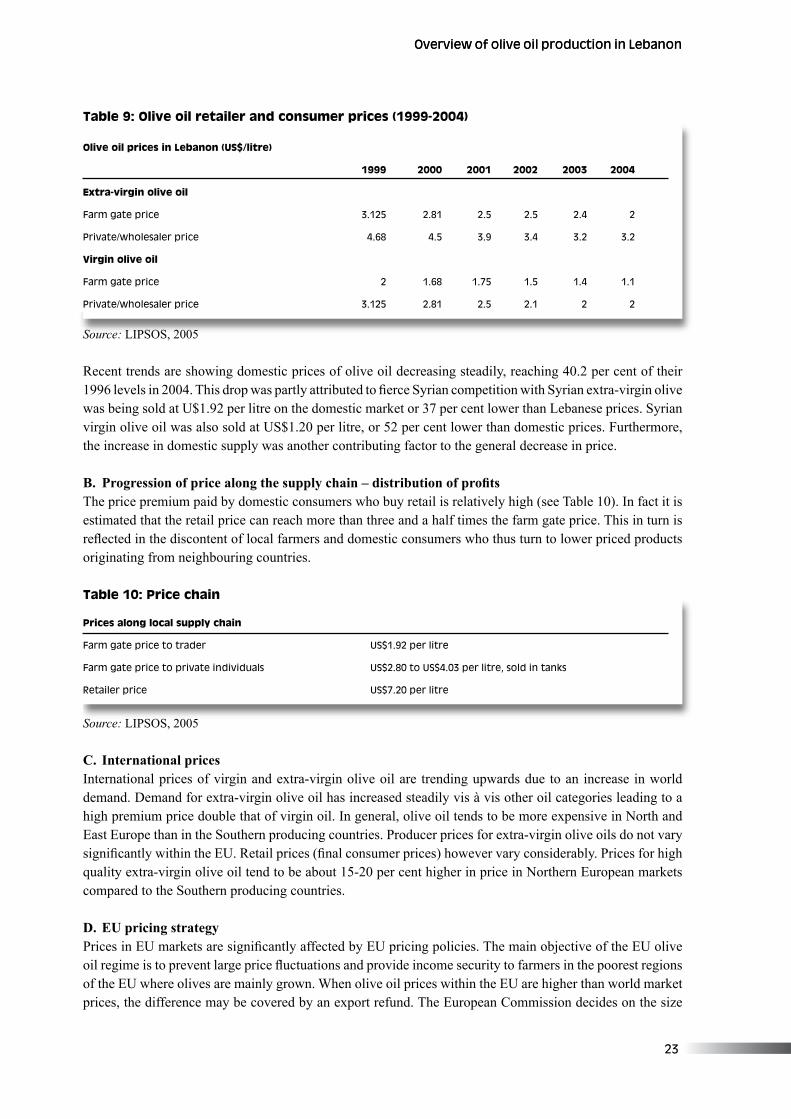
��
Olive oil prices in Lebanon (US$/litre)
1999 2000 2001 2002 2003 2004
Extra-virgin olive oil
Farm gate pr�ce �.��� �.8� �.� �.� �.� �
Pr�vate/wholesaler pr�ce �.�8 �.� �.9 �.� �.� �.�
Virgin olive oil
Farm gate pr�ce � �.�8 �.7� �.� �.� �.�
Pr�vate/wholesaler pr�ce �.��� �.8� �.� �.� � �
Prices along local supply chain
Farm gate pr�ce to trader US$�.9� per l�tre
Farm gate pr�ce to pr�vate �nd�v�duals US$�.80 to US$�.0� per l�tre, sold �n tanks
Reta�ler pr�ce US$7.�0 per l�tre
Table 9: Olive oil retailer and consumer prices (1999-2004)
Source: LIPSOS, 2005
Recent trends are showing domestic prices of olive oil decreasing steadily, reaching 40.2 per cent of their 1996 levels in 2004. This drop was partly attributed to fierce Syrian competition with Syrian extra-virgin olive was being sold at U$1.92 per litre on the domestic market or 37 per cent lower than Lebanese prices. Syrian virgin olive oil was also sold at US$1.20 per litre, or 52 per cent lower than domestic prices. Furthermore, the increase in domestic supply was another contributing factor to the general decrease in price.
B. Progressionofpricealongthesupplychain–distributionofprofitsThe price premium paid by domestic consumers who buy retail is relatively high (see Table 10). In fact it is estimated that the retail price can reach more than three and a half times the farm gate price. This in turn is reflected in the discontent of local farmers and domestic consumers who thus turn to lower priced products originating from neighbouring countries.
Table 10: Price chain
Source: LIPSOS, 2005
C. International prices International prices of virgin and extra-virgin olive oil are trending upwards due to an increase in world demand. Demand for extra-virgin olive oil has increased steadily vis à vis other oil categories leading to a high premium price double that of virgin oil. In general, olive oil tends to be more expensive in North and East Europe than in the Southern producing countries. Producer prices for extra-virgin olive oils do not vary significantly within the EU. Retail prices (final consumer prices) however vary considerably. Prices for high quality extra-virgin olive oil tend to be about 15-20 per cent higher in price in Northern European markets compared to the Southern producing countries.
D. EU pricing strategyPrices in EU markets are significantly affected by EU pricing policies. The main objective of the EU olive oil regime is to prevent large price fluctuations and provide income security to farmers in the poorest regions of the EU where olives are mainly grown. When olive oil prices within the EU are higher than world market prices, the difference may be covered by an export refund. The European Commission decides on the size
Overv�ew of ol�ve o�l product�on �n LebanonOverv�ew of ol�ve o�l product�on �n Lebanon
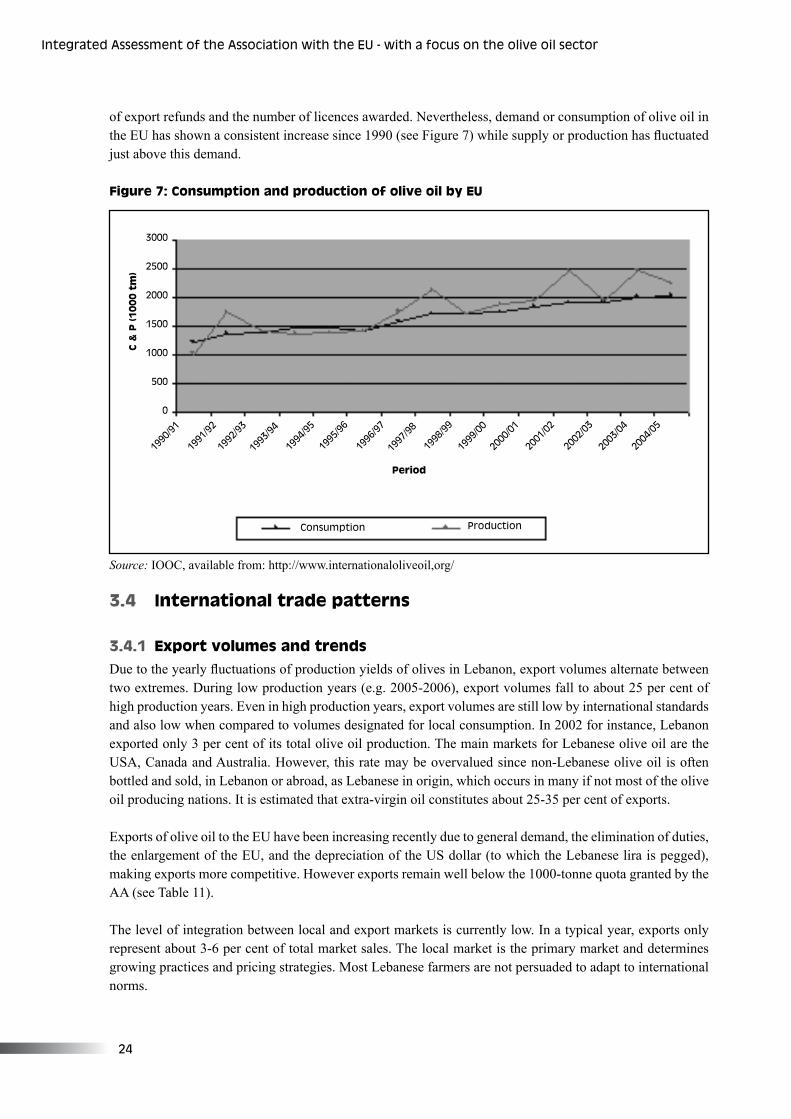
��
Integrated Assessment of the Assoc�at�on w�th the EU - w�th a focus on the ol�ve o�l sector
of export refunds and the number of licences awarded. Nevertheless, demand or consumption of olive oil in the EU has shown a consistent increase since 1990 (see Figure 7) while supply or production has fluctuated just above this demand.
Figure 7: Consumption and production of olive oil by EU
Source: IOOC, available from: http://www.internationaloliveoil,org/
3.4 International trade patterns 3.4.1 Export volumes and trendsDue to the yearly fluctuations of production yields of olives in Lebanon, export volumes alternate between two extremes. During low production years (e.g. 2005-2006), export volumes fall to about 25 per cent of high production years. Even in high production years, export volumes are still low by international standards and also low when compared to volumes designated for local consumption. In 2002 for instance, Lebanon exported only 3 per cent of its total olive oil production. The main markets for Lebanese olive oil are the USA, Canada and Australia. However, this rate may be overvalued since non-Lebanese olive oil is often bottled and sold, in Lebanon or abroad, as Lebanese in origin, which occurs in many if not most of the olive oil producing nations. It is estimated that extra-virgin oil constitutes about 25-35 per cent of exports.
Exports of olive oil to the EU have been increasing recently due to general demand, the elimination of duties, the enlargement of the EU, and the depreciation of the US dollar (to which the Lebanese lira is pegged), making exports more competitive. However exports remain well below the 1000-tonne quota granted by the AA (see Table 11).
The level of integration between local and export markets is currently low. In a typical year, exports only represent about 3-6 per cent of total market sales. The local market is the primary market and determines growing practices and pricing strategies. Most Lebanese farmers are not persuaded to adapt to international norms.
�000
��00
�000
��00
�000
�00
0
�990
/9�
�99�
/9�
�99�
/9�
�99�
/9�
�99�
/9�
�99�
/97
�998
/99
�999
/00
�000
/0�
�00�
/0�
�00�
/0�
�00�
/0�
�00�
/0�
�99�
/9�
�997
/98
C &
P (1
00
0 t
m)
Period
Consumpt�on Product�on
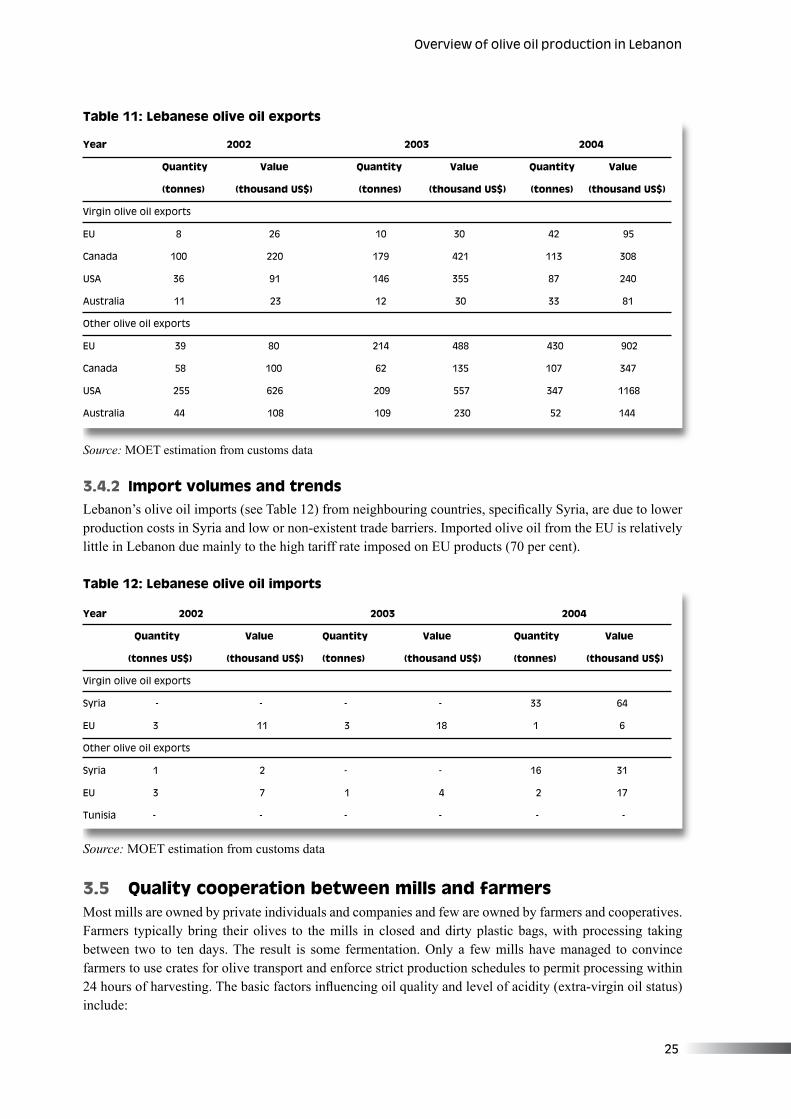
��
Year 2002 2003 2004
Quantity Value Quantity Value Quantity Value
(tonnes US$) (thousand US$) (tonnes) (thousand US$) (tonnes) (thousand US$)
V�rg�n ol�ve o�l exports
Syr�a - - - - �� ��
EU � �� � �8 � �
Other ol�ve o�l exports
Syr�a � � - - �� ��
EU � 7 � � � �7
Tun�s�a - - - - - -
Year 2002 2003 2004
Quantity Value Quantity Value Quantity Value
(tonnes) (thousand US$) (tonnes) (thousand US$) (tonnes) (thousand US$)
V�rg�n ol�ve o�l exports
EU 8 �� �0 �0 �� 9�
Canada �00 ��0 �79 ��� ��� �08
USA �� 9� ��� ��� 87 ��0
Austral�a �� �� �� �0 �� 8�
Other ol�ve o�l exports
EU �9 80 ��� �88 ��0 90�
Canada �8 �00 �� ��� �07 ��7
USA ��� ��� �09 ��7 ��7 ���8
Austral�a �� �08 �09 ��0 �� ���
Table 11: Lebanese olive oil exports
Source: MOET estimation from customs data
3.4.2 Import volumes and trendsLebanon’s olive oil imports (see Table 12) from neighbouring countries, specifically Syria, are due to lower production costs in Syria and low or non-existent trade barriers. Imported olive oil from the EU is relatively little in Lebanon due mainly to the high tariff rate imposed on EU products (70 per cent).
Table 12: Lebanese olive oil imports
Source: MOET estimation from customs data
3.5 Quality cooperation between mills and farmersMost mills are owned by private individuals and companies and few are owned by farmers and cooperatives. Farmers typically bring their olives to the mills in closed and dirty plastic bags, with processing taking between two to ten days. The result is some fermentation. Only a few mills have managed to convince farmers to use crates for olive transport and enforce strict production schedules to permit processing within 24 hours of harvesting. The basic factors influencing oil quality and level of acidity (extra-virgin oil status) include:
Overv�ew of ol�ve o�l product�on �n Lebanon
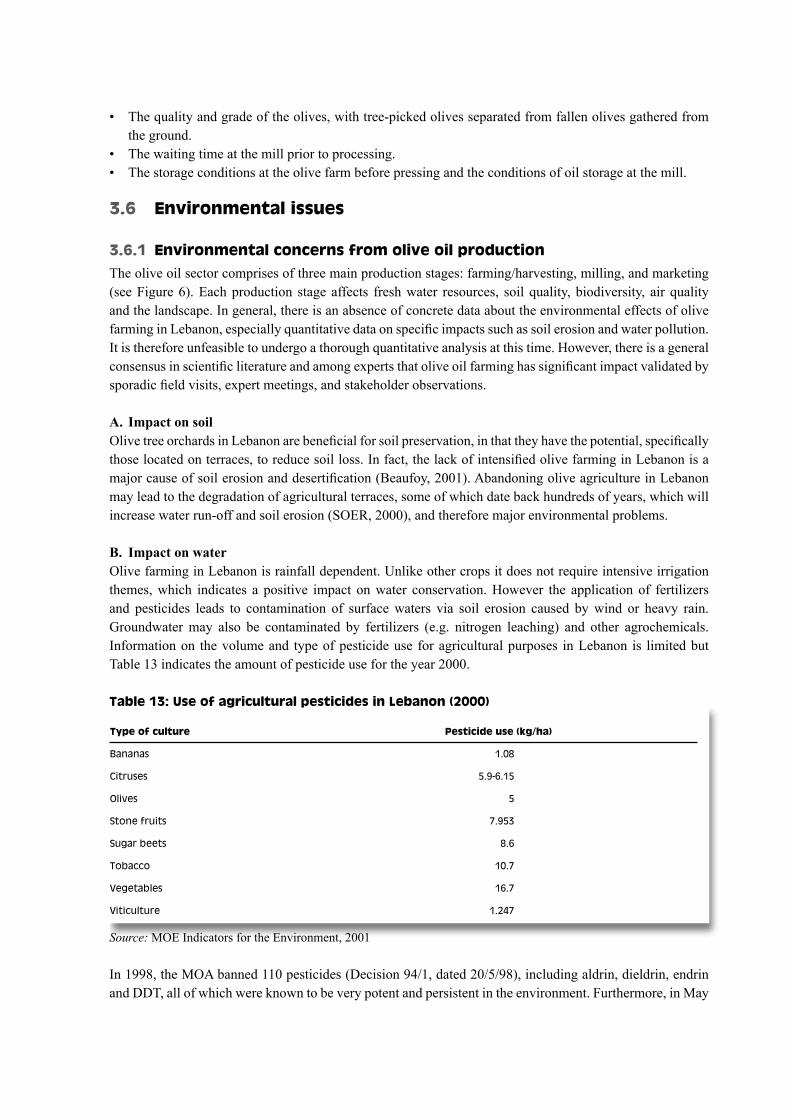
Type of culture Pesticide use (kg/ha)
Bananas �.08
C�truses �.9-�.��
Ol�ves �
Stone fru�ts 7.9��
Sugar beets 8.�
Tobacco �0.7
Vegetables ��.7
V�t�culture �.��7
• The quality and grade of the olives, with tree-picked olives separated from fallen olives gathered from the ground.
• The waiting time at the mill prior to processing.• The storage conditions at the olive farm before pressing and the conditions of oil storage at the mill.
3.6 Environmental issues
3.6.1 Environmental concerns from olive oil productionThe olive oil sector comprises of three main production stages: farming/harvesting, milling, and marketing (see Figure 6). Each production stage affects fresh water resources, soil quality, biodiversity, air quality and the landscape. In general, there is an absence of concrete data about the environmental effects of olive farming in Lebanon, especially quantitative data on specific impacts such as soil erosion and water pollution. It is therefore unfeasible to undergo a thorough quantitative analysis at this time. However, there is a general consensus in scientific literature and among experts that olive oil farming has significant impact validated by sporadic field visits, expert meetings, and stakeholder observations.
A. Impact on soil Olive tree orchards in Lebanon are beneficial for soil preservation, in that they have the potential, specifically those located on terraces, to reduce soil loss. In fact, the lack of intensified olive farming in Lebanon is a major cause of soil erosion and desertification (Beaufoy, 2001). Abandoning olive agriculture in Lebanon may lead to the degradation of agricultural terraces, some of which date back hundreds of years, which will increase water run-off and soil erosion (SOER, 2000), and therefore major environmental problems.
B. Impact on waterOlive farming in Lebanon is rainfall dependent. Unlike other crops it does not require intensive irrigation themes, which indicates a positive impact on water conservation. However the application of fertilizers and pesticides leads to contamination of surface waters via soil erosion caused by wind or heavy rain. Groundwater may also be contaminated by fertilizers (e.g. nitrogen leaching) and other agrochemicals. Information on the volume and type of pesticide use for agricultural purposes in Lebanon is limited but Table 13 indicates the amount of pesticide use for the year 2000.
Table 13: Use of agricultural pesticides in Lebanon (2000)
Source: MOE Indicators for the Environment, 2001
In 1998, the MOA banned 110 pesticides (Decision 94/1, dated 20/5/98), including aldrin, dieldrin, endrin and DDT, all of which were known to be very potent and persistent in the environment. Furthermore, in May
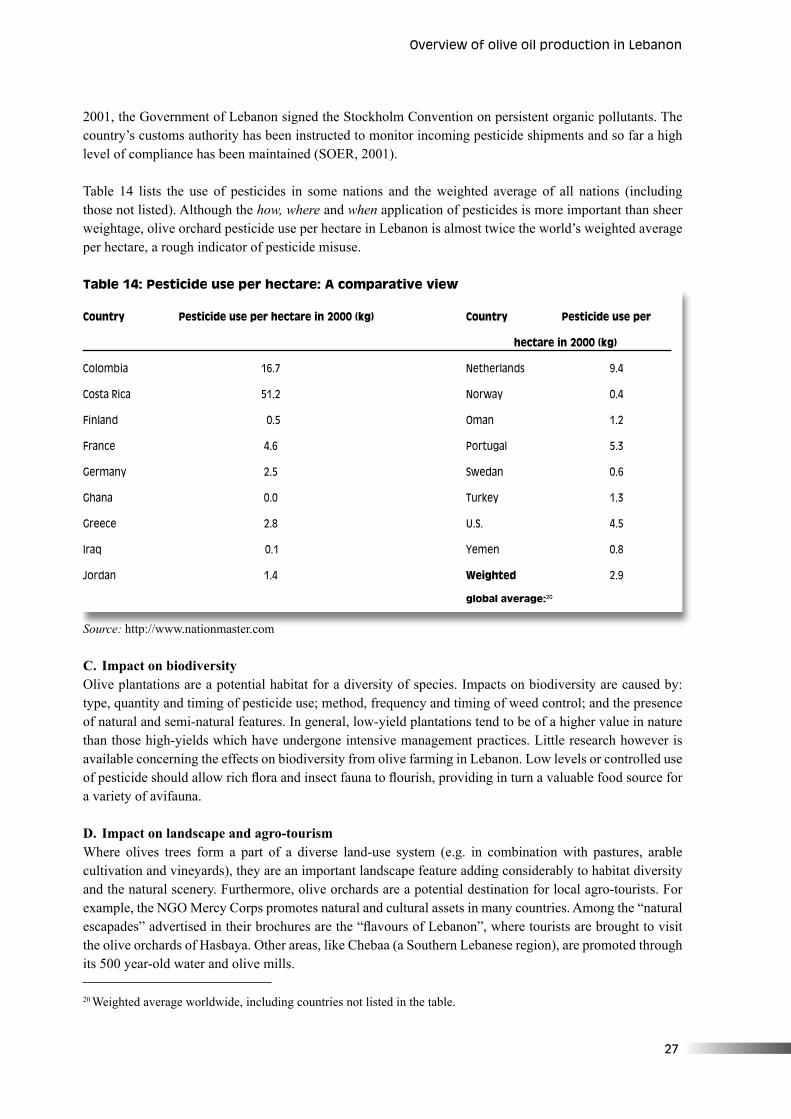
�7
Country Pesticide use per hectare in 2000 (kg) Country Pesticide use per
hectare in 2000 (kg)
Colomb�a ��.7 Netherlands 9.�
Costa R�ca ��.� Norway 0.�
F�nland 0.� Oman �.�
France �.� Portugal �.�
Germany �.� Swedan 0.�
Ghana 0.0 Turkey �.�
Greece �.8 U.S. �.�
Iraq 0.� Yemen 0.8
Jordan �.� Weighted �.9
global average:�0
20 Weighted average worldwide, including countries not listed in the table.
2001, the Government of Lebanon signed the Stockholm Convention on persistent organic pollutants. The country’s customs authority has been instructed to monitor incoming pesticide shipments and so far a high level of compliance has been maintained (SOER, 2001).
Table 14 lists the use of pesticides in some nations and the weighted average of all nations (including those not listed). Although the how, where and when application of pesticides is more important than sheer weightage, olive orchard pesticide use per hectare in Lebanon is almost twice the world’s weighted average per hectare, a rough indicator of pesticide misuse.
Table 14: Pesticide use per hectare: A comparative view
Source: http://www.nationmaster.com
C. Impact on biodiversityOlive plantations are a potential habitat for a diversity of species. Impacts on biodiversity are caused by: type, quantity and timing of pesticide use; method, frequency and timing of weed control; and the presence of natural and semi-natural features. In general, low-yield plantations tend to be of a higher value in nature than those high-yields which have undergone intensive management practices. Little research however is available concerning the effects on biodiversity from olive farming in Lebanon. Low levels or controlled use of pesticide should allow rich flora and insect fauna to flourish, providing in turn a valuable food source for a variety of avifauna.
D. Impact on landscape and agro-tourism Where olives trees form a part of a diverse land-use system (e.g. in combination with pastures, arable cultivation and vineyards), they are an important landscape feature adding considerably to habitat diversity and the natural scenery. Furthermore, olive orchards are a potential destination for local agro-tourists. For example, the NGO Mercy Corps promotes natural and cultural assets in many countries. Among the “natural escapades” advertised in their brochures are the “flavours of Lebanon”, where tourists are brought to visit the olive orchards of Hasbaya. Other areas, like Chebaa (a Southern Lebanese region), are promoted through its 500 year-old water and olive mills.
Overv�ew of ol�ve o�l product�on �n Lebanon
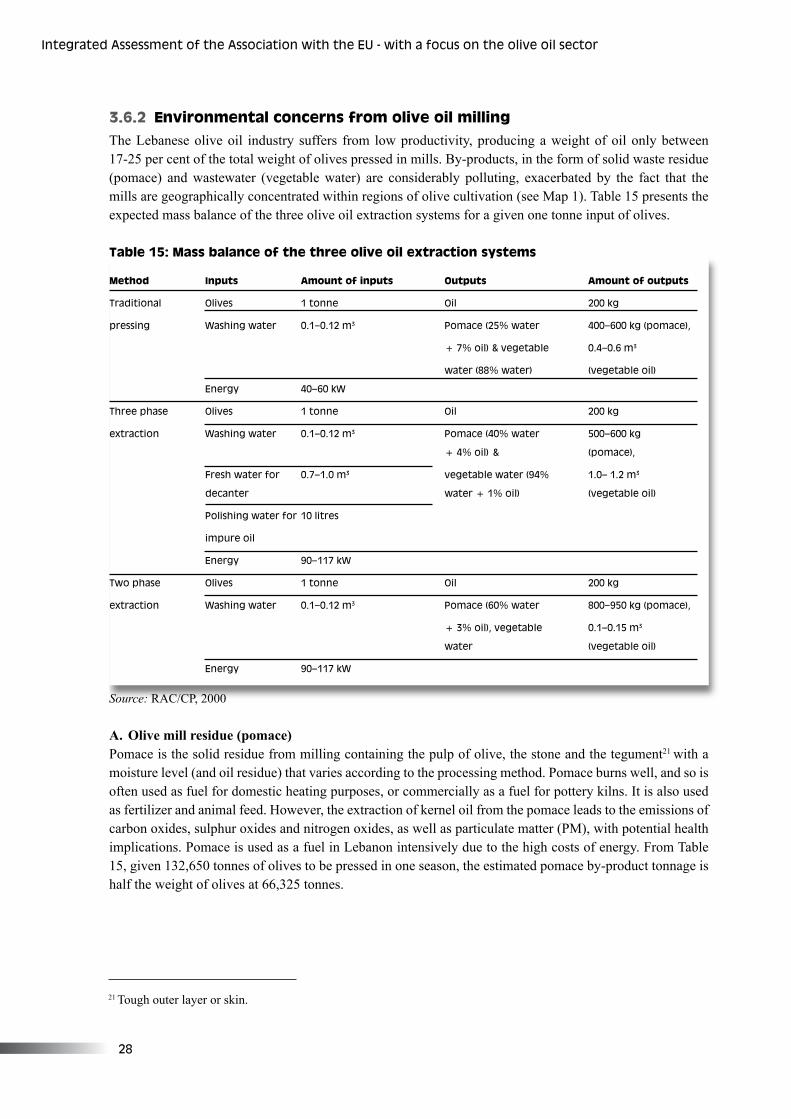
�8
Integrated Assessment of the Assoc�at�on w�th the EU - w�th a focus on the ol�ve o�l sector
Method Inputs Amount of inputs Outputs Amount of outputs
Trad�t�onal Ol�ves � tonne O�l �00 kg
press�ng Wash�ng water 0.�–0.�� m� Pomace (��% water �00–�00 kg (pomace),
+ 7% o�l) & vegetable 0.�–0.� m�
water (88% water) (vegetable o�l)
Energy �0–�0 kW
Three phase Ol�ves � tonne O�l �00 kg
extract�on Wash�ng water 0.�–0.�� m� Pomace (�0% water �00–�00 kg
+ �% o�l) & (pomace),
Fresh water for 0.7–�.0 m� vegetable water (9�% �.0– �.� m�
decanter water + �% o�l) (vegetable o�l)
Pol�sh�ng water for �0 l�tres
�mpure o�l
Energy 90–��7 kW
Two phase Ol�ves � tonne O�l �00 kg
extract�on Wash�ng water 0.�–0.�� m� Pomace (�0% water 800–9�0 kg (pomace),
+ �% o�l), vegetable 0.�–0.�� m�
water (vegetable o�l)
Energy 90–��7 kW
21 Tough outer layer or skin.
3.6.2 Environmental concerns from olive oil milling The Lebanese olive oil industry suffers from low productivity, producing a weight of oil only between 17-25 per cent of the total weight of olives pressed in mills. By-products, in the form of solid waste residue (pomace) and wastewater (vegetable water) are considerably polluting, exacerbated by the fact that the mills are geographically concentrated within regions of olive cultivation (see Map 1). Table 15 presents the expected mass balance of the three olive oil extraction systems for a given one tonne input of olives.
Table 15: Mass balance of the three olive oil extraction systems
Source: RAC/CP, 2000
A. Olive mill residue (pomace)Pomace is the solid residue from milling containing the pulp of olive, the stone and the tegument21 with a moisture level (and oil residue) that varies according to the processing method. Pomace burns well, and so is often used as fuel for domestic heating purposes, or commercially as a fuel for pottery kilns. It is also used as fertilizer and animal feed. However, the extraction of kernel oil from the pomace leads to the emissions of carbon oxides, sulphur oxides and nitrogen oxides, as well as particulate matter (PM), with potential health implications. Pomace is used as a fuel in Lebanon intensively due to the high costs of energy. From Table 15, given 132,650 tonnes of olives to be pressed in one season, the estimated pomace by-product tonnage is half the weight of olives at 66,325 tonnes.
�9
B. Olive mill wastewaterThe processing of ten tonnes of olive would normally produce 3.5 tonnes of liquid waste. The characteristics of olive mill wastewater (OMW) vary in quantity and strength yet are best characterized by low pH, high biological oxygen demand (BOD) and high carbon oxygen demand (COD; 80,000 – 200,000 mg/l depending on the pressing technology) compared to domestic wastewater (that has a COD value of about 400 mg/l). The composition of the organic portion of OMW contains grease, proteins, carbohydrates, organic acids, polyalcohols, pectines, tanines, glucosides and polyphenols, while the mineral matter is composed of carbonates, phosphates, sodium and potassium, among others. The olive mill wastewater is characterized by its black-brownish colour due to substances of polymeric nature. Given Table 15’s estimate of 132,650 tonnes of olives pressed in one season, the estimate of vegetable water outputs is 90 per cent of the weight of olives at 119,385 tonnes.
Presently, only 17 per cent of all mills discharge the wastewater into the municipal sewer and 6 per cent into a cesspool, while 24 per cent openly discharge into the environment. Another 9 per cent of mills dump the liquid into rivers and the sea, 10 per cent dump it in the valley, 8 per cent uses the water for irrigation purposes, and the rest is unknown (source: ICU Powerpoint presentation).
The implications of olive oil wastewater can be severe, depending on where it is discharged. In the region of Hasbaya for example, the vegetable wastewater is dumped into the Hasbani River, causing the water to turn black. The high BOD present is detrimental to the organisms in the water. This is a problem in many areas across Lebanon. Box 1 reviews a regional project underway to quantify the by-product impacts of olive oil milling on the surrounding environment and introduces an integrated management system to mitigate impacts in Lebanon, Syria and Jordan.
Overv�ew of ol�ve o�l product�on �n Lebanon
Box 1: Project on integrated management of olive oil production waste
The UNDP regional project, “Integrated Management of Olive Oil Production Waste in Lebanon, Syria and Jordan”, is funded by the European Commission through the SMAP Programme. The project document was signed between the United Nations Development Programme (UNDP) and MOE, in the presence of the Council of Development and Reconstruction and the European Commission Delegation in Lebanon. The project aims to introduce an integrated management system for olive oil production waste and associated industries in the participating countries. Polluting olive oil industries contribute to the degradation of water quality and agricultural lands by discharging waste effluents (pomace and vegetable water) into rivers, water currents and land without prior treatment. The proposed activities to achieve this goal are classified as:
1. Database development2. Introducing cleaner production options, prevention measures and control and treatment options
including demonstration actions, such as pilot projects in each participating country3. Setting/updating relevant environmental quality standards as well as developing and implementing an
efficient monitoring strategy4. Undertaking financial and economic analysis to identify incentives for improvement5. Implementing institutional strengthening and capacity building programmes
This will prepare the platform for the development of an eco-labelling recognition scheme and financial incentives system, and help develop a decision-aid tool for economic and environmental management of the olive oil industry. The implementation period is three years, with a total budget of almost 2.2 million euros.

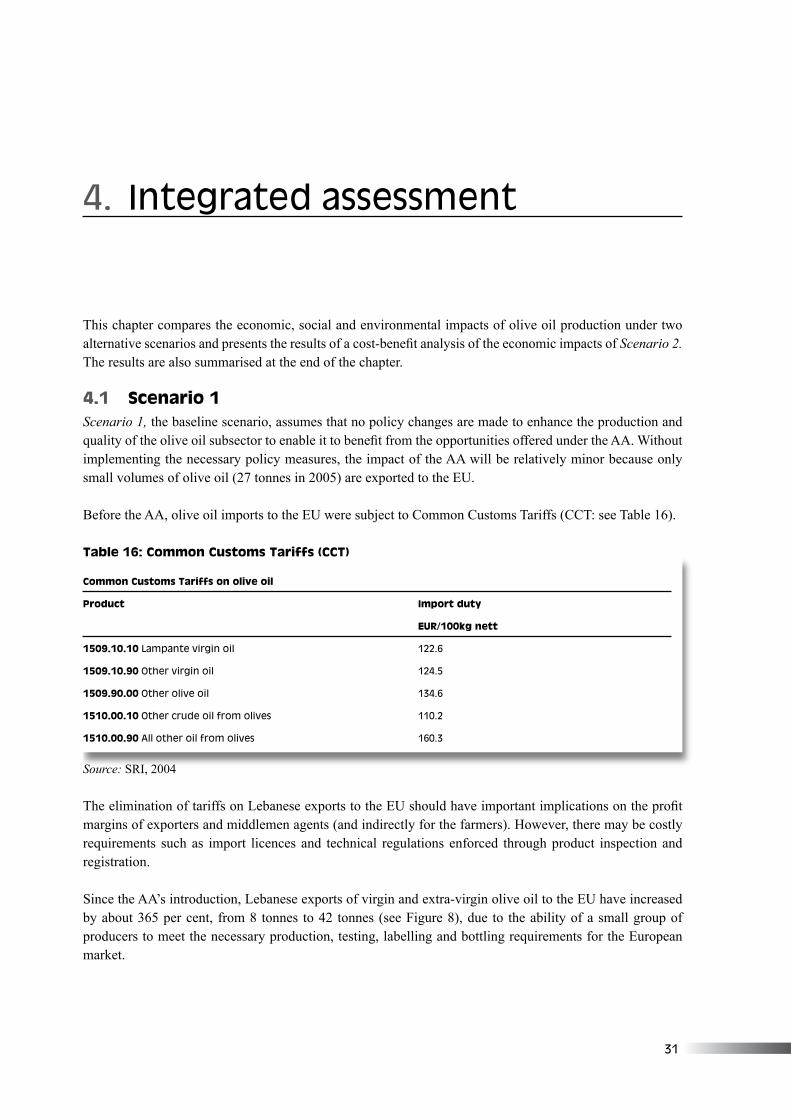
��
�. Integrated assessment
This chapter compares the economic, social and environmental impacts of olive oil production under two alternative scenarios and presents the results of a cost-benefit analysis of the economic impacts of Scenario 2. The results are also summarised at the end of the chapter.
4.1 Scenario 1Scenario 1, the baseline scenario, assumes that no policy changes are made to enhance the production and quality of the olive oil subsector to enable it to benefit from the opportunities offered under the AA. Without implementing the necessary policy measures, the impact of the AA will be relatively minor because only small volumes of olive oil (27 tonnes in 2005) are exported to the EU.
Before the AA, olive oil imports to the EU were subject to Common Customs Tariffs (CCT: see Table 16).
Table 16: Common Customs Tariffs (CCT)
Source: SRI, 2004
The elimination of tariffs on Lebanese exports to the EU should have important implications on the profit margins of exporters and middlemen agents (and indirectly for the farmers). However, there may be costly requirements such as import licences and technical regulations enforced through product inspection and registration.
Since the AA’s introduction, Lebanese exports of virgin and extra-virgin olive oil to the EU have increased by about 365 per cent, from 8 tonnes to 42 tonnes (see Figure 8), due to the ability of a small group of producers to meet the necessary production, testing, labelling and bottling requirements for the European market.
Common Customs Tariffs on olive oil
Product Import duty
EUR/100kg nett
1509.10.10 Lampante v�rg�n o�l ���.�
1509.10.90 Other v�rg�n o�l ���.�
1509.90.00 Other ol�ve o�l ���.�
1510.00.10 Other crude o�l from ol�ves ��0.�
1510.00.90 All other o�l from ol�ves ��0.�
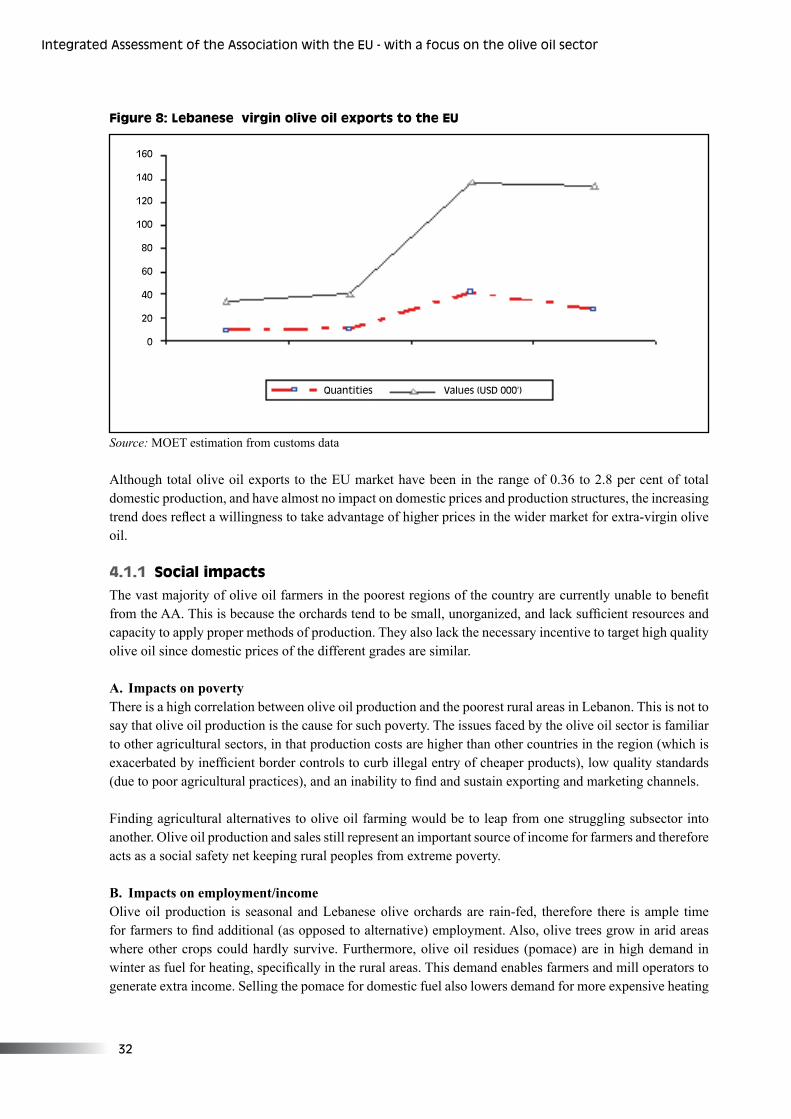
��
Integrated Assessment of the Assoc�at�on w�th the EU - w�th a focus on the ol�ve o�l sector
Quant�t�es Values (USD 000’)
Figure 8: Lebanese virgin olive oil exports to the EU
Source: MOET estimation from customs data
Although total olive oil exports to the EU market have been in the range of 0.36 to 2.8 per cent of total domestic production, and have almost no impact on domestic prices and production structures, the increasing trend does reflect a willingness to take advantage of higher prices in the wider market for extra-virgin olive oil.
4.1.1 Social impacts The vast majority of olive oil farmers in the poorest regions of the country are currently unable to benefit from the AA. This is because the orchards tend to be small, unorganized, and lack sufficient resources and capacity to apply proper methods of production. They also lack the necessary incentive to target high quality olive oil since domestic prices of the different grades are similar.
A. Impacts on povertyThere is a high correlation between olive oil production and the poorest rural areas in Lebanon. This is not to say that olive oil production is the cause for such poverty. The issues faced by the olive oil sector is familiar to other agricultural sectors, in that production costs are higher than other countries in the region (which is exacerbated by inefficient border controls to curb illegal entry of cheaper products), low quality standards (due to poor agricultural practices), and an inability to find and sustain exporting and marketing channels.
Finding agricultural alternatives to olive oil farming would be to leap from one struggling subsector into another. Olive oil production and sales still represent an important source of income for farmers and therefore acts as a social safety net keeping rural peoples from extreme poverty.
B. Impacts on employment/incomeOlive oil production is seasonal and Lebanese olive orchards are rain-fed, therefore there is ample time for farmers to find additional (as opposed to alternative) employment. Also, olive trees grow in arid areas where other crops could hardly survive. Furthermore, olive oil residues (pomace) are in high demand in winter as fuel for heating, specifically in the rural areas. This demand enables farmers and mill operators to generate extra income. Selling the pomace for domestic fuel also lowers demand for more expensive heating
��0
��0
��0
�00
80
�0
�0
�0
0
��
substances like kerosene and coal, and reduces the demand for fuelwood that entails the cutting down of trees.22
Therefore, before seeking olive oil alternatives, finding solutions to the problems of the sector, such as in Scenario 2, will be a better approach to tackling rural-urban migration and poverty.
C. Impacts on tradersThere are traders who are capable of meeting EU standards and capable of establishing marketing channels that benefit from the new quota. Of particular interest are the traders exporting high quality extra-virgin olive oil who are able to tap the premium as well as larger markets. The primary beneficiary is thus the capable trader, whether producer or agent.
However, the numbers of such willing traders in olive oil is limited. Traders buy olive oil in bulk from producers. They incur costs from transport, testing, bottling, packaging and certification. Traders can however easily source olive oil from neighbouring countries. They dominate the local market in Lebanon and thus leverage this privileged position by manipulating price levels. On the international market, they will be subject to fierce competition, which is partly why they are reluctant to enter long term contracts with foreign agents. Their reluctance to also do so with local producers due to output fluctuation creates a general climate of uncertainty and thus hinders durable investment. Sustainable growth rates are therefore a mirage.
In order to export to highly regulated markets such as the EU, traders have to follow specific testing procedures that they find too costly most of the time. Since traders are constrained to buy small quantities of oil from a large number of different producers, they are at a disadvantage when they target foreign markets. On the other hand, producers are unable to invest in this sector due also to the high uncertainty created by erratic annual supplies. Producers are also highly unorganized because of the nature of the land distribution. In addition they are constantly faced with regional competition.
D. Conclusions on social impacts The configuration of the olive oil supply chain creates an asymmetric relationship between direct producers and traders. The situation is of a large number of vulnerable producers, scattered all over the country, and each producing a relatively insignificant fraction of national production. They are also dependant on a few influential traders, who already have access to cheap foreign olive oil, to sell their Lebanese production in local or international markets.
Thus, the situation is neither beneficial to producers nor traders, although for now traders remain the net beneficiaries due to their dominant position. Appropriate efficient investment could be highly beneficial for both traders and producers when producing high quality olive oil. All in all, there are no significant impacts from Scenario 1 on the social structure associated with the olive oil production chain, since the incentive to export high quality oil is absent and most of the agents participating in the production and supply chain are unaware of the 1,000-tonne quota granted to the Lebanese olive oil industry under the AA.
4.1.2 Environmental impacts As mentioned, there is a lack of concrete data about the environmental implications of olive oil production. However, there is a general consensus in scientific literature and among experts that olive oil farming and processing will affect soil, water, air, biodiversity (flora and fauna) and the landscape (see Box 2).
22 Kerosene, wood, and coal are used in rural areas for heating purposes. Therefore the use of pomace for that purpose does not increase indoor air pollution.
Integrated assessment
��
Integrated Assessment of the Assoc�at�on w�th the EU - w�th a focus on the ol�ve o�l sector
At the same time some Integrated Pest Management techniques were used, specifically “Fermon traps” and “Macfay traps” to reduce the olive fruit fly’s infestation in orchards. If a certain threshold of insects is crossed (active infestation is greater than 10%) then pesticide use is recommended by the ICU and the MOA. The olive fruit fly is not a big problem in Hasbaya due to the high altitude and the chill of winter.
Milling operations in Hasbaya involve mostly three-phase systems and some two-phase ones. The two-phase system excretes no vegetable waters and only pomace with high moisture content. The pomace is in high demand for compost purposes. On the other hand, the three-phase milling systems the IAP team visited in the region emitted large quantities of vegetable waters which found their way into the Hasbani River, turning it almost completely black. These vegetable waters’ high BOD and COD depleted oxygen levels in the river and affected the ecosystem and fauna. Pomace from three-phase milling systems is also in high demand for another reason - heating fuel, since it burns with a steady high heat and reduces almost completely to ash.
Box 2: Case study: Impact of olive oil processing in the Hasbaya region
Pesticides were not often used in Hasbaya and when they were used they were applied only in small quantities.
Rural-urban migration creates specific problems in the destinations, especially the dense urban “poverty” belts around the major cities in Lebanon. These areas are known for their poor environmental standards due to the absence of water and wastewater infrastructure; poor solid waste disposal systems; high vehicle emissions and dust; and dwelling conditions resembling shanty towns.
4.2 Scenario 2Scenario 2 assumes that by implementing three policy options, the Government of Lebanon is able to facilitate the required olive oil quality improvements to allow exports up to the full 1000-tonne quota. The three options are:
1. Createasustainableregulatory frameworkandcapacity forproductcertification. It is essential to strengthen institutions responsible for fraud prevention and consumer protection in order to obtain a number of quality improvements. Certification will ensure that products (exports or imports) conform to international standards and common olive oil classifications. Local producers often face unfair competition from neighbouring countries such as misrepresentative marketing or dumping. This leads domestic producers to trade off production processes that produce high quality oil. For the policy to be effective it is essential that the origin of the product is controlled.
Moreover, extra-virgin olive oil produced in Lebanon is sold domestically at a price very close to the virgin olive oil, which is a problem of recognition and certification. This does not provide the incentive for producers to increase their production of better quality olive oil since no substantial return is associated with its production. This is a key bottleneck (for a full analysis of the bottlenecks, see Annex 4). It is thus essential that extra-virgin and virgin olive oil are differentiated, regulated, and have different prices.
Furthermore, due to unique climate and soil, Lebanese olive oil has unique characteristics that are currently not recognized by the EU certification bodies, which creates some non-trade barriers to some local products. For example, acidity levels of Lebanese olive oil may prevent its entry into foreign markets. It is essential that within the framework of the policy, amendments are made to take account of local character, and to help Lebanese oil preserve its unique taste, albeit in conformity with international
��
requirements. A system of geographic definitions and regional characteristics is crucial to product recognition. Accredited laboratories should be able to certify origin, ensuring a sustained standard of quality that builds the credibility of Lebanese olive oil in local and international markets.
The AA has provisions to provide MOET with financial and technical assistance to upgrade and certify existing testing laboratories. This enables producers to benefit from cheaper and more accessible laboratory work and gives their products the required certification. In addition, decentralization of testing equipment is required, allowing all levels of the production process (farming, milling and bottling) to benefit from quality-testing equipment.
2. Upgrade mills and their working conditions. A first step towards upgrading mills and working conditions is to document and assess the mills registered in different Lebanese regions, and provide technical and financial support to renovate old facilities. Milling plays a central role in quality improvement. To ensure their mills produce high quality oil, operators can require of farmers good agricultural practices such as separating good olives from bad, removing the leaves and cleaning the olives. On their side, the cleanliness of the milling machines must be maintained as well as strict sanitary conditions.
Other improvements include the modernization of the machinery, infrastructure and production investment to comply with international standards. Efforts toward this end, especially the establishment of Hazard Analysis and Critical Control Point (HACCP) and ISO 9001:2000 quality management systems (see Annex 1), will ensure that Lebanese olive oil is distinguished technically and geographically from other olive oils.
3. Implement good agricultural practices (GAP). To produce good quality extra-virgin olive oil, the entire supply chain needs to be revamped, starting with farmers adopting good agricultural practices (GAP). GAP enable farmers to increase quality and reduce important production costs. The necessary steps should be taken at the farming level to ensure the vigour of olive orchards, the quality of olives, the smoothing of year-to-year harvest fluctuations, and the sustainability of the surrounding environment. Since weather conditions have seemingly changed, with the rainy season only from November to March instead of October to May, introducing supplemental irrigation will substantially increase olive yields and improve quality (ECLIM, 2004).23
The transition process between olive harvesting and milling is among the most crucial to ensure better quality olive oil. Olives picked from the ground ought to be separated from those picked directly from the trees. They should be placed in open plastic crates (as opposed to closed plastic bags) for transport to the mills. The waiting at the mills should not exceed 48 hours (and preferably kept to 24 hours), and the storage of the olives meantime is best in a clean, dry and well ventilated area. Figure 9 illustrates the percentage of overall improvement that can be attributed to improving each stage of the production process.
23 A socio-economic and technical assessment study is needed to analyse the implications of climate change on Lebanese agricultural sector in general, and the olive oil sub-sector in particular, to determine the long-term viability of sectoral production.
Integrated assessmentIntegrated assessment
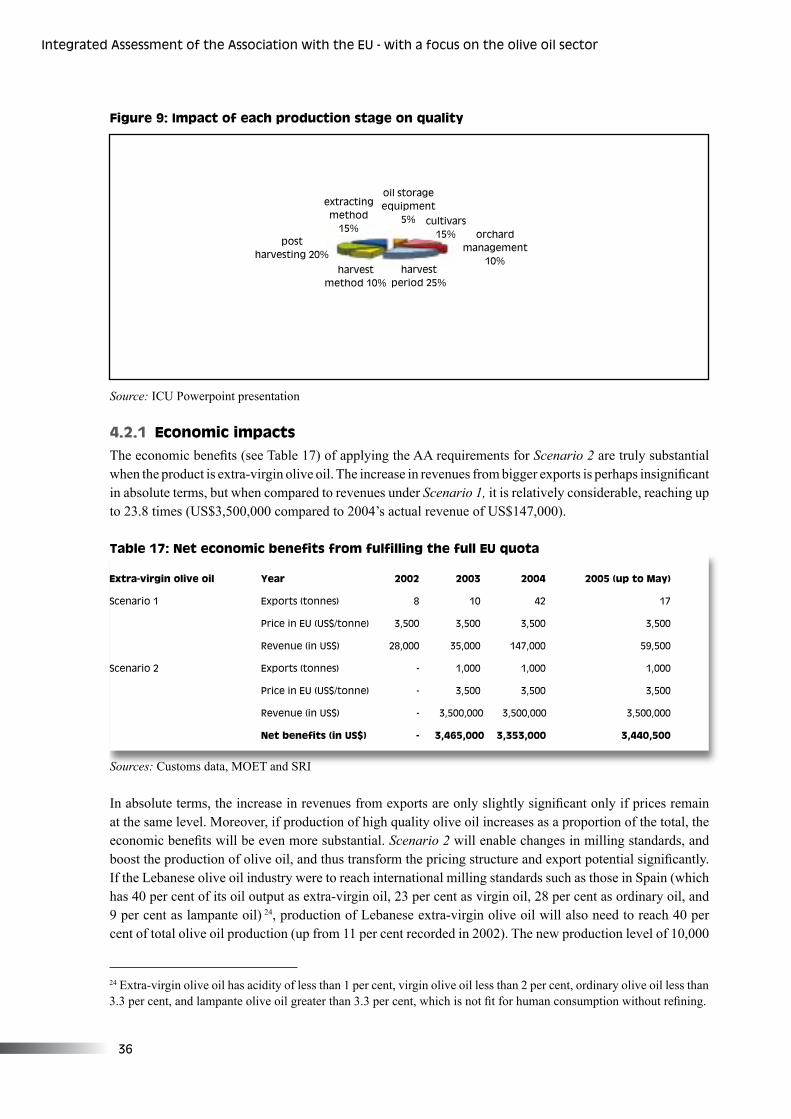
��
Integrated Assessment of the Assoc�at�on w�th the EU - w�th a focus on the ol�ve o�l sector
Extra-virgin olive oil Year 2002 2003 2004 2005 (up to May)
Scenar�o � Exports (tonnes) 8 �0 �� �7
Pr�ce �n EU (US$/tonne) �,�00 �,�00 �,�00 �,�00
Revenue (�n US$) �8,000 ��,000 ��7,000 �9,�00
Scenar�o � Exports (tonnes) - �,000 �,000 �,000
Pr�ce �n EU (US$/tonne) - �,�00 �,�00 �,�00
Revenue (�n US$) - �,�00,000 �,�00,000 �,�00,000
Net benefits (in US$) - 3,465,000 3,353,000 3,440,500
24 Extra-virgin olive oil has acidity of less than 1 per cent, virgin olive oil less than 2 per cent, ordinary olive oil less than 3.3 per cent, and lampante olive oil greater than 3.3 per cent, which is not fit for human consumption without refining.
Figure 9: Impact of each production stage on quality
Source: ICU Powerpoint presentation
4.2.1 Economic impacts The economic benefits (see Table 17) of applying the AA requirements for Scenario 2 are truly substantial when the product is extra-virgin olive oil. The increase in revenues from bigger exports is perhaps insignificant in absolute terms, but when compared to revenues under Scenario 1, it is relatively considerable, reaching up to 23.8 times (US$3,500,000 compared to 2004’s actual revenue of US$147,000).
Table 17: Net economic benefits from fulfilling the full EU quota
Sources: Customs data, MOET and SRI
In absolute terms, the increase in revenues from exports are only slightly significant only if prices remain at the same level. Moreover, if production of high quality olive oil increases as a proportion of the total, the economic benefits will be even more substantial. Scenario 2 will enable changes in milling standards, and boost the production of olive oil, and thus transform the pricing structure and export potential significantly. If the Lebanese olive oil industry were to reach international milling standards such as those in Spain (which has 40 per cent of its oil output as extra-virgin oil, 23 per cent as virgin oil, 28 per cent as ordinary oil, and 9 per cent as lampante oil) 24, production of Lebanese extra-virgin olive oil will also need to reach 40 per cent of total olive oil production (up from 11 per cent recorded in 2002). The new production level of 10,000
extract�ng method
��%
o�l storage equ�pment
�% cult�vars ��% orchard
management�0%
harvestper�od ��%
harvestmethod �0%
postharvest�ng �0%
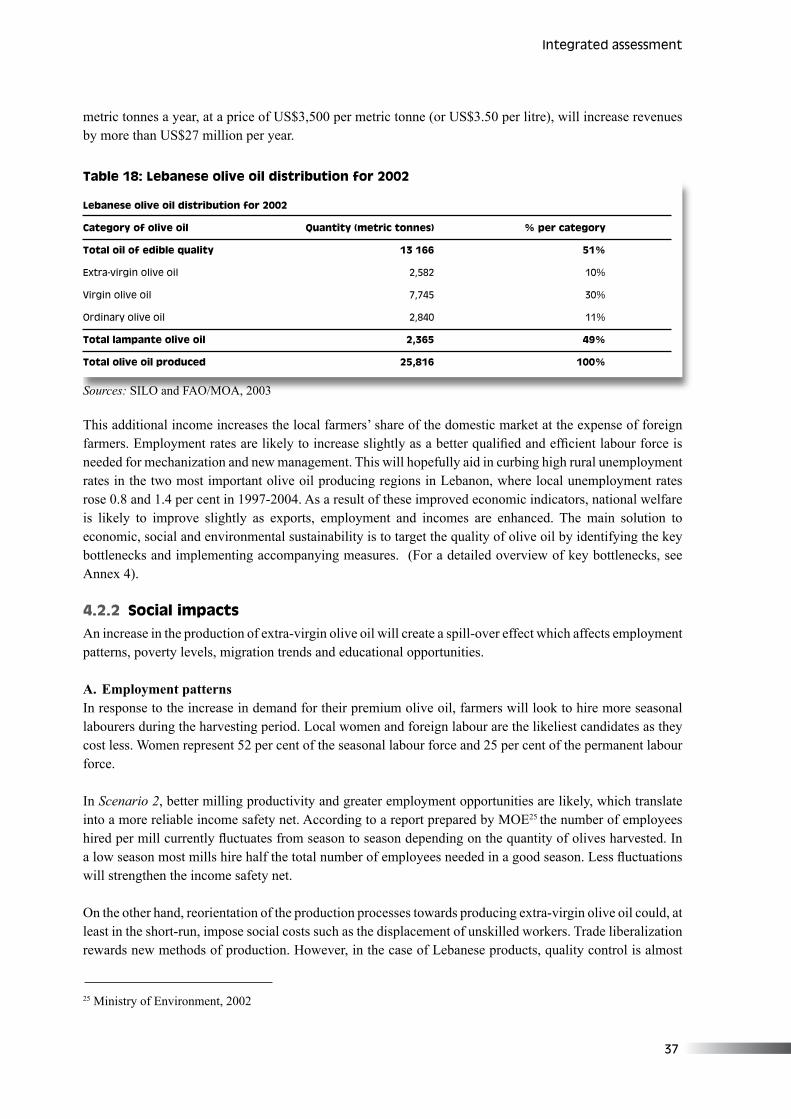
�7
metric tonnes a year, at a price of US$3,500 per metric tonne (or US$3.50 per litre), will increase revenues by more than US$27 million per year.
Table 18: Lebanese olive oil distribution for 2002
Sources: SILO and FAO/MOA, 2003
This additional income increases the local farmers’ share of the domestic market at the expense of foreign farmers. Employment rates are likely to increase slightly as a better qualified and efficient labour force is needed for mechanization and new management. This will hopefully aid in curbing high rural unemployment rates in the two most important olive oil producing regions in Lebanon, where local unemployment rates rose 0.8 and 1.4 per cent in 1997-2004. As a result of these improved economic indicators, national welfare is likely to improve slightly as exports, employment and incomes are enhanced. The main solution to economic, social and environmental sustainability is to target the quality of olive oil by identifying the key bottlenecks and implementing accompanying measures. (For a detailed overview of key bottlenecks, see Annex 4).
4.2.2 Social impacts An increase in the production of extra-virgin olive oil will create a spill-over effect which affects employment patterns, poverty levels, migration trends and educational opportunities.
A. Employment patterns In response to the increase in demand for their premium olive oil, farmers will look to hire more seasonal labourers during the harvesting period. Local women and foreign labour are the likeliest candidates as they cost less. Women represent 52 per cent of the seasonal labour force and 25 per cent of the permanent labour force.
In Scenario 2, better milling productivity and greater employment opportunities are likely, which translate into a more reliable income safety net. According to a report prepared by MOE25 the number of employees hired per mill currently fluctuates from season to season depending on the quantity of olives harvested. In a low season most mills hire half the total number of employees needed in a good season. Less fluctuations will strengthen the income safety net.
On the other hand, reorientation of the production processes towards producing extra-virgin olive oil could, at least in the short-run, impose social costs such as the displacement of unskilled workers. Trade liberalization rewards new methods of production. However, in the case of Lebanese products, quality control is almost
Lebanese olive oil distribution for 2002
Category of olive oil Quantity (metric tonnes) % per category
Total oil of edible quality 13 166 51%
Extra-v�rg�n ol�ve o�l �,�8� �0%
V�rg�n ol�ve o�l 7,7�� �0%
Ord�nary ol�ve o�l �,8�0 ��%
Total lampante olive oil 2,365 49%
Total olive oil produced 25,816 100%
25 Ministry of Environment, 2002
Integrated assessment
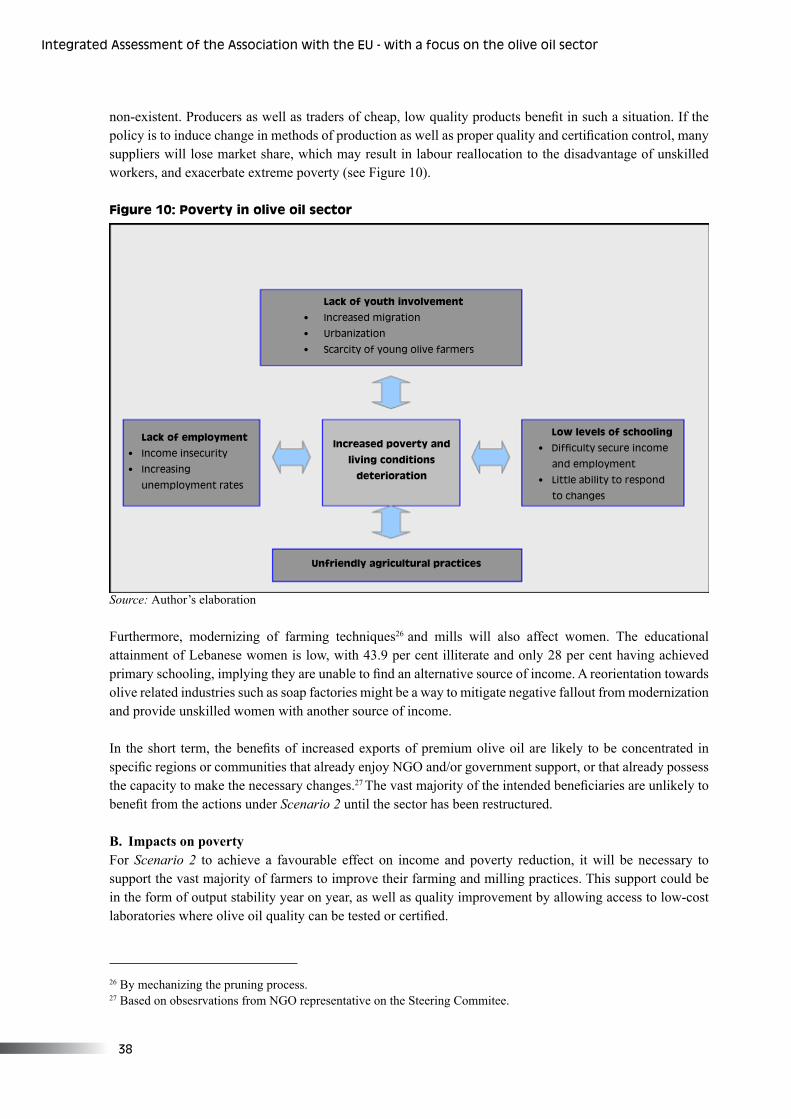
�8
Integrated Assessment of the Assoc�at�on w�th the EU - w�th a focus on the ol�ve o�l sector
non-existent. Producers as well as traders of cheap, low quality products benefit in such a situation. If the policy is to induce change in methods of production as well as proper quality and certification control, many suppliers will lose market share, which may result in labour reallocation to the disadvantage of unskilled workers, and exacerbate extreme poverty (see Figure 10).
Figure 10: Poverty in olive oil sector
Source: Author’s elaboration
Furthermore, modernizing of farming techniques26 and mills will also affect women. The educational attainment of Lebanese women is low, with 43.9 per cent illiterate and only 28 per cent having achieved primary schooling, implying they are unable to find an alternative source of income. A reorientation towards olive related industries such as soap factories might be a way to mitigate negative fallout from modernization and provide unskilled women with another source of income.
In the short term, the benefits of increased exports of premium olive oil are likely to be concentrated in specific regions or communities that already enjoy NGO and/or government support, or that already possess the capacity to make the necessary changes.27 The vast majority of the intended beneficiaries are unlikely to benefit from the actions under Scenario 2 until the sector has been restructured.
B. Impacts on poverty For Scenario 2 to achieve a favourable effect on income and poverty reduction, it will be necessary to support the vast majority of farmers to improve their farming and milling practices. This support could be in the form of output stability year on year, as well as quality improvement by allowing access to low-cost laboratories where olive oil quality can be tested or certified.
26 By mechanizing the pruning process.27 Based on obsesrvations from NGO representative on the Steering Commitee.
Lack of youth involvement
• Increased m�grat�on
• Urban�zat�on
• Scarc�ty of young ol�ve farmers
Lack of employment
• Income �nsecur�ty
• Increas�ng
unemployment rates
Increased poverty and
living conditions
deterioration
Unfriendly agricultural practices
Low levels of schooling
• Difficulty secure income
and employment
• L�ttle ab�l�ty to respond
to changes
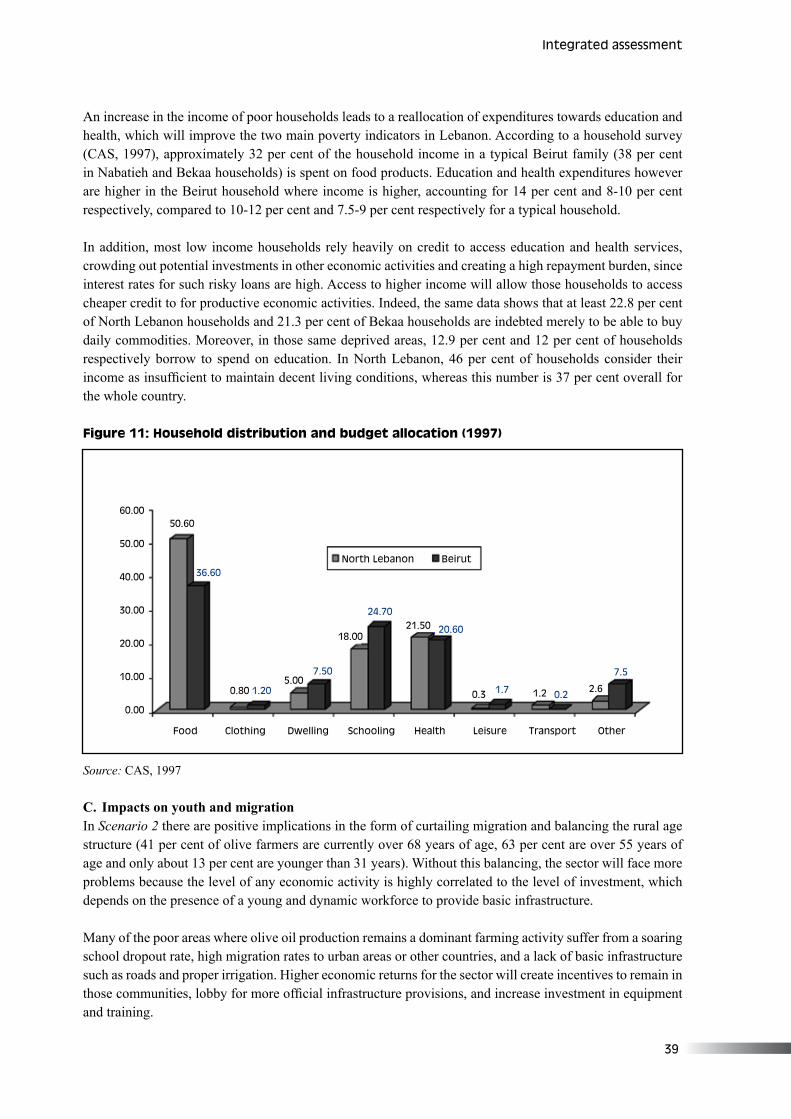
�9
An increase in the income of poor households leads to a reallocation of expenditures towards education and health, which will improve the two main poverty indicators in Lebanon. According to a household survey (CAS, 1997), approximately 32 per cent of the household income in a typical Beirut family (38 per cent in Nabatieh and Bekaa households) is spent on food products. Education and health expenditures however are higher in the Beirut household where income is higher, accounting for 14 per cent and 8-10 per cent respectively, compared to 10-12 per cent and 7.5-9 per cent respectively for a typical household.
In addition, most low income households rely heavily on credit to access education and health services, crowding out potential investments in other economic activities and creating a high repayment burden, since interest rates for such risky loans are high. Access to higher income will allow those households to access cheaper credit to for productive economic activities. Indeed, the same data shows that at least 22.8 per cent of North Lebanon households and 21.3 per cent of Bekaa households are indebted merely to be able to buy daily commodities. Moreover, in those same deprived areas, 12.9 per cent and 12 per cent of households respectively borrow to spend on education. In North Lebanon, 46 per cent of households consider their income as insufficient to maintain decent living conditions, whereas this number is 37 per cent overall for the whole country.
Figure 11: Household distribution and budget allocation (1997)
Source: CAS, 1997
C. Impacts on youth and migration In Scenario 2 there are positive implications in the form of curtailing migration and balancing the rural age structure (41 per cent of olive farmers are currently over 68 years of age, 63 per cent are over 55 years of age and only about 13 per cent are younger than 31 years). Without this balancing, the sector will face more problems because the level of any economic activity is highly correlated to the level of investment, which depends on the presence of a young and dynamic workforce to provide basic infrastructure.
Many of the poor areas where olive oil production remains a dominant farming activity suffer from a soaring school dropout rate, high migration rates to urban areas or other countries, and a lack of basic infrastructure such as roads and proper irrigation. Higher economic returns for the sector will create incentives to remain in those communities, lobby for more official infrastructure provisions, and increase investment in equipment and training.
�0.00
�0.00
�0.00
�0.00
�0.00
�0.00
0.00
North Lebanon Be�rut
Food Cloth�ng Dwell�ng School�ng Health Le�sure Transport Other
Integrated assessment
�0.�0
��.�0
0.80 �.�0�.00
7.�0
�8.00
��.70��.�0 �0.�0
0.� �.7 �.� 0.��.�
7.�
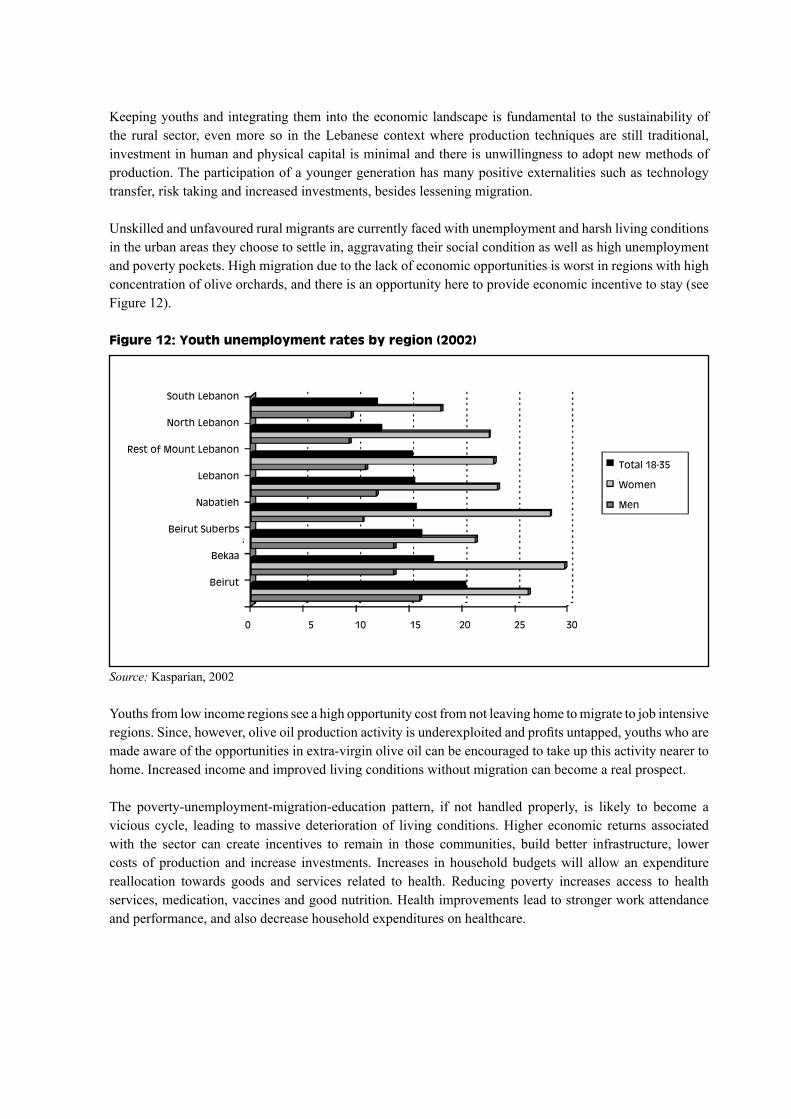
Keeping youths and integrating them into the economic landscape is fundamental to the sustainability of the rural sector, even more so in the Lebanese context where production techniques are still traditional, investment in human and physical capital is minimal and there is unwillingness to adopt new methods of production. The participation of a younger generation has many positive externalities such as technology transfer, risk taking and increased investments, besides lessening migration.
Unskilled and unfavoured rural migrants are currently faced with unemployment and harsh living conditions in the urban areas they choose to settle in, aggravating their social condition as well as high unemployment and poverty pockets. High migration due to the lack of economic opportunities is worst in regions with high concentration of olive orchards, and there is an opportunity here to provide economic incentive to stay (see Figure 12).
Figure 12: Youth unemployment rates by region (2002)
Source: Kasparian, 2002
Youths from low income regions see a high opportunity cost from not leaving home to migrate to job intensive regions. Since, however, olive oil production activity is underexploited and profits untapped, youths who are made aware of the opportunities in extra-virgin olive oil can be encouraged to take up this activity nearer to home. Increased income and improved living conditions without migration can become a real prospect.
The poverty-unemployment-migration-education pattern, if not handled properly, is likely to become a vicious cycle, leading to massive deterioration of living conditions. Higher economic returns associated with the sector can create incentives to remain in those communities, build better infrastructure, lower costs of production and increase investments. Increases in household budgets will allow an expenditure reallocation towards goods and services related to health. Reducing poverty increases access to health services, medication, vaccines and good nutrition. Health improvements lead to stronger work attendance and performance, and also decrease household expenditures on healthcare.
South Lebanon
North Lebanon
Rest of Mount Lebanon
Lebanon
Nabat�eh
Be�rut Suberbs
Bekaa
Be�rut
0 � �0 �� �0 �� �0
Total �8-��
Women
Men
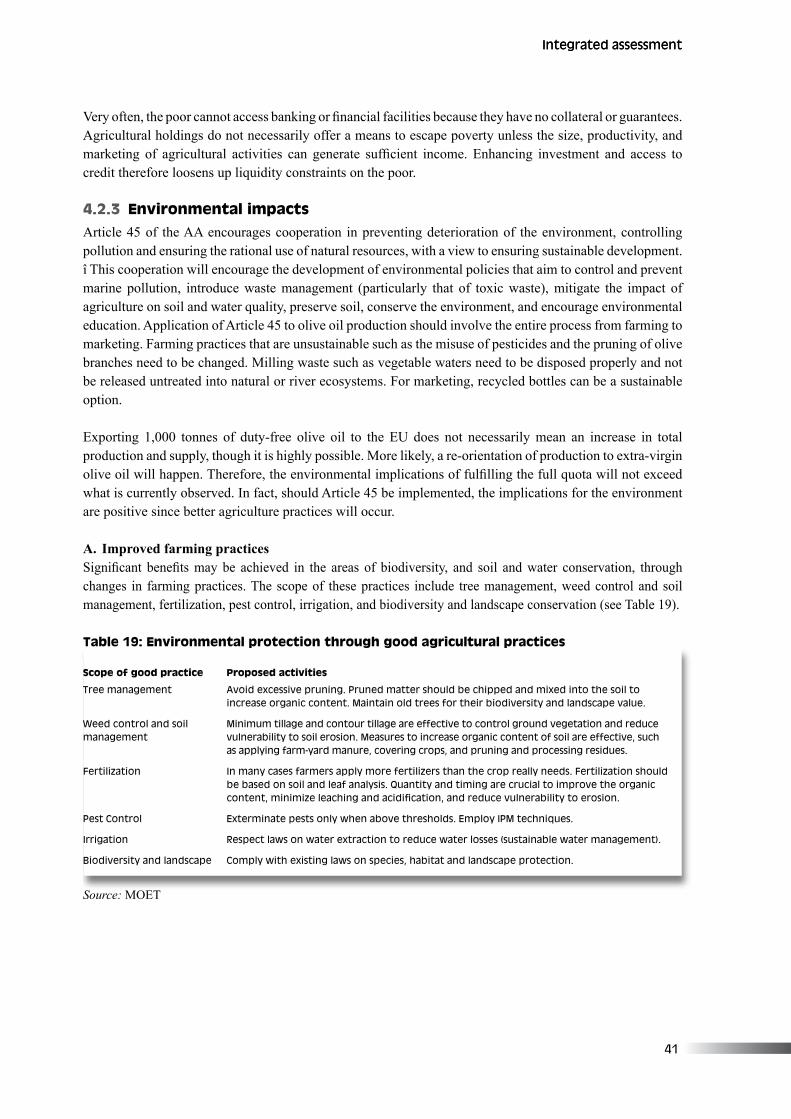
��
Very often, the poor cannot access banking or financial facilities because they have no collateral or guarantees. Agricultural holdings do not necessarily offer a means to escape poverty unless the size, productivity, and marketing of agricultural activities can generate sufficient income. Enhancing investment and access to credit therefore loosens up liquidity constraints on the poor.
4.2.3 Environmental impacts Article 45 of the AA encourages cooperation in preventing deterioration of the environment, controlling pollution and ensuring the rational use of natural resources, with a view to ensuring sustainable development.î This cooperation will encourage the development of environmental policies that aim to control and prevent marine pollution, introduce waste management (particularly that of toxic waste), mitigate the impact of agriculture on soil and water quality, preserve soil, conserve the environment, and encourage environmental education. Application of Article 45 to olive oil production should involve the entire process from farming to marketing. Farming practices that are unsustainable such as the misuse of pesticides and the pruning of olive branches need to be changed. Milling waste such as vegetable waters need to be disposed properly and not be released untreated into natural or river ecosystems. For marketing, recycled bottles can be a sustainable option.
Exporting 1,000 tonnes of duty-free olive oil to the EU does not necessarily mean an increase in total production and supply, though it is highly possible. More likely, a re-orientation of production to extra-virgin olive oil will happen. Therefore, the environmental implications of fulfilling the full quota will not exceed what is currently observed. In fact, should Article 45 be implemented, the implications for the environment are positive since better agriculture practices will occur.
A. Improved farming practicesSignificant benefits may be achieved in the areas of biodiversity, and soil and water conservation, through changes in farming practices. The scope of these practices include tree management, weed control and soil management, fertilization, pest control, irrigation, and biodiversity and landscape conservation (see Table 19).
Table 19: Environmental protection through good agricultural practices
Source: MOET
Scope of good practice Proposed activities
Tree management Avo�d excess�ve prun�ng. Pruned matter should be ch�pped and m�xed �nto the so�l to �ncrease organ�c content. Ma�nta�n old trees for the�r b�od�vers�ty and landscape value.
Weed control and so�l M�n�mum t�llage and contour t�llage are effect�ve to control ground vegetat�on and reduce management vulnerab�l�ty to so�l eros�on. Measures to �ncrease organ�c content of so�l are effect�ve, such as apply�ng farm-yard manure, cover�ng crops, and prun�ng and process�ng res�dues.
Fert�l�zat�on In many cases farmers apply more fert�l�zers than the crop really needs. Fert�l�zat�on should be based on so�l and leaf analys�s. Quant�ty and t�m�ng are cruc�al to �mprove the organ�c content, minimize leaching and acidification, and reduce vulnerability to erosion.
Pest Control Exterm�nate pests only when above thresholds. Employ IPM techn�ques.
Irr�gat�on Respect laws on water extract�on to reduce water losses (susta�nable water management).
B�od�vers�ty and landscape Comply w�th ex�st�ng laws on spec�es, hab�tat and landscape protect�on.
Integrated assessmentIntegrated assessment
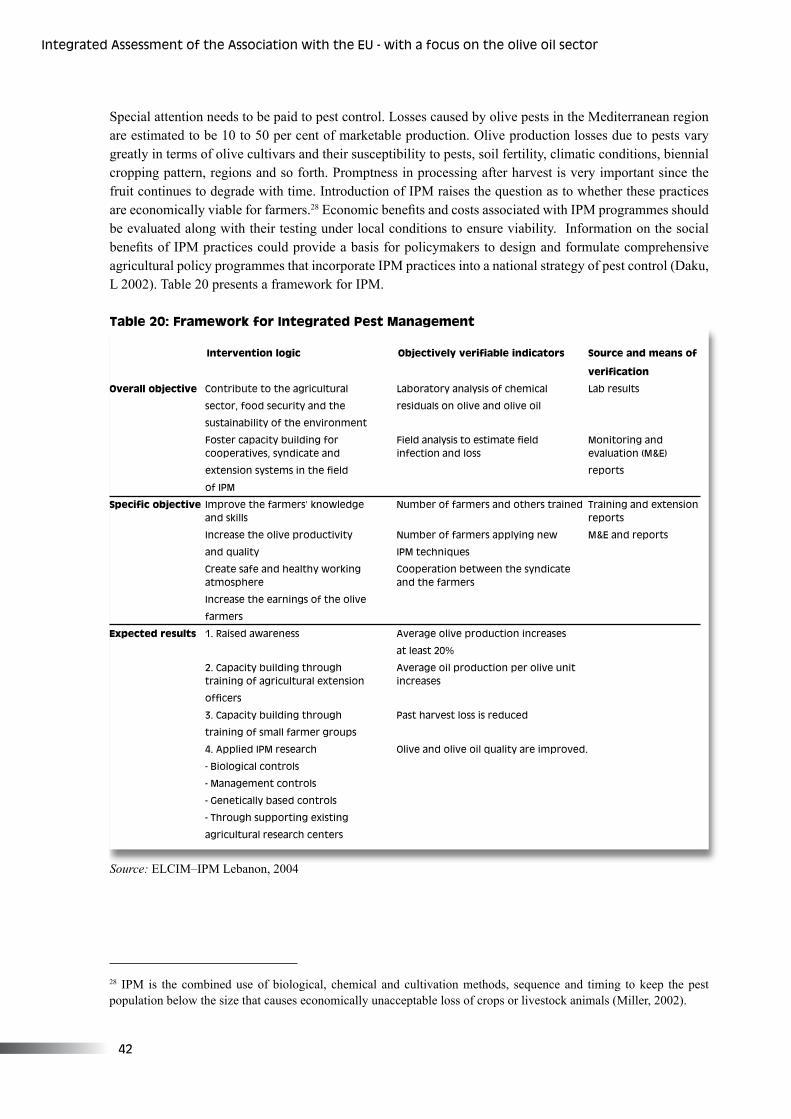
��
Integrated Assessment of the Assoc�at�on w�th the EU - w�th a focus on the ol�ve o�l sector
Special attention needs to be paid to pest control. Losses caused by olive pests in the Mediterranean region are estimated to be 10 to 50 per cent of marketable production. Olive production losses due to pests vary greatly in terms of olive cultivars and their susceptibility to pests, soil fertility, climatic conditions, biennial cropping pattern, regions and so forth. Promptness in processing after harvest is very important since the fruit continues to degrade with time. Introduction of IPM raises the question as to whether these practices are economically viable for farmers.28 Economic benefits and costs associated with IPM programmes should be evaluated along with their testing under local conditions to ensure viability. Information on the social benefits of IPM practices could provide a basis for policymakers to design and formulate comprehensive agricultural policy programmes that incorporate IPM practices into a national strategy of pest control (Daku, L 2002). Table 20 presents a framework for IPM.
Table 20: Framework for Integrated Pest Management
Source: ELCIM–IPM Lebanon, 2004
Intervention logic Objectively verifiable indicators Source and means of
verification
Overall objective Contr�bute to the agr�cultural Laboratory analys�s of chem�cal Lab results
sector, food secur�ty and the res�duals on ol�ve and ol�ve o�l
susta�nab�l�ty of the env�ronment
Foster capacity building for Field analysis to estimate field Monitoring and cooperat�ves, synd�cate and �nfect�on and loss evaluat�on (M&E)
extension systems in the field reports
of IPM
Specific objective Improve the farmers’ knowledge Number of farmers and others tra�ned Tra�n�ng and extens�on and sk�lls reports
Increase the ol�ve product�v�ty Number of farmers apply�ng new M&E and reports
and qual�ty IPM techn�ques
Create safe and healthy work�ng Cooperat�on between the synd�cate atmosphere and the farmers
Increase the earn�ngs of the ol�ve
farmers
Expected results �. Ra�sed awareness Average ol�ve product�on �ncreases
at least �0%
�. Capac�ty bu�ld�ng through Average o�l product�on per ol�ve un�t tra�n�ng of agr�cultural extens�on �ncreases
officers
�. Capac�ty bu�ld�ng through Past harvest loss �s reduced
tra�n�ng of small farmer groups
�. Appl�ed IPM research Ol�ve and ol�ve o�l qual�ty are �mproved.
- B�olog�cal controls
- Management controls
- Genet�cally based controls
- Through support�ng ex�st�ng
agr�cultural research centers
28 IPM is the combined use of biological, chemical and cultivation methods, sequence and timing to keep the pest population below the size that causes economically unacceptable loss of crops or livestock animals (Miller, 2002).
��
B. Enhanced milling processesTreatment technologies for olive mill wastewater include anaerobic treatment, aerobic treatment, thermal and natural evaporation, composting, absorption and bio-filtration, irrigation, lime treatment, membrane processes and damp oxidation, among others. Annex 2 (see Table A2.1) sketches these technologies and processes, including the advantages and disadvantages of each and the associated cost of treating OMW. Annex 2 (see Table A2.2) also presents the factors that need to be considered when selecting a treatment technology for olive mill wastewater.
When it comes to olive mill pomace, the main solid wastes generated are spent olives and moist spent olives. The treatments available on an industrial and economically viable scale for mills of suitable size are: • Drying of spent olives and extraction of olive kernel oil. • Drying of mixtures of spent olives and moist spent olives followed by extraction. • Second extraction by centrifuge of the moist spent olives and incineration of treated moist spent olives to
produce electricity (not viable in Lebanon).• With certain limitations (market, demand and distances), part of the waste is utilized for compost, treated
to obtain active carbon, or used as additives for animal fodder (RAC/CP, 2000).
Annex 2 (Table A2.3) also outlines the possible treatment options for pomace in Lebanon, indicating their respective advantage and disadvantages. The choice of one treatment technology over another, whether for olive mill wastewater or pomace, depends on factors such as:
• The location of the oil mill and the surrounding conditions, such as availability of lands with appropriate crops, urban or rural character, and the existence of demand for residues and by-products.
• The dimensions of the oil-mill in terms of volume of olive milled (or the quantity of residues and by-products generated).
• The existence of olive-kernel oil or second extraction industries at a reasonable distance.• The degree of organization or integration, current or potential, between oil mills in the same area. • The costs of investment and technical know-how, and the method of payment (RAC/CP, 2000).
C. Improved marketing Increased marketing of Lebanese olive oil in foreign markets is essential to ensure sales and profits. This undoubtedly requires new bottling and packaging options, or at least an increase in packaging material. Increased transportation distances and options are also expected.
D. Integrated environmental impacts Mitigation of environmental impacts has implications for employment in the olive oil sector. The establishment of wastewater treatment plants, whether for olive oil vegetable water or municipal sewage alike, requires both skilled and unskilled operators.
More importantly, the preservation of natural ecosystems is essential for eco-tourism in many regions in Lebanon. The situation of the Hasbani River discussed in Box 2 can be seen in other regions. Such disregard of river ecosystems results in loss of biodiversity and income opportunities. Environmental degradation leads to lower soil productivity and affects the quality of olives. Land degradation is caused by depletion of soil organic matter lessening land fertility and moisture retention among other things. This will lead to a reduction in productivity of olive orchards, Farmers will then have the tendency to intensify the exploitation of land and the plantations by overusing fertilizers and other drastic measures.
Integrated assessment
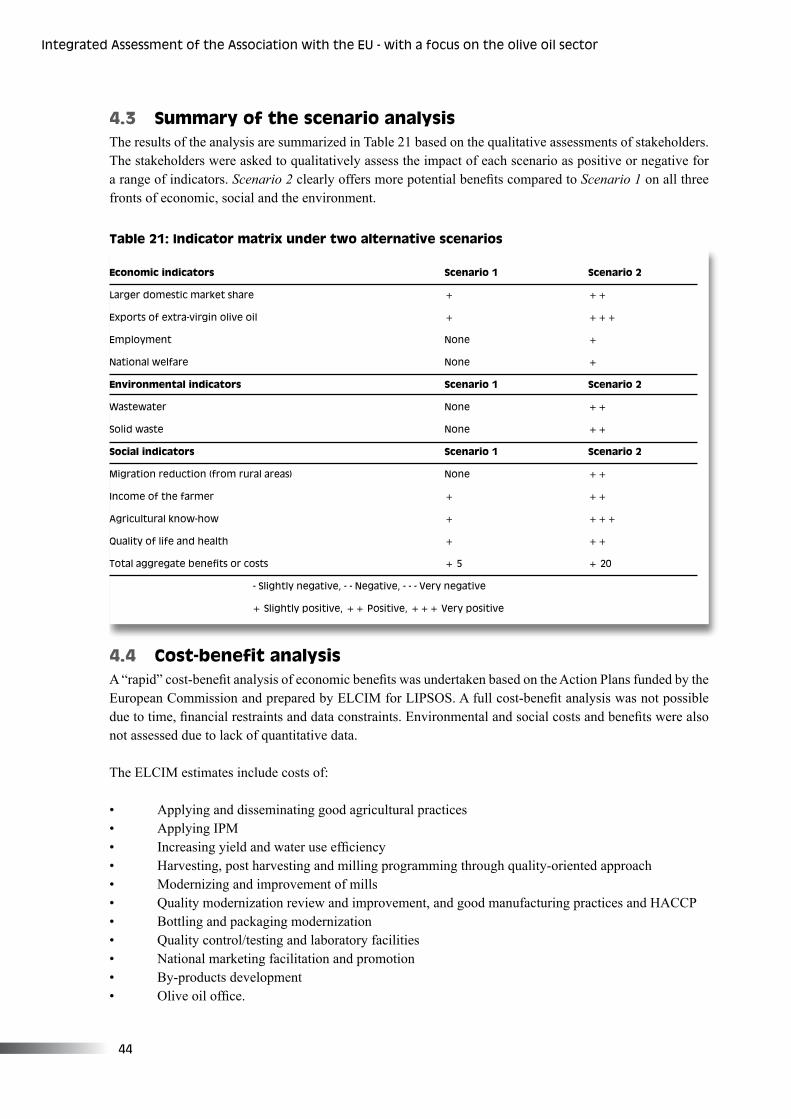
��
Integrated Assessment of the Assoc�at�on w�th the EU - w�th a focus on the ol�ve o�l sector
4.3 Summary of the scenario analysis The results of the analysis are summarized in Table 21 based on the qualitative assessments of stakeholders. The stakeholders were asked to qualitatively assess the impact of each scenario as positive or negative for a range of indicators. Scenario 2 clearly offers more potential benefits compared to Scenario 1 on all three fronts of economic, social and the environment.
Table 21: Indicator matrix under two alternative scenarios
4.4 Cost-benefit analysis A “rapid” cost-benefit analysis of economic benefits was undertaken based on the Action Plans funded by the European Commission and prepared by ELCIM for LIPSOS. A full cost-benefit analysis was not possible due to time, financial restraints and data constraints. Environmental and social costs and benefits were also not assessed due to lack of quantitative data.
The ELCIM estimates include costs of:
• Applying and disseminating good agricultural practices• Applying IPM• Increasing yield and water use efficiency • Harvesting, post harvesting and milling programming through quality-oriented approach• Modernizing and improvement of mills • Quality modernization review and improvement, and good manufacturing practices and HACCP • Bottling and packaging modernization• Quality control/testing and laboratory facilities • National marketing facilitation and promotion • By-products development• Olive oil office.
Economic indicators Scenario 1 Scenario 2
Larger domest�c market share + ++
Exports of extra-v�rg�n ol�ve o�l + +++
Employment None +
Nat�onal welfare None +
Environmental indicators Scenario 1 Scenario 2
Wastewater None ++
Sol�d waste None ++
Social indicators Scenario 1 Scenario 2
M�grat�on reduct�on (from rural areas) None ++
Income of the farmer + ++
Agr�cultural know-how + +++
Qual�ty of l�fe and health + ++
Total aggregate benefits or costs + 5 + 20
- Sl�ghtly negat�ve, - - Negat�ve, - - - Very negat�ve
+ Sl�ghtly pos�t�ve, ++ Pos�t�ve, +++ Very pos�t�ve
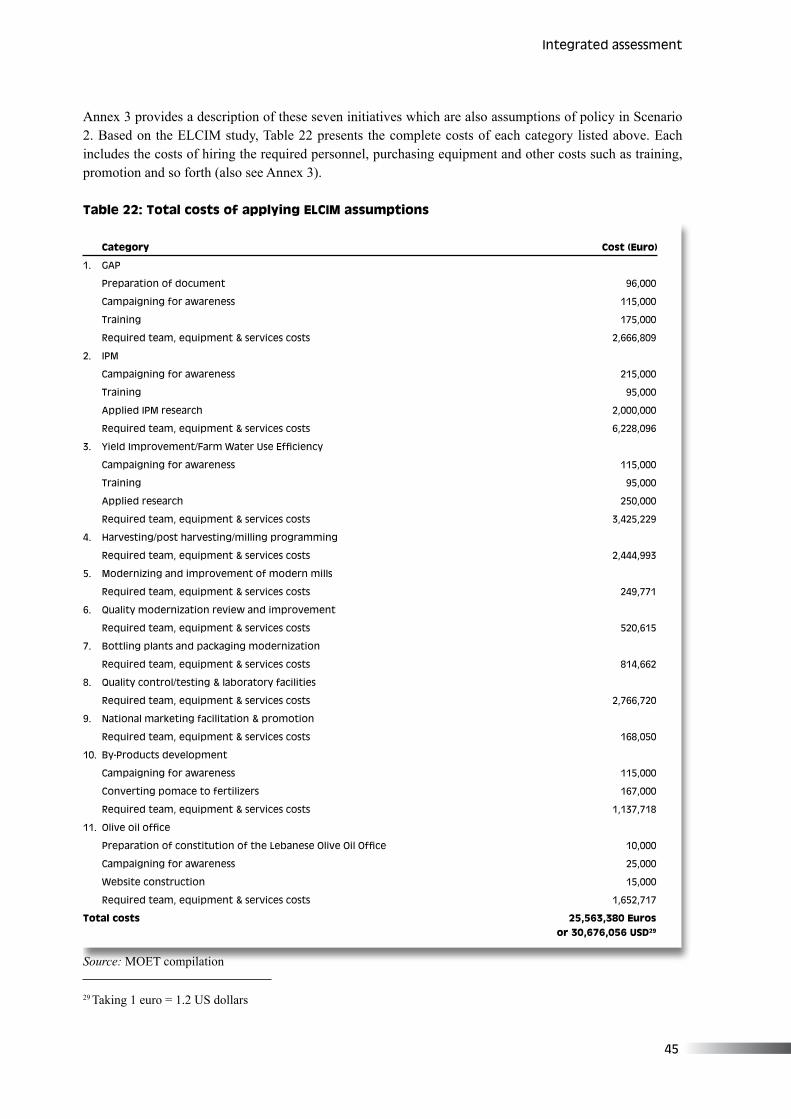
��
Annex 3 provides a description of these seven initiatives which are also assumptions of policy in Scenario 2. Based on the ELCIM study, Table 22 presents the complete costs of each category listed above. Each includes the costs of hiring the required personnel, purchasing equipment and other costs such as training, promotion and so forth (also see Annex 3).
Table 22: Total costs of applying ELCIM assumptions
Source: MOET compilation
Category Cost (Euro)
�. GAP
Preparat�on of document 9�,000
Campa�gn�ng for awareness ���,000
Tra�n�ng �7�,000
Requ�red team, equ�pment & serv�ces costs �,���,809
�. IPM
Campa�gn�ng for awareness ���,000
Tra�n�ng 9�,000
Appl�ed IPM research �,000,000
Requ�red team, equ�pment & serv�ces costs �,��8,09�
3. Yield Improvement/Farm Water Use Efficiency
Campa�gn�ng for awareness ���,000
Tra�n�ng 9�,000
Appl�ed research ��0,000
Requ�red team, equ�pment & serv�ces costs �,���,��9
�. Harvest�ng/post harvest�ng/m�ll�ng programm�ng
Requ�red team, equ�pment & serv�ces costs �,���,99�
�. Modern�z�ng and �mprovement of modern m�lls
Requ�red team, equ�pment & serv�ces costs ��9,77�
�. Qual�ty modern�zat�on rev�ew and �mprovement
Requ�red team, equ�pment & serv�ces costs ��0,���
7. Bottl�ng plants and packag�ng modern�zat�on
Requ�red team, equ�pment & serv�ces costs 8��,���
8. Qual�ty control/test�ng & laboratory fac�l�t�es
Requ�red team, equ�pment & serv�ces costs �,7��,7�0
9. Nat�onal market�ng fac�l�tat�on & promot�on
Requ�red team, equ�pment & serv�ces costs ��8,0�0
�0. By-Products development
Campa�gn�ng for awareness ���,000
Convert�ng pomace to fert�l�zers ��7,000
Requ�red team, equ�pment & serv�ces costs �,��7,7�8
11. Olive oil office
Preparation of constitution of the Lebanese Olive Oil Office 10,000
Campa�gn�ng for awareness ��,000
Webs�te construct�on ��,000
Requ�red team, equ�pment & serv�ces costs �,���,7�7
Total costs 25,563,380 Euros or 30,676,056 USD29
29 Taking 1 euro = 1.2 US dollars
Integrated assessment
��
Integrated Assessment of the Assoc�at�on w�th the EU - w�th a focus on the ol�ve o�l sector
The calculations in Table 22 cover the costs of the seven action plans mentioned, but must be seen in the light of periodic investments, since a number of items have limited timespans. Hence the overall cost for the initial investment is spread out across these varying time frames to a maximum of 16 years. However, most of these costs are incurred in the first two years of the Action Plans, time discounting is unnecessary. The investments are national in coverage, as most of the regions are targeted.
Mills modernization however is aimed at only modern mills and not traditional ones. The quality of olive oil is guaranteed with modern mills and not with traditional ones. The conversion of traditional mills to modern ones has the following considerations:
• The capacity of a modern mill is about three times that of a traditional mill.• There are 435 traditional mills. • Therefore, only 145 (a third of the traditional mills) need to be converted to maintain production. • Given the cost of a complete new mill at US$350,000 (SRI, 2004), the total cost of 145 new modern mills
is US$50,750,000.
All in all, the economic values indicated an immense potential benefit from applying Scenario 2-type assumptions:
• Total projected costs of all action plans under Article 45, including changing traditional mills to modern ones, were estimated to be about US$81.4 million, spread out across varying time frames to a maximum of 16 years.
• The benefits were assumed to be US$27 million per year over a 13-year period, commencing within three years of implementation. These benefits had to be mathematically discounted as they extended into the future.
• Consequently, the CBA showed that total net benefits (total benefits deducting estimated costs) from applying Scenario 2 were approximately US$269.6 million, US$137.3 million, and US$79.39 million applying discount rates of 0 per cent, 3 per cent and 5 per cent respectively .
�7
�. Recommendat�ons and proposed measures
5.1 General recommendations Recommendations to improve the olive oil sector are drawn on the identification of key bottlenecks (see Annex 4) and the views of the Steering Committee.
A. Recommendations to the EU: The European Union has a very important role to play in facilitating access of Lebanese products and olive oil to European markets. Proposed measures include:
1. Continue technical and financial assistance within the framework of the European Neighborhood Policy (ENP).
2. Commit to enforce relevant regulations.
3. Trade regulations, such as quality standards and duties, should be communicated to all parties involved to ensure efficiency and to minimize rejected products.
4. Technical and non-trade barriers such as lengthy bureaucratic procedures should be revised or eliminated when possible.
B. Recommendations to the Government of Lebanon1. The Government should encourage each region in Lebanon to brand their olive oil.
2. The Government should create an enabling environment by improving inter and intra-ministerial coordination.
3. The Government, through MOET should upgrade and certify existing testing laboratories, disseminate
information and build databases (based on surveys of olive oil quality output).
4. The Government, through MOA should provide training for farmers and mill operators on good agricultural practices and good milling practices, facilitate by-product management, and provide access to capital.
5. The treatment of wastewater ought to be financed and implemented by the Government through MOE in order to preserve environmental ecosystems in the regions of olive oil production. Pomace not used for heating purposes should be treated in accordance with the technologies specified in Annex 2. Economic instruments (e.g. a small charge per litre or kilogram of wastewater and pomace levied on mill operators) could be used for cost recovery, and operation and maintenance of these treatment plants.
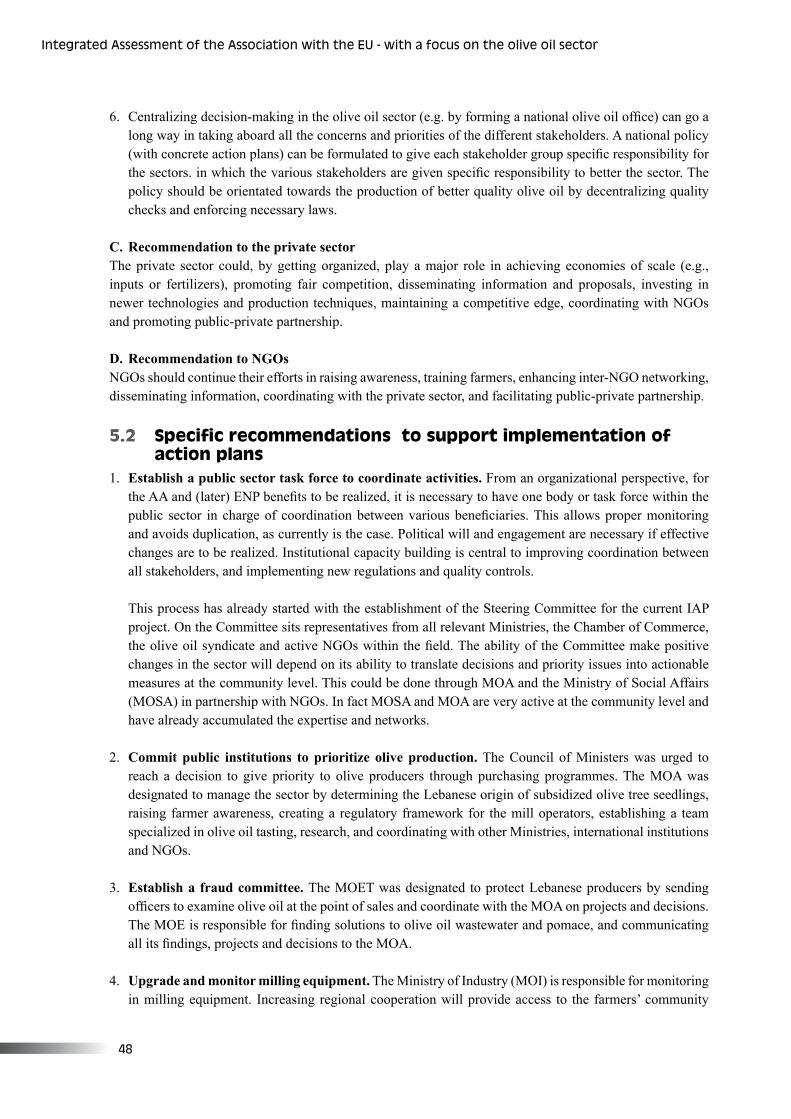
�8
Integrated Assessment of the Assoc�at�on w�th the EU - w�th a focus on the ol�ve o�l sector
6. Centralizing decision-making in the olive oil sector (e.g. by forming a national olive oil office) can go a long way in taking aboard all the concerns and priorities of the different stakeholders. A national policy (with concrete action plans) can be formulated to give each stakeholder group specific responsibility for the sectors. in which the various stakeholders are given specific responsibility to better the sector. The policy should be orientated towards the production of better quality olive oil by decentralizing quality checks and enforcing necessary laws.
C. Recommendation to the private sectorThe private sector could, by getting organized, play a major role in achieving economies of scale (e.g., inputs or fertilizers), promoting fair competition, disseminating information and proposals, investing in newer technologies and production techniques, maintaining a competitive edge, coordinating with NGOs and promoting public-private partnership.
D. Recommendation to NGOsNGOs should continue their efforts in raising awareness, training farmers, enhancing inter-NGO networking, disseminating information, coordinating with the private sector, and facilitating public-private partnership.
5.2 Specific recommendations to support implementation of action plans
1. Establish a public sector task force to coordinate activities. From an organizational perspective, for the AA and (later) ENP benefits to be realized, it is necessary to have one body or task force within the public sector in charge of coordination between various beneficiaries. This allows proper monitoring and avoids duplication, as currently is the case. Political will and engagement are necessary if effective changes are to be realized. Institutional capacity building is central to improving coordination between all stakeholders, and implementing new regulations and quality controls.
This process has already started with the establishment of the Steering Committee for the current IAP project. On the Committee sits representatives from all relevant Ministries, the Chamber of Commerce, the olive oil syndicate and active NGOs within the field. The ability of the Committee make positive changes in the sector will depend on its ability to translate decisions and priority issues into actionable measures at the community level. This could be done through MOA and the Ministry of Social Affairs (MOSA) in partnership with NGOs. In fact MOSA and MOA are very active at the community level and have already accumulated the expertise and networks.
2. Commit public institutions to prioritize olive production. The Council of Ministers was urged to reach a decision to give priority to olive producers through purchasing programmes. The MOA was designated to manage the sector by determining the Lebanese origin of subsidized olive tree seedlings, raising farmer awareness, creating a regulatory framework for the mill operators, establishing a team specialized in olive oil tasting, research, and coordinating with other Ministries, international institutions and NGOs.
3. Establish a fraud committee. The MOET was designated to protect Lebanese producers by sending officers to examine olive oil at the point of sales and coordinate with the MOA on projects and decisions. The MOE is responsible for finding solutions to olive oil wastewater and pomace, and communicating all its findings, projects and decisions to the MOA.
4. Upgrade and monitor milling equipment. The Ministry of Industry (MOI) is responsible for monitoring in milling equipment. Increasing regional cooperation will provide access to the farmers’ community
�9
which is known to be hard to reach. Active coordination with the regional Chamber of Commerce can establish better channels of communication and raise awareness of the potential of extra-virgin olive oil.
5. Monitor olive oil production. Finally, the public sector can monitor olive oil production by regularly meeting stakeholders and conducting periodical sectoral analysis. The public sector has a key role in ensuring fair competition, regulatory protection, dissemination of information, and skill upgrading for sustainable production and improving the ability of the labour force to adapt to new production processes. Figure 13 summarizes all the key organizational issues discussed above.
Figure 13: Mapping of organizational issues
5.3 Conclusions Lebanon’s olive oil sector is currently facing tremendous hardships in the form of high production costs, regional competition, sub-standard quality output which does not permit exports (including to Europe), and a lack of proper coordination and management by the main actors in the field. Such hardships exacerbate the already severe socio-economic concerns in the region like unemployment, poverty, a weakening quality
National Committee for Building Institutional Capacity - “Olive Oil office”
(To �nclude representat�ves of relevant M�n�str�es, the Chamber of Commerce,
the ol�ve o�l synd�cate, and act�ve NGO’s)
• Prerogatives: Enforce ex�st�ng regulat�ons and create new ones. Implement a Geograph�c Ind�cators System.
Upgrade and cert�fy ex�st�ng laborator�es and create new ones as needed. Bu�ld nat�onal databases. Coord�nate
w�th EU and var�ous stakeholders on ex�st�ng projects:
- MOA programmes: Ra�s�ng awareness, tra�n�ng farmers, subs�d�es etc.
- MOET programmes: Fraud control.
- MOE programmes: Wastewater and pomace management.
- MOI programmes: Scope m�ll�ng equ�pments, l�cence and perm�ts.
• Expectations: Increase �ntra m�n�ster�al coord�nat�on. Enforce publ�c/pr�vate partnersh�p. Enhance the sector’s
susta�nab�l�ty. Implement the act�on plans.
Translate decisions/priority issues at the regional level
• Prerogatives: Assess ex�st�ng projects, �nfrastructures and key bottlenecks. Report to the Nat�onal Comm�ttee.
Help �n �mplement�ng the Geograph�c Ind�cators System.
• Expectations: Empower reg�onal Cooperat�ves and d�ssem�nate �nformat�on.
Local Level
• Prerogatives:
- Enforce MOA and MoSA programmes (through Soc�al Development Centers).
- Coord�nate w�th local NGO’s to avo�d dupl�cat�on.
• Expectations: Target farmers �n poor areas and �ncrease the susta�nab�l�ty of the ol�ve sector.
Recommendat�ons and proposed measures
Reach out to the farmers’ community
of life and rural-urban migration. The findings of the assessment have stressed the need to strengthen the sector by implementing a number of key regulatory and policy improvements that bring the olive oil sector up to export quality standards. Many of the initiatives proposed would also have positive environmental implications and optimize the socio-economic benefits of the AA.
The key to successful reform is in the ability of all concerned stakeholders to work together to implement the necessary programmes and action plans which improve the production competitiveness of the sector and the quality and marketability of its products. Once trade is completely liberalized, Lebanese products should be competitive enough to improve their market share in international markets. The AA provides time and a window of opportunity to strengthen the countryís agro-food sector for the future to come.
5.4 Follow-upA series of actions are necessary to ensure the sustainability and development of the olive oil sector. The following activities are proposed for the Steering Committee as groundwork for reforms with immediate effect:
1. Campaign with producers, millers and traders on benefiting from the quota accredited to Lebanon under the AA.
2. Disseminate the results of thise study at the municipal and regional levels and provide documentation on “best practices” to produce high quality olive oil. Ensure that producers are aware of the potential economic benefits of producing high quality olive oil.
3. Ensure the availability of trainers including technical assistance for the pool of agro-engineers working at the MOA and operating in the field.
4. Ensure that a regulatory framework is in place to create incentive to upgrade existing mills. This framework should be coupled with the establishment of an accreditation system linked to eco-labelling.
5. An adequate financing channel should be established to help the upgrading process. Finance is available through the Agriculture Development Project (ADP), KAFALAT, the Economic and Social Fund for Development (ESFD), EIB, and new financial instruments under the ENP. Access to credit should be linked to a large extent to scale, quality production and waste management.
6. Ensure that quality control is made available at the regional level by seeking donor help in provision of physical capital, capacity building and vocational training.
7. Disseminate the economic benefits of a Geographical Indication System thus increasing the profitability of the sector by labelling origins of production. Propose the olive oil sector as a potential beneficiary of such a system, and start the implementation process.
8. Reactivate the initiative of establishing an official and accredited taste panel, building on work done by existing NGOs and public sector bodies.
��
REFERENCESBeaufoy Guy (2001), The Environmental Impact of olive Oil Production in the European Union: Practical Options for Improving the Environmental Impact, European Commission for the Environment.
Begon M., Harper J.L & Townsend C.R. (1996), Ecology, Blackwell Science, USA.
C. Kasparian (2003), L’entrée des jeunes libanais dans la vie active et l’émigration, USJ Press.
Cano-Munoz German (2002). Olive Oil Processing Mills: Oil Quality; By-Products Management, Prepared for ELCIM Lebanon.
Central Administration of Statistics Lebanon (1998), Households Living Condition Survey in 1997, Lebanon.
Central Administration of Statistics Lebanon (2005), Households Living Condition Survey in 2004 - Preliminary Results, UNDP - Ministry of social Affaires, Lebanon.
Daher S., Dragotta A., Gabr M., Hammoud K. (2004), National marketing facilitation & promotion, Prepared for the Lebanese Inter-Professional Syndicate for the Olive Sector (LIPSOS) and funded by The European Commission Delegation in Lebanon. Action Plan D1, D2, E1 - “Buy Lebanese” Local Campaigns/Strategic Markets Promotion/Diaspora Targeting /Website Initiative
Daher S., Dragotta A., Gabr M., Hammoud K. (2004), Production Practices Review and Improvement Series, Prepared for the Lebanese Inter-Professional Syndicate for the Olive Sector (LIPSOS) and funded by The European Commission Delegation in Lebanon. Action Plan A1 - Integrated pest Management/Biological Production PlanningAction Plan A2 - Good Agricultural Practices/ TraceabilityAction Plan A3 - Yield Improvement/On Farm Water Use EfficiencyAction Plan A4 - Cost Reduction - Mechanization
Daher S., Dragotta A., Gabr M., Hammoud K. (2004), Industrial Production Modernization Review and Improvement Series, Prepared for the Lebanese Inter-Professional Syndicate for the Olive Sector (LIPSOS) and Funded by the European Commission Delegation in Lebanon. Action Plan B1 - Harvesting, Post Harvesting and Press ProgrammingAction Plan B2 - Mills Modernization and ImprovementAction Plan B3 - Bottling Plants and Packaging ModernizationAction Plan B4 - Environmental Management SystemsAction Plan B5 - By-Products Development
Daher S., Dragotta A., Gabr M., Hammoud K. (2004), Quality modernization review and improvement Series. Prepared for the Lebanese Inter-Professional Syndicate for the Olive Sector (LIPSOS) and funded by The European Commission Delegation in Lebanon. Action Plan C1 - Good Manufacturing Practices/Hazard Analysis & Critical Control PointAction Plan C2 - Quality Control/Testing & Laboratory Facilities Action Plan C3 - ISO 9001:2000 Quality Management Systems
Recommendat�ons and proposed measures
��
Integrated Assessment of the Assoc�at�on w�th the EU - w�th a focus on the ol�ve o�l sector
Daher S., Dragotta A., Gabr M., Hammoud K. (2004), National marketing facilitation review and Improvement. Prepared for the Lebanese Inter-Professional Syndicate for the Olive Sector (LIPSOS) and funded by The European Commission Delegation in Lebanon. Action Plan E2 - Olive Oil Office
Dake, S. L. (2002), Assessing Farm-level and Aggregate Economic Impacts of Olive Integrated Pest Management Programs in Albania: An Ex-Ante Analysis, Dissertation submitted to the Faculty of the Virginia Polytechnic Institute and State University, Virginia.
Dalal-Clayton B., Sadler B. (2005), Strategic Environmental Assessment - A Sourcebook and Reference guide to International Experience. Earthscan Publications, London.
ELARD, Ministry of Economy and Trade, University of Balamand, and Life (European Commission) (2004), Strengthening Environmental Legislation Development and Application, Lebanon.
ESFD Lebanon (2002), Short Term Mission on Social and Municipal Development - Poverty Analysis and Targeting Mechanism for the ESFD Project, Project funded by the European Union.
Euro-Med Partnership, Lebanon, Country Strategy Paper (2002-2006) & National Indicative Programme (2002-2004), 2002.
European Neighbourhood Policy. Available from: http://europa.eu.int/comm/world/enp/policy_en.htm.
FAO (2004), Summary of the Oleiculture Sector in Lebanon, In french
FEMISE (2003), Impact of Agricultural Liberlization in EU-MED.
Gasparini Paul & Mezher May (2002), Olive Industry in Lebanon: A Sectoral Analysis, Prepared for FAO, in French.
Larsen B., Owaygen M., and Sarraf M. (2004), Cost of Environmental Degradation - The Case of Lebanon and Tunisia,. Environmental Economic Series, Paper No97.
LIPSOS (2004), The Olive Oil Farmers Attitudes towards the Association Agreement Survey, Lebanon.
LIPSOS (2005), Oleiculture in Lebanon, Lebanon.
Miller, G.T., (2002), Living in the Environment, Principles, Connections, and Solutions, 12th Edition, Wadsworth Group, U.S.A.
Ministry of Environment (Lebanon) & ECODIT, Lebanon: State of the Environment Report, 2001.
Ministry of Finance, Fiscal, Trade and Structural Developments, Quarter I, 2002, Issue number 6.
Ministry of Social Affairs - UNDP Lebanon (1998), Mapping of Living Conditions in Lebanon Analysis of the Housing and Population Database, Lebanon.

��
Ministry of Social Affairs - UNDP Lebanon (2001), Population’s Economic and Social Characteristics in Lebanese Districts, Vol. 1, 2, 4, 6, 7, 13, 29, 21, 23.
Mirza Zeinab (2004), The Impact of the Euromed Agreement on the olive oil industry in Lebanon, Prepared for the Ministry of Industry - Lebanon.
Office of the Deputy Prime Minister (2004), Sustainability Appraisal of Regional Spatial Strategies and Local Development Frameworks, Consultation Paper, London.
Regional Activity Centre for Cleaner Production (2000), Pollution Prevention in Olive oil Production. Mediterranean Action Plan.
SRI International (2002), The US Market for Olive Oil and the Potential for Lebanese Exports, Expanding Economic Opportunities in Lebanon, Prepared for USAID Lebanon. Available from: http://www.inmadevelopment.org/SRI/Uploads/Reports/96.pdf”
SRI International (2003). The Olive Oil Market Outlook in the European Union, Expanding Economic Opportunities in Lebanon, Prepared for USAID Lebanon. Available from: http://www.inmadevelopment.org/SRI/Uploads/Reports/97.pdf
SRI International (2003), Market Outlook for Organic Foods in the EU, Expanding Economic Opportunities in Lebanon. Prepared for USAID Lebanon.Available from: http://www.inmadevelopment.org/SRI/Uploads/Reports/110.pdf
SRI International (2004), Rapid Appraisal of the Olive Oil Market Chain in Lebanon, Expanding Economic Opportunities in Lebanon, Prepared for USAID Lebanon. Available from: http://www.inmadevelopment.org/SRI/Uploads/Reports/111.pdf
Team International Engineering & Management Consultants (2002), Environmental Compliance and Phasing Program for the Paper Industry (Paper and Cardboard) and the Food Industry (Olive Pressing), Final Draft, Lebanon.
Recommendat�ons and proposed measures
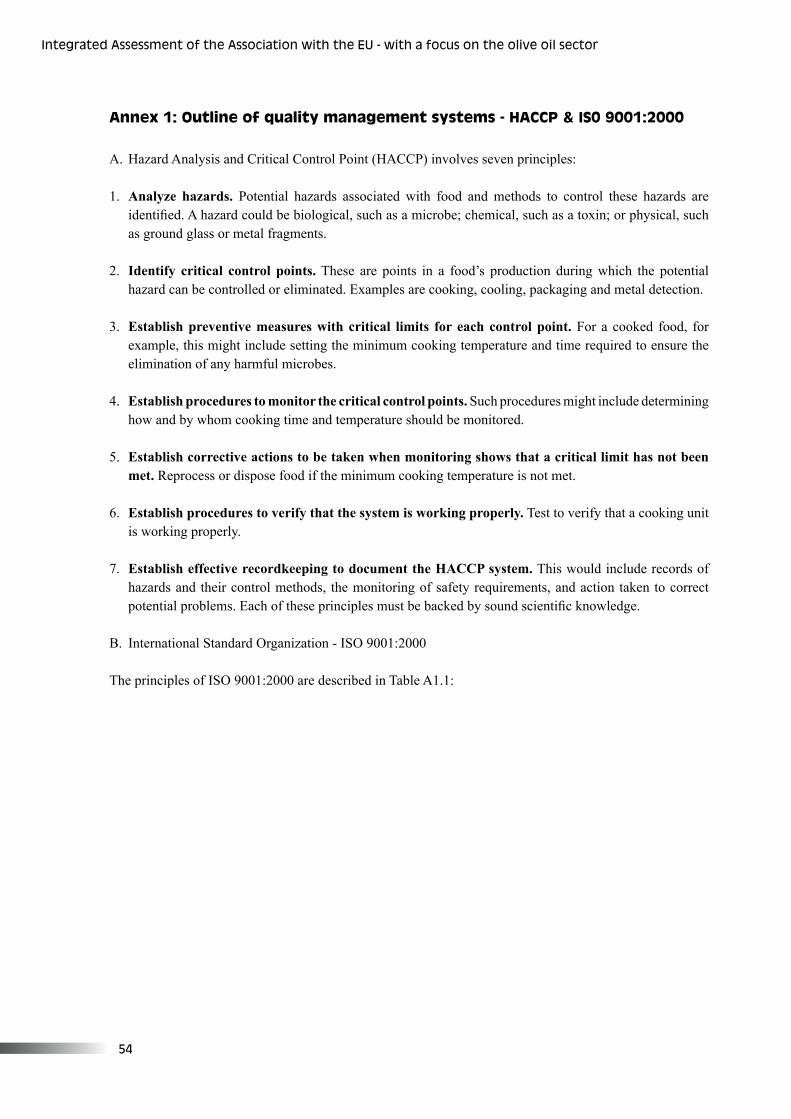
��
Integrated Assessment of the Assoc�at�on w�th the EU - w�th a focus on the ol�ve o�l sector
Annex 1: Outline of quality management systems - HACCP & IS0 9001:2000
A. Hazard Analysis and Critical Control Point (HACCP) involves seven principles:
1. Analyze hazards. Potential hazards associated with food and methods to control these hazards are identified. A hazard could be biological, such as a microbe; chemical, such as a toxin; or physical, such as ground glass or metal fragments.
2. Identify critical control points. These are points in a food’s production during which the potential hazard can be controlled or eliminated. Examples are cooking, cooling, packaging and metal detection.
3. Establish preventive measures with critical limits for each control point. For a cooked food, for example, this might include setting the minimum cooking temperature and time required to ensure the elimination of any harmful microbes.
4. Establish procedures to monitor the critical control points. Such procedures might include determining
how and by whom cooking time and temperature should be monitored.
5. Establish corrective actions to be taken when monitoring shows that a critical limit has not been met. Reprocess or dispose food if the minimum cooking temperature is not met.
6. Establish procedures to verify that the system is working properly. Test to verify that a cooking unit is working properly.
7. Establish effective recordkeeping to document the HACCP system. This would include records of hazards and their control methods, the monitoring of safety requirements, and action taken to correct potential problems. Each of these principles must be backed by sound scientific knowledge.
B. International Standard Organization - ISO 9001:2000
The principles of ISO 9001:2000 are described in Table A1.1:
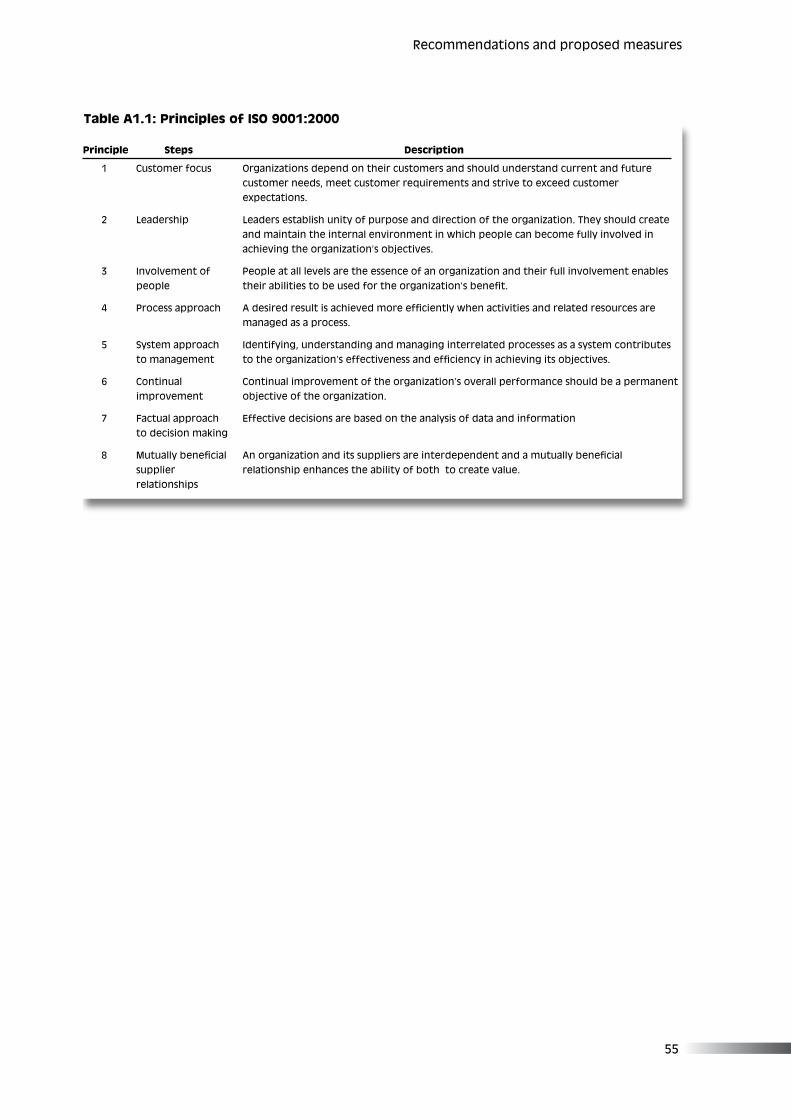
��
Principle Steps Description
� Customer focus Organ�zat�ons depend on the�r customers and should understand current and future customer needs, meet customer requ�rements and str�ve to exceed customer expectat�ons.
� Leadersh�p Leaders establ�sh un�ty of purpose and d�rect�on of the organ�zat�on. They should create and ma�nta�n the �nternal env�ronment �n wh�ch people can become fully �nvolved �n ach�ev�ng the organ�zat�on’s object�ves.
� Involvement of People at all levels are the essence of an organ�zat�on and the�r full �nvolvement enables people their abilities to be used for the organization’s benefit.
4 Process approach A desired result is achieved more efficiently when activities and related resources are managed as a process.
� System approach Ident�fy�ng, understand�ng and manag�ng �nterrelated processes as a system contr�butes to management to the organization’s effectiveness and efficiency in achieving its objectives.
� Cont�nual Cont�nual �mprovement of the organ�zat�on’s overall performance should be a permanent �mprovement object�ve of the organ�zat�on.
7 Factual approach Effect�ve dec�s�ons are based on the analys�s of data and �nformat�on to dec�s�on mak�ng
8 Mutually beneficial An organization and its suppliers are interdependent and a mutually beneficial suppl�er relat�onsh�p enhances the ab�l�ty of both to create value. relat�onsh�ps
Table A1.1: Principles of ISO 9001:2000
Recommendat�ons and proposed measures
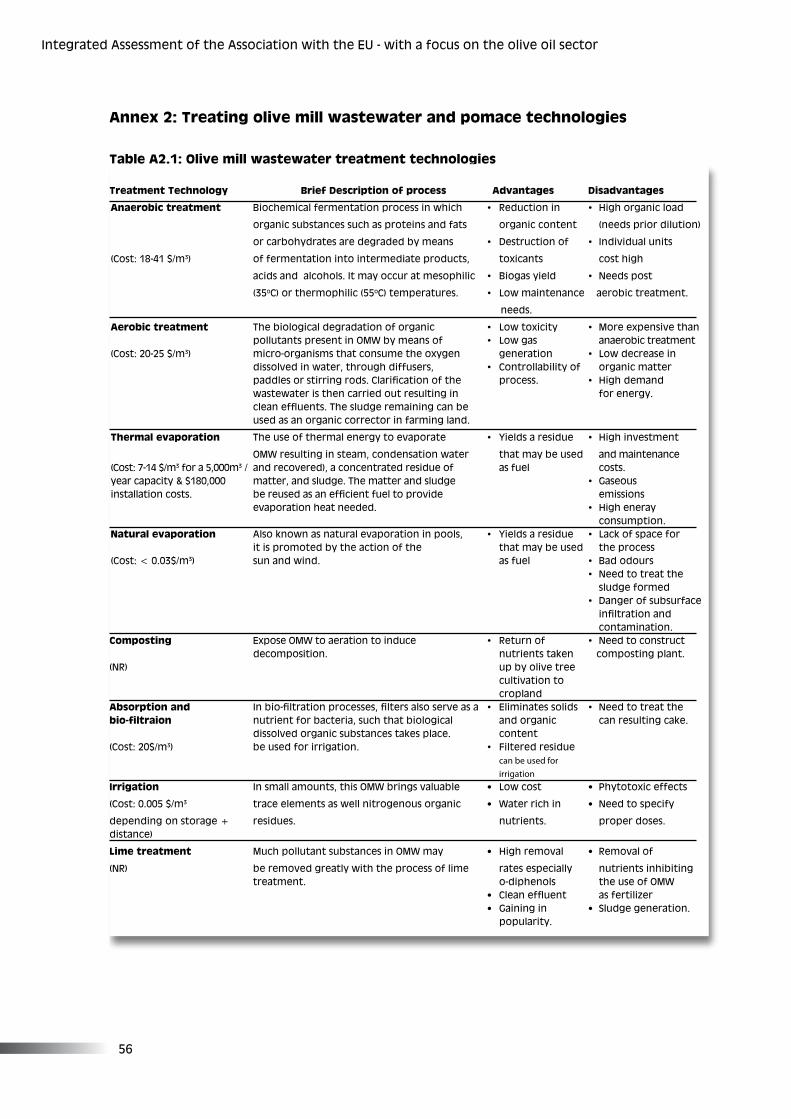
��
Integrated Assessment of the Assoc�at�on w�th the EU - w�th a focus on the ol�ve o�l sector
Annex 2: Treating olive mill wastewater and pomace technologies
Table A2.1: Olive mill wastewater treatment technologies
Treatment Technology Brief Description of process Advantages Disadvantages
Anaerobic treatment B�ochem�cal fermentat�on process �n wh�ch • Reduct�on �n • H�gh organ�c load
organ�c substances such as prote�ns and fats organ�c content (needs pr�or d�lut�on)
or carbohydrates are degraded by means • Destruct�on of • Ind�v�dual un�ts
(Cost: �8-�� $/m�) of fermentat�on �nto �ntermed�ate products, tox�cants cost h�gh
ac�ds and alcohols. It may occur at mesoph�l�c • B�ogas y�eld • Needs post
(��oC) or thermoph�l�c (��oC) temperatures. • Low ma�ntenance aerob�c treatment.
needs.
Aerobic treatment The b�olog�cal degradat�on of organ�c • Low tox�c�ty • More expens�ve than pollutants present �n OMW by means of • Low gas anaerob�c treatment (Cost: �0-�� $/m�) m�cro-organ�sms that consume the oxygen generat�on • Low decrease �n d�ssolved �n water, through d�ffusers, • Controllab�l�ty of organ�c matter paddles or stirring rods. Clarification of the process. • H�gh demand wastewater �s then carr�ed out result�ng �n for energy. clean effluents. The sludge remaining can be used as an organ�c corrector �n farm�ng land.
Thermal evaporation The use of thermal energy to evaporate • Y�elds a res�due • H�gh �nvestment
OMW result�ng �n steam, condensat�on water that may be used and ma�ntenance(Cost: 7-�� $/m� for a �,000m� / and recovered), a concentrated res�due of as fuel costs. year capac�ty & $�80,000 matter, and sludge. The matter and sludge • Gaseous installation costs. be reused as an efficient fuel to provide emissions evaporat�on heat needed. • H�gh eneray consumpt�on.Natural evaporation Also known as natural evaporat�on �n pools, • Y�elds a res�due • Lack of space for �t �s promoted by the act�on of the that may be used the process (Cost: < 0.0�$/m�) sun and w�nd. as fuel • Bad odours • Need to treat the sludge formed
• Danger of subsurface infiltration and contam�nat�on.Composting Expose OMW to aerat�on to �nduce • Return of • Need to construct decompos�t�on. nutr�ents taken compost�ng plant.(NR) up by ol�ve tree cult�vat�on to croplandAbsorption and In bio-filtration processes, filters also serve as a • El�m�nates sol�ds • Need to treat thebio-filtraion nutr�ent for bacter�a, such that b�olog�cal and organ�c can result�ng cake. d�ssolved organ�c substances takes place. content(Cost: �0$/m�) be used for �rr�gat�on. • F�ltered res�due canbeusedfor irrigationIrrigation In small amounts, th�s OMW br�ngs valuable • Low cost • Phytotox�c effects
(Cost: 0.00� $/m� trace elements as well n�trogenous organ�c • Water r�ch �n • Need to spec�fy
depend�ng on storage + res�dues. nutr�ents. proper doses. d�stance)
Lime treatment Much pollutant substances �n OMW may • H�gh removal • Removal of
(NR) be removed greatly w�th the process of l�me rates espec�ally nutr�ents �nh�b�t�ng treatment. o-d�phenols the use of OMW • Clean effluent as fertilizer • Ga�n�ng �n • Sludge generat�on. popular�ty.
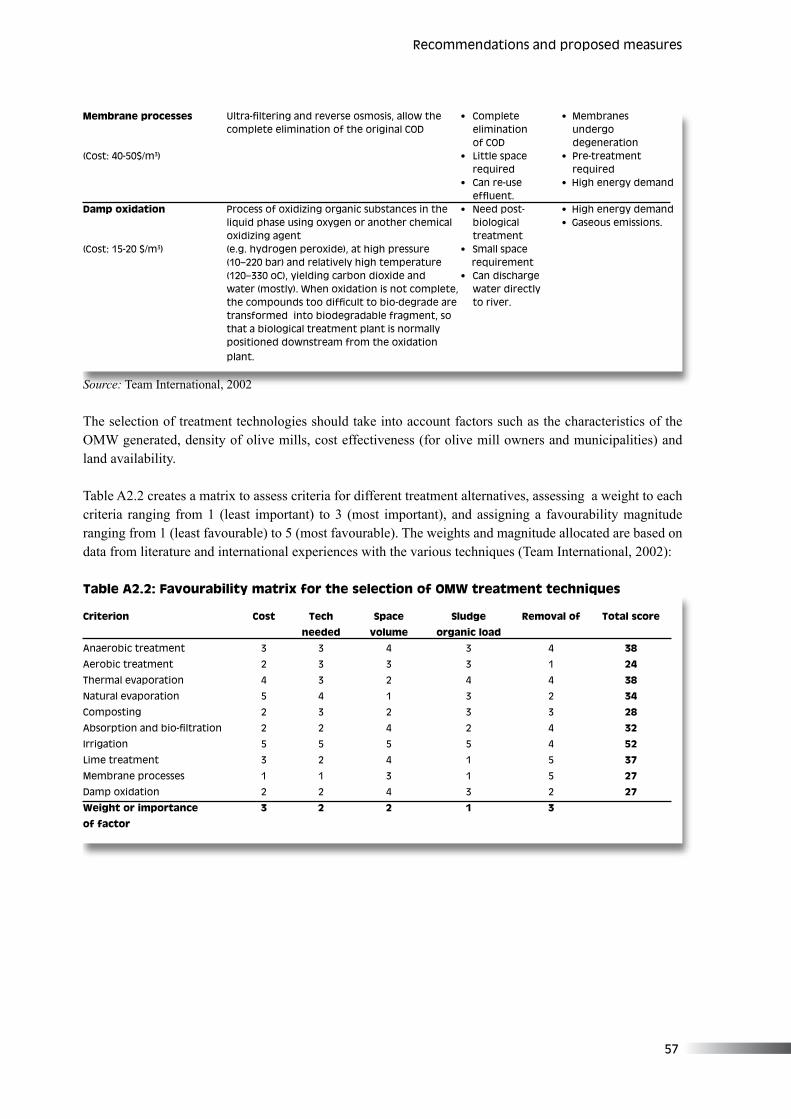
�7
Membrane processes Ultra-filtering and reverse osmosis, allow the • Complete • Membranes complete el�m�nat�on of the or�g�nal COD el�m�nat�on undergo of COD degenerat�on(Cost: �0-�0$/m�) • L�ttle space • Pre-treatment
requ�red requ�red • Can re-use • H�gh energy demand effluent.Damp oxidation Process of ox�d�z�ng organ�c substances �n the • Need post- • H�gh energy demand
l�qu�d phase us�ng oxygen or another chem�cal b�olog�cal • Gaseous em�ss�ons. ox�d�z�ng agent treatment(Cost: ��-�0 $/m�) (e.g. hydrogen perox�de), at h�gh pressure • Small space (�0–��0 bar) and relat�vely h�gh temperature requ�rement (��0–��0 oC), y�eld�ng carbon d�ox�de and • Can d�scharge water (mostly). When ox�dat�on �s not complete, water d�rectly the compounds too difficult to bio-degrade are to river. transformed �nto b�odegradable fragment, so that a b�olog�cal treatment plant �s normally pos�t�oned downstream from the ox�dat�on plant.
Criterion Cost Tech Space Sludge Removal of Total score
needed volume organic load
Anaerob�c treatment � � � � � 38
Aerob�c treatment � � � � � 24
Thermal evaporat�on � � � � � 38
Natural evaporat�on � � � � � 34
Compost�ng � � � � � 28
Absorption and bio-filtration 2 2 4 2 4 32
Irr�gat�on � � � � � 52
L�me treatment � � � � � 37
Membrane processes � � � � � 27
Damp ox�dat�on � � � � � 27
Weight or importance 3 2 2 1 3
of factor
Recommendat�ons and proposed measures
Source: Team International, 2002
The selection of treatment technologies should take into account factors such as the characteristics of the OMW generated, density of olive mills, cost effectiveness (for olive mill owners and municipalities) and land availability.
Table A2.2 creates a matrix to assess criteria for different treatment alternatives, assessing a weight to each criteria ranging from 1 (least important) to 3 (most important), and assigning a favourability magnitude ranging from 1 (least favourable) to 5 (most favourable). The weights and magnitude allocated are based on data from literature and international experiences with the various techniques (Team International, 2002):
Table A2.2: Favourability matrix for the selection of OMW treatment techniques
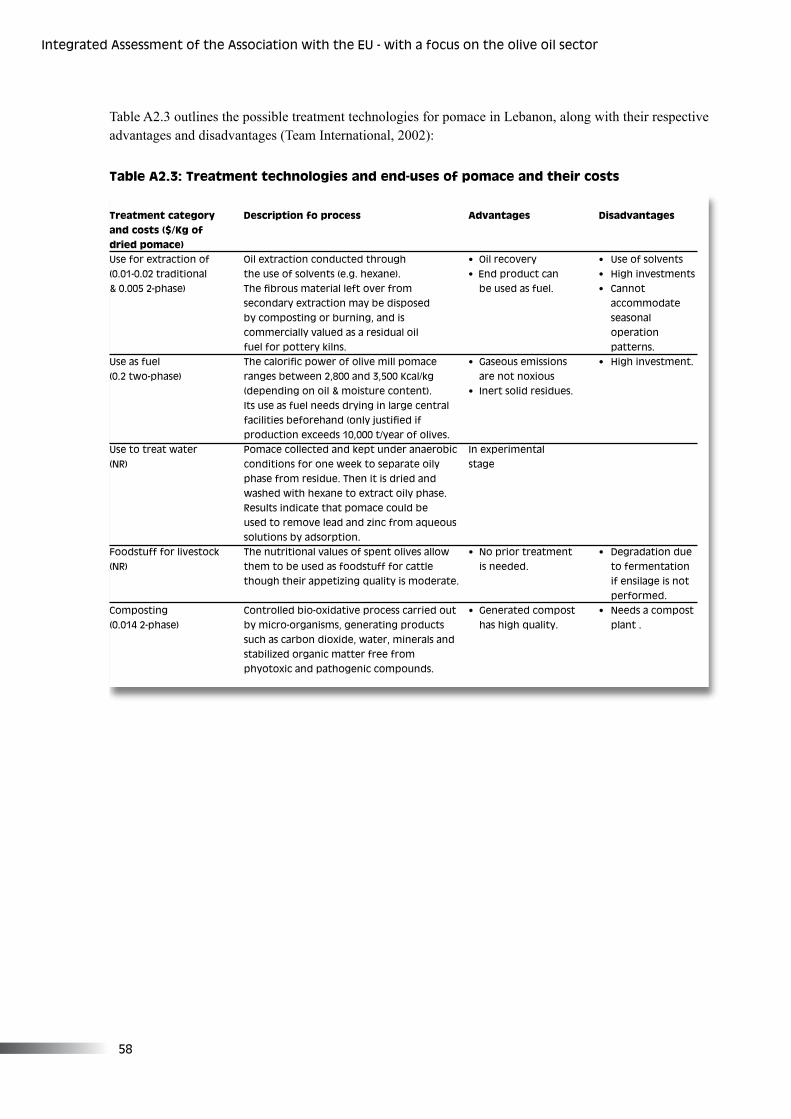
�8
Integrated Assessment of the Assoc�at�on w�th the EU - w�th a focus on the ol�ve o�l sector
Table A2.3 outlines the possible treatment technologies for pomace in Lebanon, along with their respective advantages and disadvantages (Team International, 2002):
Table A2.3: Treatment technologies and end-uses of pomace and their costs
Treatment category Description fo process Advantages Disadvantagesand costs ($/Kg of dried pomace) Use for extract�on of O�l extract�on conducted through • O�l recovery • Use of solvents (0.0�-0.0� trad�t�onal the use of solvents (e.g. hexane). • End product can • H�gh �nvestments & 0.005 2-phase) The fibrous material left over from be used as fuel. • Cannot secondary extract�on may be d�sposed accommodate by compost�ng or burn�ng, and �s seasonal commerc�ally valued as a res�dual o�l operat�on fuel for pottery k�lns. patterns. Use as fuel The calorific power of olive mill pomace • Gaseous emissions • High investment.(0.� two-phase) ranges between �,800 and �,�00 Kcal/kg are not nox�ous (depend�ng on o�l & mo�sture content). • Inert sol�d res�dues. Its use as fuel needs dry�ng �n large central facilities beforehand (only justified if product�on exceeds �0,000 t/year of ol�ves. Use to treat water Pomace collected and kept under anaerob�c In exper�mental (NR) cond�t�ons for one week to separate o�ly stage phase from res�due. Then �t �s dr�ed and washed w�th hexane to extract o�ly phase. Results �nd�cate that pomace could be used to remove lead and z�nc from aqueous solut�ons by adsorpt�on. Foodstuff for l�vestock The nutr�t�onal values of spent ol�ves allow • No pr�or treatment • Degradat�on due(NR) them to be used as foodstuff for cattle �s needed. to fermentat�on though the�r appet�z�ng qual�ty �s moderate. �f ens�lage �s not performed.Compost�ng Controlled b�o-ox�dat�ve process carr�ed out • Generated compost • Needs a compost (0.0�� �-phase) by m�cro-organ�sms, generat�ng products has h�gh qual�ty. plant . such as carbon d�ox�de, water, m�nerals and stab�l�zed organ�c matter free from phyotox�c and pathogen�c compounds.
�9
Annex 3: Cost categories of applying ELCIM assumptions
In accordance with the ELCIM study funded by the EC, the following are descriptions of the cost categories involved in improving the quality of olive oil in Lebanon on a national level, in addition to improving revenue and ensuring environmental sustainability. These categories are very similar to the main assumptions of Scenario 2.
1. Applying and disseminating good agricultural practices. Good agricultural practices cover a wide range of on-farm and post-farm operations related to food safety and quality; the physical, chemical and biological features of the soil; on-farm water use; norms and standards of produced crops and animals; crop and animal health; the social and economic welfare of farmers, farm workers and health and safety of the farming community; and the agro-biodiversity on-farm and in the surrounding area.
• Activities are in the form of preparation of an integrated framework and implementation strategy for GAP, convening an expert group meeting on GAP, campaigning for raising, increasing awareness, and training of farmers.
2. Applying Integrated Pest Management (IPM). The activities involved in IPM for olive oil farmers include campaigning and raising awareness, training of farmers, and applied IPM research.
3. ImprovingYield/WaterEfficiency.An emerging weather problem is that the rainy season has become shorter and lasts from only November to March instead of October to May. This means that the dry period has gotten longer. This emerging problem negatively affects olive production and the olive oil contents accordingly, if no supplemental irrigation is arranged. Recent research shows that supplemental irrigation results in substantial olive yield and quality increase. The main activities are:
• Campaigning for Raising and Increasing Awareness. The campaign aims at raising awareness by the farmers, consumers in general and environmentalists on the importance of acting. This should be done through well prepared and nicely presented informative materials such as short TV reportages, posters, pamphlets, presentations, and well organized meetings.
• Training. This includes the training of Agricultural Extension Officers on various aspects of supplemental irrigation and proposed tools for implementation. It also includes training farmer groups on techniques through demonstration, small farmer groups and visits to research centres and the like.
• Applied Research. Systematic research needs to be done for the water needs of olive trees in the main areas of growing and establishing four ponds for water harvesting and further study.
4. Harvesting, post harvesting and milling programming. The main activities here are:
• Implementing a correct plan for right harvesting (period and techniques), post harvesting, and press programming to obtain a higher quality olive oil.
• Implementing pilot applied research activities to determine the best moment to harvest according to the regional Lebanese varieties.
• Raising awareness about olive oil quality loss due to bad harvesting and post harvesting habits and techniques.
Recommendat�ons and proposed measures
�0
Integrated Assessment of the Assoc�at�on w�th the EU - w�th a focus on the ol�ve o�l sector
• Encouraging millers to differentiate olive oil grades and amount depending on the date of product delivery and/or the acidity. Encourage millers to lease boxes and nets for harvesting. Encourage millers to record data and implement simple procedures at the oil mill.
5. Modernizing and improvement of mills. This action plan calls for the modernization and improvement of olive oil mills (for 67 recognized automated/semi-automated mills) with the aim to bring their infrastructure and production lines into compliance with international standards. This effort will pave the way to the establishment of HACCP food safety systems and ISO 9001:2000 quality management systems, which in turn will ensure that Lebanese olive oil is distinguished technically and geographically from other world oils.
The following are the specific objectives of the modernization to be performed in close cooperation and coordination between the beneficiaries and the donors:
• Improve infrastructure of olive oil mills according to Good Manufacturing Practices.• Streamline process lines to comply with hygienic operational requirements and operational best
practices.• Build capacity in the area of operation and maintenance (O&M).
6. Quality modernization review and improvement. Good Manufacturing Practices (GMP) & Hazard Analysis & Critical Control Point (HACCP) will require the following action plan:
• Set Up Food Safety Systems Project Coordination Unit at LIPSOS. - Recruit a Food Safety Project Coordinator. - Select and qualify the commercial mills capable of entering the HACCP - programme.• Develop systems guidelines and conduct a training workshop. • Develop HACCP workshop course and materials.• Customize and implement GMP and HACCP at Mills - Adopt pre-requisite programmes and HACCP plans. - Conduct pre-assessments prior to independent audits.• Audit Mills and register with Internationally Accredited Bodies - Select and engage accredited international registrar and certification body. - Audit and register mills to CAC HACCP standard.
The final act for the participating mills is organization of processes and documentation in preparation for the “ISO 9001 Quality Management System” action plan, and build readiness to promote the Food Safety and Quality Achievements.
7. Bottling plants and packaging modernization. The activities are:
• Design and set up two grading and storage facilities to produce olive oil of consistent quality. • Recruit and train storage and bottling plant operators and technicians in oil blending, panel testing,
analytical testing, and quality and food safety management systems. Also implement the HACCP and ISO 9001 quality systems and certification and registration of the plants.
• Creation of inventory credit programmes and other financial schemes.
��
8. Quality control/testing and laboratory facilities. The activities here are:
• Establishing a pilot quality control network and regional small laboratories. • Raising awareness on olive oil quality in producers and consumers.• Supporting oil mills with dedicated credit/allowances programme.• Implementing applied research on the main topics related to quality in Lebanese olive oil.
9. National marketing facilitation & promotion. The specific objectives of this action plan are to create the materials to promote what have been achieved in other action plans and project a new image of Lebanese olive oil, as one of premium national product linked to authentic historical culinary traditions as well as healthy modern living. Activities may include:
• Assessing current attitudes and perceptions of the Lebanese consumer and provide directions for product image development.
• Build the necessary communication platform and networks.• Create a cost effective tool for advertising to consumers worldwide and communicate with customers
and stakeholders through the establishment of a dynamic website or portal.• Increase per capita consumption in Lebanon from 4.8 kg to 11 kg (as was in 1960’s) by raising
consumer awareness and creating consumer loyalty.
10. By-product development. Campaigning to raise awareness among farmers, consumers in general and environmentalists for the importance of the action plans and their implementation should take place. Activities include:
• Channel marketing such as short TV reportages, posters, pamphlets, presentations and well organized meetings. In all media tools, the benefits of by-product development action plan should be highlighted such as generating more incomes to the farmers, supplying the consumers with healthier food and contributing positively to the sustainability of the environment.
• Converting olive pomace to organic fertilizer. Olive pomace is convertible to valuable organic fertilizers through the process of aerobic fermentation, where pomace is mixed with manure and tree leaves. To produce 500 tonnes of organic fertilizers, 1500 tonnes of materials are needed.
11.OliveOilOffice.The main activities here are:
• Preparing the constitution of the Lebanese Olive Oil Office (LOOO). It includes the preparation of the institute in accordance with Lebanese law and the mandate of LIPSOS. The first draft should be discussed with representatives of the different stakeholders and related official bodies.
• Campaigning to raise profile of LOOO. The target audiences are farmers, millers, cooperatives, consumers in general and environmentalists who should be informed through a well-prepared campaign, including building a website.
• Work launch. The Office needs to be equipped and funded for 2 years.
Recommendat�ons and proposed measures
��
Integrated Assessment of the Assoc�at�on w�th the EU - w�th a focus on the ol�ve o�l sector
Key bottlenecks Action plans Expected outcomes Responsibility
of1. High production costs
Farming techniques : Pruning: Prov�de mechan�cal - More rel�able product�on MOA
No comprehens�on of the prun�ng mach�nes to cooperat�ves y�elds and �ncreased
prun�ng/ plow�ng/ fert�l�z�ng and p�lot demonstrat�ons. Support supply Local NGOs
relat�onsh�p. Too much vocat�onal tra�n�ng for farmers. - Increase compet�t�v�ty of
prun�ng, no mechan�zed D�ssem�nate �nformat�on on Lebanese ol�ve o�l on the Cooperat�ves
plow�ng and the proper prun�ng per�ods and local and �nternat�onal
expens�ve fert�l�zers. d�fferent�ate pract�ces on old and market
young trees. - Reduce t�me and labour
Fertilizers: Reduce cost by costs due to
efficiently using the fertilizers at mechanization
the appropr�ate t�me. Reduce - Improve farmers soc�o-
costs by �mplement�ng so�l tests econom�c cond�t�ons
from accred�ted laborator�es. Use and �ncome susta�nab�l�ty
wastewater by treat�ng res�dues - Reduce pollut�on caused
as fert�l�zers. by wastewater
res�dues compos�t�on.
Pesticides use: - Prov�de the chem�cals needed & - Improved product�v�ty by MOA
Quant�ty/t�me m�suse support �n spray�ng quant�ty of ol�ves ava�lable
- Establ�sh a system of d�str�but�on for press�ng Local NGOs
- D�ssem�nate �nformat�on - Improved qual�ty by
on the proper appl�cat�on reduc�ng ol�ve pests Cooperat�ves and t�me frame. and d�seases
Alternat�ve (eco-fr�endly): IPM - IPM w�ll result �n : enhanced
- Mob�l�ze key players eco tour�sm, health�er
concerned �n ol�ve IPM work�ng place, �ncreased - Prov�de workshops and product�v�ty, m�n�m�zed
undertake field demonstrations chemical residue content,
- Train extension officers skills diffusion and
and farmers. knowledge.
Harvesting : - Prov�de mechan�cal harvest�ng - Improved qual�ty and quant�ty MOA
Ma�nly done by hand mach�nes to cooperat�ves (along of ol�ves ava�lable for m�ll�ng Local NGOs
and/or wood st�cks. w�th the prun�ng mach�nes) - Product�on costs reduct�on,
Very low level of - Vocat�onal tra�n�ng to opt�m�ze and thus �ncreased
mechanization. harvesting efficiency. competitiveness
Harvest�ng per�od - Establ�sh a reg�onal harvest�ng - Increased sk�lls for
corresponds to the calendar farmers and �mproved
first winter rain. - Awareness sessions on cost potential to adapt to
reduct�ons due to var�ous technolog�cal changes.
techn�ques used.
Annex 4: Identification of key bottlenecks, possible action plans and expected
outcomes of Scenario 2.
��
2. Qualitative issuesOrganizational issues: - Share �nformat�on w�th all relevant Cooperat�ves stakeholders M�llers do not coord�nate - Install an organ�zat�onal protocol.w�th farmers. No reservat�ons to m�n�m�ze the queu�ng t�me.Processing issues Farmers: MOA - Tra�n farmers to properly separate Local NGOs �nfected fru�ts from clean ones - Awareness campa�gns concern�ng the �mportance of carry�ng harvested ol�ves �n open plast�c boxes and not stor�ng them more than �� hours. Prov�de farmers w�th those boxes and/or a storage fac�l�ty w�th sta�nless steel conta�ners. Millers: - Tra�n m�ll owners on m�ll management sk�lls to reduce wa�t�ng per�od between harvest and press�ng and �ncreas�ng efficiency to obtain quality olive oil - Control cleanliness of filters and cond�t�ons of mach�nery and equ�pment (san�tary cond�t�ons) by keep�ng cost and ma�ntenance control sheets.Farmers/millers awareness: - Awareness campa�gns for growers, MOA, MOET cooperat�ves, mun�c�pal�t�es and No d�fferent�at�on between pol�cymakers on the d�fferent Local NGOsextra-v�rg�n o�l pr�ces and qual�ty classes of ol�ve o�l and the�r other ol�ve o�ls relat�ve �nternat�onal pr�ces Pr�vate sector - Develop pamphlets, taste panels, No awareness on the nat�onal ol�ve o�l fa�rs, and free potent�al of export�ng tast�ng campa�gns to �ncreaseextra-v�rg�n ol�ve o�l �nformat�on exchange and �ncent�ves.Consumer awareness: - Nat�onal awareness campa�gn Increased extra-v�rg�n ol�ve o�l MOA, MOET demand w�ll �n turn create Consumer �s unaware of the �ncent�ve for farmers and Local NGOsqual�ty of ol�ve o�l he’s m�llers to produce qual�tyconsum�ng and the health ol�ve o�l. Pr�vate sector effects of poor qual�ty o�l Irrigation: - Demonstrate the s�mpl�c�ty and - Increased qual�ty Government the benefits of irrigating two to - More constant production Ol�ve trees are ra�n fed and three t�mes per year. y�elds and �ncreased supply. MOA, MOETunder �rr�gated Local NGOs
Recommendat�ons and proposed measures
��
Integrated Assessment of the Assoc�at�on w�th the EU - w�th a focus on the ol�ve o�l sector
3. Regulatory framework Mill registration - Document and assess present MOA, MOF reg�strat�on �n d�fferent Lebanese reg�ons, and regulat�ons regard�ng certification of origin for olive oil Certificate of - Document and evaluate the Governmentorigin of oil regulations regarding certification of or�g�n for ol�ve o�l - Allow the traceab�l�ty of o�l and protect the local reg�onal source of o�l - Create a system of geograph�c �nd�cat�ons to assess the ol�ve o�l com�ng from d�fferent reg�ons/v�llages - Certification by accredited laborator�es.Lebanese olive oil - Draft an agreement tak�ng �nto - Improve qual�ty of ol�ve o�l Government specificities: account European standards - Ensure qual�ty and cred�b�l�ty specificities of Lebanese olive oil Ol�ve o�l output could st�ll be on �nternat�onal markets. of d�st�nct nature and not - Support the complet�on of the meet some criteria training and certification of the requ�rements under locally tra�ned tast�ng �nternat�onal standards due panel group.to local cl�mat�c and so�lcond�t�ons.
No organolept�c taste panel. 4. MarketingBottling, packaging - Prov�de cooperat�ves w�th bottl�ng - Increased exports �n local and MOA, MOET & labelling and labell�ng fac�l�t�es �nternat�onal markets - Workshops to �nform on - Poverty allev�at�on through Pr�vate sector nutr�t�onal labell�ng requ�rements �ncreased �ncome �n the local and external markets - Increased �ncent�ves to - Tra�n�ng on label des�gn and �mage. produce h�gh qual�ty ol�ve o�l Quality testing - Identify specific national - Increased credibility and meet Government laborator�es for test�ng ol�ve o�l �nternat�onal qual�ty standards - Reduce test�ng costs �n ex�st�ng requ�rements for exports Local NGOs laborator�es by mak�ng agreements - Prov�de small scale test�ng Pr�vate sector equ�pment (perox�de & ac�d�ty).International publicity of - Campa�gn to promote the qual�ty - Increased demand w�ll lead to MOALebanese olive oil of Lebanese o�l from d�fferent �ncreased supply, w�th the reg�ons. qual�ty already �n place. Local NGO
- Poverty allev�at�on for farmers and m�llers by �ncreas�ng Pr�vate sector �ncome and employment.5. Environmental degradationReduce wastewater - Workshop to �ncrease awareness - Reduced y�eld product�on, MOA, MOE Production, reuse as and show proper amount of fluctuations and increased fertilizers, and reduce wastewater to use. product�v�ty Local NGOs - Increased qual�ty - Decreased pollut�on and Pr�vate sector b�od�vers�ty conservat�on - Pos�t�ve effect on health.
��
Institution Name and position Contact
Ministry of Industry Georges Khoury economydpt@�ndustry.gov.lb
(Director General by intermediary)
Ministry of Industry Mar�lyse Chehab - 0�/��7 00� (ext ���)
Economic Researcher cmar�lyse@hotma�l.com
Ministry of Social Affairs Ghaz� Fre�j 0�/��� ��0 (ext ��7)
SRI International James B�ll�ngs 0�/98� �77
Director, Lebanon Office james.b�ll�ngs@sr�.com
Ministry of Agriculture Mar�am E�d 0�/8�� �00
Agro food Production Expert
CCIB Rab�h Sabra. Head of aa�@cc�b.org.lb
agriculture/agroindustry dprt
UNDP-Ministry of Environment Saleem Hamadeh 0�/97�0���0(ext �08) -
Regional Coordinator [email protected]
Vitech consulting s.a.l Kar�m Hammoud 0�/��� 0�� –
LIPSOS advisor and Coordinator khammoud@�nco.com.lb
LIPSOS Sle�man El-Daher 0�/��0 ���
LIPSOS President dahersc@hotma�l.com
Annex 5: Steering Committee members and stakeholder contact details
Steering Committee
Recommendat�ons and proposed measures
��
Integrated Assessment of the Assoc�at�on w�th the EU - w�th a focus on the ol�ve o�l sector
Organization Name and position
Association of Lebanese Industrialist Saad Ouyeenn�
Boulos SAL Tony Maroun
Central Administration of Statistics (CAS) Z�ad Abdallah
Chamber of Commerce, Industry and Agriculture Rab�h Sabra – Head of Agriculture/Agro Industry
of Beirut. Department
Ran�a B�zr� – Economic Researcher
Nass�ma Ghanem - Head of Library and
Documentation Department
Albert Nasr – EU Expert
Hana Ha�dar – EU Database
Cortas – Trader Raja Cortas
Dove Processing S.A.L – Obegi Consumer Products Gay Mandour – Product Manager
Group /Trader
Economic and Social Fund for development (ESFD) Lara Abou Sa�fan – Communication and Public
Relations Officer
Racha Chah�ne
Hassam Omar
European Commission Delegation Frans�sco Acosta – Economic and Political Coordinator
Instituto par la cooperazione Universitaria (ICU) – Jose Anton�o V�llaverde - Resident Representative
Italian NGO Hussa�n Hote�t – Agrofood Ingeneer
Ministry of Agriculture Myr�am E�d – Agro food Production Expert
Ministry of Environment Saleem Hamadeh – Regional Coordinator
Lam�a Chamas
Samar Khal�l
Ministry of Industry Georges Khoury – Acting Director General
Mar�lyse Chehab – Economic Researcher
Ministry of Social Affairs Joumana Kalot – NGO Liaison Officer
Hachem el Husse�n – Technical Expert
Mazhar Haraké – Project Manager
Ghaz� Fre�j
Ministry of Economy and Trade Joey Ghaleb – Head of the Econom�c Un�t-Sen�or Econom�st
– Nat�onal Co-coord�nator
Makram Malaeb – Sen�or SME Spec�al�st
Bech�r Saade – Pol�t�cal Econom�st
M�ra Merh�- Sen�or Econom�st - Trade Spec�al�st
Rana Samaha – Development Econom�st
Pamela Bass�l – Development Econom�st
Diala Nasr - Research Officer
Hassan Harajl� - Env�ronmental Econom�st
Rene Moawad Foundation Fady Yarak – Execut�ve D�rector Deph�ne Copa�n
Lebanese Interprofessionnal Syndicate of Olive Oil Sle�man El-Daher – LIPSOS Pres�dent
(LIPSOS)
SRI International James Billings – Director, Lebanon Office
Syndicate of Agro-Food George Nasraou�
Vitech Consulting s.a.l Kar�m Hammoud – LIPSOS Adv�sor and Coord�nator
Stakeholder contact details


