Ankle plantarflexion strength in rearfoot and forefoot runners: A novel clusteranalytic approach Dominik Liebl a,⇑ , Steffen Willwacher b , Joseph Hamill c , Gert-Peter Brüggemann b a Mathematics Department and ECARES, Université Libre de Bruxelles, Belgium b Institute of Biomechanics and Orthopaedics, German Sports University Cologne, Germany c Department of Exercise Science, University of Massachusetts, Amherst, MA, United States article info Article history: Available online 18 April 2014 PsycINFO classification: 2260 3720 Keywords: Running Biomechanics Foot strike Barefoot Shod Functional data analysis Cluster analysis abstract The purpose of the present study was to test for differences in ankle plantarflexion strengths of habitually rearfoot and forefoot runners. In order to approach this issue, we revisit the problem of classifying different footfall patterns in human runners. A data- set of 119 subjects running shod and barefoot (speed 3.5 m/s) was analyzed. The footfall patterns were clustered by a novel statistical approach, which is motivated by advances in the statistical litera- ture on functional data analysis. We explain the novel statistical approach in detail and compare it to the classically used strike index of Cavanagh and Lafortune (1980). The two groups found by the new cluster approach are well interpretable as a forefoot and a rearfoot footfall groups. The sub- sequent comparison study of the clustered subjects reveals that runners with a forefoot footfall pattern are capable of producing significantly higher joint moments in a maximum voluntary con- traction (MVC) of their ankle plantarflexor muscles tendon units; difference in means: 0.28 Nm/kg. This effect remains significant after controlling for an additional gender effect and for differences in training levels. Our analysis confirms the hypothesis that forefoot runners have a higher mean MVC plantarflexion strength than rearfoot runners. http://dx.doi.org/10.1016/j.humov.2014.03.008 0167-9457/Ó 2014 Elsevier B.V. All rights reserved. ⇑ Corresponding author. Address: Université Libre de Bruxelles, CP 210, local O.9.213, Bd du Triomphe, 1050 Bruxelles, Belgium. Tel.: +49 32 2650 5882. E-mail address: [email protected](D. Liebl). Human Movement Science 35 (2014) 104–120 Contents lists available at ScienceDirect Human Movement Science journal homepage: www.elsevier.com/locate/humov
Transcript
Human Movement Science 35 (2014) 104–120
Contents lists available at ScienceDirect
Human Movement Science
journal homepage: www.elsevier .com/locate/humov
Ankle plantarflexion strength in rearfoot andforefoot runners: A novel clusteranalytic approach
http://dx.doi.org/10.1016/j.humov.2014.03.0080167-9457/� 2014 Elsevier B.V. All rights reserved.
⇑ Corresponding author. Address: Université Libre de Bruxelles, CP 210, local O.9.213, Bd du Triomphe, 1050 BBelgium. Tel.: +49 32 2650 5882.
Dominik Liebl a,⇑, Steffen Willwacher b, Joseph Hamill c,Gert-Peter Brüggemann b
a Mathematics Department and ECARES, Université Libre de Bruxelles, Belgiumb Institute of Biomechanics and Orthopaedics, German Sports University Cologne, Germanyc Department of Exercise Science, University of Massachusetts, Amherst, MA, United States
a r t i c l e i n f o
Article history:Available online 18 April 2014
PsycINFO classification:22603720
Keywords:RunningBiomechanicsFoot strikeBarefootShodFunctional data analysisCluster analysis
a b s t r a c t
The purpose of the present study was to test for differences inankle plantarflexion strengths of habitually rearfoot and forefootrunners. In order to approach this issue, we revisit the problemof classifying different footfall patterns in human runners. A data-set of 119 subjects running shod and barefoot (speed 3.5 m/s) wasanalyzed. The footfall patterns were clustered by a novel statisticalapproach, which is motivated by advances in the statistical litera-ture on functional data analysis. We explain the novel statisticalapproach in detail and compare it to the classically used strikeindex of Cavanagh and Lafortune (1980).
The two groups found by the new cluster approach are wellinterpretable as a forefoot and a rearfoot footfall groups. The sub-sequent comparison study of the clustered subjects reveals thatrunners with a forefoot footfall pattern are capable of producingsignificantly higher joint moments in a maximum voluntary con-traction (MVC) of their ankle plantarflexor muscles tendon units;difference in means: 0.28 Nm/kg. This effect remains significantafter controlling for an additional gender effect and for differencesin training levels.
Our analysis confirms the hypothesis that forefoot runners havea higher mean MVC plantarflexion strength than rearfoot runners.
D. Liebl et al. / Human Movement Science 35 (2014) 104–120 105
Furthermore, we demonstrate that our proposed stochastic clusteranalysis provides a robust and useful framework for clustering footstrikes.
� 2014 Elsevier B.V. All rights reserved.
1. Introduction
There have been anecdotal claims from coaches and some runners that forefoot running leads to astrengthening of biological structures surrounding the foot and ankle complex and thereby has a pro-tective character with respect to typical running injuries (Lieberman, 2012). Daoud et al. (2012) couldshow that in a group of competitive shod cross country runners repetitive stress injury rates were sig-nificantly lower for forefoot striking runners than for rearfoot striking runners. Another typical obser-vation is that, e.g., sprinters, who are capable of producing high plantarflexion moments, use a forefootstrike even at moderate running speeds. In fact, Williams, McClay, and Manal (2000) showed thathabitually forefoot running subjects show significantly higher initial sagital ankle joint plantarflexionmoments than habitually rearfoot running subjects. While all this suggests that there might be a sys-tematic relationship between footfall patterns and the strength of the lower extremities, this relation-ship has not been investigated and tested yet.
This kind of hypothesis demands for data of subjects that were allowed to use their preferred foot-fall patterns—an issue which demands for an ex-post classification of the subjects’ footfall patterns.This ex-post classification step is crucial, but often treated novercally. In fact, reliability of the chosenclassification procedure is a necessary precondition for any subsequent inferential comparison study.
Generally, classification of footfall patterns can either be done visually, using sagittal plane highspeed video camera data (e.g., Hasegawa, Yamauchi, & Kraemer, 2007), or on basis of quantitativedata. The latter is often preferred in academics—presumably, due to its supposed objectivity.Researchers, who want to rely their judgment on quantitative data, usually use a combination ofground reaction force information and foot kinematics, which describe the initial landing of the feeton the ground. For example, Gruber, Umberger, Braun, and Hamill (2013) use the strike index (SI), an-kle angle, and the vertical ground reaction force (GRF) at initial foot–ground contact. Classification ofthe footfall patterns is then done on basis of some ad hoc decision rules. Unfortunately, just these adhoc decision rules run the risk of compromising reliability and, particularly, have to be used with cau-tion in inferential studies. In the following, we use the example of the SI in order to discuss the generalproblem.
The SI of Cavanagh and Lafortune (1980) is the most established measure to quantify foot strikes,where foot strike classification is performed using a 1/3-decision rule: If the SI indicates an initialfoot–ground contact in the rear, middle or front third of the subject’s foot, the subject is classifiedas rearfoot striking (RFS), midfoot striking (MFS) or forefoot striking (FFS). This 1/3-decision rule con-stitutes a widely accepted, well interpretable ad hoc classification procedure.
The main problem with respect to the 1/3-decision rule is visualized in Fig. 1, where we show twoscatter plots of the SI-points of the sample of subjects used in this study. Obviously, the scattered SI-points and the corresponding kernel density estimates indicate that there are actually clusters in the SIdata of shod/barefoot running subjects. These clusters are likely to represent distinct footfall strate-gies. Unfortunately, the 1/3-decision rule does not account for these SI-clusters, but truncates them.This kind of truncation leads to groups of subjects with inhomogeneous SI values and the consequen-tial truncation bias is likely to harm any further statistical inferential study (e.g., Cohen, 1991).
Besides this, there is also a conceptual problem with respect to variables like the SI, ankle angles, orGRF, when processed (only) at the initial foot–ground contact. It is indisputable that all of these vari-ables allow for valuable quantitative descriptions of the footfall pattern. Though, it seems unquestion-able that appropriate time-continuous statistics, generally shall do a better job in capturing the
Shod RunnersD
ensi
ty
0 1/3 2/3 1
01
23
45
Strike−Index
Barefoot Runners
0 1/3 2/3 10
12
34
5
Strike−Index
Fig. 1. Scatter plots and kernel density estimates of the strike index under both treatment conditions measured for the sampleof n = 119 subjects used in this study.
106 D. Liebl et al. / Human Movement Science 35 (2014) 104–120
information on the dynamic footfall pattern. In fact, the ad hoc decision rule together with its, let’s say,‘‘snap-shot’’ characteristic the SI can produce rather contradictory results. For example, the SI indi-cates that 108 shod runners of our dataset perform a RFS, but from these 108 runners 44 runners haveinitial plantarflexion moments. In the following, we propose solutions to both of the above describedproblems.
We propose to replace the ad hoc decision rule by another procedure, which allows for a stochasticgrouping of the observed footfall patterns and does not cause any truncation bias. A very simple yetpowerful approach is to assume that the unknown distribution within each footfall cluster can beapproximated by a Gaussian normal distribution. Besides the favorable simplicity of the Gaussian nor-mal distribution, its uni-modality, symmetry, and rare tail events reflect very well the general demandon a cluster: namely, to represent a homogeneous group of subjects. The combination of Gaussian dis-tributions leads to non-trivial, well interpretable Gaussian mixture distributions, which can be esti-mated from the data by the so-called EM-algorithm (Dempster, Laird, & Rubin, 1977).
The EM-algorithm alternates between an Estimation-step, in which the cluster-wise means andvariances are estimated, and a Maximization-step, in which the subjects are newly allocated to thebest fitting clusters. The further development of the EM-algorithm suggested by Fraley and Raftery(2002) allows also to determine the number of clusters from the data. This makes the EM-algorithmparticularly useful in order to find clusters without prior knowledge on the cluster structure.
Furthermore, we propose to cluster a variable, which captures the whole dynamic of the footfallpattern. Williams et al. (2000) showed that habitually rearfoot and forefoot running subjects signifi-cantly differ in the initial courses of their vertical GRF, ankle angles, and sagital ankle joint moments.We use the sagital ankle joint moment courses for our cluster analysis, since these comprise of bothother variables, the kinematic vertical GRF and the kinetic ankle angles. Specifically, we use the anklejoint moment functions in the sagittal plane for the initial first 20% of the stance phase; see Fig. 2.
We will refer to the ankle joint moment courses as functional variables in order to emphasize thatwe regard them as realizations of so-called functional random variables. The latter differ from multi-variate random variables, since they are potentially infinite dimensional objects. Fortunately, in prac-tice it is usually possible to analyze functional data by classical methods from multivariate statisticsafter applying appropriate dimension reductions. Generally, the most common method for dimensionreduction is to select one or more specific characteristic features of the functional data—the SI is a
Shod Runners
0 5 10 15 20
−2.5
−2.0
−1.5
−1.0
−0.5
0.0
0.5
% of Stance
Nm
/kg
Plan
tarfl
exio
n M
omen
tD
orsi
fl.
Barefoot Runners
0 5 10 15 20
−2.5
−2.0
−1.5
−1.0
−0.5
0.0
0.5
% of Stance
Nm
/kg
Plan
tarfl
exio
n M
omen
tD
orsi
fl.
Fig. 2. Joint moment curves of n = 119 shod and barefoot runners measured for the ankle in the sagittal plane. The x-axisdenotes standardized time (in % of stance) and the y-axis denotes weight-standardized moments (in Nm/kg).
D. Liebl et al. / Human Movement Science 35 (2014) 104–120 107
perfect example. In the statistical literature on functional data analysis, the most important methodfor dimension reduction is functional principal component analysis (FPCA) (Ramsay & Silverman,2005, chap. 8). Clusters found in the empirical distribution of the pc-scores correspond to clustersin the original functional data.
This paper has two purposes, where one is accessory to the other. We introduce a novel statisticalapproach to find clusters in the footfall patterns of human runners. After validation of the revealedrearfoot and forefoot clusters, we use them to investigate our fundamental purpose, i.e., to test for dif-ferences in ankle plantarflexor strengths between subjects with habitual rearfoot footfall patterns andthose with habitual forefoot patterns. Specifically, we test the null hypothesis that there is no differ-ence in the ankle joint moments of the ankle plantarflexor muscles tendon units between subjectswith different footfall patterns against the alternative hypothesis that habitual forefoot footfall sub-jects have stronger plantarflexor muscles. Hereby, we focus only on the rearfoot and forefoot clustersof the shod treatment, since none of the subjects was a habitual barefoot runner. Furthermore, we con-trol for an additional gender effect and differences in training levels.
In the following, we use the acronyms RFS, MFS, and FFS exclusively in order to refer to the classesdetermined by the SI and its 1/3-decision rule. The clusters found by the novel statistical approach willbe referred to as rearfoot footfall (RFF) and forefoot footfall (FFF) clusters.
2. Methods and procedures
2.1. Subjects
In the course of this study n = 119 male and female subjects (mass: 69.8 ± 11.5 kg; height:1.75 ± 0.09 m; age: 38.6 ± 13.3 years) were analyzed at a running speed of 3.5 m/s. Runners had anaverage running experience of 10.3 ± 7.5 years and completed running exercise with an average mile-age of 41.4 ± 20.1 km per week. No preselection with respect to the runner’s striking behavior was donein order to get a representative sample of the typical striking behavior distribution of human runners.
2.2. Data collection
The force capacities of the right lower leg plantarflexors were determined by a maximum voluntarycontraction (MVC) on a dynamometer (Biodex System 3, Biodex Medical Systems, Inc., Shirley, NY,USA). MVC testing was performed at an ankle angle of 90� and with fully extended legs (knee angle180�). The MVC torques were normalized to body mass.
108 D. Liebl et al. / Human Movement Science 35 (2014) 104–120
Subjects were sitting in the device and were advised to apply maximum voluntary force for a per-iod of 5 s. Maximum isometric force was determined using a 500 ms sliding window approach. Eachsubject performed three trials with a self chosen rest period. The best of these trials was used for fur-ther analysis—see Arampatzis, Karamanidis, and Albracht (2007) on more details with respect to thetesting protocol.
Movement analysis took place at the biomechanics lab located inside the track and field indoorfacilities at the German Sport University, Cologne, Germany. Runners were asked to run along a25 m long runway including a force platform (1250 Hz, 0.6 m � 0.9 m, 8 channel amplifier type9865, Kistler Instrumente AG, Winterthur, Switzerland) in its middle. Kinematics of the right lowerextremity were tracked using a ten camera Vicon Nexus system (250 Hz, Vicon Motion Systems,Oxford, UK) operating at 250 Hz. All runners wore the same kind of running shoes (Brooks Adrenaline,Brooks Sports Inc., Bothell, WA, USA).
The running surface was a 10 mm thick Tartan layer, which is covering the biomechanics lab. In thebarefoot condition, a 13 mm thick layer of Ethylene Vinyl Acetate (EVA, Shore A 25) was attached tothe Tartan base, in order to allow for barefoot running on a pleasant surface (like natural grass or sim-ilar). Runners were advised to run forward and backwards inside the lab in order to get accustomed toeach new running condition for at least 200 m. If they needed more time for familiarization, they weregiven as much time as they needed.
Marker trajectories were filtered using a forth order recursive digital Butterworth low pass filterwith a cut-off frequency of 20 Hz; GRF data was smoothed using the same filter but with a cut-off fre-quency of 100 Hz. We used different cut-off frequencies for trajectory and GRF data in order to stay inline with the already published literature in this field. Still, recent studies suggest to use matching cut-off frequencies in order to avoid artifacts that might result by the fact that accelerations of lowerextremity segments do not correspond to measured GRF (e.g., Bezodis, Salo, & Trewartha, 2013;Bisseling & Hof, 2006; Kristianslund, Krosshaug, & van den Bogert, 2012). However, those studies wereperformed on movements with higher accelerations of the lower extremities than it is the case in ourstudy of subjects running at a moderate speed. Furthermore, the above cited literature focuses on jointmoment artifacts at the knee and the hip joint, though, in the calculation of the ankle joint momentexclusively the acceleration of the foot segment is needed. The foot has a relatively small mass, there-fore, any potential acceleration measurement error due to strong filtering would only have minor ef-fects on the ankle joint moment calculation. Future studies should investigate the effect of differentfiltering procedures in less impact prone movements like jogging on lower extremity joints other thanthe knee in order to highlight if there is a need to apply matching cut-off frequencies in these kind ofmovements.
A four segment inverse dynamics model was used to calculate three dimensional joint moments atthe ankle joint. The marker protocol included both calibration and tracking markers. The former wereremoved following neutral standing reference measurement. Calibration markers were positioned onthe left and right greater trochanters, right-side medial and lateral femoral condyles, and right-sidemedial and lateral maleoli, and positioned on the shoe over the first and fifth metatarsal heads.Tracking markers were positioned on the pelvis (right and left anterior and posterior iliac spines),thigh (rigid array of four markers), shank (rigid array of four markers), and calcaneus (three markersplaced on the heel of the runner). Holes were cut into the heel-cup (diameter 30 mm) on its medial,lateral and posterior aspect, in order to avoid overestimation of heel movement during the shod con-dition (Maclean, Davis, & Hamill, 2009). Joint moments were expressed in the shank’s anatomicalcoordinate system and were normalized to body mass.
No advice was made concerning a certain running style to assure that runners were choosing theirpreferred footfall pattern. A trial was judged valid if a running speed of 3.5 m/s ± 5% was detected andno visible change in running technique in order to hit the force platform was observed. To ensure thatrunners were not accelerating during the analyzed stance phase, the ratio of propulsive to brakingimpulse of the anterio-posterior ground reaction force component had to be inside a range of 0.9 to1.1 (Willwacher, Fischer, & Brüggemann, 2011). Running speed was monitored using two light barri-ers. Stance phases were determined by using a threshold of 20 N of the vertical ground reaction forcecomponent. After time normalization to stance durations we took the averages over five trials per
D. Liebl et al. / Human Movement Science 35 (2014) 104–120 109
subject in order to define the individual joint moment functions. The intra-subject correlations of thesingle joint moment functions were all greater than 95%.
2.3. Functional mixture model
The used statistical model can be seen as a simplified version of the model based clustering ap-proach for multivariate functional data proposed in Jacques and Preda (2014). The statistical proce-dure can be divided in two distinct parts: First, (functional) principal component analysis of thejoint moment curves. Second, cluster analysis of the principal component scores. The first part ofthe procedure builds upon recent advances in the literature on functional data analysis (FDA), whichfocuses on the statistical analysis of functions and curves; a very good introduction to FDA-methodscan be found in Ramsay and Silverman (2005). A detailed discussion of the used method can be foundin the Appendix A. In the following, we give an easy to understand four-point description of how toimplement the procedure and discuss different parametrizations of the subsequently used clusteranalysis based on the EM algorithm as proposed by Fraley and Raftery (2002).
Our approach to cluster the joint moment curves can be applied as following:
1. Approximate the ankle joint moment functions X1ðtÞ; . . . ;Xi; . . . ;XnðtÞ by their M � 1 dimensionaldiscretization vectors bXi ¼ ðbXiðt1Þ; . . . ; bXiðtMÞÞ
0.
2. Approximate the model components of Eq. (A.4) by (classical) principal component analysis (PCA)applied to the n�M dimensional data matrix ½bX1; . . . ; bXn�
0. PCA is a standard method implemented
in many statistical software packages. For example, the R-function princomp () stores the esti-mated (and discretized) mean function l̂ under the name center, the pc-score vectorsb̂i ¼ ðb̂i1; . . . ; b̂iKÞ
0under the name scores and the estimated (and discretized) eigenfunctions
f̂ 1; . . . ; f̂ K under the name loadings R Core Team (2013).3. Decide about a sufficient high number of K eigenfunctions, such that, for example, the first K eigen-
functions f̂ 1; . . . ; f̂ K explain more than 95% of the total variance. If the R-function princomp
()princomp is used, the standard deviations explained by the single eigenfunctions are storedunder the name sdev.
4. Fit a Gaussian mixture model to the estimated n� K dimensional data matrix of pc-scores½b̂1; . . . ; b̂n�
0, where b̂i ¼ ðb̂i1; . . . ; b̂iKÞ
0. This can be conveniently done using the EM algorithm of
Fraley and Raftery (2002) for multivariate Gaussian mixture models, which is implemented inthe R-function Mclust of the ad-on R-package mclust (Fraley & Raftery, 2007).
The EM algorithm, as described in Fraley and Raftery (2007), fits many different Gaussian mixturemodels to the set of the estimated pc-scores ½b̂1; . . . ; b̂n� and chooses the best model on basis of theBayesian Information Criterion (BIC). The models differ from each other with respect to the paramet-rizations of the K � K dimensional group-wise covariance matrices Rg . Once the models are chosenand estimated, a subject is classified to the cluster with its highest probability.
The most simple parametrization is given by Rg ¼ kIK (i.e. only one parameter for all G groups) andthe most complex is given by Rg ¼ kgDgAgD0g (i.e. KðK þ 1Þ=2 parameters for each of the G), where thematrix Dg holds the eigenvectors and the matrix kgAg the eigenvalues of the covariance matrix Rg . Themost simple model essentially allows only for differences in the means of the clusters, but the vari-ances are constrained to be equal. The most complex model additionally allows for rather diversetypes of differences in variances: the parameter kg controls the volume of the gth cluster, the matrixAg controls the shape of the gth cluster, and the matrix Dg its orientation. All different parameteriza-tions as well as the usage of the R-package mclust are nicely discussed in Fraley and Raftery (2007).
3. Results
3.1. Cluster analysis
Before we present our empirical results, we introduce some further notations. Quantities that referto the shod (barefoot) treatment are marked by a S-superscript (B-superscript), such as, e.g., XS
i ðtÞ and
110 D. Liebl et al. / Human Movement Science 35 (2014) 104–120
XBi ðtÞ. Furthermore, quantities that refer to the FRR (FFF) cluster are marked by an R-index (F-index),
such as, e.g., l̂SRðtÞ and l̂S
FðtÞ.For the joint moment functions from the shod treatment XS
i ðtÞ as well as for those from the barefoottreatment XB
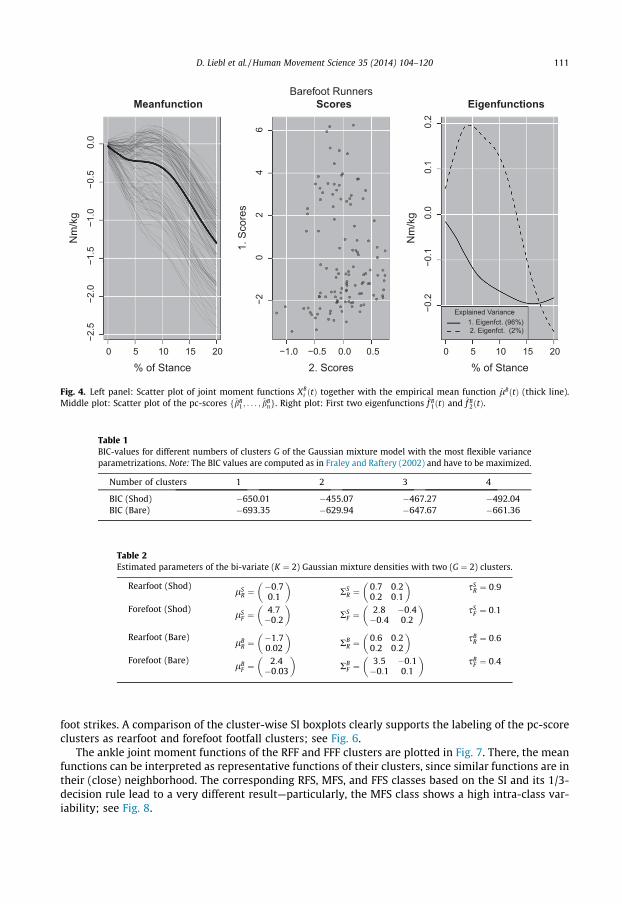
i ðtÞ only K ¼ 2 eigenfunctions suffice to approximate the original functions with 98%accuracy; see the right panels of Figs. 3 and 4. The middle panels of Figs. 3 and 4 are scatter plotsof the 2 dimensional pc-score vectors to which we fit Gaussian mixture models using the EM-algo-rithm of Fraley and Raftery (2002). For both treatments the Gaussian mixture model with the mostflexible variance parametrization and two clusters (i.e., G ¼ 2) maximize the BIC; see Table 1. Thismeans, for each treatment condition the pc-score vectors are modeled by a Gaussian mixture modelwith two clusters, where the clusters are allowed to differ with respect to their volumes, shapes, anddirections.
The corresponding probability density functions (pdf) of the 2 dimensional pc-score vectors oftreatment T 2 fS; Bg can be formulated as following:
Nm
/kg
Fig. 3.Middle
sTR/ lT
R;RTR
� �þ sT
F / lTF ;R
TF
� �with T 2 fS;Bg; ð1Þ
where /ðl;RÞ denotes the bi-variate Gaussian normal pdf with mean vector l and covariance matrixR. The corresponding parameter estimates are shown in Table 2. Except for the proportion parameterssT
C , the estimated parameters are comparable across the treatment conditions T 2 fS;Bg. The propor-tion parameters sT
R and sTF with sT
F ¼ 1� sTR
� �quantify which fractions of the n ¼ 119 subjects are allo-
cated to the RFF and FFF clusters within treatment T 2 fS;Bg. While only sSF ¼ 10% of the subjects
perform a FFF in the shod condition, sBF ¼ 40% perform a FFF in the barefoot condition.
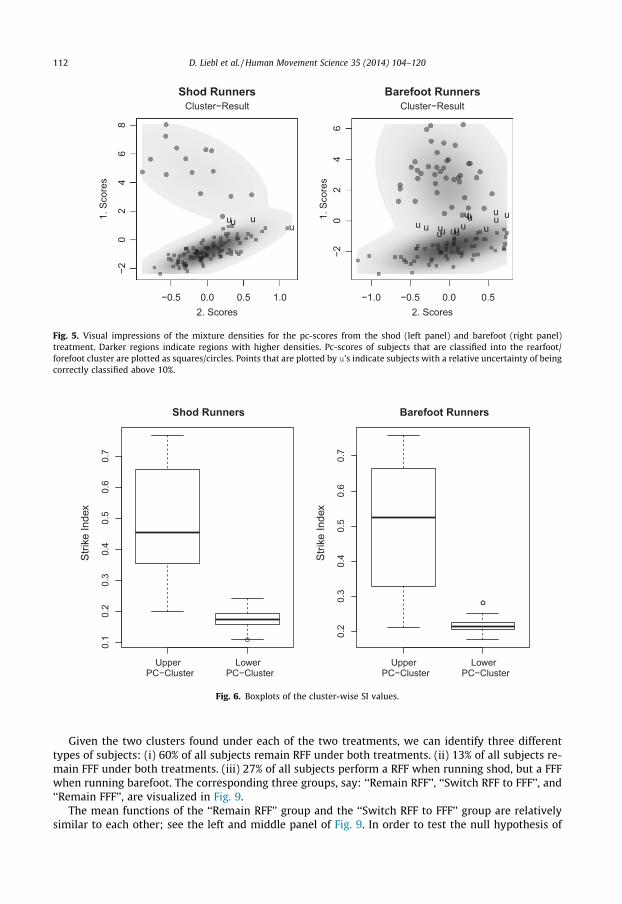
The mixture densities for the pc-score vectors are given in Fig. 5. There, points that are plotted as‘‘u’’s indicate subjects with a relative uncertainty of being correctly classified above 10%. The visualinspection confirms the plausibility of the cluster structure and reassures the model choice basedon the BIC values. In fact, each of the clusters comprises a homogeneous set of pc-score vectors, whichleads to homogeneous clusters of ankle joint moment functions. In order to assess whether it is actu-ally justified to refer to the clusters as RFF and FFF clusters, we conduct a simple ex-post analysis. Asalready discussed in the introduction, the SI is a well interpretable descriptive measure that quantifies
Fig. 4. Left panel: Scatter plot of joint moment functions XBi ðtÞ together with the empirical mean function l̂BðtÞ (thick line).
Middle plot: Scatter plot of the pc-scores fb̂B1; . . . ; b̂B
ng. Right plot: First two eigenfunctions f̂ B1ðtÞ and f̂ B
2ðtÞ.
Table 1BIC-values for different numbers of clusters G of the Gaussian mixture model with the most flexible varianceparametrizations. Note: The BIC values are computed as in Fraley and Raftery (2002) and have to be maximized.
Table 2Estimated parameters of the bi-variate (K ¼ 2) Gaussian mixture densities with two (G ¼ 2) clusters.
Rearfoot (Shod)lS
R ¼�0:70:1
� �RS
R ¼0:7 0:20:2 0:1
� �sS
R ¼ 0:9
Forefoot (Shod)lS
F ¼4:7�0:2
� �RS
F ¼2:8 �0:4�0:4 0:2
� �sS
F ¼ 0:1
Rearfoot (Bare)lB
R ¼�1:70:02
� �RB
R ¼0:6 0:20:2 0:2
� �sB
R ¼ 0:6
Forefoot (Bare)lB
F ¼2:4�0:03
� �RB
F ¼3:5 �0:1�0:1 0:1
� �sB
F ¼ 0:4
D. Liebl et al. / Human Movement Science 35 (2014) 104–120 111
foot strikes. A comparison of the cluster-wise SI boxplots clearly supports the labeling of the pc-scoreclusters as rearfoot and forefoot footfall clusters; see Fig. 6.
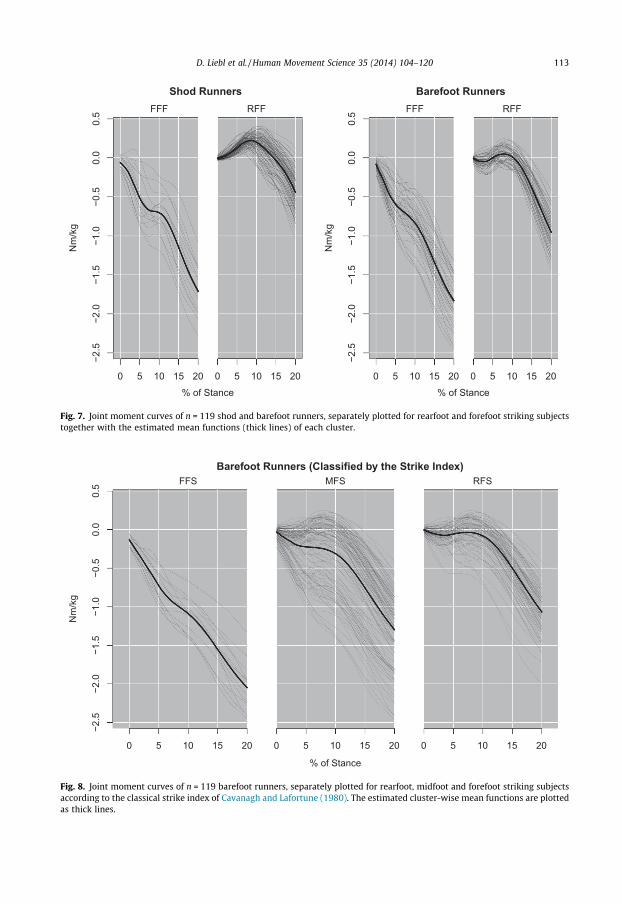
The ankle joint moment functions of the RFF and FFF clusters are plotted in Fig. 7. There, the meanfunctions can be interpreted as representative functions of their clusters, since similar functions are intheir (close) neighborhood. The corresponding RFS, MFS, and FFS classes based on the SI and its 1/3-decision rule lead to a very different result—particularly, the MFS class shows a high intra-class var-iability; see Fig. 8.
Shod RunnersCluster−Result
−0.5 0.0 0.5 1.0
−20
24
68
2. Scores
1. S
core
s
uu uu
Barefoot RunnersCluster−Result
−1.0 −0.5 0.0 0.5
−20
24
6
2. Scores1.
Sco
res
uu
uuuu u
uu uu uuu
uu
Fig. 5. Visual impressions of the mixture densities for the pc-scores from the shod (left panel) and barefoot (right panel)treatment. Darker regions indicate regions with higher densities. Pc-scores of subjects that are classified into the rearfoot/forefoot cluster are plotted as squares/circles. Points that are plotted by u’s indicate subjects with a relative uncertainty of beingcorrectly classified above 10%.
●
Shod Runners
Strik
e In
dex
Upper PC−Cluster
Lower PC−Cluster
●●
Barefoot Runners
Strik
e In
dex
0.1
0.2
0.3
0.4
0.5
0.6
0.7
0.2
0.3
0.4
0.5
0.6
0.7
Upper PC−Cluster
Lower PC−Cluster
Fig. 6. Boxplots of the cluster-wise SI values.
112 D. Liebl et al. / Human Movement Science 35 (2014) 104–120
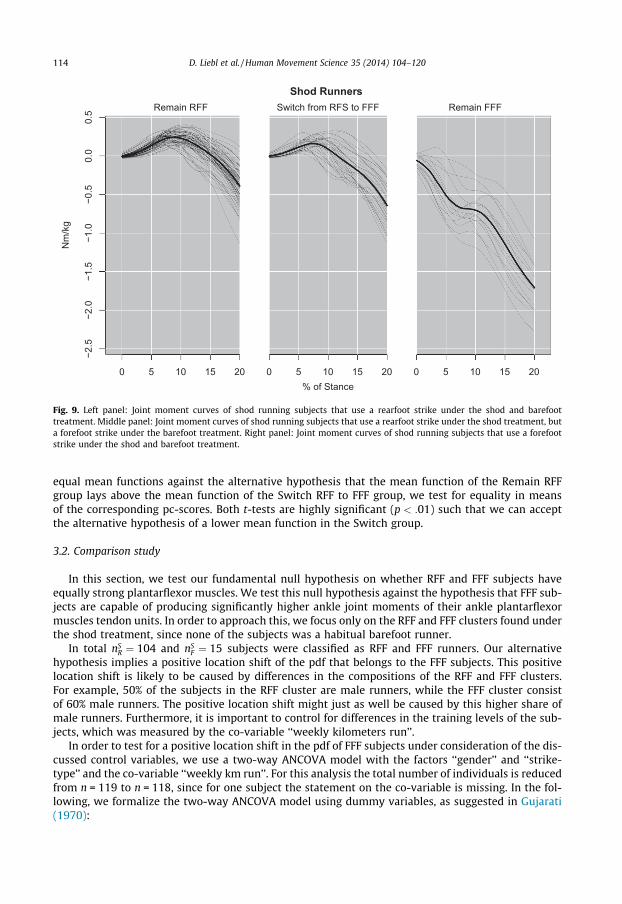
Given the two clusters found under each of the two treatments, we can identify three differenttypes of subjects: (i) 60% of all subjects remain RFF under both treatments. (ii) 13% of all subjects re-main FFF under both treatments. (iii) 27% of all subjects perform a RFF when running shod, but a FFFwhen running barefoot. The corresponding three groups, say: ‘‘Remain RFF’’, ‘‘Switch RFF to FFF’’, and‘‘Remain FFF’’, are visualized in Fig. 9.
The mean functions of the ‘‘Remain RFF’’ group and the ‘‘Switch RFF to FFF’’ group are relativelysimilar to each other; see the left and middle panel of Fig. 9. In order to test the null hypothesis of
Shod Runners
% of Stance
Nm
/kg
FFF RFF
0 5 10 15 20
−2.5
−2.0
−1.5
−1.0
−0.5
0.0
0.5
0 5 10 15 20
Barefoot Runners
% of Stance
Nm
/kg
FFF RFF
0 5 10 15 20
−2.5
−2.0
−1.5
−1.0
−0.5
0.0
0.5
0 5 10 15 20
Fig. 7. Joint moment curves of n = 119 shod and barefoot runners, separately plotted for rearfoot and forefoot striking subjectstogether with the estimated mean functions (thick lines) of each cluster.
Barefoot Runners (Classified by the Strike Index)
% of Stance
Nm
/kg
FFS MFS RFS
0 5 10 15 20
−2.5
−2.0
−1.5
−1.0
−0.5
0.0
0.5
0 5 10 15 20 0 5 10 15 20
Fig. 8. Joint moment curves of n = 119 barefoot runners, separately plotted for rearfoot, midfoot and forefoot striking subjectsaccording to the classical strike index of Cavanagh and Lafortune (1980). The estimated cluster-wise mean functions are plottedas thick lines.
D. Liebl et al. / Human Movement Science 35 (2014) 104–120 113
Shod Runners
% of Stance
Nm
/kg
Remain RFF Switch from RFS to FFF Remain FFF
0 5 10 15 20
−2.5
−2.0
−1.5
−1.0
−0.5
0.0
0.5
0 5 10 15 20 0 5 10 15 20
Fig. 9. Left panel: Joint moment curves of shod running subjects that use a rearfoot strike under the shod and barefoottreatment. Middle panel: Joint moment curves of shod running subjects that use a rearfoot strike under the shod treatment, buta forefoot strike under the barefoot treatment. Right panel: Joint moment curves of shod running subjects that use a forefootstrike under the shod and barefoot treatment.
114 D. Liebl et al. / Human Movement Science 35 (2014) 104–120
equal mean functions against the alternative hypothesis that the mean function of the Remain RFFgroup lays above the mean function of the Switch RFF to FFF group, we test for equality in meansof the corresponding pc-scores. Both t-tests are highly significant (p < :01) such that we can acceptthe alternative hypothesis of a lower mean function in the Switch group.
3.2. Comparison study
In this section, we test our fundamental null hypothesis on whether RFF and FFF subjects haveequally strong plantarflexor muscles. We test this null hypothesis against the hypothesis that FFF sub-jects are capable of producing significantly higher ankle joint moments of their ankle plantarflexormuscles tendon units. In order to approach this, we focus only on the RFF and FFF clusters found underthe shod treatment, since none of the subjects was a habitual barefoot runner.
In total nSR ¼ 104 and nS
F ¼ 15 subjects were classified as RFF and FFF runners. Our alternativehypothesis implies a positive location shift of the pdf that belongs to the FFF subjects. This positivelocation shift is likely to be caused by differences in the compositions of the RFF and FFF clusters.For example, 50% of the subjects in the RFF cluster are male runners, while the FFF cluster consistof 60% male runners. The positive location shift might just as well be caused by this higher share ofmale runners. Furthermore, it is important to control for differences in the training levels of the sub-jects, which was measured by the co-variable ‘‘weekly kilometers run’’.
In order to test for a positive location shift in the pdf of FFF subjects under consideration of the dis-cussed control variables, we use a two-way ANCOVA model with the factors ‘‘gender’’ and ‘‘strike-type’’ and the co-variable ‘‘weekly km run’’. For this analysis the total number of individuals is reducedfrom n = 119 to n = 118, since for one subject the statement on the co-variable is missing. In the fol-lowing, we formalize the two-way ANCOVA model using dummy variables, as suggested in Gujarati(1970):
Table 3Estimatcolumndiscove
Para
b0
bG
bS
bX
D. Liebl et al. / Human Movement Science 35 (2014) 104–120 115
Yijk ¼ b0 þ bSDS þ bGDG þ bXXijk þ eijk; ð2Þ
where the index i ¼ 1; . . . ;n refers to the individuals, the index j ¼ 1;2 refers to the different footfalltypes, and the index k ¼ 1;2 refers to the different genders. The dummy variable DS ðDGÞ is equal toone, if the corresponding subject is a FFF subject (male subject) and zero otherwise. The dependentvariable Y denotes the MVC torques of plantarflexors and the independent random variable X denotesthe co-variable ‘‘weekly km run’’. The b-parameters can be interpreted as following:
b0: intercept for female, RFF subjectsbS: differential intercept for FFF subjectsbG: differential intercept for male subjectsbX: slope coefficient of Y with respect to X
We use the rather simple Model (2) with a common slope-parameter for all groups and withoutinteraction effects, since it is not significantly worse in explaining the variations of the dependentvariable Y, than the corresponding completely unrestricted ANCOVA model with group-wiseslope-parameters and interaction effects; (F-test, p > :10). The null hypothesis on whetherModel (2) explains the variations of the dependent variable Y equally well as the further restrictedmodel with bS ¼ bG ¼ 0, can be rejected in favor of Model (2) (F-test, p 6 :01).
The dummy variable notation in Model (2) makes it easy to formalize our null hypothesis, since atest of no footfall type effect and no gender effect against the alternatives of a positive FFF effect and apositive male effect is equivalent to test whether bS ¼ 0 and bG ¼ 0 against bS > 0 and bG > 0. Thesehypothesis can be tested by t-tests, where we adjust the p-values of the t-tests using the methodsuggested in Benjamini and Hochberg (1995), in order to control for the false discovery rate of thismultiple testing problem. The estimation results are shown in Table 3.
Both null hypothesis can be rejected in favor of the alternative hypothesis (t-tests, adj. p < :05).This means, in tendency, FFF/male subjects are capable of producing higher ankle joint moments oftheir ankle plantarflexor muscles tendon units than RFF/female subjects with differences in therespective group-wise means by 0.28 Nm/kg and 0.32 Nm/kg; see Table 3.
The normality assumption cannot be rejected in either of the groups (Shapiro–Wilk tests, p > :5).Nevertheless, in order to take into account a possible miss judgment with respect to the normalityassumption, we repeated the above analysis using a two-way ANCOVA model based on the ranks ofthe dependent variable Y and the co-variable X, and additionally conducted the test procedure sug-gested by Quade (1967). Both methodologies are robust against violations of the normality assump-tion; see Conover and Iman (1982). As this additional statistical analysis confirms our above resultswith respect to a significance level of 5%, we do not report any further details.
4. Discussion
The most interesting characteristic of our dataset is that the subjects were not instructed to per-form a specific footfall pattern, but were allowed to run with their habitually preferred patterns. Onthe one hand, this situation brings the drawback of having to conduct an ex-post cluster analysis.
ion results of the parameters b0 ; bS ; bG for Model (2) (second column) with the corresponding standard deviations (third) and t-test statistics (fourth column). The p-values (fifth column) are adjusted p-values in order to control the falsery rate as suggested in Benjamini and Hochberg (1995).
116 D. Liebl et al. / Human Movement Science 35 (2014) 104–120
On the other hand, it provides the unique possibility to analyze physical differences between RFF andFFF subjects. Both issues are discussed in this section.
4.1. Cluster analysis
The first of two purposes of the present study was to introduce a novel statistical procedure to findclusters in footfall patterns of human runners. As motivated in the introduction, the main problemwith the 1/3-decision rule is its rigid geometrical specification, which generally does not take into ac-count excising clusters in the data. This leads to truncated samples, which harm any statistical infer-ence due to the so-called truncation bias. By contrast, the stochastic specification of the proposedcluster procedure allows for overlapping clusters and assigns each subject to the cluster with its high-est probability.
The introduced procedure heavily relies on the functional version of principal component analysis,which takes into account the typical functional (or dynamic) nature of our biomechanical dataset.Although functional data typically arise in biomechanical studies, FPCA is still rarely used in theliterature on biomechanics. There, most often used approach to dimension reduction is the selectionof so-called characteristic features extracted from the functional data; see, for example, Vardaxis,Allard, Lachance, and Duhaime (1998), Wu, Wang, and Liu (2007), Lau, Tong, and Zhu (2009) andSaripalle et al. (2014).
We use the sagital joint moments at the ankle joint from a four segment inverse dynamics model inorder to find clusters in human foot strike patterns. Nevertheless, the introduced cluster procedurecan also be used with other kinds of functional biomechanical data—as long as the data contain usefulinformation for the differentiation of footfall patterns. Promising examples are functional measure-ments from 3-D kinematic studies of the angle of the plantar surface or functional GRF data; seeWilliams et al. (2000). In fact, the ankle angle might indeed be less prone to inaccuracies of centerof pressure calculation with low ground reaction forces. If more than one set of functional data is avail-able, it is advisable to use the multivariate version of FPCA as proposed in Jacques and Preda (2014).
We consider only the first 20% of the stance phase, which roughly spans the time span of a typicalfoot landing. The smoothness of functional data implies that changes in the considered ranges of thedomains of functional data will not cause abrupt changes in the statistical results. Correspondingly,our results essentially remain unchanged when considering the first 15%, 25%, or 30% of the stancephase instead of the first 20%.
There is a typical difference between the proposed FPCA based procedure and the more classicalprocedure based on characteristic features extracted from the functional data. For example, in the veryleft plot of Fig. 7 there is one ankle joint moment function with an initial positive internal ankle mo-ment. If, for example, the sign of the initial internal ankle plantar flexion moment would be used as acharacteristic feature in order to differentiate between rearfoot and forefoot strikes, this particularjoint moment function would have been classified to the rearfoot strike group. By contrast, the clusteranalysis on basis of pc-score vectors classifies this joint moment function to the FFF cluster, since herethe whole course is considered, such that single characteristics do not carry much weight. However,the relative uncertainty of this observation being correctly classified is 70 times higher than the cor-responding uncertainty of all other observations in this cluster together.
The application of the novel cluster approach to our dataset of n = 119 subjects leads to two, wellinterpretable clusters with low intra-cluster variations; see Fig. 7. The ex-post analysis of the two clus-ters validates clearly that we can refer to them as RFF and FFF clusters; see boxplots in Fig. 6. However,it has to be emphasized that the RFF/FFF clusters and the RFS/MFS/RFS classes arise from different con-cepts. Yet, they are closely related with respect to their aims. In fact, the 90% frequency of RFF shodrunning subjects (see sS
R in Table 2) equals the 90% frequency of RFS shod running subjects publishedin Larson et al. (2011), who analyze a comparable set of recreational sub-elite runners.
Though, classification of the foot strikes based on the SI and its 1/3-decision rule generally pro-duces a rather different, ambiguous results; see Fig. 8. Particularly, the MFS class is very heteroge-neous, such that the corresponding mean function cannot be regarded as a representative jointmoment functions for MFS subjects. The latter issue is critical: it reflects the truncation bias, whichdemands for an appropriate statistical treatment; see, e.g., Cohen (1991). In the introduction we point
D. Liebl et al. / Human Movement Science 35 (2014) 104–120 117
to the contradictory classification result (SI-method) that 44 of 108 shod SI-classified RFS runners haveinitial plantarflexion moments. By contrast, after excluding subjects that have a relative uncertainty ofbeing correctly classified above 10% (see also Fig. 5), only 4 of 105 shod RFF runners have initial plan-tarflexion moments.
A possible drawback of the proposed cluster analysis based on functional data is that it is more in-volved than the SI and its 1/3-decision rule—although our step-by-step instructions in Section 2.3 shallprovide guidance. Furthermore, we cannot find a third cluster of subjects with a midfoot footfall pat-tern. In fact, the choice of Gaussian mixture models with only two clusters on basis of the BIC is ratherclear-cut; see Table 2. However, this result does not exclude the general existence of a separate, say,MFF cluster. It rather suggests that MFF patterns are not distinguishable from FFF patterns on basis ofthe proposed procedure.
Finally, a very interesting feature of our study is that the two clusters found under both treatmentsallow to determine how many subjects switch their footfall patterns from one treatment condition tothe other. While the majority (87%) of all subjects use their preferred footfall pattern across the treat-ments, there is a non-negligible share of 13% of the subjects, which switch from RFF when runningshod to FFF when running barefoot. Although the ankle joint moment functions of the ‘‘RemainRFF’’ subjects are rather similar to those of the ‘‘Switch from RFF to FFF’’ subjects, a test on the equalityof the corresponding mean functions can be rejected at a significance level <0.01. A further, deeperanalysis of this group of subjects that are capable of switching their footfall patterns is not withinthe scope of this study, but will be of interest for further research.
4.2. Comparison study
As hypothesized, FFF subjects were capable to produce significantly higher plantarflexion torquesthan RFF subjects (difference in means: 0.28 Nm/kg). This means, the maximum voluntary contractionof the ankle plantarflexor muscles tendon units between representative RFF and FFF subjects (assum-ing masses of 75 kg) differs on average by 21 Nm. This effect remains significant after controlling foran additional gender effect and differences in training levels measured by the co-variable ‘‘weeklykilometers run’’.
Of course, from this result we cannot conclude whether the higher force capacities of FFF subjectsare an adaptation to the higher mechanical demand (i.e., higher plantarflexion moments) that isplaced upon their ankle joints, or if higher force capacities are a prerequisite for using a FFF pattern.Essentially, the latter research question coincides with the research question on whether the higherplantarflexion moments during FFF running are sub- or suprathreshold stimuli on the plantarflexionmuscle tendon units. The higher plantarflexion moments during a single step might be considered astoo small to induce an adaptation in force capacities of ankle plantarflexors.
Nonetheless, there are converse research findings for the case of minimal footwear, which tend totrigger a forefoot striking behavior. For example, Brüggemann, Potthast, Braunstein, and Niehoff(2005) showed that the use of minimal footwear in warm up running induces improvements in strengthand anatomical cross sectional areas of triceps surae and extrinsic foot muscles. The latter considerationswould suggest an interaction effect between the dummy variable ‘‘strike-type’’ and the co-variable‘‘weekly km run’’. The hypothesis of a suprathreshold FFF stimulus on the plantarflexion muscle tendonunits would be supported, if the co-variable ‘‘weekly km run’’ has a positive effect on the MVC torques ofplantarflexors in the case of FFF runners, but a non-significant effect in the case of a RFS runners.
The reported result that the rather simple Model (2) without interaction effects is not significantlyworse in explaining the variations of the dependent variable Y, than the completely unrestricted AN-COVA model with interaction effects does not generally rule out the existence of interaction effects.Longitudinal studies are needed to resolve this issue in greater detail.
5. Conclusions
We introduce a novel statistical cluster procedure to find groups in habitually performed footfallpatterns. The proposed procedure relies on the functional version of principal component analysis
118 D. Liebl et al. / Human Movement Science 35 (2014) 104–120
and tries to find systematic differences in the initial ankle joint moment functions. The found clustersare well interpretable as rearfoot footfall and forefoot footfall clusters and show low intra-clustervariations.
These RFF and FFF clusters are used to test our null hypothesis that subjects with habitual rearfootfootfall patterns and subjects with habitual forefoot footfall patterns equal in their ankle plantarflexorstrength. This null hypothesis can be rejected at a 5% significance level in favor of the alternative thatthe mean ankle plantarflexor strength of FFF subjects is significantly higher. This effect remains signif-icant after controlling for an additional gender effect and for differences in training levels.
Conflict of interest
We acknowledge that all authors do not have any conflict of interest and were fully involved in thestudy and preparation of the manuscript.
Acknowledgments
Parts of the study were financially supported by Brooks Sports Inc., Bothell, WA, USA. This sponsorhad no influence on data analysis and interpretation. Further, the sponsor was not involved in thewriting and submitting process of the manuscript. The authors are grateful to the reviewers for con-structive comments and support.
Appendix A. Functional mixture model
We assume that the joint moment function XiðtÞ of a subject i is a smooth random function gener-ated by a functional Gaussian mixture model with unknown group labels g, unknown mixture prob-abilities sg , and group-specific mean joint moment functions lgðtÞ. The model can be written as
XiðtÞ ¼XG
g¼1
sg lgðtÞ þ Yiðt; gÞ� �
with t 2 ½0;1�; i 2 f1; . . . ;ng; ðA:1Þ
where G is the number of groups. Here, the time interval t 2 ½0;1� is set to the unit-interval, which goeswithout loss of generality. The first term of the right hand side of Eq. (A.1) models the group-specificmean functions lg and the second term the group-specific stochastic deviations Yiðt; gÞ from the meanfunctions with EðYiðt; gÞÞ ¼ 0 for all t 2 ½0;1� and g 2 f1; . . . ;Gg. Our assumption on the smoothness ofthe random functions XiðtÞ is formalized by requiring that the functions XiðtÞ are square integrable, i.e.,XiðtÞ 2 L2½0;1�.
Since we do not observe the group labels g, but only the mixture of all G groups we can just as wellwrite Eq. (1) in an aggregated version as following:
XiðtÞ ¼lðtÞ þ YiðtÞ with t 2 ½0;1�; ðA:2Þ
where lðtÞ ¼PG
g¼1sg lgðtÞ and YiðtÞ ¼PG
g¼1sg Yiðt; gÞ.In the following it will be convenient to write the functional random variable YiðtÞ using its Karh-
unen Loève decomposition
YiðtÞ ¼X1k¼1
bikfkðtÞ; ðA:3Þ
where the series of eigenfunctions functions ðfkÞk2f1;2;...g forms a complete orthonormal basis system,i.e.,
R 10 fkðtÞflðtÞdt ¼ 1 for all k ¼ l and zero else, and the scores bik ¼
R 10 YiðtÞfkðtÞdt are univariate Gauss-
ian random variables with EðbikÞ ¼ 0 for all k 2 f1;2; . . .g and Eðb2ikÞ ! 0 sufficiently fast as k goes to
infinity.The eigenfunctions fkðtÞ can be determined via the eigendecomposition of the covariance operator
CðtÞ ¼R 1
0 cðs; tÞxðsÞds with the covariance function cðs; tÞ ¼ E XiðsÞ � lðsÞð Þ XiðtÞ � lðtÞð Þ½ �. More detaileddiscussions can be found, e.g., in Chapter 8 of the textbook of Ramsay and Silverman (2005).
D. Liebl et al. / Human Movement Science 35 (2014) 104–120 119
It is well known that the first K eigenfunctions f1ðtÞ; . . . ; fKðtÞ determine an orthonormal basis sys-tem, which allows for the best K-dimensional approximation of Eq. (A.3), such that we can write with-out much loss of accuracy
YiðtÞ ¼XK
k¼1
bikfkðtÞ ¼ ðbi1; . . . ; biKÞ
f1ðtÞ...
fKðtÞ
0BB@
1CCA ðA:4Þ
with K <1.In practical applications, usually K ¼ 2 or K ¼ 3 is sufficient to achieve over 95% accuracy. We can
use this K-dimensional system of eigenfunctions f1ðtÞ; . . . ; fKðtÞ in order to reduce the dimension of the(potentially infinite dimensional) joint moment functions XiðtÞ. In other words, instead of workingwith the functions XiðtÞ, we can analyze the corresponding pc-scores bi1; . . . ; biK using standard mul-tivariate methods with negligible loss of information.
Given our model assumptions in Eq. (A.1) it can be seen easily that the K � 1 dimensional pc-scorevectors bi ¼ ðbi1; . . . ; biKÞ
0 of Eq. (A.4) can be written as a mixture of G group-specific pc-score vectors,i.e., bi ¼
PGg¼1sgb
gi , where the group-specific pc-score vectors bg
i are K-variate Gaussian random vari-ables with K � 1 dimensional mean vectors Eðbg
i Þ and K � K dimensional covariance matrices Vðbgi Þ.
This is exactly the situation, which is assumed for (multivariate) Gaussian mixture models, whichcan be easily estimated by the EM-algorithm (see, e.g., Fraley & Raftery, 2002). This means that oncewe have estimated the overall pc-score vectors bi, we can cluster them using standard multivariateGaussian mixture models.
Note that, although the vector of the individual pc-scores bi is an ordinary K-variate random var-iable, it determines the specific shape of the joint moment function XiðtÞ. Therefore, finding clustersin a sample of the K dimensional scores fb1; . . . ; bng corresponds to finding shape-specific clustersin the sample of joint moment functions XiðtÞ.
Of course, in practice the functions and integrals in Eqs. (A.1)–(A.4) have to be approximated byvectors and sums. The arising discretization error can be kept reasonably small by using a sufficientlydense grid of discretization points 0 6 t1 < � � � < tM 6 1. Hereby, ‘‘sufficiently dense’’ means to balancethe following trade off: On the one hand side the number of discretization points M has to be large(often M � n) such that all important features of the functions XiðtÞ are cached by the discretizationvectors. On the other hand, M has to be strictly smaller than the number of functional observationsn in order to guarantee a stable principal components analysis. Otherwise, the dual estimation ap-proach proposed by Benko, Härdle, and Kneip (2009) has to be used. Many further particularities ofFPCA can be found in Chapter 8 of the textbook Ramsay and Silverman (2005).
References
Arampatzis, A., Karamanidis, K., & Albracht, K. (2007). Adaptational responses of the human achilles tendon by modulation ofthe applied cyclic strain magnitude. Journal of Experimental Biology, 210, 2743–2753.
Benjamini, Y., & Hochberg, Y. (1995). Controlling the false discovery rate: A practical and powerful approach to multiple testing.Journal of the Royal Statistical Society, Series B (Methodological), 57, 289–300.
Benko, M., Härdle, W., & Kneip, A. (2009). Common functional principal components. The Annals of Statistics, 37, 1–34.Bezodis, N. E., Salo, A. I., & Trewartha, G. (2013). Excessive fluctuations in knee joint moments during early stance in sprinting
are caused by digital filtering procedures. Gait & Posture, 38, 653–657.Bisseling, R. W., & Hof, A. L. (2006). Handling of impact forces in inverse dynamics. Journal of Biomechanics, 39, 2438–2444.Brüggemann, G. P., Potthast, W., Braunstein, B., & Niehoff, A. (2005). Effect of increased mechanical stimuli on foot muscles
functional capacity. In Proceedings of the ISB XXth Congress – ASB 29th annual meeting, 31 July–5 August, 2005 (pp. 579–582).Cavanagh, P., & Lafortune, M. (1980). Ground reaction forces in distance running. Journal of Biomechanics, 13, 397–406.Cohen, A. C. (1991). Truncated and censored samples: Theory and applications. CRC Press.Conover, W. J., & Iman, R. L. (1982). Analysis of covariance using the rank transformation. Biometrics, 38, 715–724.Daoud, A., Geissler, G., Wang, F., Saretsky, J., Daoud, Y., & Lieberman, D. (2012). Foot strike and injury rates in endurance
runners: A retrospective study. Medicine and Science in Sports and Exercise, 44, 1325–1334.Dempster, A., Laird, N., & Rubin, D. (1977). Maximum likelihood from incomplete data via the em algorithm. Journal of the Royal
Statistical Society, Series B (Methodological), 39, 1–38.Fraley, C., & Raftery, A. (2002). Model-based clustering, discriminant analysis, and density estimation. Journal of the American
Statistical Association, 97, 611–631.Fraley, C., & Raftery, A. (2007). Model-based methods of classification: Using the mclust software in chemometrics. Journal of
120 D. Liebl et al. / Human Movement Science 35 (2014) 104–120
Gruber, A. H., Umberger, B. R., Braun, B., & Hamill, J. (2013). Economy and rate of carbohydrate oxidation during running withrearfoot and forefoot strike patterns. Journal of Applied Physiology, 115, 194–201.
Gujarati, D. (1970). Use of dummy variables in testing for equality between sets of coefficients in linear regressions: Ageneralization. The American Statistician, 24, 18–22.
Hasegawa, H., Yamauchi, T., & Kraemer, W. J. (2007). Foot strike patterns of runners at the 15-km point during an elite-level halfmarathon. Journal of Strength and Conditioning Research, 21, 888–893.
Jacques, J., & Preda, C. (2014). Model-based clustering for multivariate functional data. Computational Statistics and Data Analysis,71, 92–106.
Kristianslund, E., Krosshaug, T., & van den Bogert, A. J. (2012). Effect of low pass filtering on joint moments from inversedynamics: Implications for injury prevention. Journal of Biomechanics, 45, 666–671.
Larson, P., Higgins, E., Kaminski, J., Decker, T., Preble, J., Lyons, D., et al (2011). Foot strike patterns of recreational and sub-eliterunners in a long-distance road race. Journal of Sports Sciences, 29, 1665–1673.
Lau, H.-y., Tong, K.-y., & Zhu, H. (2009). Support vector machine for classification of walking conditions of persons after strokewith dropped foot. Human Movement Science, 28, 504–514.
Lieberman, D. (2012). What we can learn about running from barefoot running: An evolutionary medical perspective. Exerciseand Sport Sciences Reviews, 40, 63–72.
Maclean, C. L., Davis, I. S., & Hamill, J. (2009). Influence of running shoe midsole composition and custom foot orthoticintervention on lower extremity dynamics during running. Journal of Applied Biomechanics, 25, 54–63.
Quade, D. (1967). Rank analysis of covariance. Journal of the American Statistical Association, 62, 1187–1200.R Core Team (2013). R: A language and environment for statistical computing. Vienna, Austria: R Foundation for Statistical
Computing. URL: <http://www.R-project.org>.Ramsay, J. O., & Silverman, B. W. (2005). Functional data analysis. Springer series in statistics (2nd ed., ). New York: Springer.Saripalle, S. K., Paiva, G. C., Cliett, T. C., III, Derakhshani, R. R., King, G. W., & Lovelace, C. T. (2014). Classification of body
movements based on posturographic data. Human Movement Science, 33, 238–250.Vardaxis, V. G., Allard, P., Lachance, R., & Duhaime, M. (1998). Classification of able-bodied gait using 3-d muscle powers. Human
Movement Science, 17, 121–136.Williams, D., McClay, I. S., & Manal, K. T. (2000). Lower extremity mechanics in runners with a converted forefoot strike pattern.
Journal of Applied Biomechanics, 16, 210–218.Willwacher, S., Fischer, K., & Brüggemann, G. P. (2011). Is average speed control sensitive enough to ensure nonaccelerated
running in the analysis of distance running mechanics? In ISBS-conference proceedings (pp. 579–582).Wu, J., Wang, J., & Liu, L. (2007). Feature extraction via KPCA for classification of gait patterns. Human Movement Science, 26,