53
Transportation Engineering Transportation Planning Process
| Date post: | 16-Apr-2017 |
| Category: |
Engineering |
| Upload: | hossam-ronaldo |
| View: | 285 times |
| Download: | 3 times |

Transportation Engineering
Transportation Planning Process

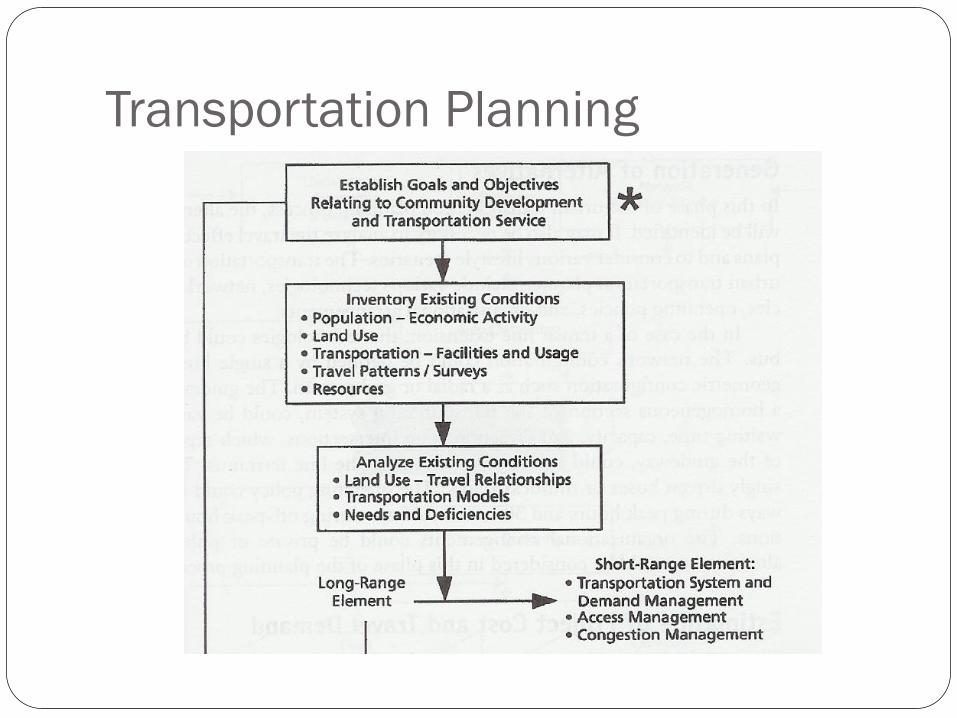
Transportation Planning
What are some examples of goals and
objectives for a transportation system?
Transportation Planning

Transportation Planning

Forecasting Travel
How do we know what travel behavior
will be like in 20 years?

Defining Study Area Delineate boundaries and subdivide into zones
Zones Should Have Following Characteristics
Homogeneous Socioeconomic Characteristics
Intrazonal Trips Should Be Minimized
Use Physical, Political, and Historical Boundaries if Possible
Zones Should Not Be Created Within Other Zones
The Zone System Should Generate and Attract Approximately Equal
Trips, Households, Population,or Area
Use Census Tract Boundaries Where Possible.

Example for TAZs
Forecasting Travel
Population and Economic Data
Transportation Inventories
Travel Surveys

Forecasting Travel
Calibration
Establishing a mathematical relationship to estimate future
travel demand

Trip Estimation Example A multiple regression analysis shows the following
relationship for the number of trips per household: T = 0.82 + 1.3P + 2.1A
T = Trips per household per day
P = persons per household
A = Autos per household
Zone contains 250 households with an average of 4 persons and 2 autos for each household, determine the average number of trips per day in that zone .

Transportation Planning
Environmental Impact Statements
Purpose and Need
Alternatives
Environmental Effects

Highway Engineering
Forecasting Travel Demand
Growth Rate Methods (Rural)
Urban and Intercity Travel Forecasting

Forecasting Travel Demand
Factors Influencing Travel Demand
Location and intensity of land use
Socioeconomic Characteristics of the
population
Extent, Cost, and Quality of the available
transportation
Forecasting Travel Demand
What are some factors that affect
how much you travel?

Forecasting Travel Demand

Forecasting Travel Demand
Trip generation
Process for determining the number of trips that will begin and
end in each traffic zone.

Trip Generation
Trip End
Trip Production
Trip Attraction
Trip Generation
Classification of Trips
Home-Based Work (HBW)
Home-Based Other (HBO)
Non Home Based (NHB)

Trip Generation
Two functions of trip generation
Develop a relationship between trip end production or
attraction and land use
Use the relationship developed to estimate the number of trips
generated at some future date under a new set of land-use
conditions

Trip Generation
Cross classification method of trip
generation
Develop relationship between socioeconomic
measures and trip generation
Trip Generation Example
Develop a set of curves showing the number of trips per
household versus income and auto ownership.

Trip Generation Example Household # Trips Produced Income ($1000) Autos
1 2 16 0 2 4 24 0 3 10 68 2 4 5 44 0 5 5 18 1 6 15 68 3 7 7 38 1 8 4 36 0 9 6 28 1
10 13 76 3 11 8 72 1 12 6 32 1 13 9 28 2 14 11 44 2 15 10 44 2 16 11 52 2 17 12 60 2 18 8 44 1 19 8 52 1 20 6 28 1

Trip Generation Example
Income ($1000)
Autos Owned Total
0 1 2+
24 2 (67) 1 (33) 0 (0) 3 (100)
24 – 36 1 (20) 3 (60) 1 (20) 5 (100)
36 – 48 1 (20) 2 (40) 2 (40) 5 (100)
48 – 60 0 (0) 1 (33) 2 (67) 3 (100)
> 60 0 (0) 1 (25) 3 (75) 4 (100)
Total 4 8 8 20
Number & Percent of Household in Each Income Category Versus Car Ownership

Trip Generation Example

Trip Generation Example
Income ($1000)
Autos Owned
0 1 2 +
<24 3 5 --
24 – 36 4 6 9
36 – 48 5 7.5 10.5
48 – 60 -- 8.5 11.5
>60 -- 8.5 12.7
Average Trips per Household Versus Income and Car Ownership

Trip Generation Example
Trips per Household per Day by Auto Ownership and Income Category
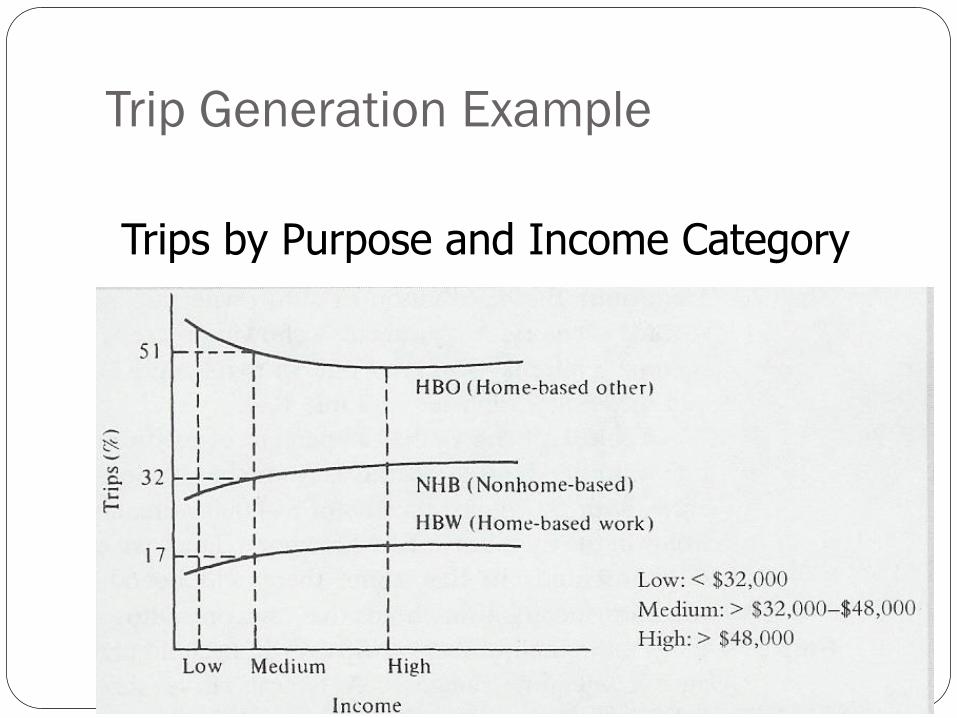
Trip Generation Example
Trips by Purpose and Income Category

Trip Generation Example
Determine the number of trips per day generated for each
trip purpose.
Number of dwelling units: 60
Average income per dwelling unit: $44,000
Income ($) Households
Low (under 32,000) 9
Medium (32,000 – 48,000) 40
High (over 48,000) 51

Trip Generation Example
Income Cars / Household
0 1 2 +
Low 54 42 4
Medium 4 58 38
High 2 30 68
Percentage of Households in Each Income Category Versus Auto Ownership

Trip Generation Example
Income Autos / Household
0 1 2 +
Low 1 6 7
Medium 2 8 13
High 3 11 15
Number of Trips per Household per Day

Trip Generation Example
Pgh = number of trips per day generated by householders with income level g and auto ownership h
HH = number of households
Ig = Percentage of households with income level g
Agh = Percentage of household in income level g with h autos per household
(PH)gh = Number of trips per day produced in household at income level g and auto ownership h
Pgh=HH X Ig X Agh X (PH)gh

Trip Generation Example
Income, # of Autos Trips Total by Group
L, 0 3
19 L, 1 14
L, 2+ 2
M, 0 2
232 M, 1 111
M, 2+ 119
H, 0 2
415 H, 1 101
H, 2+ 312
Number of Trips per Day Generated

Trip Generation
Rates Based on Activity (Attraction Rates)
Attractions per
Household
Attractions per
Non-Retail Employee
Attractions per Downtown
Retail Employee
Attractions per Other
Retail Employee
HBW -- 1.7 1.7 1.7
HBO 1.0 2.0 5.0 10.0
NHB 1.0 1.0 3.0 5.0
Trip Attraction Example
Employed at a downtown commercial center are 220 retail
and 650 non-retail workers. Determine the number of trips
per day attracted to this zone.

Process by which trips generated in one
zone are allocated to other zones
Trip Distribution

Basic Methods
Gravity Models
Growth Factor
Trip Distribution

Trip Distribution

A study area consist
of three zones.
Assume Kij is the
same for all zones.
Trip Distribution Example
Trip Productions and Attractions
Zone 1 2 3 Total
Productions 140 330 280 750
Attractions 300 270 180 750
Travel Time Between Zones
Zone 1 2 3
1 5 2 3
2 2 6 6
3 3 6 5

Trip Distribution Example
Time (min) F 1 82 2 52 3 50 4 41 5 39 6 26 7 20 8 13
Travel Time Versus Friction Factor

Trip Distribution Example
Zone 1 2 3 P
1 47 57 36 140
2 188 85 57 330
3 144 68 68 280
Computed A 379 210 161 750
Given A 300 270 180 750
Zone to Zone Trips: First Iteration

Trip Distribution Example
Ajk = Adjusted attraction factor for zone j, iteration k
Cjk = Actual attraction total for zone j, iteration k
Aj = Desired attraction total for attraction zone j
Trip Distribution Example
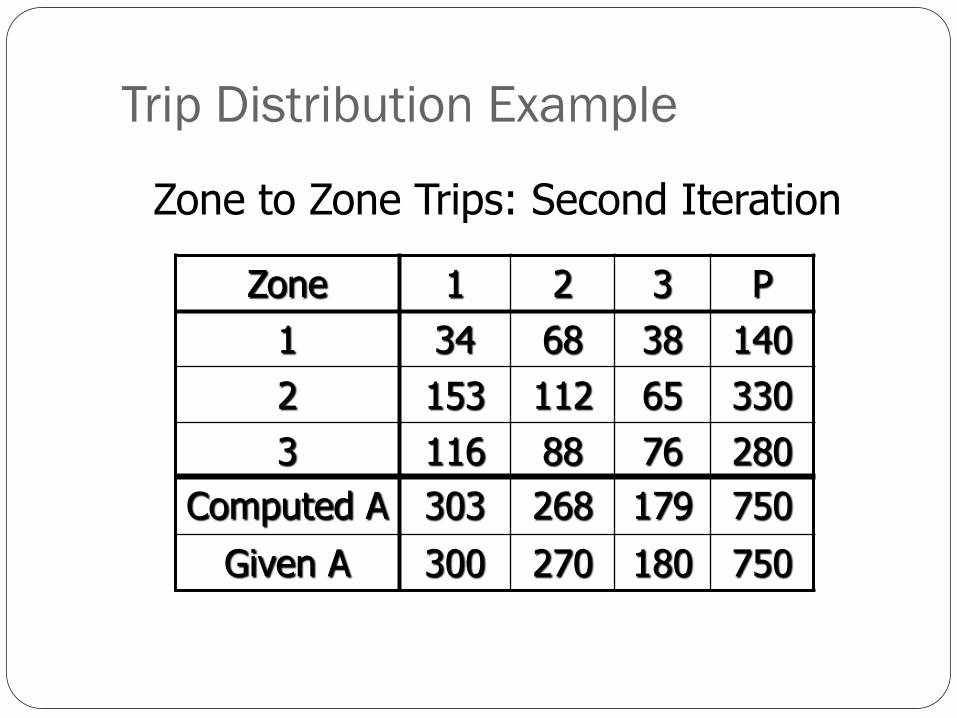
Zone 1 2 3 P
1 34 68 38 140
2 153 112 65 330
3 116 88 76 280
Computed A 303 268 179 750
Given A 300 270 180 750
Zone to Zone Trips: Second Iteration

Trip Distribution Growth Factor Model
Tij = number of trips estimated from zone i to zone j ti = present trip generation in zone i Gx = growth factor of zone x Ti = tiGi = future trip generation in zone i tix = number of trips between zone i and other zones x tij = present trips between zone i and zones j Gj = growth factor of zone j

A study area consists of four zones. The number of trips
between each zone and growth factor for 5 years is shown.
Determine the number of trips between each zone for future
conditions.
Trip Distribution Example
Zone Present Trip Generation (trips/day)
Growth Factor
Trip Generation in 5 years
A 600 1.2 720
B 700 1.1 770
C 700 1.4 980
D 400 1.3 520

Trip Distribution Example
Zone A B C D
A -- 400 100 100
B 400 -- 300 --
C 100 300 -- 300
D 100 -- 300 --
Total 600 700 700 400
Present Trips Between Zones

Trip Distribution Example
Zone A B C D Estimated Total Trip Generation
Actual Trip Generation
A -- 428 141 124 693 720
B 428 -- 372 -- 800 770
C 141 372 -- 430 943 980
D 124 -- 430 -- 554 520
Totals 693 800 943 554
First Estimate of Trips Between Zones

Process to determine the number (or percentage) of trips
between zones that are made by various modes (auto,
carpool, transit, bike/walk)
Mode Choice

Mode Choice

Determine the number of transit trips per day in a zone
which has 5000 people living on 50 acres. The auto
ownership is 40% with zero autos per household and 60%
with one auto per household.
Mode Choice Example

Process to determine the actual routes that travelers will use
Traffic Assignment

Basic Methods
Diversion Curves
Minimum Time Path
Minimum Time Path with Capacity Restraint
Traffic Assignment

Traffic Assignment
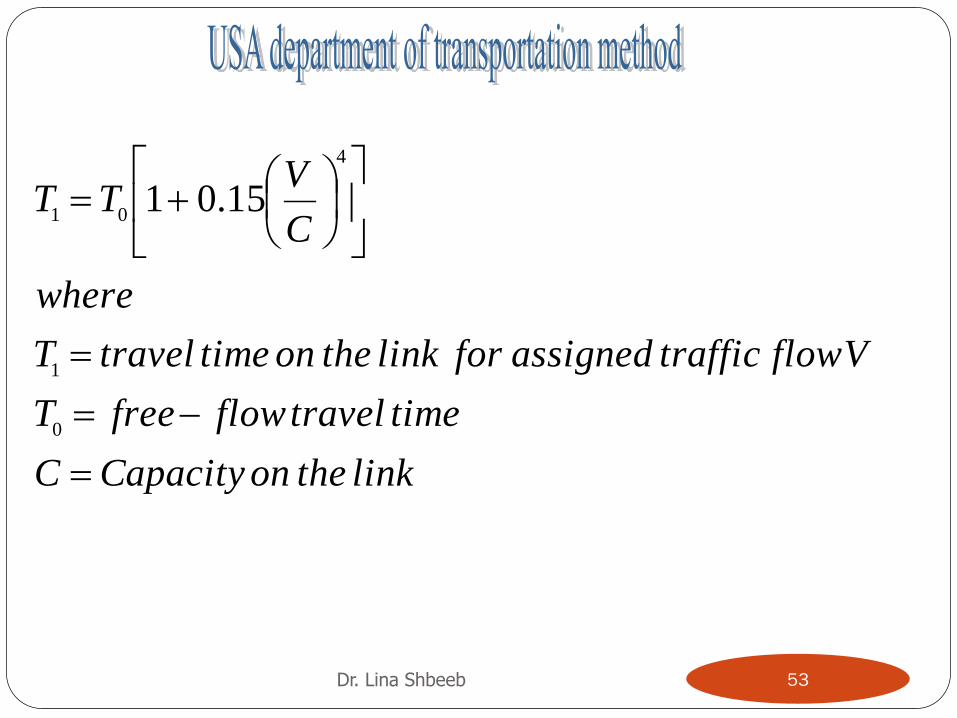
Dr. Lina Shbeeb 53
linktheonCapacityC
timetravelflowfreeT
VflowtrafficassignedforlinktheontimetravelT
where
C
VTT
0
1
4
0115.01


