1 Title: Should we build more large dams? The actual costs of hydropower megaproject development Authors: Atif Ansar 1,2, *, Bent Flyvbjerg 1 , Alexander Budzier 1 , Daniel Lunn 3 Affiliations: 1 Saïd Business School, University of Oxford, OX1 1HP, UK. 2 Blavatnik School of Government, University of Oxford, OX1 4JJ, UK. 3 Department of Statistics, University of Oxford, OX1 3GT, UK. * To whom correspondence should be addressed. E-mail: [email protected]Tel: +44 (0) 1865 616690 Full reference: Ansar, Atif, Bent Flyvbjerg, Alexander Budzier, and Daniel Lunn, 2014, "Should We Build More Large Dams? The Actual Costs of Hy- dropower Megaproject Development," Energy Policy, March, pp. 1-14, DOI: 10.1016/j.enpol.2013.10.069, URL: http://bit.ly/1ekyL7Q. Abstract: A brisk building boom of hydropower mega-dams is underway from China to Brazil. Whether benefits of new dams will outweigh costs re- mains unresolved despite contentious debates. We investigate this question with the “outside view” or “reference class forecasting” based on literature on decision-making under uncertainty in psychology. We find overwhelm- ing evidence that budgets are systematically biased below actual costs of large hydropower dams—excluding inflation, substantial debt servicing, en- vironmental, and social costs. Using the largest and most reliable reference data of its kind and multilevel statistical techniques applied to large dams for the first time, we were successful in fitting parsimonious models to pre- dict cost and schedule overruns. The outside view suggests that in most
Transcript
1
Title: Should we build more large dams? The actual costs of hydropower megaproject development
Authors: Atif Ansar1,2,*, Bent Flyvbjerg1, Alexander Budzier1, Daniel Lunn3 Affiliations: 1Saïd Business School, University of Oxford, OX1 1HP, UK. 2Blavatnik School of Government, University of Oxford, OX1 4JJ, UK. 3Department of Statistics, University of Oxford, OX1 3GT, UK. * To whom correspondence should be addressed. E-mail: [email protected] Tel: +44 (0) 1865 616690
Full reference: Ansar, Atif, Bent Flyvbjerg, Alexander Budzier, and Daniel Lunn, 2014, "Should We Build More Large Dams? The Actual Costs of Hy-dropower Megaproject Development," Energy Policy, March, pp. 1-14, DOI: 10.1016/j.enpol.2013.10.069, URL: http://bit.ly/1ekyL7Q.
Abstract: A brisk building boom of hydropower mega-dams is underway
from China to Brazil. Whether benefits of new dams will outweigh costs re-
mains unresolved despite contentious debates. We investigate this question
with the “outside view” or “reference class forecasting” based on literature
on decision-making under uncertainty in psychology. We find overwhelm-
ing evidence that budgets are systematically biased below actual costs of
large hydropower dams—excluding inflation, substantial debt servicing, en-
vironmental, and social costs. Using the largest and most reliable reference
data of its kind and multilevel statistical techniques applied to large dams
for the first time, we were successful in fitting parsimonious models to pre-
dict cost and schedule overruns. The outside view suggests that in most
2
countries large hydropower dams will be too costly in absolute terms and
take too long to build to deliver a positive risk-adjusted return unless suita-
ble risk management measures outlined in this paper can be affordably pro-
vided. Policymakers, particularly in developing countries, are advised to
prefer agile energy alternatives that can be built over shorter time horizons
to energy megaprojects.
Keywords: Large hydropower dams; Schedule & cost estimates; Cost-benefit forecasting; Reference class forecasting; Outside view
3
Main Text:
1. Large hydropower dam controversy
The 21st Century faces significant energy challenges on a global scale. Popu-
lation and economic growth underpin increasing demand for energy from
electricity to transport fuels. Social objectives of poverty alleviation, adapta-
tion and mitigation of climate change, and energy security present policy
makers and business leaders with difficult decisions and critical trade-offs in
implementing sound energy policies. Demand for electricity is, for example,
slated to almost double between 2010 and 2035 requiring global electricity
capacity to increase from 5.2 terawatt (TW) to 9.3 TW over the same period
(IEA, 2011). Currently, the de facto strategic response to these big energy
challenges is “big solutions” such as large hydropower dams. Are such big
solutions in general and large hydropower dams in particular the most effec-
tive strategy, on a risk-adjusted basis, to resolve global energy challenges?
Might more numerous small interventions be more prudent from the per-
spective of risk management and maximizing net present value even when
they entail somewhat higher per unit cost of production?
Proponents of large dams envisage multiple benefits. A big step-up in hy-
dropower capacity along with a long and varied list of corollary benefits: re-
ducing fossil fuel consumption, flood control, irrigation, urban water supply,
inland water transport, technological progress, and job creation (Billington
and Jackson, 2006; ICOLD, 2010). Inspired by the promise of prosperity,
there is a robust pipeline of new mega-dams being developed globally after a
4
two-decade lull. The Belo Monte dam in Brazil, the Diamer-Bhasha in Paki-
stan, Jinsha river dams in China, Myitsone dam in Myanmar, or the Gilgel
Gibe III dam in Ethiopia, all in various stages of development, are unprece-
dented in scale.
Large dams are, however, controversial because they exert substantial finan-
cial costs (World Bank, 1996; World Commission on Dams, 2000). Beyond the
financial calculus, large dams have profound environmental (McCully, 2001;
Scudder, 2005; Stone, 2011), ecological (Nilsson et al., 2005; Ziv et al., 2012),
and social (Bakker, 1999; Duflo and Pande, 2007; Richter et al., 2010; Sovacool
and Bulan, 2011) impacts. Stone (2011, p. 817) reports in Science that the
Three Gorges dam in China is an “environmental bane” that will cost over
USD 26.45 billion over the next 10-years in environmental “mitigation ef-
forts”. Despite their outsized financial and environmental costs, the pur-
ported benefits of large hydropower prove uncertain. For example, the
World Commission of Dams (2000, p. 30) reported that for large hydropower
dams “average [hydropower] generation in the first year of commercial op-
eration is 80% of the targeted value”—a trend of which the recently complet-
ed Bakun hydroelectric project in Borneo is an alarming example (Sovacool
and Bulan, 2011). Similarly, Duflo and Pande (2007) find adverse distribu-
tional impacts of large irrigation dams in India. Winners downstream come
with losers upstream yielding a more modest, if any, net economic benefit.
The scale of contemporary dams is so vast that even for a large economy
such as China’s the negative economic ramifications “could likely hinder the
5
economic viability of the country as a whole” if the risks inherent to these
projects are not well managed (Salazar, 2000). Similarly, Merrow et al. (1988,
pp. 2-3) warn that “such enormous sums of money ride on the success of
megaprojects [such as large dams] that company balance sheets and even
government balance-of-payments accounts can be affected for years by the
outcomes”. Such warnings are not idle alarmism. There is mounting evi-
dence in civil society, academic research, and institutional accounts that
large dams have strikingly poor performance records in terms of economy,
social and environmental impact, and public support (McCully, 2001; Scud-
der, 2005; Singh, 2002; Sovacool and Bulan, 2011; WCD, 2000). There are ac-
rimonious, and as yet inconclusive, debates in scientific literature and civil
society about whether large dams are a boon or a curse. Should we build
more large hydropower dams? How confident can planners be that a large
bet on a large dam will pay-off handsomely?
We investigate these questions with the “outside view” or “reference class
forecasting” based on the literature on decision-making under uncertainty
that won Princeton psychologist Daniel Kahneman the Nobel Prize in eco-
nomics in 2002 (Kahneman and Tversky, 1979a, 1979b; Kahneman, 1994) ex-
tended and applied by Bent Flyvbjerg and colleagues to infrastructure pro-
jects (Flyvbjerg et al., 2003; Flyvbjerg, 2009). We present statistical and com-
parative evidence from the largest reference class of actual costs of large hy-
dropower dam projects (hereafter large dams unless stated otherwise). We
find that even before accounting for negative impacts on human society and
environment, the actual construction costs of large dams are too high to yield
6
a positive return. Large dams also take inordinately long periods of time to
build, making them ineffective in resolving urgent energy crises. Our evi-
dence pertains primarily to large dams and the results cannot be applied ei-
ther to smaller dams or other large energy solutions such as nuclear power
without first conducting a separate “reference class” for other type of power
generation technologies. Our findings, however, point towards the general-
izable policy proposition that policymakers should prefer energy alternatives
that require less upfront outlays and that can be built very quickly.
There is no doubt that harnessing and managing the power of water is criti-
cal for economies but large dams are not the way to do so unless suitable risk
management measures outlined in this paper can be affordably provided.
Building on literature in decision making under uncertainty in management,
psychology, and planning research, this paper further provides public agen-
cies (e.g. national planning and finance ministries, power and water authori-
ties), private entrepreneurs, investors, and civil society a framework to test
the reliability of ex ante estimates for construction costs and schedules of
power generation alternatives. An impartial and rigorous application of the
reference class forecasting methods proposed here can improve the selection
and implementation of new investments.
2. Delusion and deception in large hydropower dam planning?
Our approach to address the debates about whether or not to build dams is
to incorporate an evidence-based perspective that reflects how decisions
among alternative options are actually made and on what basis. Theoretical
7
and empirical literature on decision-making under uncertainty proposes two
explanations—psychological delusion and political deception—that suggest
decision-makers’ forecasts, and hence ex ante judgments, are often adversely
biased (Tversky and Kahneman, 1974; Kahneman and Lovallo, 1993;
Flyvbjerg, 2003; Lovallo and Kahneman, 2003; Kahneman, 2011).
First, experts (e.g., statisticians, engineers, or economists) and laypersons are
systematically and predictably too optimistic about the time, costs, and bene-
fits of a decision. This “planning fallacy” (Kahneman and Tversky, 1979b;
Buehler et al., 1994) stems from actors taking an “inside view” focusing on
the constituents of the specific planned action rather than on the outcomes of
similar actions already completed (Kahneman and Lovallo, 1993). Thus, for
example, the estimated costs put forward by cities competing to hold the
Olympic Games have consistently been underestimated yet every four years
these errors are repeated. Biases, such as overconfidence or overreliance on
heuristics (rules-of-thumb) underpin these errors.
Second, optimistic judgments are often exacerbated by deception, i.e. strate-
gic misrepresentation by project promoters (Wachs, 1989; Pickrell, 1992;
Flyvbjerg et al., 2002, 2005, 2009). Recent literature on infrastructure delivery
finds strong evidence that misplaced political incentives and agency prob-
lems lead to flawed decision-making (see Flyvbjerg et al., 2009). Flyvbjerg et
al. (2009, p. 180) further discuss that delusion and deception are complemen-
tary rather than alternative explanations for why megaprojects typically face
adverse outcomes. It is, however, “difficult to disentangle” delusion from
8
deception in practice. Using quasi-experimental evidence from China, Ansar
et al. (2013) suggest that while better incentive alignment can help lower the
frequency and to a lesser extent the magnitude of biases, it does not entirely
cure biases.
Be it delusion or deception, is decision-making in large hydropower dams
systematically biased by errors in cost, schedule, and benefit forecasts? What
is the risk that costs might outweigh benefits for a proposed dam? While the
future is unknowable, uncertain outcomes of large investments can still be
empirically investigated using “reference class forecasting” (RCF) or the
“outside view” techniques (Kahneman and Lovallo, 1993; Flyvbjerg, 2006,
2008) . To take an outside view on the outcome of an action (or event) is to
place it in the statistical distribution of the outcomes of comparable, already-
concluded, actions (or events). The outside view has three advantages: First,
it is evidence-based and requires no restrictive assumptions. Second, it helps
to test and fit models to explain why the outcomes of a reference class of past
actions follow the observed distribution. Third, it allows to predict the uncer-
tain outcomes of a planned action by comparing it with the distributional in-
formation of the relevant reference class. The theoretical foundations of the
outside view were first described by Kahneman and Tversky (1979b) and
later by Kahneman and Lovallo (1993) and Lovallo and Kahneman (2003) as
a means to detect and cure biases in human judgment. The methodology and
data needed for employing the outside view, or reference class forecasting,
in practice were developed by Flyvbjerg (2006, 2008) in collaboration with
first implemented in practice by Flyvbjerg and COWI, 2004).
9
2.1 Three steps to the outside view
The outside view, applied to large dams for the first time here, involves three
steps: i) identify a reference class; ii) establish an empirical distribution for
the selected reference class of the parameter that is being forecasted; iii)
compare the specific case with the reference class distribution. We take a fur-
ther innovatory step of fitting multivariate multilevel models to the reference
data to predict future outcomes. Our technique is an important improvement
in the methodology of the outside view that can be generalized and applied
to other large-scale and long-term decisions under uncertainty. With de-
biased forecasts managers can make statistically grounded, rather than op-
timistic, judgments (Dawes et al., 1989; Buehler et al., 1994; Gilovich et al.,
2002).
The outside view—as implemented by Flyvbjerg (2006, 2008)—is not without
its limitations (see Sovacool and Cooper, 2013 for a discussion specifically
about energy megaprojects). For example, RCF focuses on generic risk inher-
ent in a reference class rather than specific project-level risk. We rectify
against this limitation by fitting regression models in addition to using tradi-
tional RCF methods in the result section below. Sovacool and Cooper (2013,
p. 63) further suggest that RCF may not provide sufficiently accurate indica-
tion of the risks of rare megaprojects the likes of which have never been built
before. Such “out of the sample” problems are well noted in probability the-
ory. They do not, however, deny the fundamental usefulness of RCF. If any-
10
thing our results err towards conservative estimates of actual cost overruns
and risks experienced by large dams.
2.2 Measures and data
Following literature on the planning fallacy (op. cit.), the parameters central
to our investigation and multilevel regression analysis is the inaccuracy be-
tween managers’ forecasts and actual outcomes related to construction costs,
or the cost overrun, and implementation schedule, or schedule slippage. Fol-
lowing convention, cost overrun is the actual outturn costs expressed as a
ratio of estimated costs1; cost overruns can also be thought as the underesti-
mation of actual costs (Bacon and Besant-Jones, 1998; Flyvbjerg et al., 2002).
Schedule slippage, called schedule overrun, is the ratio of the actual project
implementation duration to the estimated project implementation. The start
of the implementation period is taken to be the date of project approval by
the main financiers and the key decision makers, and the end is the date of
full commercial operation.
Inaccuracies between actual outcomes versus planned forecasts are useful
proxies for the underlying risk factors that led to the inaccuracies. For exam-
ple, cost overruns reduce the attractiveness of an investment and if they be-
come large the fundamental economic viability becomes questionable. Bacon
and Besant-Jones (1998, p. 317) offer an astute summary:
The economic impact of a construction cost overrun is the possible loss of the economic justification for the project. A cost overrun can also be critical to policies for pricing electricity on the basis of economic costs, because such overruns would lead to underpric-
11
ing. The financial impact of a cost overrun is the strain on the power utility and on national financing capacity in terms of for-eign borrowings and domestic credit.
Similarly, schedule slippages delay much needed benefits, expose projects to
risks such as an increase in finance charges, or creeping inflation, which may
all require upward revision in the nominal electricity tariffs. Financial costs
and implementation schedules, because of their tangibility, are also good
proxies for non-pecuniary impacts such as those on the environment or soci-
ety. Projects with a poor cost and schedule performance are also likely to
have a poor environmental and social track record. A greater magnitude of
cost and schedule overruns is thus a robust indicator of project failure
(Flyvbjerg et a., 2003).
In taking the outside view on the cost and schedule under/overruns, our
first step was to establish a valid and reliable reference class of previously
built hydropower dams as discussed above. The suggested practice is that a
reference class ought to be broad and large enough to be statistically mean-
ingful but narrow enough to be comparable (Kahneman and Tversky, 1979b;
Kahneman and Lovallo, 1993; Flyvbjerg, 2006). International standard define
dams with a wall height > 15 m as large. The total global population of large
dams with a wall height > 15 m is 45,000. There are 300 dams in the world of
monumental scale; these “major dams” meet one of three criteria on height
(>150 m), dam volume (>15 million m3), or reservoir storage (>25 km3)
(Nilsson et al., 2005).
12
From this population of large dams, our reference class drew a representa-
tive sample of 245 dams (including 26 major dams) built between 1934 to
2007 on five continents in 65 different countries—the largest and most relia-
ble data of its kind. The portfolio is worth USD 353 billion. All large dams for
which valid and reliable cost and schedule data could be found were includ-
ed in the sample. Of the 245 large dams, 186 were hydropower projects (in-
cluding 25 major dams) and the remaining 59 were irrigation, flood control,
or water supply dams. While we are primarily interested in the performance
of large dam projects with a hydropower component, we also included non-
hydropower dam projects in our reference class to test whether project types
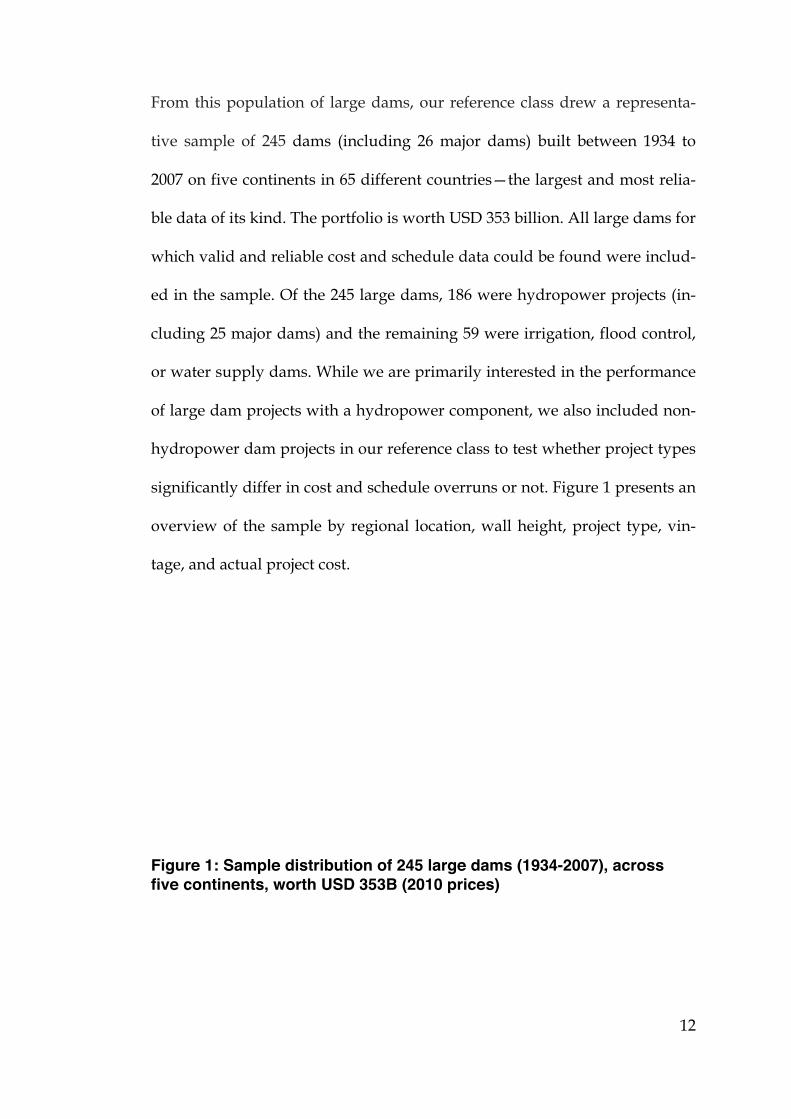
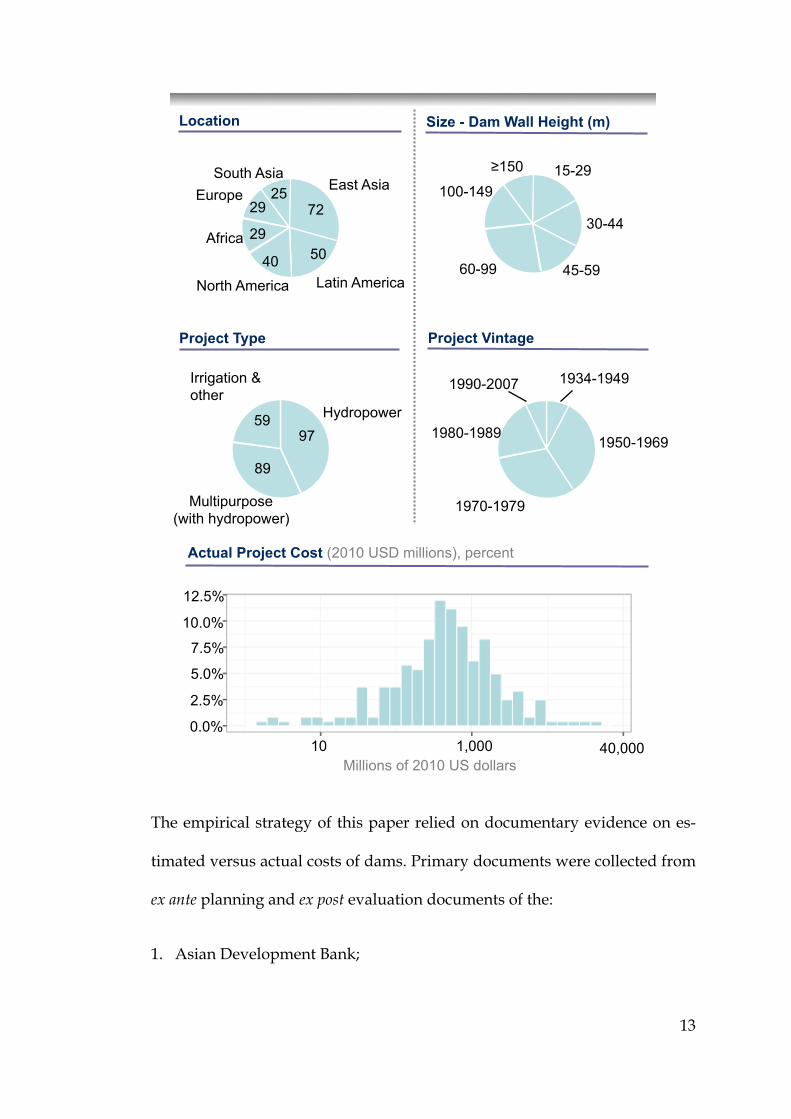
significantly differ in cost and schedule overruns or not. Figure 1 presents an
overview of the sample by regional location, wall height, project type, vin-
tage, and actual project cost.
Figure 1: Sample distribution of 245 large dams (1934-2007), across five continents, worth USD 353B (2010 prices)
13
The empirical strategy of this paper relied on documentary evidence on es-
timated versus actual costs of dams. Primary documents were collected from
ex ante planning and ex post evaluation documents of the:
1. Asian Development Bank;
Actual Project Cost (2010 USD millions), percent
Location
East Asia
72
Africa 50 40
29
Europe 29
25 South Asia
North America Latin America
Size - Dam Wall Height (m)
15-29
30-44
45-59 60-99
≥150
100-149
61
Project Type
Irrigation & other
97
89
Project Vintage
Hydropower
Multipurpose (with hydropower)
1980-1989
1990-2007 1934-1949
1950-1969
1970-1979
59
7.5%
10.0%
12.5%
40,000 0.0%
2.5%
5.0%
1,000 10 Millions of 2010 US dollars
14
2. World Bank, also see World Bank (1996) and Bacon and Besant-Jones
(1998);
3. World Commission of Dams (WCD), also see WCD (2000)2;
4. U.S. Corps of Engineers;
5. Tennessee Valley Authority;
6. U.S. Bureau of Reclamation, also see Hufschmidt and Gerin (1970)3 and
Merewitz (1973) on the U.S. water-resource construction agencies.
The procedures applied to the cost and schedule data here are consistent
with the gold standard applied in the field—more detailed methodological
considerations can be found in Flyvbjerg et al. (2002); Federal Transit Ad-
ministration (2003); Pickrell (1989, 1992); World Bank (1996) and Bacon and
Besant-Jones (1998) with which our data are consistent. All costs are total
project costs comprising the following elements: right-of-way acquisition
and resettlement; design engineering and project management services; con-
struction of all civil works and facilities; equipment purchases. Actual out-
turn costs are defined as real, accounted construction costs determined at the
time of project completion. Estimated costs are defined as budgeted, or fore-
casted, construction costs at the time of decision to build. The year of the
date of the decision to build a project is the base year of prices in which all
estimated and actual constant costs have been expressed in real (i.e. with the
effects of inflation removed) local currency terms of the country in which the
project is located. We exclude from our calculations debt payments, any ex
15
post environmental remedial works, and opportunity cost of submerging
land to form reservoirs. This makes comparison of estimated and actual costs
of a specific project a like-for-like comparison.
2.3. Analyses
We investigated the magnitude and frequency of cost and schedule forecast
(in)accuracies with a combination of simple statistical (parametric and non-
parametric) tests and by fitting more sophisticated multilevel regression
models sometimes termed Hierarchical Linear Models (HLM).
Multilevel or hierarchically structured data are the norm in the social, medi-
cal, or biological sciences. Rasbash et al. (2009, p. 1) explain: “For example,
school education provides a clear case of a system in which individuals are
subject to the influences of grouping. Pupils or students learn in classes; clas-
ses are taught within schools; and schools may be administered within local
authorities or school boards. The units in such a system lie at four different
levels of a hierarchy. A typical multilevel model of this system would assign
pupils to level 1, classes to level 2, schools to level 3 and authorities or
boards to level 4. Units at one level are recognized as being grouped, or nest-
ed, within units at the next higher level. Such a hierarchy is often described
in terms of clusters of level 1 units within each level 2 unit etc. and the term
clustered population is used.” Important for a hierarchical linear model is
that the dependent variable is at the lowest level of the nested structure.
Multilevel models are necessary for research designs where data for observa-
tions are organized at more than one level (i.e., nested data) (Gelman and
16
Hill, 2007). Failing to use multilevel models in such instances would result in
spurious results (Rasbach et al., 2009).
With respect to our data on dams, projects are nested in the countries of their
domicile. Like test scores of pupils from the same school tend exhibit within-
school correlation, similarly outcomes of dam projects may exhibit within-
country correlation that needs to be properly modeled using a multilevel
model. We took this into account by modeling country as a random effect in
a mixed effects multilevel model. The models were made parsimonious by
using stepwise variable selection.
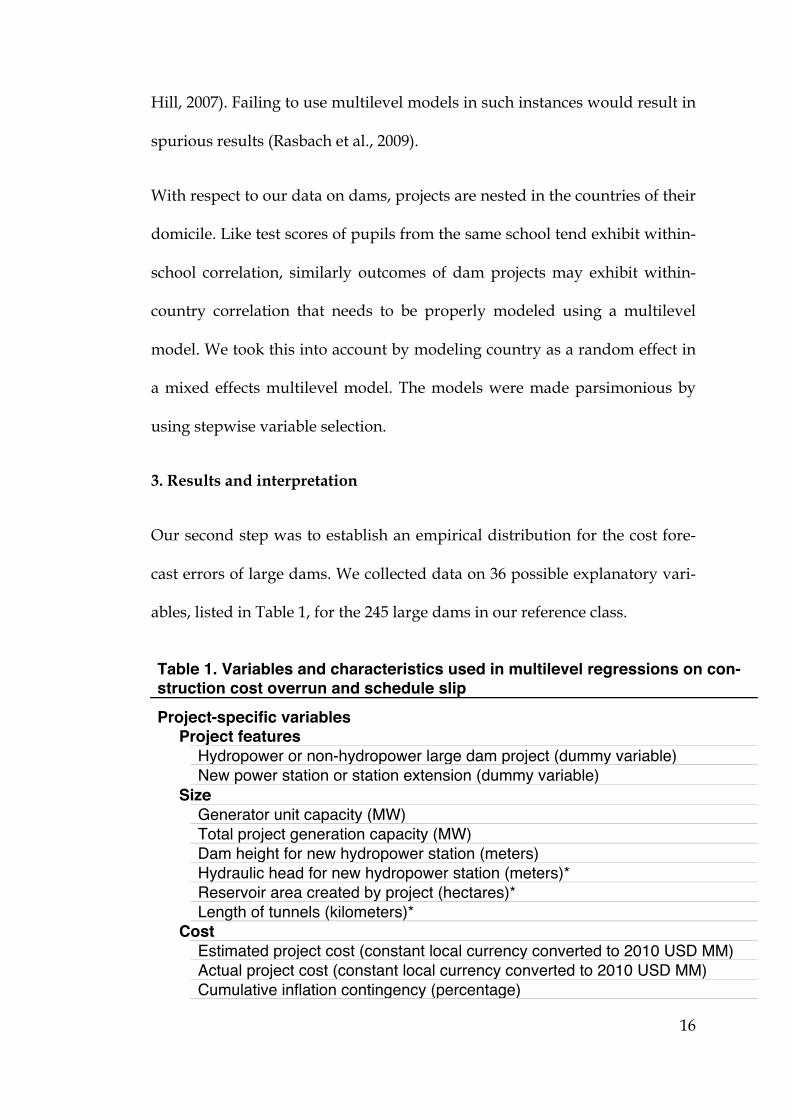
3. Results and interpretation
Our second step was to establish an empirical distribution for the cost fore-
cast errors of large dams. We collected data on 36 possible explanatory vari-
ables, listed in Table 1, for the 245 large dams in our reference class.
Table 1. Variables and characteristics used in multilevel regressions on con-struction cost overrun and schedule slip
Project-specific variables
Project features
Hydropower or non-hydropower large dam project (dummy variable)
New power station or station extension (dummy variable)
Size
Generator unit capacity (MW)
Total project generation capacity (MW)
Dam height for new hydropower station (meters)
Hydraulic head for new hydropower station (meters)*
Reservoir area created by project (hectares)*
Length of tunnels (kilometers)*
Cost
Estimated project cost (constant local currency converted to 2010 USD MM)
Actual project cost (constant local currency converted to 2010 USD MM)
Cumulative inflation contingency (percentage)
17
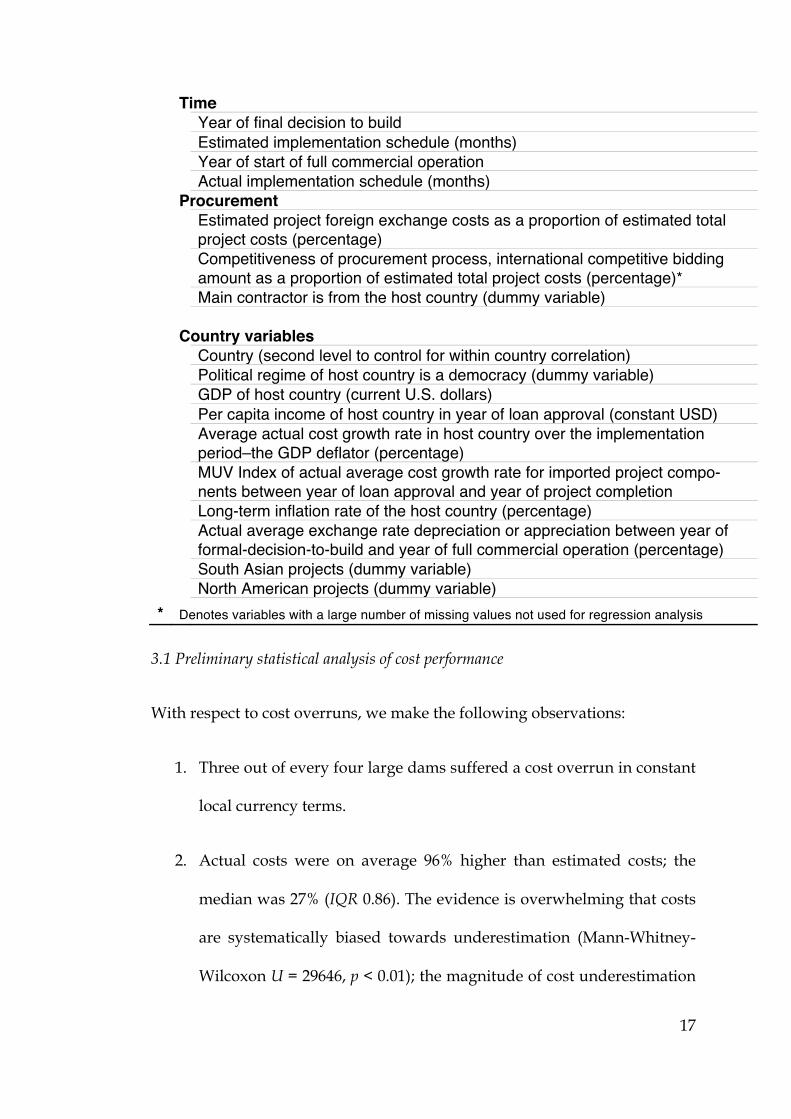
Time
Year of final decision to build
Estimated implementation schedule (months)
Year of start of full commercial operation
Actual implementation schedule (months)
Procurement
Estimated project foreign exchange costs as a proportion of estimated total project costs (percentage)
Competitiveness of procurement process, international competitive bidding amount as a proportion of estimated total project costs (percentage)*
Main contractor is from the host country (dummy variable)
Country variables
Country (second level to control for within country correlation)
Political regime of host country is a democracy (dummy variable)
GDP of host country (current U.S. dollars)
Per capita income of host country in year of loan approval (constant USD)
Average actual cost growth rate in host country over the implementation period–the GDP deflator (percentage)
MUV Index of actual average cost growth rate for imported project compo-nents between year of loan approval and year of project completion
Long-term inflation rate of the host country (percentage)
Actual average exchange rate depreciation or appreciation between year of formal-decision-to-build and year of full commercial operation (percentage)
South Asian projects (dummy variable)
North American projects (dummy variable)
* Denotes variables with a large number of missing values not used for regression analysis
3.1 Preliminary statistical analysis of cost performance
With respect to cost overruns, we make the following observations:
1. Three out of every four large dams suffered a cost overrun in constant
local currency terms.
2. Actual costs were on average 96% higher than estimated costs; the
median was 27% (IQR 0.86). The evidence is overwhelming that costs
are systematically biased towards underestimation (Mann-Whitney-
Wilcoxon U = 29646, p < 0.01); the magnitude of cost underestimation
18
(i.e. cost overrun) is larger than the error of cost overestimation (p <
0.01). The skew is towards adverse outcomes (i.e. going over budget).
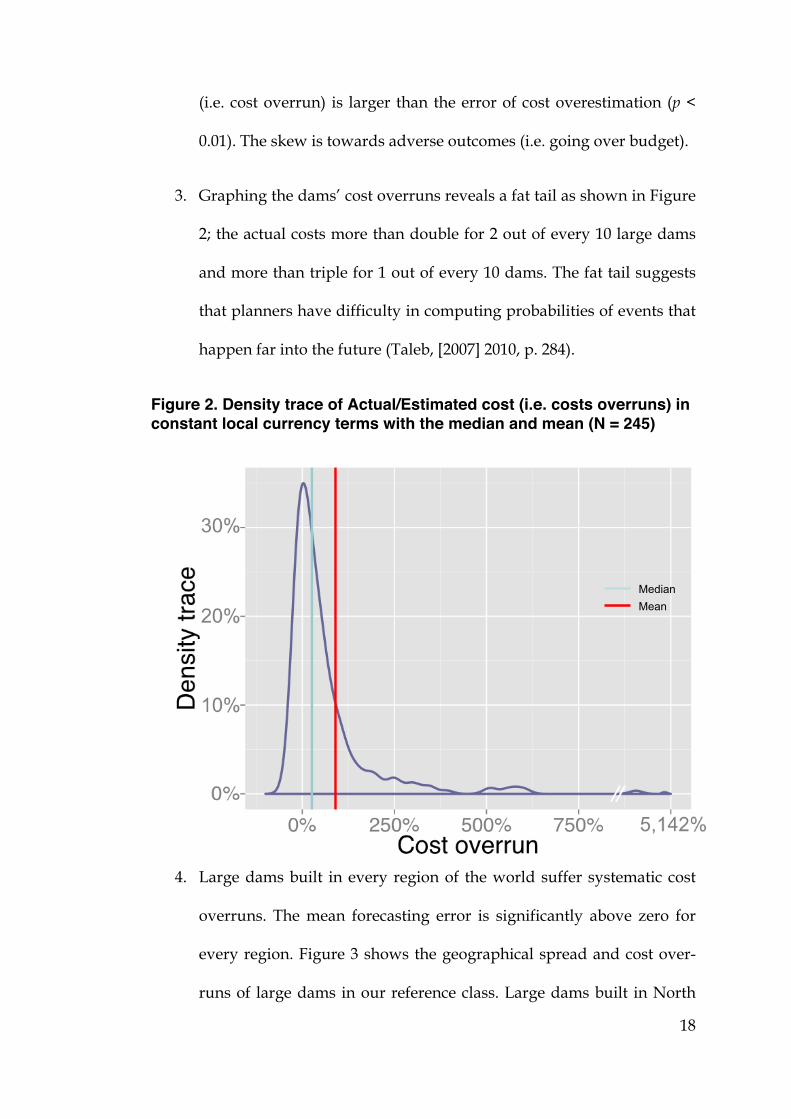
3. Graphing the dams’ cost overruns reveals a fat tail as shown in Figure
2; the actual costs more than double for 2 out of every 10 large dams
and more than triple for 1 out of every 10 dams. The fat tail suggests
that planners have difficulty in computing probabilities of events that
happen far into the future (Taleb, [2007] 2010, p. 284).
Figure 2. Density trace of Actual/Estimated cost (i.e. costs overruns) in constant local currency terms with the median and mean (N = 245)
4. Large dams built in every region of the world suffer systematic cost
overruns. The mean forecasting error is significantly above zero for
every region. Figure 3 shows the geographical spread and cost over-
runs of large dams in our reference class. Large dams built in North
Median Mean
19
America (n = 40) have considerably lower cost overrun (M = 11%)
than large dams built elsewhere (M = 104%). Although after control-
ling for other covariates such as project scale in a multilevel model,
reported below, the differences among regions are not significant. We
noted, 3 out of 4 dams in our reference class had a North American
firm advising on the engineering and economic forecasts. Consistent
with anchoring theories in psychology, we conjecture that an overreli-
ance on the North American experience with large dams may bias
cost estimates downwards in rest of the world. Experts may be “an-
choring” their forecasts in familiar cases from North America and ap-
plying insufficient “adjustments” (Flyvbjerg et al., 2009; Tversky and
Kahneman, 1974), for example to adequately reflect the risk of a local
currency depreciation or the quality of local project management
teams. Instead of optimistically hoping to replicate the North Ameri-
can cost performance, policymakers elsewhere ought to consider the
global distributional information about costs of large dams.
Figure 3. Location of large dams in the sample and cost overruns by
!
0 25 50 75 100 200 500Average cost overrun (%)
20
geography
5. The typical forecasted benefit-to-cost ratio was 1.4. In other words,
planners expected the net present benefits to exceed the net present
costs by about 40%. Nearly half the dams suffered a cost overrun ratio
of 1.4 or greater breaching this threshold after which the asset can be
considered stranded—i.e. its upfront sunk costs are unlikely to be re-
covered. This is assuming, of course, that the benefits did not also fall
short of targets, even though there is strong evidence that actual bene-
fits of dams are also likely to fall short of targets (WCD, 2000; McCul-
ly, 2001; Scudder, 2005)4.
6. We tested whether forecasting errors differ by project type (e.g., hy-
dropower, irrigation, or multipurpose dam) or wall type (earthfill,
rockfill, concrete arch etc.). Pairwise comparisons of percentage mean
cost overrun and standard deviations as well as non-parametric
Mann-Whitney tests for each of the parameters show no statistically
significant differences. We conclude that irrespective of project or wall
type, the probability distribution from our broader reference class of
245 dams applies as in Figure 2.
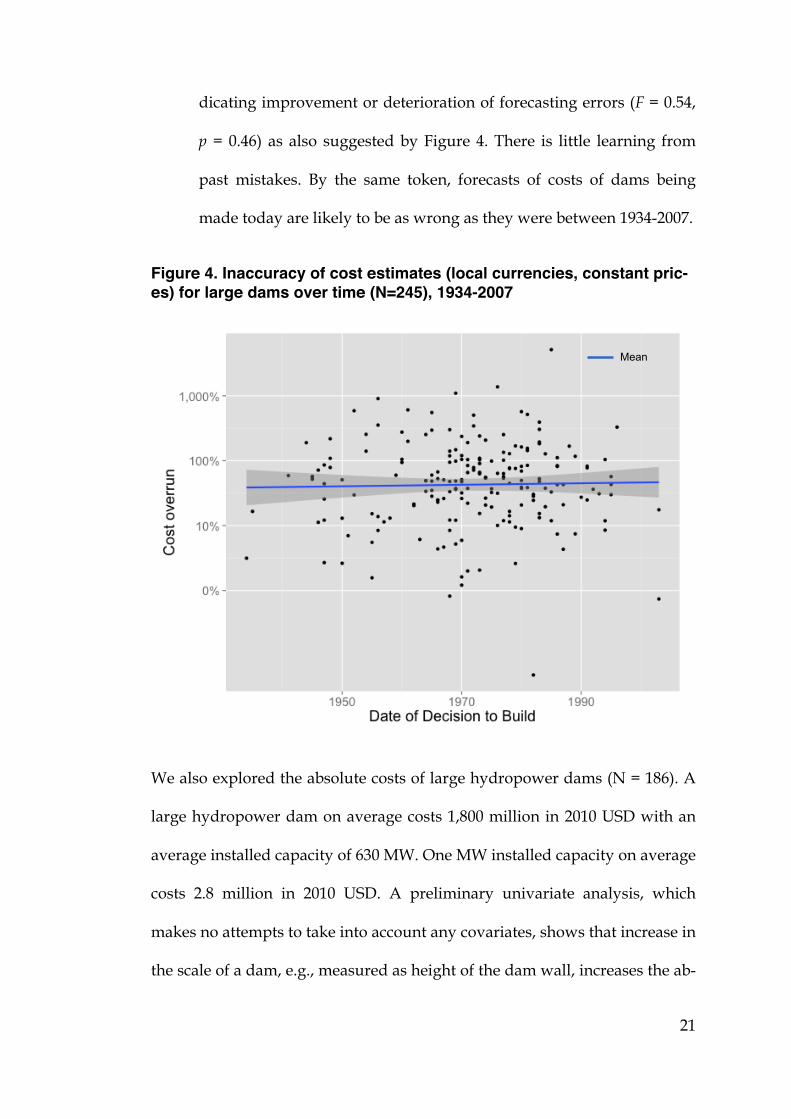
7. We analyzed whether cost estimates have become more accurate over
time. Statistical analysis suggests that irrespective of the year or dec-
ade in which a dam is built there are no significant differences in fore-
casting errors (F = 0.57, p = 0.78). Similarly, there is no linear trend in-
21
dicating improvement or deterioration of forecasting errors (F = 0.54,
p = 0.46) as also suggested by Figure 4. There is little learning from
past mistakes. By the same token, forecasts of costs of dams being
made today are likely to be as wrong as they were between 1934-2007.
Figure 4. Inaccuracy of cost estimates (local currencies, constant pric-es) for large dams over time (N=245), 1934-2007
We also explored the absolute costs of large hydropower dams (N = 186). A
large hydropower dam on average costs 1,800 million in 2010 USD with an
average installed capacity of 630 MW. One MW installed capacity on average
costs 2.8 million in 2010 USD. A preliminary univariate analysis, which
makes no attempts to take into account any covariates, shows that increase in
the scale of a dam, e.g., measured as height of the dam wall, increases the ab-
Mean
22
solute investment required exponentially, e.g. a 100m high dam wall is four
times more costly than a 50m wall (R2 = 0.27, F = 92.5, p < 0.01). An even
stronger relationship can be seen between installed capacity MW and actual
costs (R2 = 0.70, F = 461.1, p < 0.01).
Furthermore, the rate of cost overrun outliers increases with increase in dam
size either measured in installed hydropower generation (r = 0.24, p = 0.01)
or wall height (r = 0.13, p = 0.05). Since there is a significant correlation be-
tween dam height and hydropower installed capacity (r = 0.47, p < 0.01), ev-
idence suggests that larger scale in general is prone to outlying cost over-
runs. We further investigate the effects of scale on cost overruns by fitting
multilevel models (model 1 and 2) reported below.
3.2 Preliminary statistical analysis of schedule performance
Not only are large dams costly and prone to systematic and severe budget
overruns, they also take a long time to build. Large dams on average take 8.6
years. With respect to schedule slippage, we make the following observa-
tions:
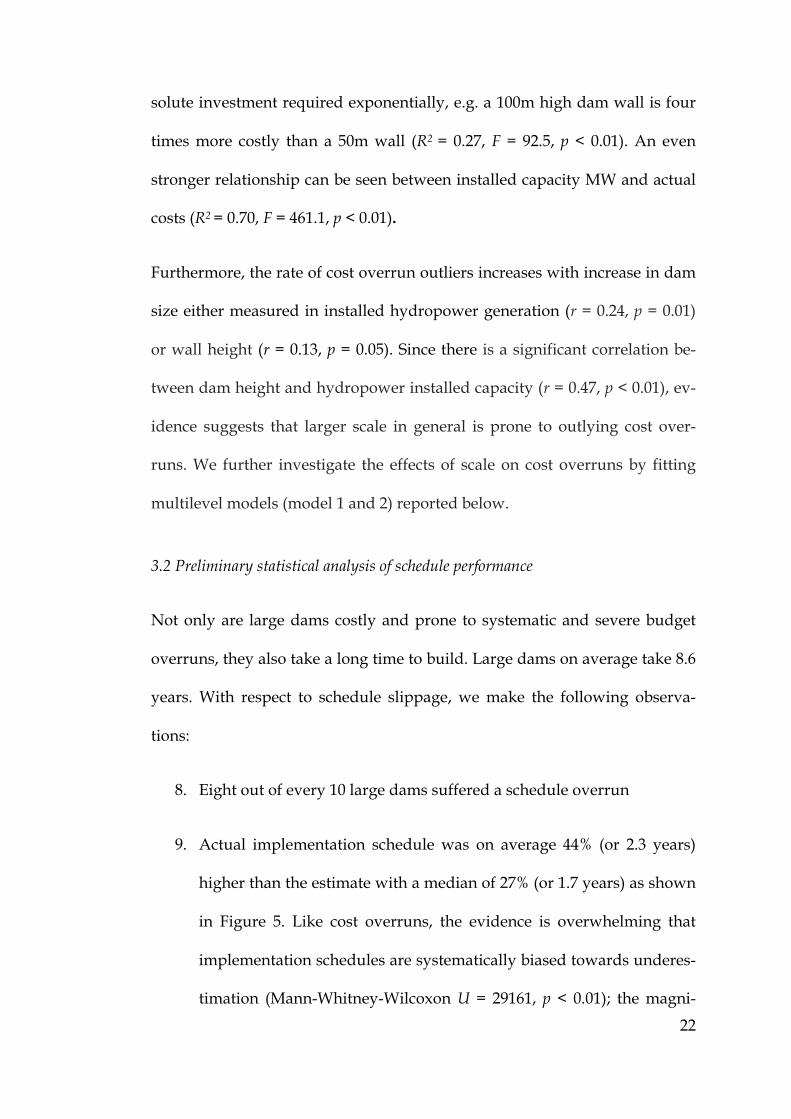
8. Eight out of every 10 large dams suffered a schedule overrun
9. Actual implementation schedule was on average 44% (or 2.3 years)
higher than the estimate with a median of 27% (or 1.7 years) as shown
in Figure 5. Like cost overruns, the evidence is overwhelming that
implementation schedules are systematically biased towards underes-
timation (Mann-Whitney-Wilcoxon U = 29161, p < 0.01); the magni-
23
tude of schedule underestimation (i.e. schedule slippage) is larger
than the error of schedule overestimation (p < 0.01).
10. Graphing the dams’ schedule overruns also reveals a fat tail as shown
in Figure 5, albeit not as fat as the tail of cost overruns. Costs are at a
higher risk of spiraling out of control than schedules.
Figure 5. Density trace of schedule slippage (N = 239) with the median and mean
11. There is less variation in schedule overruns across regions than cost
overruns. Large dams built everywhere take significantly longer than
planners forecast. North America with a 27% mean schedule overrun
is the best performer. A non-parametric comparison using a Wilcoxon
test (p = 0.01) suggests that projects in South Asia have significantly
greater schedule overruns (M = 83%) than rest of the world taken as a
Median Mean
24
whole (M = 42%). We investigate this further with a multilevel model
below (model 3).
12. There is no evidence for schedule estimates to have improved over
time.
We tested whether implementation schedules and project scale are related. A
preliminary univariate analysis, which makes no attempts to take into ac-
count any covariates, shows that increase in the scale of a dam, e.g., meas-
ured as estimated cost of construction, increases the absolute actual imple-
mentation schedule required exponentially (R2 = 0.13, F = 36.4, p < 0.01).
Large scale is intimately linked with the long-term (see model 2 below). The
actual implementation schedule, reported here, does not take into the ac-
count lengthy lead times in preparing the projects. Dams require extensive
technical and economic feasibility analysis, social and environmental impact
studies, and political negotiations. The actual implementation cycles are far
longer than the average of about 8.6 years, as shown in our data, that it takes
to build a dam. These lengthy implementation schedules schedule suggest
that the benefits of large dams (even assuming that large dam generate bene-
fits as forecasted) do not come ‘online’ quickly enough. The temporal mis-
match between when users need specific benefits and when these benefits
come online is not to be downplayed (Ansar et al., 2012). Alternative invest-
ments that can bridge needs quickly, without tremendous time lags, are
preferable to investments with a long lead-time and hence duration risk
(Luehrman, 1998; Copeland and Tufano, 2004).
25
3.3 Multilevel regression analysis of cost and schedule performance
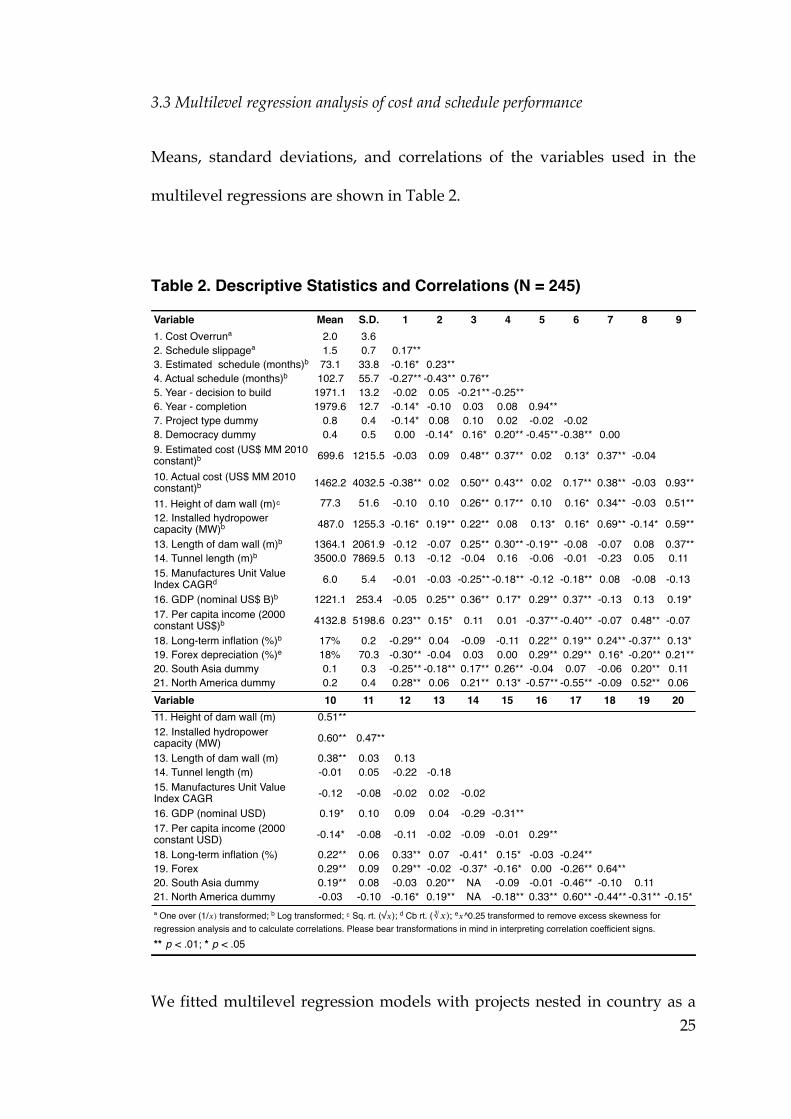
Means, standard deviations, and correlations of the variables used in the
multilevel regressions are shown in Table 2.
Table 2. Descriptive Statistics and Correlations (N = 245)
We fitted multilevel regression models with projects nested in country as a
13. Length of dam wall (m) 0.38** 0.03 0.1314. Tunnel length (m) -0.01 0.05 -0.22 -0.1815. Manufactures Unit Value Index CAGR -0.12 -0.08 -0.02 0.02 -0.02
16. GDP (nominal USD) 0.19* 0.10 0.09 0.04 -0.29 -0.31**17. Per capita income (2000 constant USD) -0.14* -0.08 -0.11 -0.02 -0.09 -0.01 0.29**
18. Long-term inflation (%) 0.22** 0.06 0.33** 0.07 -0.41* 0.15* -0.03 -0.24**19. Forex 0.29** 0.09 0.29** -0.02 -0.37* -0.16* 0.00 -0.26** 0.64**20. South Asia dummy 0.19** 0.08 -0.03 0.20** NA -0.09 -0.01 -0.46** -0.10 0.1121. North America dummy -0.03 -0.10 -0.16* 0.19** NA -0.18** 0.33** 0.60** -0.44** -0.31** -0.15*
** p < .01; * p < .05
ª One over (1/!) transformed; ᵇ Log transformed; ᶜ Sq. rt. (√!); ᵈ Cb rt. (∛!); ᵉ!^0.25 transformed to remove excess skewness for regression analysis and to calculate correlations. Please bear transformations in mind in interpreting correlation coefficient signs.
26
second level to incorporate within-country correlation. The models were fit-
ted using the “lme” procedure in the “nlme” package in R software. This
function fits a linear mixed-effects model in the formulation described in
Laird and Ware (1982) but allowing for nested random effects. The within-
group errors are allowed to be correlated and/or have unequal variances.
We found it necessary to transform variables to remove excessive skewness
as noted in Table 2. Using stepwise variable selection, we are not only able to
fit explanatory models for cost and overruns and estimated duration but also
practicably parsimonious models for predicting them.
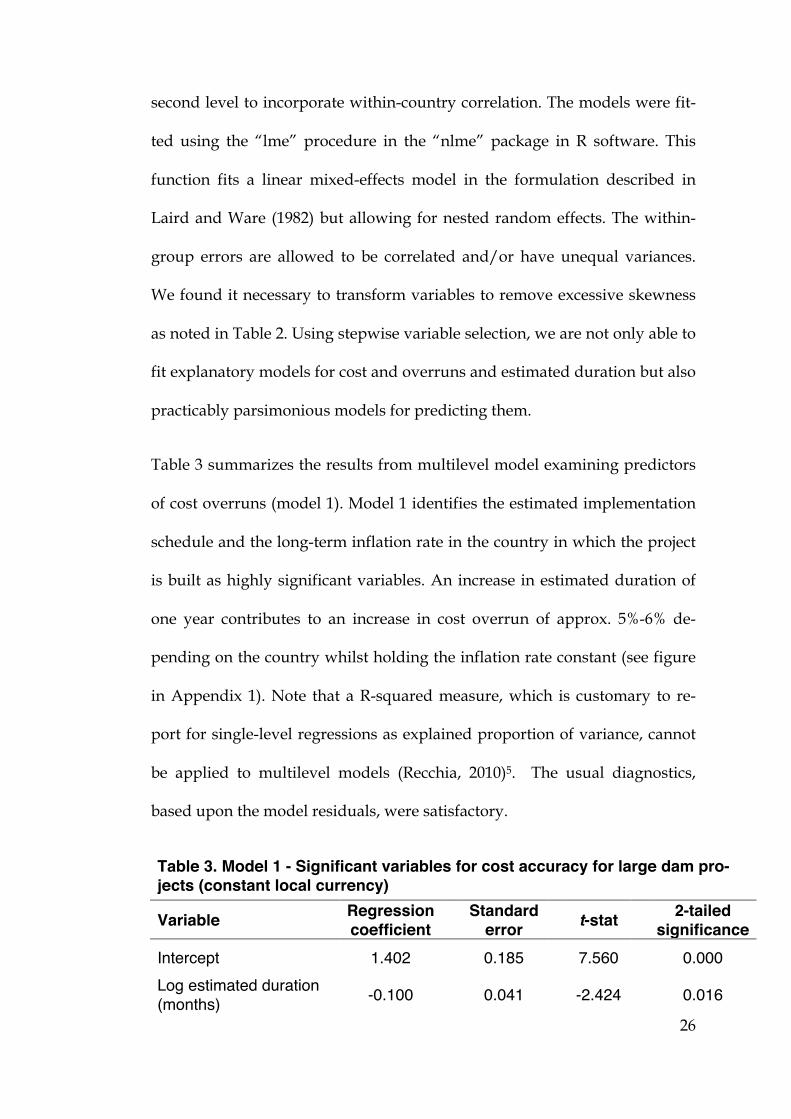
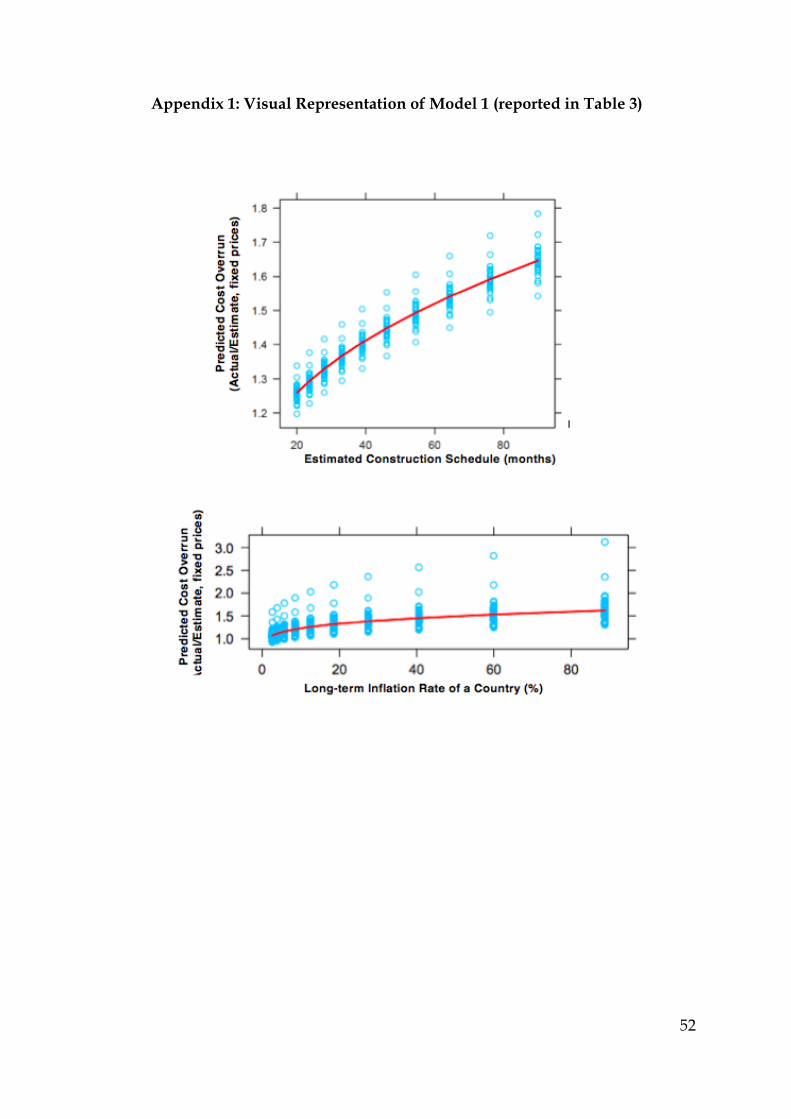
Table 3 summarizes the results from multilevel model examining predictors
of cost overruns (model 1). Model 1 identifies the estimated implementation
schedule and the long-term inflation rate in the country in which the project
is built as highly significant variables. An increase in estimated duration of
one year contributes to an increase in cost overrun of approx. 5%-6% de-
pending on the country whilst holding the inflation rate constant (see figure
in Appendix 1). Note that a R-squared measure, which is customary to re-
port for single-level regressions as explained proportion of variance, cannot
be applied to multilevel models (Recchia, 2010)5. The usual diagnostics,
based upon the model residuals, were satisfactory.
Table 3. Model 1 - Significant variables for cost accuracy for large dam pro-jects (constant local currency) Variable Regression
Note: Dependent variable is the estimated/actual cost ratio (i.e. 1/x of the cost over-run to remove excessive skewness), based on 239 observations. Since the de-pendent variable in Model 1 is the inverse of the cost overrun a negative sign on the coefficients of both significant variables suggests that an increase in the estimated duration or long-term inflation rate increases the cost overrun. The first finding in Model 1 is that the larger the estimated implementation
schedule the higher the cost overrun (p = 0.016), all other things being equal,
and is particularly noteworthy for two reasons.
First, Model 1 suggests that planners’ forecasting skills decay the
longer in the future they are asked to project the risks facing a large
dam. Material information about risks, for example related to geology,
prices of imports, exchange rates, wages, interest rates, sovereign
debt, environment, only reveals in future shaping episode to which
decision-makers are “blind” ex ante (Flyvbjerg and Budzier, 2011). We
discuss some qualitative case examples to illustrate this statistical re-
sult and its broader implications in the next section.
Second, preliminary analysis had suggested that estimated implemen-
tation schedules depend on the scale of a planned investment—i.e.
bigger projects take longer to build. Support of this preliminary result
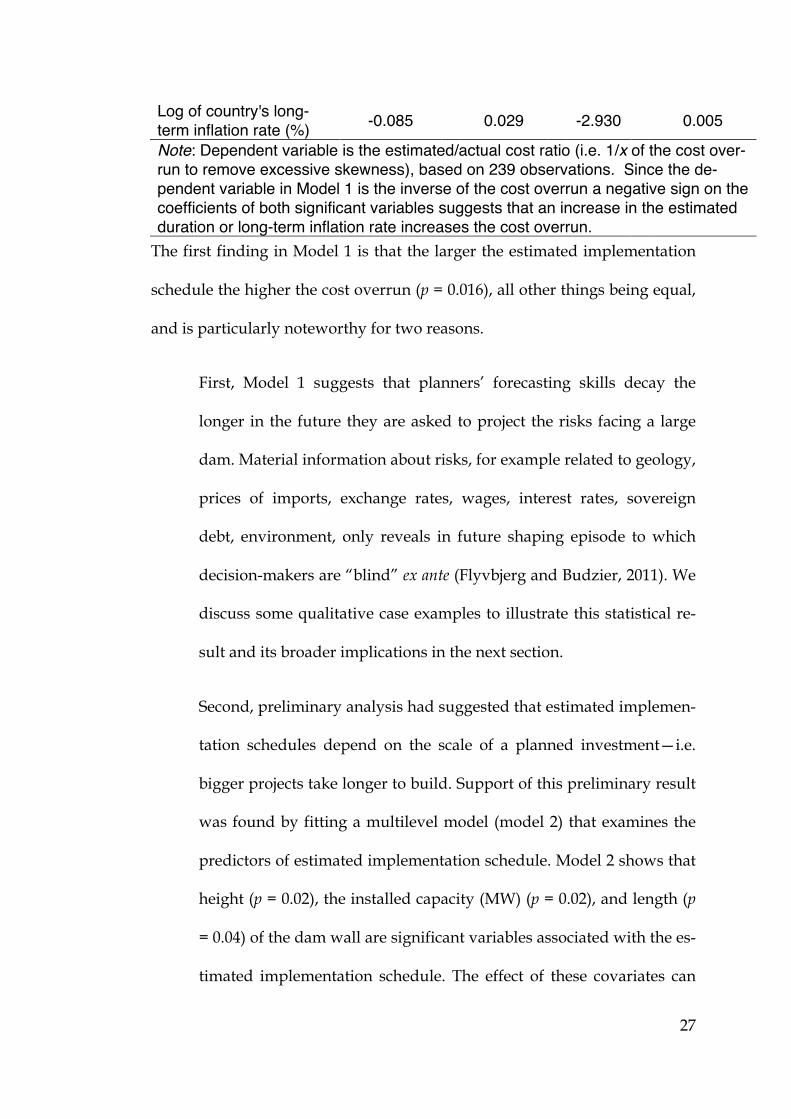
was found by fitting a multilevel model (model 2) that examines the
predictors of estimated implementation schedule. Model 2 shows that
height (p = 0.02), the installed capacity (MW) (p = 0.02), and length (p
= 0.04) of the dam wall are significant variables associated with the es-
timated implementation schedule. The effect of these covariates can
28
be seen from the coefficients in Table 4: a greater height, installed ca-
pacity, or length contributes to a longer implementation schedules.
We interpret Model 2 as follows. Estimated implementation schedule
not only acts as a temporal variable but also as a surrogate for scalar
variables such as wall height (which is also highly correlated with in-
stalled capacity). The larger the dam, the longer the estimated imple-
mentation schedule, and the higher the cost overrun.
Taken together, the multilevel models for cost overruns and estimated
schedule suggest that longer time horizons and increasing scale are underly-
ing causes of risk in investments in large hydropower dam projects.
Table 4. Model 2 - Significant variables for estimated construction schedule for large dam projects (months) Variable Regression
coefficient Standard error t-stat 2-tailed
significance Intercept 3.444 0.197 17.464 0.000
Sq rt of dam wall height (m) 0.029 0.012 2.414 0.017
Log of dam wall length (m) 0.058 0.027 2.153 0.033
Log of hydropower in-stalled capacity (MW) 0.016 0.007 2.141 0.034
Note: Dependent variable is log of the estimated construction schedule, based on 239 observations.
The second finding in Model 1 is that higher the long-term inflation rate of
the host country the higher the cost overrun suffered by a dam (p = 0.02). The
long-term inflation rate was calculated by fitting a linear model to the log of
29
the time series of the GDP deflator index of each country. The slope of this
fitted line can be interpreted as the annual average growth rate of the log in-
flation for each country. This slope is a different constant for each country
with some countries such as Brazil with a considerably higher long-term in-
flation rate, and hence greater propensity to cost overruns, than China or the
United States. Moreover, this slope is stable in the short-run (it takes years of
high or low inflation to change this slope) and hence our estimate can be as-
sumed to be a reliable predictor. Recall that the cost overrun is being meas-
ured in constant terms (i.e. with the effects of inflation removed); yet Model
1 suggests that the inflation trajectory of a country, which we interpret as a
surrogate of the overall macroeconomic management, is an important risk
when making durable investments. The multilevel model thus suggests that
once country specific factors have been taken into account the factor that
drives cost overrun is the planning horizon.
Finally, we fit a multilevel model (Model 3) to examine predictors of sched-
ule overruns. Model 3 identifies the following significant variables: whether
or not a country is a democracy; the per capita income of the country in 2000
constant USD in the year of the decision to build; the planned installed ca-
pacity (MW); and planned length of the dam wall (meters). Avid dam build-
ing countries in South Asia, at various stages of democratic maturity, have
also one of the poorest schedule performances in building dams. We con-
trolled for this fact by including a dummy variable for South Asia in the
model as a covariate with an interaction effect with the democracy dummy.
Democracy in South Asia is significant in explaining schedule overruns. The
30
South Asia dummy, however, does not come out to be significant. The effect
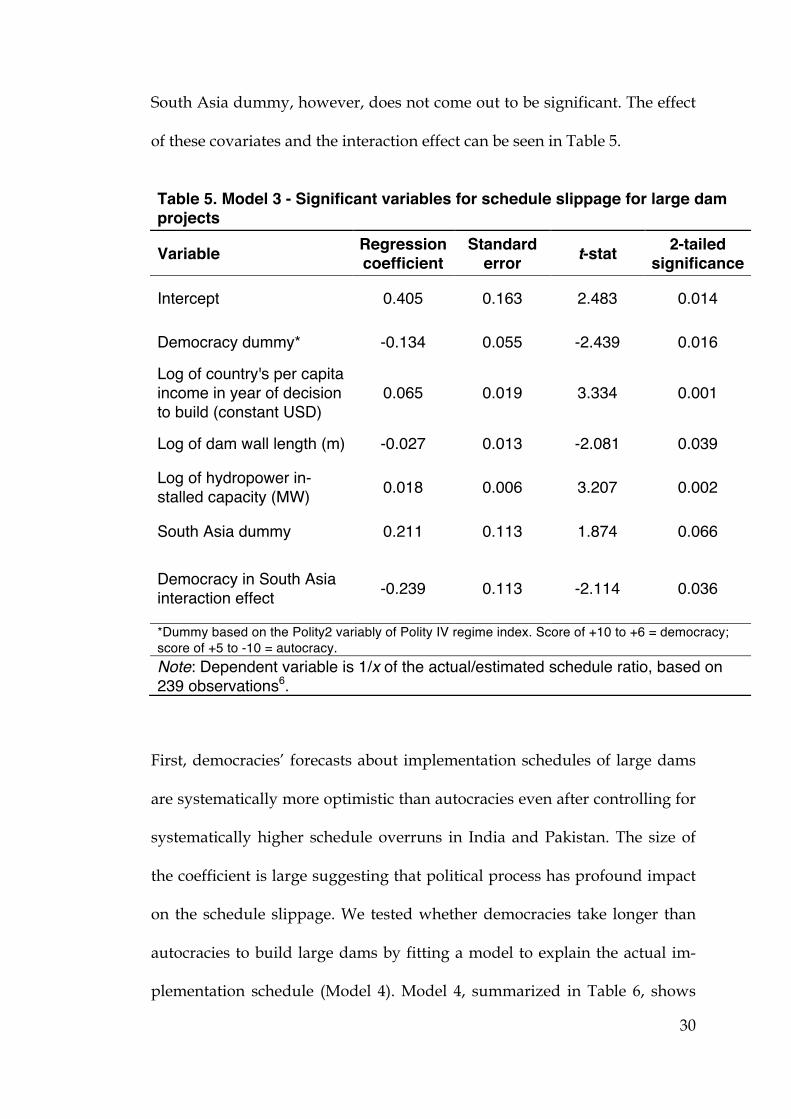
of these covariates and the interaction effect can be seen in Table 5.
Table 5. Model 3 - Significant variables for schedule slippage for large dam projects
Variable Regression coefficient
Standard error t-stat 2-tailed
significance
Intercept 0.405 0.163 2.483 0.014
Democracy dummy* -0.134 0.055 -2.439 0.016
Log of country's per capita income in year of decision to build (constant USD)
0.065 0.019 3.334 0.001
Log of dam wall length (m) -0.027 0.013 -2.081 0.039
Log of hydropower in-stalled capacity (MW) 0.018 0.006 3.207 0.002
South Asia dummy 0.211 0.113 1.874 0.066
Democracy in South Asia interaction effect -0.239 0.113 -2.114 0.036
*Dummy based on the Polity2 variably of Polity IV regime index. Score of +10 to +6 = democracy; score of +5 to -10 = autocracy. Note: Dependent variable is 1/x of the actual/estimated schedule ratio, based on 239 observations6.
First, democracies’ forecasts about implementation schedules of large dams
are systematically more optimistic than autocracies even after controlling for
systematically higher schedule overruns in India and Pakistan. The size of
the coefficient is large suggesting that political process has profound impact
on the schedule slippage. We tested whether democracies take longer than
autocracies to build large dams by fitting a model to explain the actual im-
plementation schedule (Model 4). Model 4, summarized in Table 6, shows
31
that effects of political regime on the actual schedule are not significant. In
other words, while democracies do not take longer to build large dams than
autocracies in absolute terms, democracies appear to be more optimistic.
Given its vast scope, we defer a further investigation of this important result
to a future enquiry. We note, however, that theories of delusion and decep-
tion in the planning of large infrastructure projects (Flyvbvjerg et al., 2009)
would interpret this as evidence of ex ante political intent among democrati-
cally elected politicians to present a rosier picture about large dams than
they know the case to be.
Second, countries with a higher per capita income in constant 2000 USD in
the year of decision to build tend to have lower schedule overruns than
countries with lower per capita income. We concur with the interpretation of
Bacon and Besant-Jones (1998, p. 325) that “the best available proxy for most
countries is [the] country-per-capita income…[for] the general level of eco-
nomic support that a country can provide for the construction of complex
facilities”. This result suggests that developing countries in particular, de-
spite seemingly the most in need of complex facilities such as large dams,
ought to stay away from bites bigger than they can chew.
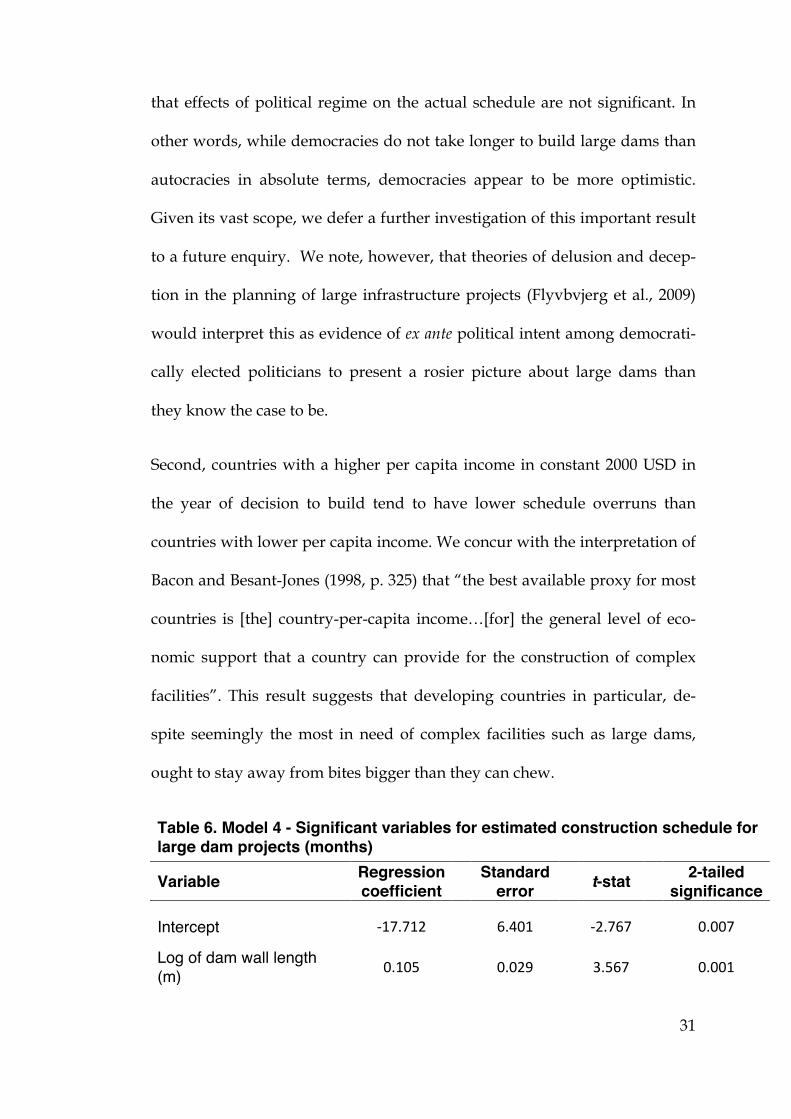
Table 6. Model 4 - Significant variables for estimated construction schedule for large dam projects (months) Variable Regression
Log of dam wall length (m) 0.105 0.029 3.567 0.001
32
Year of actual project completion 0.011 0.003 3.358 0.001
Note: Dependent variable is log of the actual construction schedule, based on 239 observations.
Third, the evidence appears to be contradictory with respect to scale. While a
greater dam wall length contributes to a higher schedule overrun, a higher
MW installed capacity has the opposite effect. Model 3 in Table 5 shows that
the size of coefficients for the two significant variables related to physical
scale—i.e. Log of dam wall length (m) and Log of hydropower installed ca-
pacity (MW)—is approximately the same but with the opposite sign6.
In attempting to interpret this result our conjecture is as follows. Dam walls
are bespoke constructions tied to the geological and other site-specific char-
acteristics. In contrast, installed capacity is manufactured off-site in a modu-
lar fashion. For example, the 690 MW installed capacity of the recently com-
pleted Kárahnjúkar project in Iceland was delivered with six generating
units of identical design (6 X 115 MW). We propose that project components
that require onsite construction, e.g. dam wall, are more prone to schedule
errors than components manufactured off-site, e.g. generation turbines. Pro-
ject designs that seek to reduce the bespoke and onsite components in favor
of greater modular and manufactured components may reduce schedule un-
certainty.
This conjecture is supported by Model 4 in Table 6, which shows that the ac-
tual construction schedule, in absolute terms, is significantly increased with
an increase in the length of dam wall. In contrast, MW installed capacity
33
does not have an effect on the absolute actual construction schedule suggest-
ing that construction schedules are more sensitive to on-site construction
than to components manufactured in factories. Note that lower installed ca-
pacity does not necessarily equate with a smaller dam. For example, it is not
rare for a large multipurpose dam to have a low MW installed capacity
when, for instance, the dam is primarily being used for irrigation or flood
management purposes.
4. Qualitative case examples and policy propositions
The statistical results reported in the preceding sections show that cost and
schedule estimates of large dams are severely and systematically biased be-
low their actual values. While it is beyond the scope of this paper to discuss
wider theoretical implications, the evidence presented here is consistent with
previous findings that point to twin problems that cause adverse outcomes
in the planning and construction of large and complex facilities such as large
hydropower dams: 1) biases inherent in human judgment (delusion) and 2)
misaligned principal-agent relationships or political incentives (deception)
that underlie systematic forecasting errors. In context of large dams, we ar-
gue that large scale and longer planning time horizons exacerbate the impact
of these twin problems. We now present a few qualitative examples of risks
large dams typically face to illustrate the statistical results reported above.
We jointly draw on the statistical analyses and qualitative analyses to distill
propositions of immediate relevance to policy.
34
Globally, experts’ optimism about several risk factors contribute to cost over-
runs in large dams. For example, the planning documents for the Itumbiara
hydroelectric project in Brazil recognized that the site chosen for the project
was geologically unfavorable. The plan optimistically declared, “the cost es-
timates provide ample physical contingencies [20% of base cost] to provide
for the removal of larger amounts [of compressible, weak, rock] if further in-
vestigations show the need” (World Bank, 1973). This weak geology ended
up costing +96% of the base cost in real terms. Itumbiara’s case is illustrative
of a broader problem. Even though geological risks are anticipatable there is
little planners can do to hedge against it. For example, exhaustive geological
investigation for a large dam can cost as much as a third of the total cost
(Hoek and Palmieri, 1998); at which point still remains a considerable chance
of encountering unfavorable conditions that go undetected during the ex ante
tests (Goel et al., 2012).
Policy proposition 1: Energy alternatives that rely on fewer site-specific
characteristics such as unfavorable geology are preferable.
Similarly, in the Chivor hydroelectric project in Colombia, the planning doc-
ument was upbeat that there will be no changes in the exchange rate be-
tween the Colombian Peso and the U.S. dollar during the construction peri-
od (1970-1977) stating, “No allowance has been made for possible future
fluctuations of the exchange rate. This approach is justified by recent experi-
ence in Colombia where the Government has been pursuing the enlightened
policy of adjusting [policy] quickly to changing conditions in the economy”
35
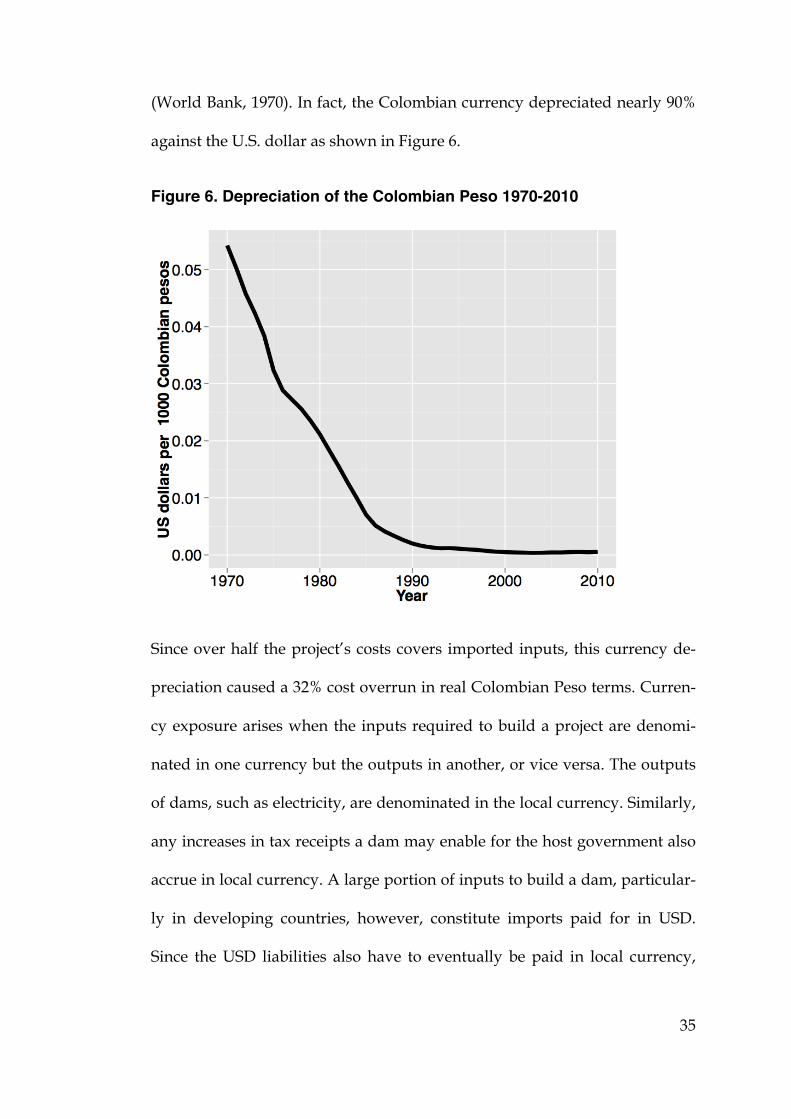
(World Bank, 1970). In fact, the Colombian currency depreciated nearly 90%
against the U.S. dollar as shown in Figure 6.
Figure 6. Depreciation of the Colombian Peso 1970-2010
Since over half the project’s costs covers imported inputs, this currency de-
preciation caused a 32% cost overrun in real Colombian Peso terms. Curren-
cy exposure arises when the inputs required to build a project are denomi-
nated in one currency but the outputs in another, or vice versa. The outputs
of dams, such as electricity, are denominated in the local currency. Similarly,
any increases in tax receipts a dam may enable for the host government also
accrue in local currency. A large portion of inputs to build a dam, particular-
ly in developing countries, however, constitute imports paid for in USD.
Since the USD liabilities also have to eventually be paid in local currency,
!
36
currency exposure consistently proves to be a fiscal hemorrhage for large
projects.
Policy proposition 2: Energy alternatives that rely on fewer imports or
match the currency of liabilities with the currency of future revenue are
preferable.
Although, following convention, our cost analysis excludes the effects of in-
flation, planners ought not to ignore the risks of “unanticipated inflation”
(Pickrell, 1992, p. 164). Episodes of hyperinflation in Argentina, Brazil, Tur-
key, and Yugoslavia caused staggering nominal cost overruns, e.g.7-times
initial budget for Brazil’s Estreito dam (1965-1974), or 110-times initial budg-
et for Yugoslavia’s Visegrad dam (1985-1990), which had to be financed with
additional debt. Effects of unanticipated inflation magnify the longer it takes
to complete a project. For example, during the planning phase of Pakistan’s
Tarbela dam, it was assumed that inflation would not have a signification
impact on the project’s costs. The appraisal report wrote: “A general contin-
gency of 7½% has been added in accordance with normal practice for works
of this size and duration” (World Bank, 1968). The project, launched in 1968,
was meant to start full commercial operation in 1976, but the opening was
delayed until 1984. Actual cumulative inflation in Pakistan during 1968-1984
was 380%; the actual cost of the dam in nominal terms nearly four times the
initial budget. In the case of Tarbela, unanticipated inflation was “a product
of delays in a project’s construction timetable and a higher-than expected in-
flation rate” (Pickrell, 1992, p. 164). For our reference class, 8 out of 10 large
37
dams came in late with an average delay of 2.3 years. Moreover, forecasters
expected the annual inflation rate to be 2.5% but it turned out to be 18.9%
(averages for the entire sample). Large dams have a high propensity to face
unanticipated inflation.
Policy proposition 3: The best insurance against creeping inflation is to
reduce the implementation schedule to as short a horizon as possible. En-
ergy alternatives that can be built sooner and with lower risk of schedule
overruns, e.g. through modular design, are preferable.
Large dams are typically financed from public borrowing. While our calcula-
tions exclude debt-servicing, cost overruns increase the stock of debt but also
the recurring financing costs that can further escalate if interest rates go up.
The optimistic risk assessments of the costs of large dams are consistent with
“explosive growth of Third World debt” (Bulow and Rogoff, 1990; Mold,
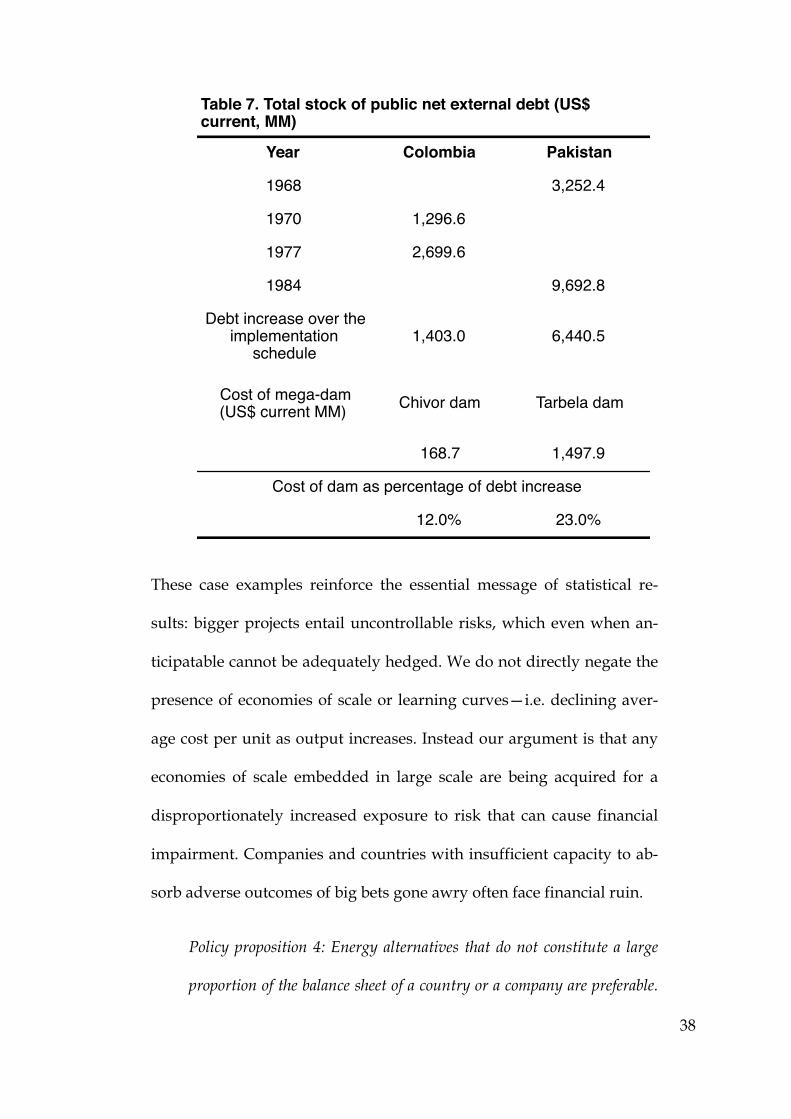
2012). For example, the actual cost of Tarbela dam, the majority of which was
borrowed from external sources, amounted to 23% of the increase in Paki-
stan’s external public debt stock between 1968-1984; or 12% for Colombia’s
Chivor dam (1970-1977) as shown in Table 7.
38
These case examples reinforce the essential message of statistical re-
sults: bigger projects entail uncontrollable risks, which even when an-
ticipatable cannot be adequately hedged. We do not directly negate the
presence of economies of scale or learning curves—i.e. declining aver-
age cost per unit as output increases. Instead our argument is that any
economies of scale embedded in large scale are being acquired for a
disproportionately increased exposure to risk that can cause financial
impairment. Companies and countries with insufficient capacity to ab-
sorb adverse outcomes of big bets gone awry often face financial ruin.
Policy proposition 4: Energy alternatives that do not constitute a large
proportion of the balance sheet of a country or a company are preferable.
Year Colombia Pakistan
1968 3,252.4
1970 1,296.6
1977 2,699.6
1984 9,692.8
Debt increase over the implementation
schedule 1,403.0 6,440.5
168.7 1,497.9
12.0% 23.0%
Table 7. Total stock of public net external debt (US$ current, MM)
Chivor dam Tarbela dam
Cost of dam as percentage of debt increase
Cost of mega-dam(US$ current MM)
39
Similarly, policymakers, particularly in countries at lower levels of eco-
nomic development, ought to avoid highly leveraged alternatives invest-
ments denominated in a mix of currencies.
5. Forecasting the actual costs and schedules using reference class
forecasting (RCF)
As discussed in the methods section, the third step of the “outside view” or
RCF techniques is to compare a specific venture with the reference class dis-
tribution, in order to establish the most likely outcome for the specific ven-
ture. Thus if systematic errors in the forecasts generated using the “inside
view” of previous ventures are found, decision-makers should apply an up-
lift or downlift to the “inside view” forecast in order to generated a de-
biased “outside view” forecast. For example, empirical literature has estab-
lished that rail projects suffer a cost overrun of 45% on average (Flyvbjerg,
2008; also see Table 8). The 50th percentile cost overrun for rail projects is 40%
and the 80th percentile is 57%. Based on these findings, RCF techniques sug-
gest that decision-makers ought to apply a 57% uplift to the initial estimated
budget in order to obtain 80% certainty that the final cost of the project
would stay within budget (Flyvbjerg 2008, p.16). If decision-makers were
more risk tolerant then they could apply a 40% uplift to the initial estimated
budget but then there will remain a 50% chance that the proposed project
might exceed its budget.
In line with the RCF techniques, the third and final step of our investigation
on dams was to derive a good predictor of cost and schedule overruns for
40
proposed large dams based on the distributional information of the reference
class. This predictor serves to “correct” the systematically biased ex ante cost
and schedule estimates by adjusting them upwards by the average cost or
schedule overrun (see Kahneman and Tverksy, 1979b; Flyvbjerg, 2006, 2008).
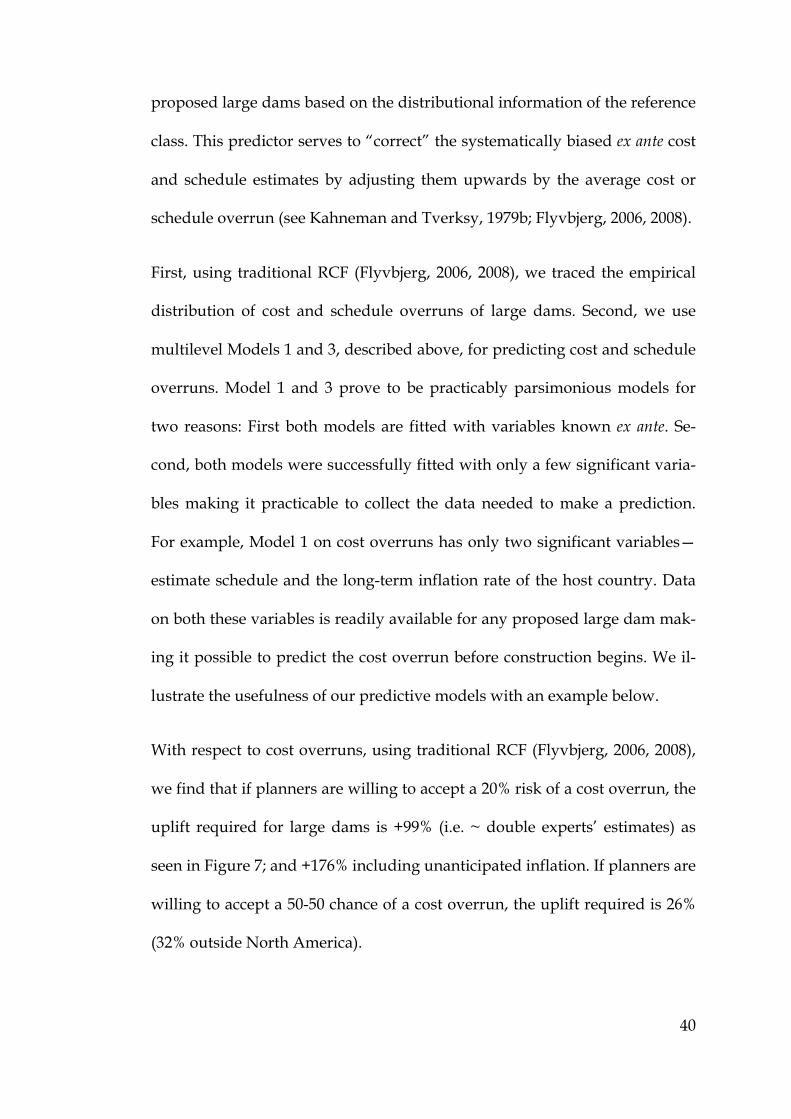
First, using traditional RCF (Flyvbjerg, 2006, 2008), we traced the empirical
distribution of cost and schedule overruns of large dams. Second, we use
multilevel Models 1 and 3, described above, for predicting cost and schedule
overruns. Model 1 and 3 prove to be practicably parsimonious models for
two reasons: First both models are fitted with variables known ex ante. Se-
cond, both models were successfully fitted with only a few significant varia-
bles making it practicable to collect the data needed to make a prediction.
For example, Model 1 on cost overruns has only two significant variables—
estimate schedule and the long-term inflation rate of the host country. Data
on both these variables is readily available for any proposed large dam mak-
ing it possible to predict the cost overrun before construction begins. We il-
lustrate the usefulness of our predictive models with an example below.
With respect to cost overruns, using traditional RCF (Flyvbjerg, 2006, 2008),
we find that if planners are willing to accept a 20% risk of a cost overrun, the
uplift required for large dams is +99% (i.e. ~ double experts’ estimates) as
seen in Figure 7; and +176% including unanticipated inflation. If planners are
willing to accept a 50-50 chance of a cost overrun, the uplift required is 26%
(32% outside North America).
41
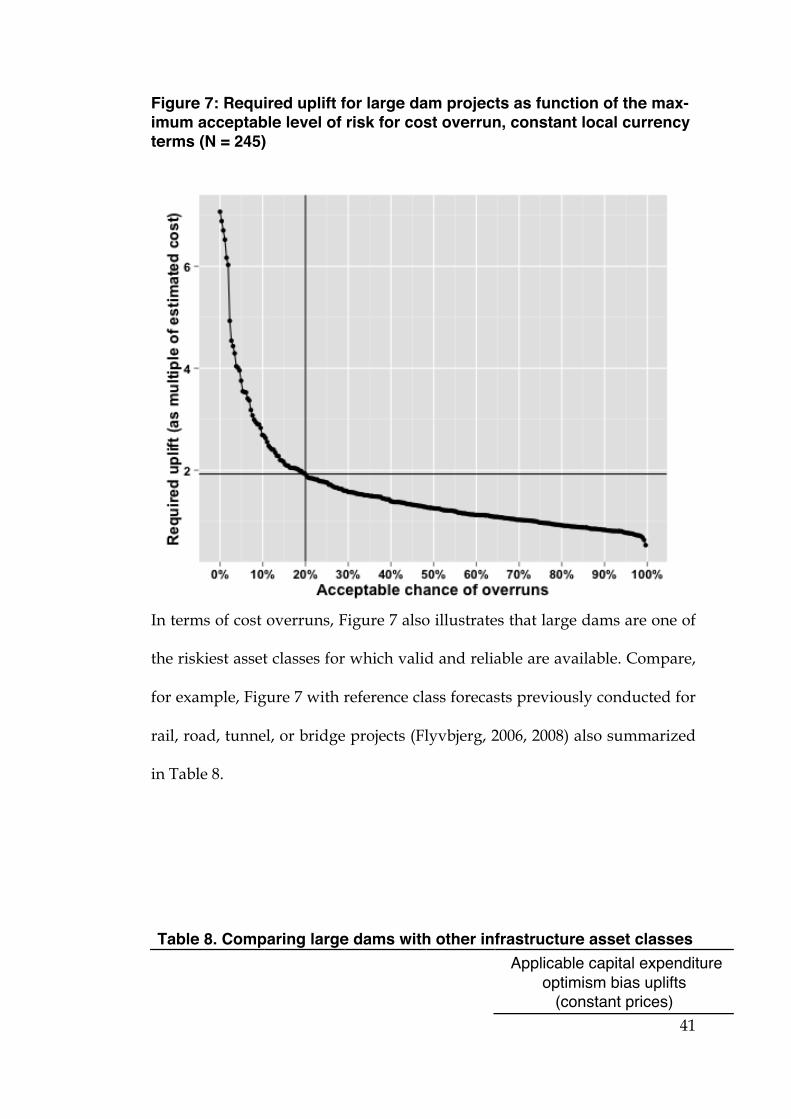
Figure 7: Required uplift for large dam projects as function of the max-imum acceptable level of risk for cost overrun, constant local currency terms (N = 245)
In terms of cost overruns, Figure 7 also illustrates that large dams are one of
the riskiest asset classes for which valid and reliable are available. Compare,
for example, Figure 7 with reference class forecasts previously conducted for
rail, road, tunnel, or bridge projects (Flyvbjerg, 2006, 2008) also summarized
in Table 8.
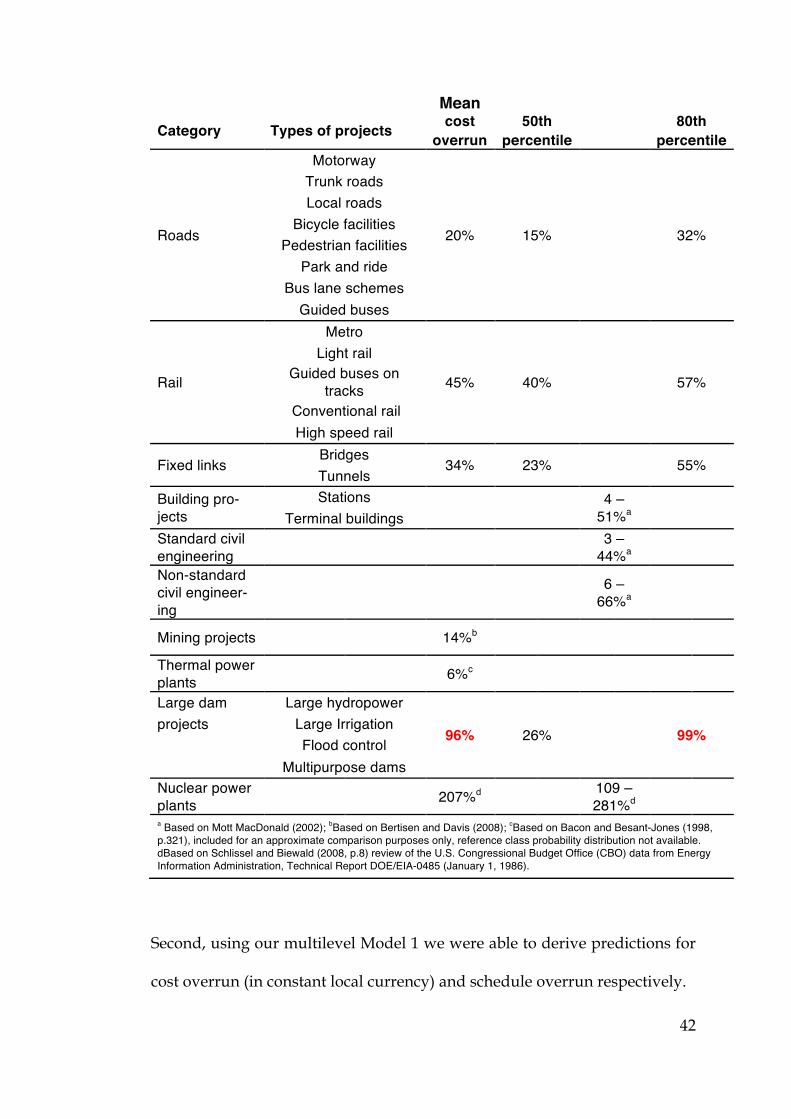
Table 8. Comparing large dams with other infrastructure asset classes
Applicable capital expenditure optimism bias uplifts
(constant prices)
!
42
Mean Category Types of projects cost 50th
80th
overrun percentile percentile
Roads
Motorway
20% 15% 32%
Trunk roads Local roads
Bicycle facilities Pedestrian facilities
Park and ride Bus lane schemes
Guided buses
Rail
Metro
45% 40% 57%
Light rail Guided buses on
tracks Conventional rail High speed rail
Fixed links Bridges
34% 23% 55% Tunnels
Building pro-jects
Stations 4 –
51%a Terminal buildings
Standard civil engineering 3 –
44%a
Non-standard civil engineer-ing
6 – 66%a
Mining projects 14%b
Thermal power plants 6%c
Large dam Large hydropower
96% 26%
99% projects Large Irrigation
Flood control
Multipurpose dams
Nuclear power plants 207%d 109 –
281%d
a Based on Mott MacDonald (2002); bBased on Bertisen and Davis (2008); cBased on Bacon and Besant-Jones (1998, p.321), included for an approximate comparison purposes only, reference class probability distribution not available. dBased on Schlissel and Biewald (2008, p.8) review of the U.S. Congressional Budget Office (CBO) data from Energy Information Administration, Technical Report DOE/EIA-0485 (January 1, 1986).
Second, using our multilevel Model 1 we were able to derive predictions for
cost overrun (in constant local currency) and schedule overrun respectively.
43
Experts estimate, for instance, that Pakistan’s Diamer-Bhasha dam, whose
construction began shortly after the 2010 floods, will cost PKR 894 billion
(~USD12.7B in 2008 prices and exchange rates and about 9% of Pakistan’s
2008 GDP) (WAPDA, 2011). The dam is forecasted to take ten years from
2011 and become operational in 2021. Using our first approach, the reference
class forecast for cost overruns suggests that planners need to budget PKR
1,788B (USD25.4B) in real terms to obtain 80% certainty of not exceeding the
budget. Including the effects of unanticipated inflation the required budget
is PKR 2,467B (USD35.0B) or about 25% of Pakistan’s 2008 GDP. A future
sovereign default in Pakistan owing to this one mega-dam is not a remote
possibility.
Using our second approach, our multilevel Model 1 predicts that given the
10 year estimated duration and a long-term inflation rate of about 8% the ex-
pected (average) cost overrun of a large dam in Pakistan will be 44% (PKR
1,288B or USD 18.3B). Combining the two methods, a conservative estimate
for the cost overrun on the Diamer-Bhasha dam is 44% at which point there
remains a 4 in 10 chance of the revised budget being exceeded. Note, howev-
er, that if a dam of dimensions similar to Diamer-Bhasha were being built in
the US, Model 1 predicts that it would only suffer a cost overrun of 16%,
which the much larger US economy could absorb without any lasting dam-
age.
We applied a similar two-pronged forecast of schedule slippage. Using our
first approach, the reference class forecast for schedule slippage suggests that
44
planners for large dams around the world need to allow for a 66% schedule
overrun to achieve 80% certainty that the project will be completed within
the revised implementation schedule. Since Diamer-Bhasha is expected to
take 10 years to build (2011-2021), planners need to adjust their schedule es-
timate upwards to nearly 17 years (i.e. an actual opening date of 2028). Using
our second approach, our multilevel Model 3 predicts that given that the
dam’s final decision to build was made in Pakistan by a democratically elect-
ed government, when the per capita income was USD 497 in 2000 constant
dollars, a dam wall length of 998 meters, and an installed capacity of 4,500
MW, the expected outcome is a 60% schedule overrun. Thus, using either
approach, Diamer-Bhasha can be expected to only open in 2027 when there
remains a 20% risk of further delay. Pakistan is facing an energy crisis today
(Kessides, 2011). A dam that brings electricity is 2027 will be a little late in
coming.
Note, however, that if a dam of dimensions similar to Diamer-Bhasha were
being built in the US (with its high per capita income of approximately USD
38,000), Model 3 predicts that it would face a schedule slippage of a mere
0.05%. Recall that per capita income is a useful proxy for the economic sup-
port that a country can provide for the construction of complex facilities.
This suggests that rich and not developing countries best attempt very large
energy projects, such as large dams. Even so, richer countries should adopt
the risk management measures of the outside view illustrated here to choose
prudently among energy alternatives.
45
Using their “inside” cost estimates, the net present benefits to cost ratio of
the dam according to experts is 1.43 (WAPDA, 2011). Even assuming ex-
perts’ calculations about potential benefits are accurate, although this is a
doubtful assumption, the de-biased cost forecasts require an uplift of 44%-
99% in constant prices suggest that the benefits to cost ratio will be below
one. Diamer-Bhasha dam is a non-starter in Pakistan. This is without even
discussing potential effects of inflation and interest rates, potential social and
environmental costs, and opportunity cost Pakistan could earn by commit-
ting such vast amount of capital to more prudent investments.
Our reference class forecasting techniques suggests that other proposed large
dam projects such as the Belo Monte, Myitsone, or the Gilgel Gibe III among
many others in early planning stages are likely to face large cost and sched-
ule overruns seriously undermining their economic viability. Large dams al-
so exert an opportunity cost by consuming scarce resources that could be
deployed to better uses, sinking vast amounts of land that could have yield-
ed cash flows and jobs from agricultural, timber, or mineral resources. Risks
related to dam safety, environment, and society further undermine viability
of large dams. Decision-makers are advised to carefully stress test their pro-
posed projects using the risk management techniques of the outside view
proposed here before committing resources to them.
The outside view techniques applied to large dams have broader application
in energy policy by helping public agencies (e.g. national planning and
finance ministries, power and water authorities) private entrepreneurs and
46
investors a framework to improve the upfront selection among alternatives.
The problems of cost and schedule overrun are not unique to large hydro-
power dams. Preliminary research suggests that other large-scale power pro-
jects using nuclear, thermal, or wind production technologies face similar
issues. Our research of large hydropower projects reveals that there is a seri-
ous dearth of valid and reliable data on the risk profiles of actually complet-
ed energy projects across the board. Much of the data in existing literature
are drawn from surveys and interviews of dubious validity. At times, inter-
est groups, seeking to promote a particular kind of scale or technology, also
report distorted data. There is thus an urgent need to empirically document,
in a comprehensive global database, the risk profiles of energy infrastructure
assets of large, medium, and small scales across production technologies. For
example, comparing the likely actual cost, schedule, and production vol-
umes of a large hydropower dam project versus an on-site combined heat
and power generator.
We propose that prior to making any energy investment, policy makers con-
sult a valid and reliable “outside view” or “reference class forecast” (RCF)
that can predict the outcome of a planned investment of a particular scale or
production technology based on actual outcomes in a reference class of simi-
lar, previously completed, cases. Rigorously applying reference class fore-
casting to energy investments at various scales and production technologies
will yield the following contributions:
• Create transparency on risk profiles of various energy alternatives,
47
not only from the perspective of financial cost and benefit but also en-
vironmental and social impact—hard evidence is a counter-point to
experts’ oft-biased inside view.
• Improve resource allocation through outside-in view to estimate costs,
benefits, time, and broader impacts such as greenhouse gas emissions
incurred in building a project and emission created or averted once a
project becomes operational.
A comprehensive global dataset that can create such transparency on risk
profiles of energy alternatives does not yet exist. We have sought to bridge
this precise gap by providing impartial evidence on large hydropower dam
projects. As a venue for further research we hope valid and reliable data on
the actual cost, schedules, benefits, and impacts of other production technol-
ogies will become available to enable comparative analysis with novel impli-
cations for theory and practice.
References:
Ansar, A., Flyvbjerg, B., Budzier, A., 2013. Do “Hard States” Make Better Decisions? Incentives versus Biases. Unpublished manuscript, 42 pp., Saïd Business School, University of Oxford
Ansar, A., Flyvbjerg, B., Budzier, A., 2012. Big is Fragile: The Effects of Temporal Uncertainty and Sunk Costs on the Outcomes Of Big Ventures. Unpublished manuscript, 58 pp., Saïd Busi-ness School, University of Oxford.
Bacon, R.W., Besant-Jones, J.E., 1998. Estimating construction costs and schedules: Experi-ence with power generation projects in developing countries. Energy Policy 26, 317–333.
Bakker, K., 1999. The politics of hydropower: Developing the Mekong. Political Geography 18, 209–232.
Billington, D.P., Jackson, D.C., 2006. Big dams of the New Deal era: a confluence of engineer-ing and politics. University of Oklahoma Press.
Buehler, R., Griffin, D., Ross, M., 1994. Exploring the“ planning fallacy”: Why people under-estimate their task completion times. Journal of Personality and Social Psychology 67, 366.
Bulow, J., Rogoff, K., 1990. Cleaning up third world debt without getting taken to the clean-ers. The Journal of Economic Perspectives 4, 31–42.
48
Copeland, T., Tufano, P., 2004. A real-world way to manage real options. Harvard business review 82, 90–99.
Dawes, R.M., Faust, D., Meehl, P.E., 1989. Clinical versus actuarial judgment. Science 243, 1668–1674.
Duflo, E., Pande, R., 2007. Dams. The Quarterly Journal of Economics 122, 601–646.
Federal Transit Administration (FTA), 2003. Predicted and actual impacts of new starts pro-jects: Capital Cost, Operating Cost and Ridership Data. U.S. Department of Trans-portation, Washignton, DC.
Flyvbjerg, B., 2003. Delusions of success: comment on Dan Lovallo and Daniel Kahneman. Harvard Business Review 81, 121–122.
Flyvbjerg, B., 2006. From Nobel Prize to project management: Getting risks right. Project Management Journal 37, 5.
Flyvbjerg, B., 2008. Curbing optimism bias and strategic misrepresentation in planning: Ref-erence class forecasting in practice. European Planning Studies 16, 3–21.
Flyvbjerg, B., 2009. Survival of the unfittest: why the worst infrastructure gets built--and what we can do about it. Oxford Review of Economic Policy 25, 344.
Flyvbjerg, B., Bruzelius, N., Rothengatter, W., 2003. Megaprojects and risk: An anatomy of ambition. Cambridge Univ Press, Cambridge.
Flyvbjerg, B., Budzier, A., 2011. Why your IT project may be riskier than you think. Harvard Business Review 89, 23–25.
Flyvbjerg, B., COWI, 2004. Procedures for dealing with optimism bias in transport planning: Guidance document 2006-09 [WWW Document]. URL goo.gl/lLiNj
Flyvbjerg, B., Holm, M., Buhl, S., 2005. How (in) accurate are demand forecasts in public works projects. Journal of the American Planning Association 71, 131–146.
Flyvbjerg, B., Holm, M.S., Buhl, S., 2002. Underestimating costs in public works projects: error or lie? Journal of the American Planning Association 68, 279–295.
Flyvbjerg, B., Massimo, G., Lovallo, D., 2009. Delusion and deception in large infrastructure projects. California Management Review 51.
Gelman, A., Hill, J., 2006. Data Analysis Using Regression and Multilevel/Hierarchical Models. Cambridge University Press, Cambridge.
Gilovich, T., Griffin, D., Kahneman, D., 2002. Heuristics and biases: The psychology of intui-tive judgment. Cambridge University Press.
Hoek, E., Palmieri, A., 1998. Geotechnical risks on large civil engineering projects, in: Pro-ceedings 8th Congres IAEG. pp. 79–88.
Hufschmidt, M.M., Gerin, J., 1970. Systematic errors in cost estimates for public investment projects, in: Margolis, J. (Ed.), The Analysis of Public Output. Columbia University Press, New York.
ICOLD, 2010. International Commission on Large Dams [WWW Document]. URL http://www.icold-cigb.org/
IEA, 2011. Policies and Scenarios [WWW Document]. URL http://www.iea.org/publications/scenariosandprojections/
Kahneman, D., 1994. New challenges to the rationality assumption. Journal of institutional and theoretical economics 150, 18–36.
Kahneman, D., 2011. Thinking, fast and slow, 1st ed. Farrar, Straus and Giroux, New York. Kahneman, D., Lovallo, D., 1993. Timid choices and bold forecasts: A cognitive perspective
on risk taking. Management Science 17–31. Kahneman, D., Tversky, A., 1979a. Prospect theory: An analysis of decision under risk.
Econometrica 263–291.
49
Kahneman, D., Tversky, A., 1979b. Intuitive Prediction: Biases and Corrective Procedures, in: Makridakis, S., Wheelwright, S.C. (Eds.), Studies in the Management Sciences: Forecasting. North Holland, Amsterdam.
Kessides, I.N., 2011. Chaos in Power: Pakistan’s Electricity Crisis. Kreft, I.G.G., Leeuw, J. de, 1998. Introducing Multilevel Modeling. Sage Publications Ltd. Laird, N.M., Ware, J.H., 1982. Random-effects models for longitudinal data. Biometrics 963–
974. Lovallo, D., Kahneman, D., 2003. Delusions of success. Harvard Business Review 81, 56–63.
Luehrman, T.A., 1998. Strategy as a portfolio of real options. Harvard Business Review 76, 89–101.
McCully, P., 2001. Silenced rivers: the ecology and politics of large dams. Zed Books, Lon-don.
Merewitz, L., 1973. How do urban rapid transit projects compare in cost estimating experi-ence. Institute of Urban & Regional Development, University of California.
Merrow, E.W., McDonnell, L., Argüden, R.Y., Corporation, R., 1988. Understanding the out-comes of megaprojects: A quantitative analysis of very large civilian projects. Rand Corp.
Mold, A., 2012. Will it all end in tears? Infrastructure spending and African development in historical perspective. Journal of International Development 24, 237–254.
Nilsson, C., Reidy, C.A., Dynesius, M., Revenga, C., 2005. Fragmentation and flow regula-tion of the world’s large river systems. Science 308, 405–408.
Osborne, J. W., Overbay, A. 2004. The power of outliers (and why researchers should always check for them). Practical Assessment, Research & Evaluation 9(6). Retrieved Sep-tember 1, 2013 from http://PAREonline.net/getvn.asp?v=9&n=6
Pickrell, D.H., 1989. Urban rail transit projects: forecast versus actual ridership and costs ( No. PB90148693), Office of Grants Management, Urban Mass Transportation Ad-ministration. Transportation System Center, U.S. Department of Transportation, Cambridge, MA.
Pickrell, D.H., 1992. A desire named streetcar: Fantasy and fact in rail transit planning. American Planning Association. Journal of the American Planning Association 58, 158–176.
Rasbash, J., Browne, W., Goldstein, H., Yang, M., Plewis, I., Healy, M., Woodhouse, G., Draper, D., Langford, I., Lewis, T., 2009. A user’s guide to MLwiN. University of London, Institute of Education, Centre for Multilevel Modelling.
Recchia, A., 2010. R-squared measures for two-level hierarchical linear models using SAS. Journal of Statistical Software 32.
Richter, B.D.a , Postel, S.b , Revenga, C.c , Scudder, T.d , Lehner, B.e , Churchill, A.f , Chow, M.., 2010. Lost in development’s shadow: The downstream human consequences of dams. Water Alternatives 3, 14–42.
Salazar, J.G., 2000. Damming the child of the ocean: The Three Gorges project. The Journal of Environment & Development 9, 160–174.
Scudder, T., 2005. The future of large dams: Dealing with social, environmental, institutional and political costs. Earthscan, London.
Schlissel, D., Biewald, B., 2008. Nuclear Power Plant Construction Costs. Synapse Energy Economics, Inc.
Singh, S., 2002. Taming the Waters: The Political Economy of Large Dams in India. New Delhi: Oxford University Press. Sovacool, B.K., Bulan, L.C., 2011. Behind an ambitious megaproject in Asia: The history and
implications of the Bakun hydroelectric dam in Borneo. Energy Policy 39, 4842–4859. Sovacool, B.K., Cooper, C., 2013. The governance of energy megaprojects: politics, hubris
and energy security. Edward Elgar, Cheltenham, UK.
50
Stone, R., 2011. Hydropower. The legacy of the Three Gorges Dam. Science 333, 817.
Taleb, N.N., 2010. The Black Swan: The Impact of the Highly Improbable with a new section: “On Robustness and Fragility”, 2nd ed. Random House Trade Paperbacks.
Tversky, A., Kahneman, D., 1974. Judgment under uncertainty: heuristics and biases. Sci-ence 185, 1124–1131.
Wachs, M., 1989. When planners lie with numbers. Journal of the American Planning Asso-ciation 55, 476–479.
WAPDA, 2011. Diamer-Basha dam project status as on 20 june 2011.
World Bank, 1968. Report and recommendation of the president to the executive directors on a proposed loan for the Tarbela project and on proposed extension of closing dates of loan 266-PAK (Indus basin project), Pakistan ( No. P-616). The World Bank, Washington, DC.
World Bank, 1970. Staff appraisal report (pu-31a) of the Chivor hydroelectric project, Inter-conexion Electrico S.A., Colombia ( No. PU-31a). The World Bank, Washington, DC.
World Bank, 1973. Staff Appraisal Report (150a-BR) of the Itumbiara hydroelectric power project, FURNAS, Brazil ( No. 150a-BR). The World Bank, Washington, DC.
World Bank, 1996. Estimating construction costs and schedules: Experience with power gen-eration projects in developing countries ( No. WTP325). The World Bank, Washing-ton, DC.
World Commission on Dams, 2000. Cross-check survey: final report. Cape Town, South Af-rica.
Ziv, G., Baran, E., Nam, S., Rodríguez-Iturbe, I., Levin, S.A., 2012. Trading-off fish biodiver-sity, food security, and hydropower in the Mekong River Basin. Proceedings of the National Academy of Sciences 109, 5609–5614.
ENDNOTES
1 Cost overruns can also be expressed as the actual outturn costs minus estimated costs in
percent of estimated costs.
2 Note that the World Bank, Asian Development Bank, and the WCD typically report cost
data in nominal U.S. dollars. We, however, converted these data, adapting methods from
World Bank (1996: 85), into constant local currencies.
3 Hufschmidt and Gerin (1970) report data on over 100 dams built in the United States be-
tween 1933-1967. The salient results of the study were that in nominal USD terms dams built
by TVA suffered a 22 per cent cost overrun; U.S. Corps of Engineers overrun was 124 per
cent for projects built or building prior to 1951, and 36 per cent for projects completed be-
tween 1951 and 1964; while U.S. Bureau of Reclamation overrun was 177 per cent for pro-
jects built or building prior to 1955 and 72 per cent for all projects built or building in 1960
(ibid: 277). Despite its large sample, Hufschmidt and Gerin (ibid) do not report data broken
51
down project-by-project. The validity and reliability of these data could not thus be estab-
lished and were consequently excluded.
4 A more comprehensive enquiry into planned versus actual benefits of dams is postponed
until a future occasion but data available on 84 of the 186 large hydroelectric dam projects
thus far suggests that they suffer a mean benefits shortfall of 11%.
5 Recchia (2010, p. 2) explain further for why a R-squared measure cannot be used for a mul-
tilevel model because it unlike a single-level model which “includes an underlying assump-
tion of residuals that are independent and identically distributed. Such an assumption could
easily be inappropriate in the two[or multi]-level case since there is likely to be dependence
among the individuals that belong to a given group. For instance, it would be difficult to
imagine that the academic achievements of students in the same class were not somehow
related to one another”. Also see Kreft and Leeuw (1998) and Goldstein (2010).
6 Note further that like in Model 1, the dependent variable in Model 3 is the inverse of
schedule overrun (i.e. 1/x of the schedule overrun or Estimated/Actual schedule). Thus a
negative sign on the Log of dam wall length (m) suggests that an increase in wall length de-
creases the inverse of the schedule overrun. In other words, increase in wall length increases
schedule overrun.
52
Appendix 1: Visual Representation of Model 1 (reported in Table 3)