33
Lecture 1 The Foundations of Database
| Date post: | 20-Jan-2018 |
| Category: |
Documents |
| Upload: | cory-carson |
| View: | 214 times |
| Download: | 0 times |

Lecture 1 The Foundations of Database
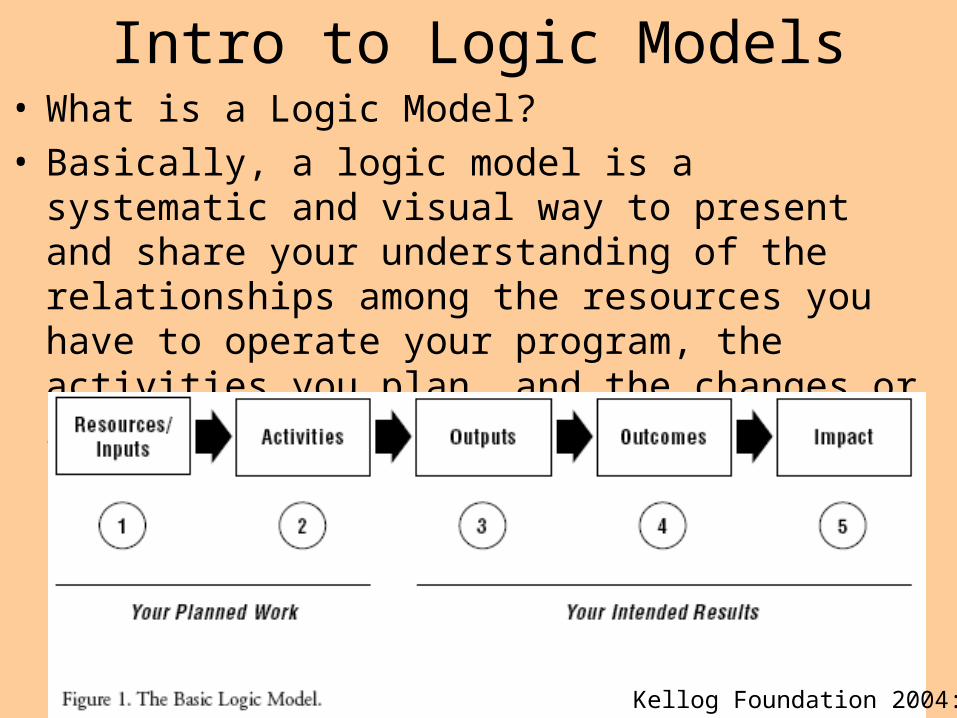
Intro to Logic Models• What is a Logic Model?• Basically, a logic model is a systematic and visual
way to present and share your understanding of the relationships among the resources you have to operate your program, the activities you plan, and the changes or results you hope to achieve.
Kellog Foundation 2004:3

Kellog Foundation 2004:3
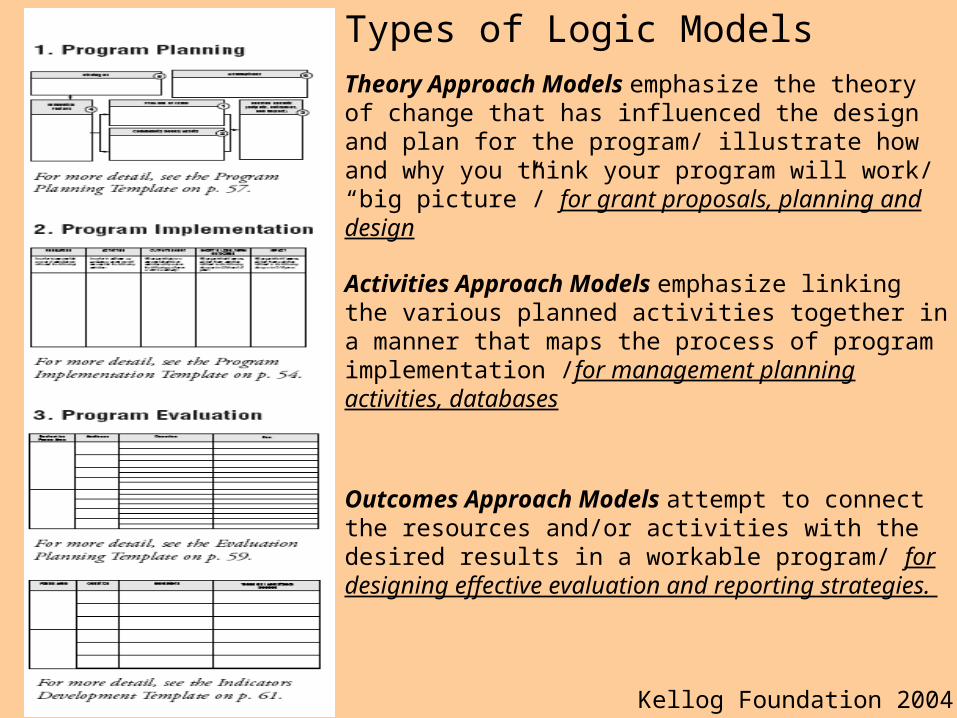
Theory Approach Models emphasize the theory of change that has influenced the design and plan for the program/ illustrate how and why you think your program will work/ “big picture”/ for grant proposals, planning and design
Outcomes Approach Models attempt to connect the resources and/or activities with the desired results in a workable program/ fordesigning effective evaluation and reporting strategies.
Activities Approach Models emphasize linking the various planned activities together in a manner that maps the process of program implementation /for management planning activities, databases
Types of Logic Models
Kellog Foundation 2004
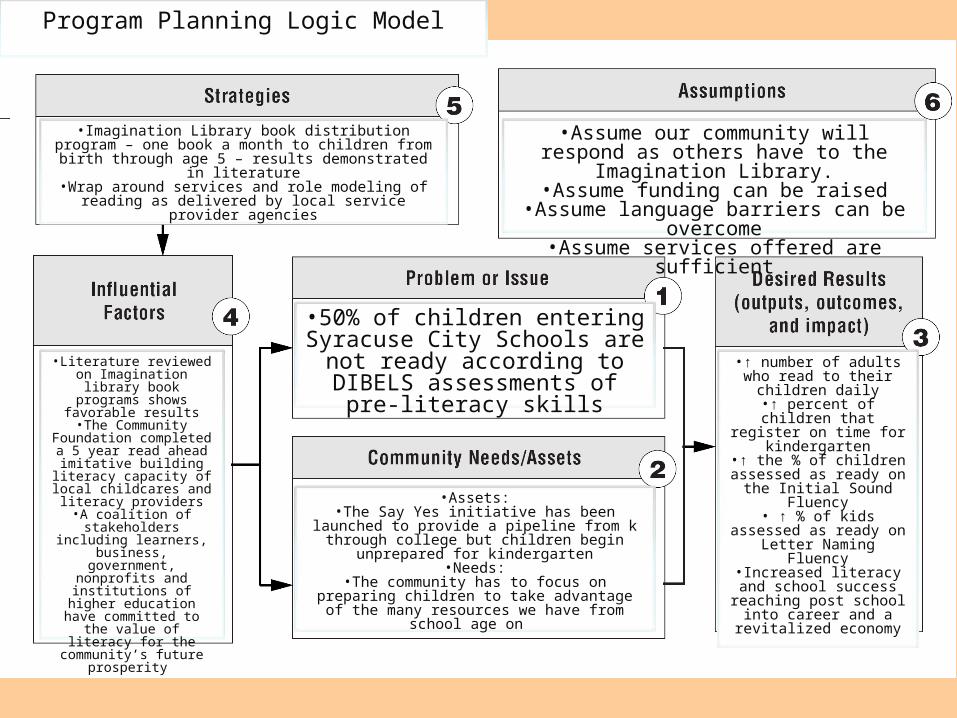
•50% of children entering Syracuse City Schools are not
ready according to DIBELS assessments of pre-literacy skills
•Assets:•The Say Yes initiative has been launched to provide a pipeline from k through college but children begin unprepared for kindergarten
•Needs:•The community has to focus on preparing children to take advantage of the many resources we have
from school age on
•Literature reviewed on Imagination library book
programs shows favorable results
•The Community Foundation completed a 5 year read ahead imitative
building literacy capacity of local childcares and literacy
providers•A coalition of stakeholders
including learners, business, government,
nonprofits and institutions of higher education have
committed to the value of literacy for the community’s
future prosperity
•Imagination Library book distribution program – one book a month to children from birth through age 5 – results
demonstrated in literature•Wrap around services and role modeling of reading as
delivered by local service provider agencies
•Assume our community will respond as others have to the Imagination Library.
•Assume funding can be raised•Assume language barriers can be overcome
•Assume services offered are sufficient
Program Planning Logic Model
•↑ number of adults who read to their children daily•↑ percent of children that
register on time for kindergarten
•↑ the % of children assessed as ready on the
Initial Sound Fluency• ↑ % of kids assessed as ready on Letter Naming
Fluency•Increased literacy and
school success reaching post school into career and
a revitalized economy

Literature Results Strengths Weaknesses
Morgan County Schools (2007)
Kindergarten readiness ↑from 46% to 90% in 3 yrs (scoring 7 or higher on the DIBELS) / 90% reading on grade level by grade 2
Noticed increased community engagement as a result
Not a scientific design
Des Arc Arkansas (2009)
Reading Scores ↑ 12 points on Stanford 10 test
Noted importance of connecting home and school books (90% of kids in district received IL books for 3 yrs)
Not a scientific design
University of Hawaii (2007)
Parents Read to Children more often. Once a day or more ↑ from 52% to 81%
Surveyed all participants, high response rate
Asked participants to compare in retrospect at time 2 (not surveyed both time 1 & 2)
High/Scope Educational Research (2003)
Child Excitement is key, ↑impact on family reading when parents have low education
High response rate Formative evaluation only. No comparison group, biased to include higher SES
Thomason (2008) ↑years of exposure lead to improved home literacy environment
High Response rate, focus on process of family change
Few control variables, focus on process not outcome
Trovillo (2006) Multiple programs can have overlapping effects
Distinguished at risk vs not students
Sample in Jasper Tx too few IL participants
Ferst Found Impact Eval (2008)
Study not completed. Using Peabody and qualitative data
Random Experimental &Control Grp
Control grp gets treatment after 1st year, selection bias only interested included
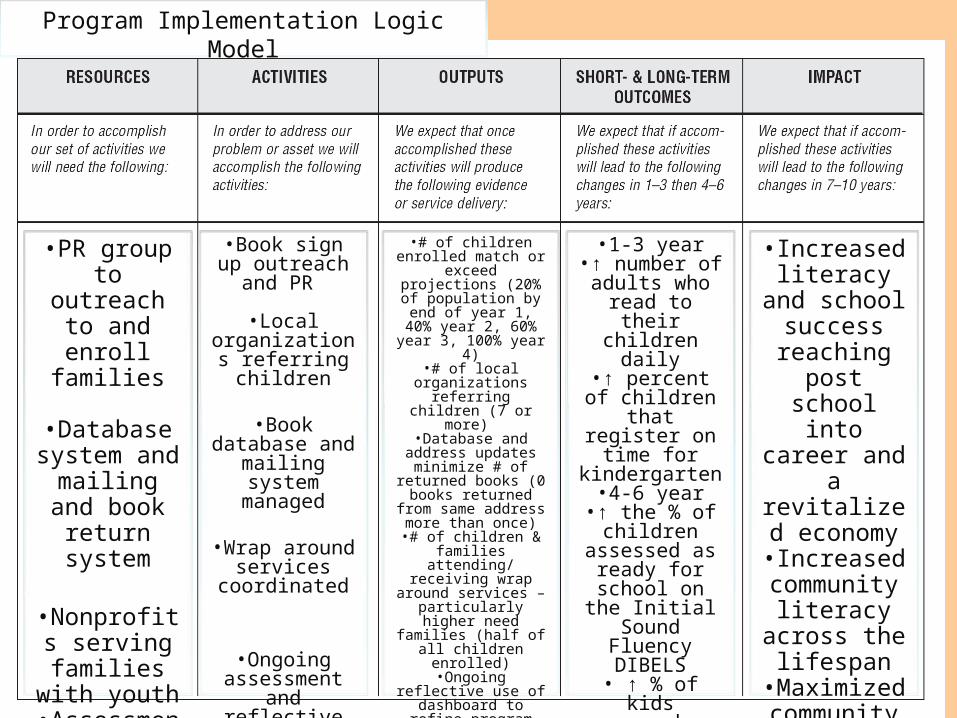
•PR group to outreach to and enroll families
•Database system and mailing and book return
system
•Nonprofits serving
families with youth
•Assessment team
•Book sign up outreach and
PR
•Local organizations
referring children
•Book database and mailing
system managed
•Wrap around services
coordinated
•Ongoing assessment and
reflective evaluation
•# of children enrolled match or exceed
projections (20% of population by end of year 1, 40% year 2,
60% year 3, 100% year 4)
•# of local organizations referring children (7 or
more) •Database and address updates minimize # of
returned books (0 books returned from same address more
than once)•# of children & families
attending/ receiving wrap around services – particularly higher need
families (half of all children enrolled)
•Ongoing reflective use of dashboard to refine
program implementation
(monthly dashboard created)
•1-3 year•↑ number of
adults who read to their children
daily•↑ percent of children that
register on time for kindergarten
•4-6 year•↑ the % of
children assessed as
ready for school on the Initial
Sound Fluency DIBELS
• ↑ % of kids assessed as
ready for school on Letter
Naming Fluency DIBELS
•Increased literacy and
school success
reaching post school into
career and a revitalized economy
•Increased community
literacy across the
lifespan•Maximized community
engagement
Program Implementation Logic Model
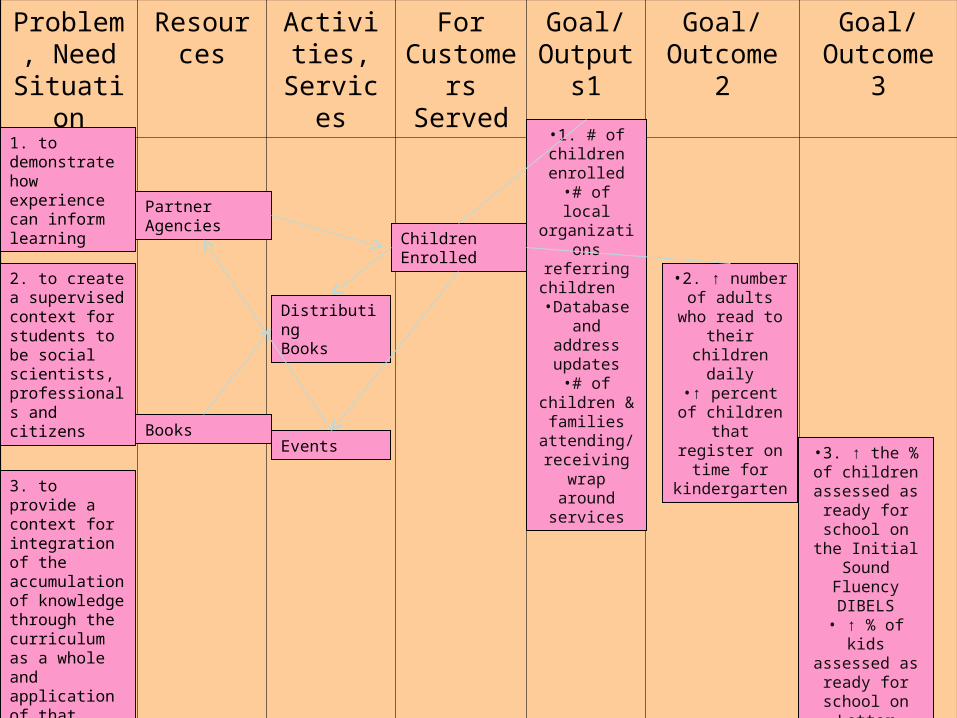
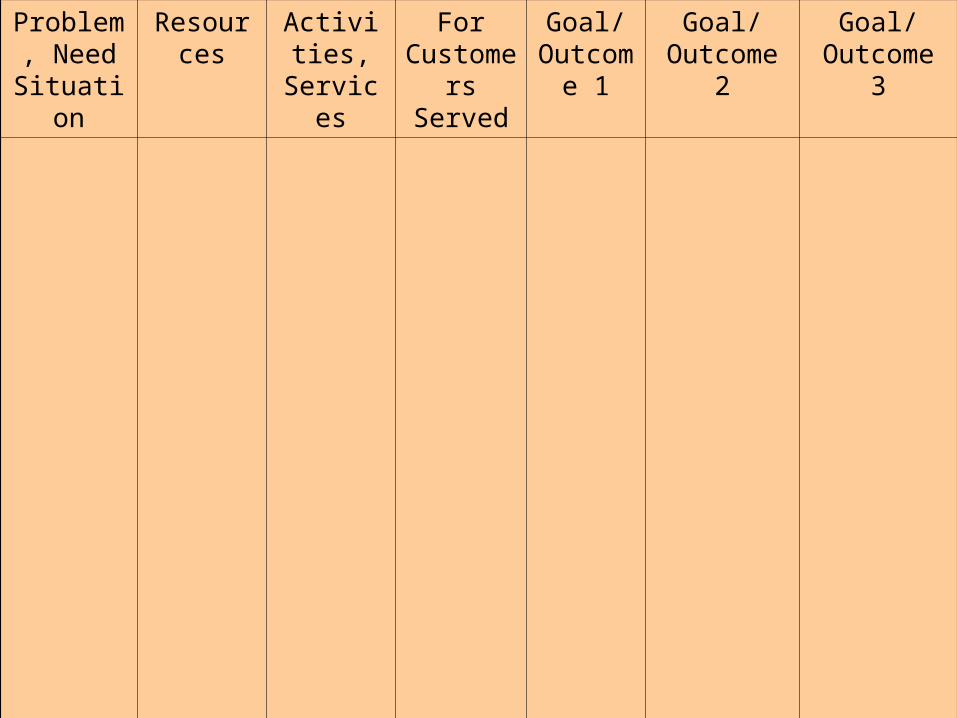
Problem, Need
Situation
Resources Activities, Services
For Customers Served
Goal/ Outputs1
Goal/ Outcome 2
Goal/ Outcome 3
1. to demonstrate how experience can inform learning
2. to create a supervised context for students to be social scientists, professionals and citizens
3. to provide a context for integration of the accumulation of knowledge through the curriculum as a whole and application of that knowledge to job-related settings
•1. # of children enrolled
•# of local organizations
referring children
•Database and address
updates•# of children
& families attending/ receiving
wrap around services
•2. ↑ number of adults who read to their children
daily•↑ percent of children that
register on time for kindergarten
•3. ↑ the % of children
assessed as ready for school
on the Initial Sound Fluency
DIBELS• ↑ % of kids assessed as
ready for school on Letter
Naming Fluency DIBELS
Distributing Books
Children Enrolled
Partner Agencies
BooksEvents

Space reserved for Pre
and post test – read
to child daily
Literacy Coalition of Onondaga County Imagination Library Dashboard July 10 ,2010
$ 29,065

Problem, Need
Situation
Resources Activities, Services
For Customers Served
Goal/ Outcome
1
Goal/ Outcome 2
Goal/ Outcome 3

Problem, Need
Situation
Resources Activities, Services
For Customers Served
Goal/ Outcome
1
Goal/ Outcome 2
Goal/ Outcome 3
1. to demonstrate how experience can inform learning
2. to create a supervised context for students to be social scientists, professionals and citizens
3. to provide a context for integration of the accumulation of knowledge through the curriculum as a whole and application of that knowledge to job-related settings
1. evaluated through student feedback on field placement
2. evaluated by site supervisor evaluation of student work
3. evaluated through student journals and final paper graded by professor
Internships
Students
Faculty
Site Supervisors
Site

ResourcesResources Activities, Services
For Customers
Served
Goal/ Outcome 1
Goal/ Outcome 2
Goal/ Outcome 3
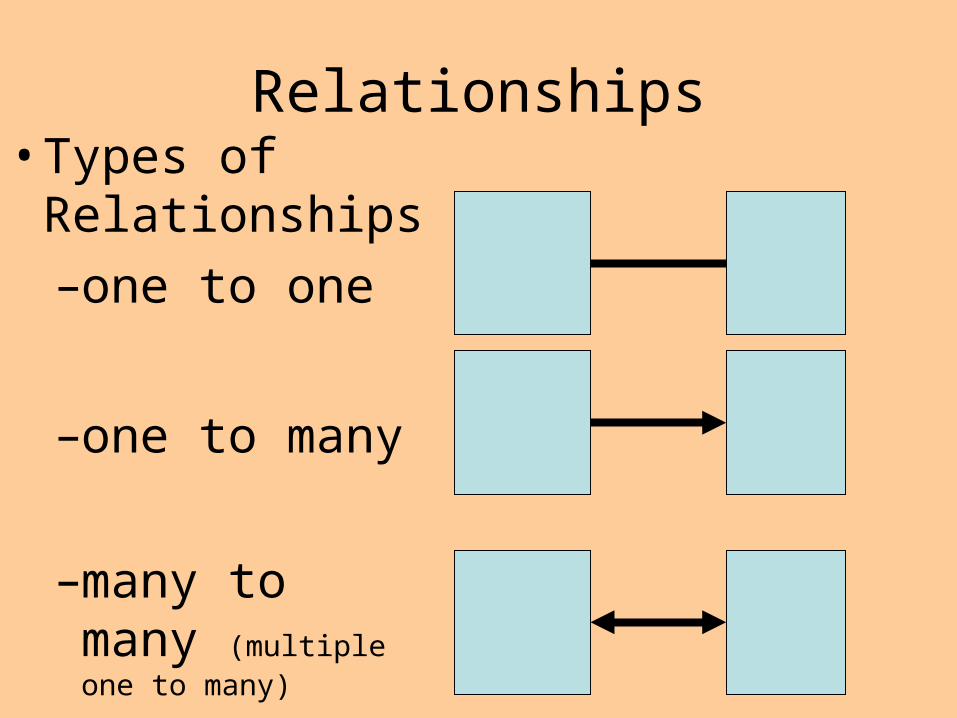
Relationships• Types of
Relationships–one to one
–one to many
–many to many (multiple one to many)


Before we make the E-R diagram, it is
important to review the process of completing
the logic model.
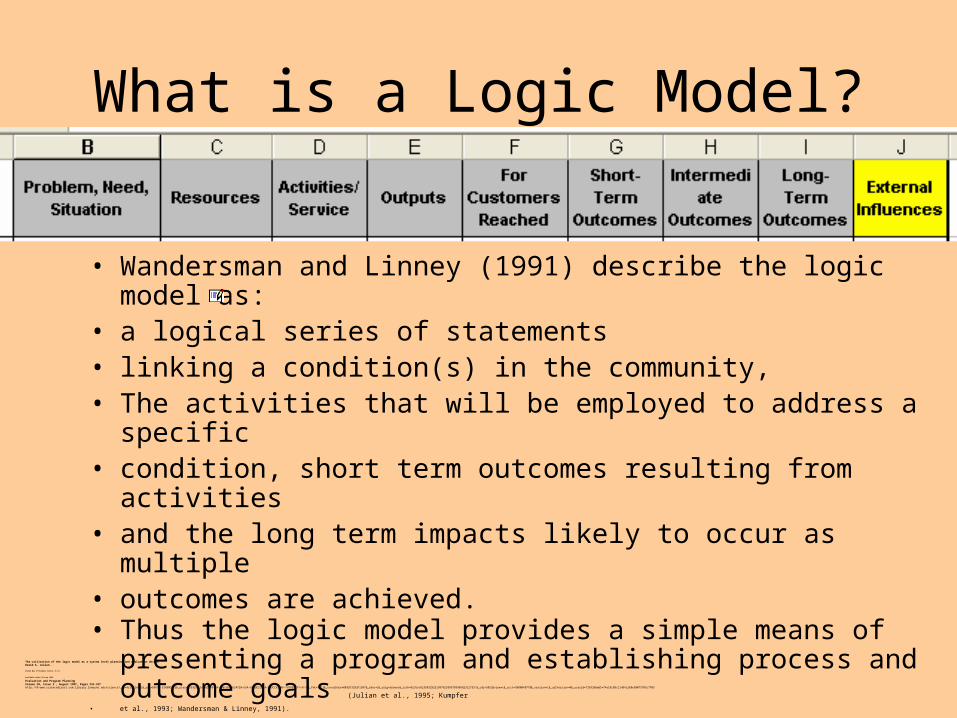
What is a Logic Model?
• Wandersman and Linney (1991) describe the logic model as:
• a logical series of statements • linking a condition(s) in the community, • The activities that will be employed to address a specific• condition, short term outcomes resulting from activities• and the long term impacts likely to occur as multiple• outcomes are achieved. • Thus the logic model provides a simple means of
presenting a program and establishing process and outcome goals (Julian et al., 1995; Kumpfer
• et al., 1993; Wandersman & Linney, 1991).
The utilization of the logic model as a system level planning and evaluation device David A. Julian ,
United Way of Franklin County, U.S.A.
Available online 10 June 1998.
Evaluation and Program Planning Volume 20, Issue 3 , August 1997, Pages 251-257 http://0-www.sciencedirect.com.library.lemoyne.edu/science?_ob=ArticleURL&_udi=B6V7V-3SX0MC6-2&_user=735929&_handle=B-WA-A-W-AY-MsSAYZW-UUA-AAUDEZCWAA-AAUCCVZUAA-YVDVBVZVY-AY-U&_fmt=full&_coverDate=08%2F31%2F1997&_rdoc=2&_orig=browse&_srch=%23toc%235852%231997%23999799996%2312753!&_cdi=5852&view=c&_acct=C000040778&_version=1&_urlVersion=0&_userid=735929&md5=74e18c88c11484c288e50075705c7f03
http://www.sciencedirect.com/science?_ob=ArticleURL&_udi=B6V7V-3WR4K4M-8&_user=735929&_handle=B-WA-A-W-AV-MsSAYZW-UUW-AAUDUAADDV-AAUVCEWCDV-YBACCWCBC-AV-U&_fmt=full&_coverDate=06%2F30%2F1999&_rdoc=8&_orig=browse&_srch=%23toc%235852%231999%23999779998%23102970!&_cdi=5852&view=c&_acct=C000040778&_version=1&_urlVersion=0&_userid=735929&md5=6e6b6f92758532f01a88230d7ec29380
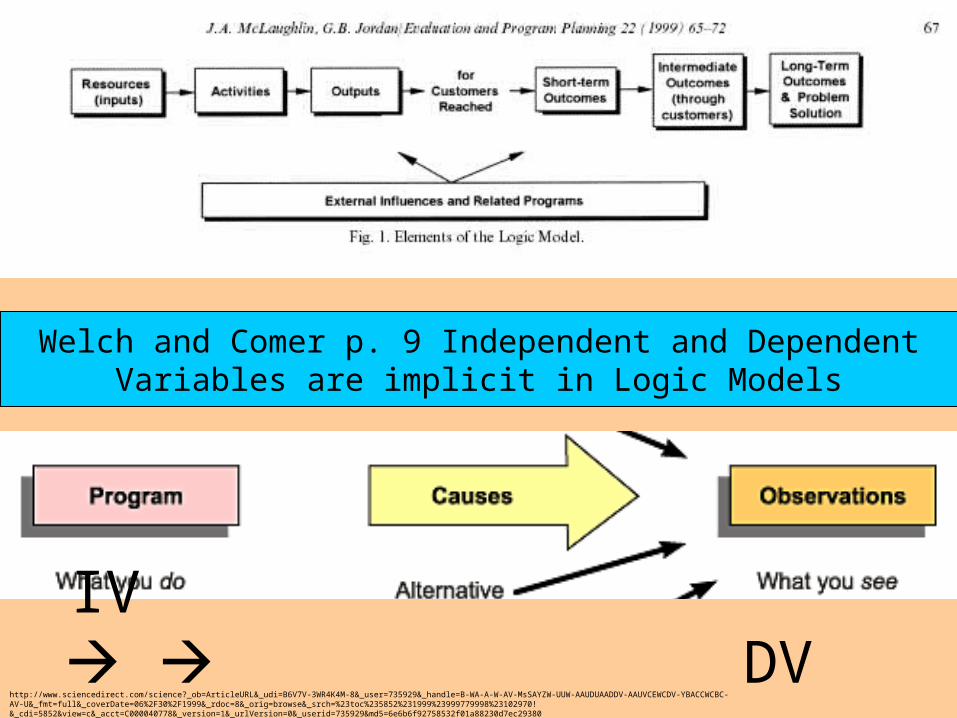
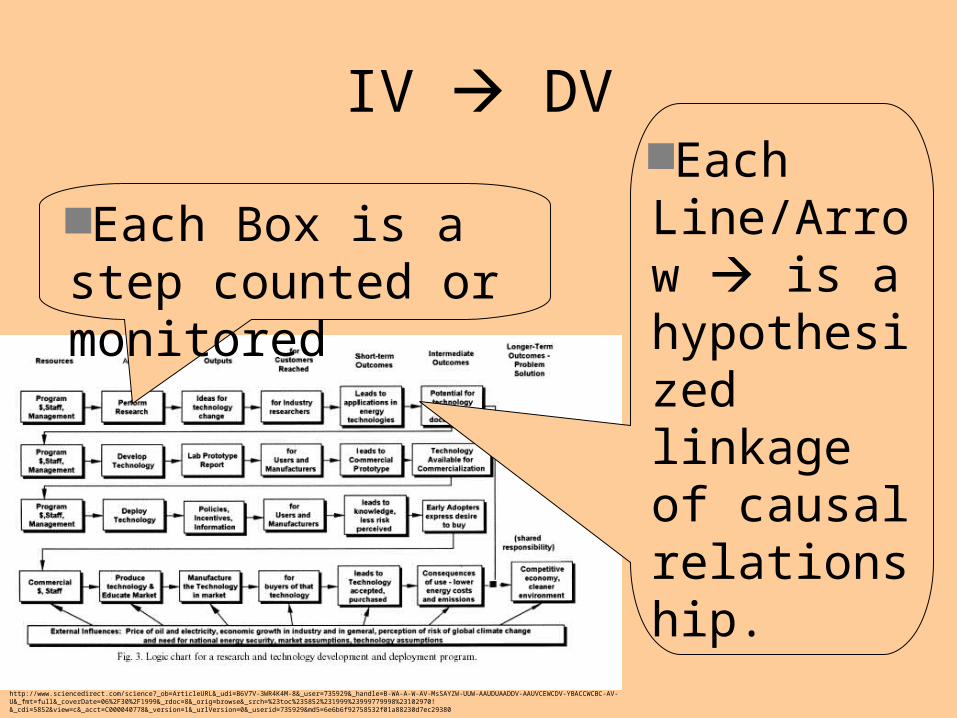
Welch and Comer p. 9 Independent and Dependent Variables are implicit in Logic Models
IV DV
http://www.sciencedirect.com/science?_ob=ArticleURL&_udi=B6V7V-3WR4K4M-8&_user=735929&_handle=B-WA-A-W-AV-MsSAYZW-UUW-AAUDUAADDV-AAUVCEWCDV-YBACCWCBC-AV-U&_fmt=full&_coverDate=06%2F30%2F1999&_rdoc=8&_orig=browse&_srch=%23toc%235852%231999%23999779998%23102970!&_cdi=5852&view=c&_acct=C000040778&_version=1&_urlVersion=0&_userid=735929&md5=6e6b6f92758532f01a88230d7ec29380
Each Box is a step counted or monitored
Each Line/Arrow is a hypothesized linkage of causal relationship.
IV DV

Fig. 1. Elements of the Logic Model.
http://www.sciencedirect.com/science?_ob=ArticleURL&_udi=B6V7V-3WR4K4M-8&_user=735929&_handle=B-WA-A-W-AV-MsSAYZW-UUW-AAUDUAADDV-AAUVCEWCDV-YBACCWCBC-AV-U&_fmt=full&_coverDate=06%2F30%2F1999&_rdoc=8&_orig=browse&_srch=%23toc%235852%231999%23999779998%23102970!&_cdi=5852&view=c&_acct=C000040778&_version=1&_urlVersion=0&_userid=735929&md5=6e6b6f92758532f01a88230d7ec29380
Resources include human and financial resources as well as other inputs required
to support the program such as
partnerships. Information on
customer needs is an essential resource to
the program.
Activities include all
those action steps
necessary to produce program outputs.
Outputs are the products, goods and
services provided to the programs direct
customers. For example, conducting research is an activity and the reports generated for
other researchers and technology developers could be thought of as outputs of
the activity.

Fig. 1. Elements of the Logic Model.
http://www.sciencedirect.com/science?_ob=ArticleURL&_udi=B6V7V-3WR4K4M-8&_user=735929&_handle=B-WA-A-W-AV-MsSAYZW-UUW-AAUDUAADDV-AAUVCEWCDV-YBACCWCBC-AV-U&_fmt=full&_coverDate=06%2F30%2F1999&_rdoc=8&_orig=browse&_srch=%23toc%235852%231999%23999779998%23102970!&_cdi=5852&view=c&_acct=C000040778&_version=1&_urlVersion=0&_userid=735929&md5=6e6b6f92758532f01a88230d7ec29380
Customers, the users of a product
or service.
Outcomes are characterized as
changes or benefits resulting from
activities and outputs. Programs typically
have multiple, sequential outcomes
across the full program performance story.

Fig. 1. Elements of the Logic Model.
http://www.sciencedirect.com/science?_ob=ArticleURL&_udi=B6V7V-3WR4K4M-8&_user=735929&_handle=B-WA-A-W-AV-MsSAYZW-UUW-AAUDUAADDV-AAUVCEWCDV-YBACCWCBC-AV-U&_fmt=full&_coverDate=06%2F30%2F1999&_rdoc=8&_orig=browse&_srch=%23toc%235852%231999%23999779998%23102970!&_cdi=5852&view=c&_acct=C000040778&_version=1&_urlVersion=0&_userid=735929&md5=6e6b6f92758532f01a88230d7ec29380
short term outcomes, those
changes or benefits that are
most closely associated with or caused by the programs outputs
intermediate outcomes, those
changes that result from an application of the short term
outcomes.
Long term outcomes or program impacts, follow
from the benefits accrued though the
intermediate outcomes.
Tip: List out your outcomes them put them in chronological order.

Fig. 1. Elements of the Logic Model.
http://www.sciencedirect.com/science?_ob=ArticleURL&_udi=B6V7V-3WR4K4M-8&_user=735929&_handle=B-WA-A-W-AV-MsSAYZW-UUW-AAUDUAADDV-AAUVCEWCDV-YBACCWCBC-AV-U&_fmt=full&_coverDate=06%2F30%2F1999&_rdoc=8&_orig=browse&_srch=%23toc%235852%231999%23999779998%23102970!&_cdi=5852&view=c&_acct=C000040778&_version=1&_urlVersion=0&_userid=735929&md5=6e6b6f92758532f01a88230d7ec29380
Example from reading:results from a laboratory prototype for an energy saving technology may be a short-term outcome; the commercial scale prototype an intermediate outcome, and a cleaner environment once the technology is in use one of the desired longer term benefits or outcomes.
Tip: List out your outcomes them put them in chronological order.
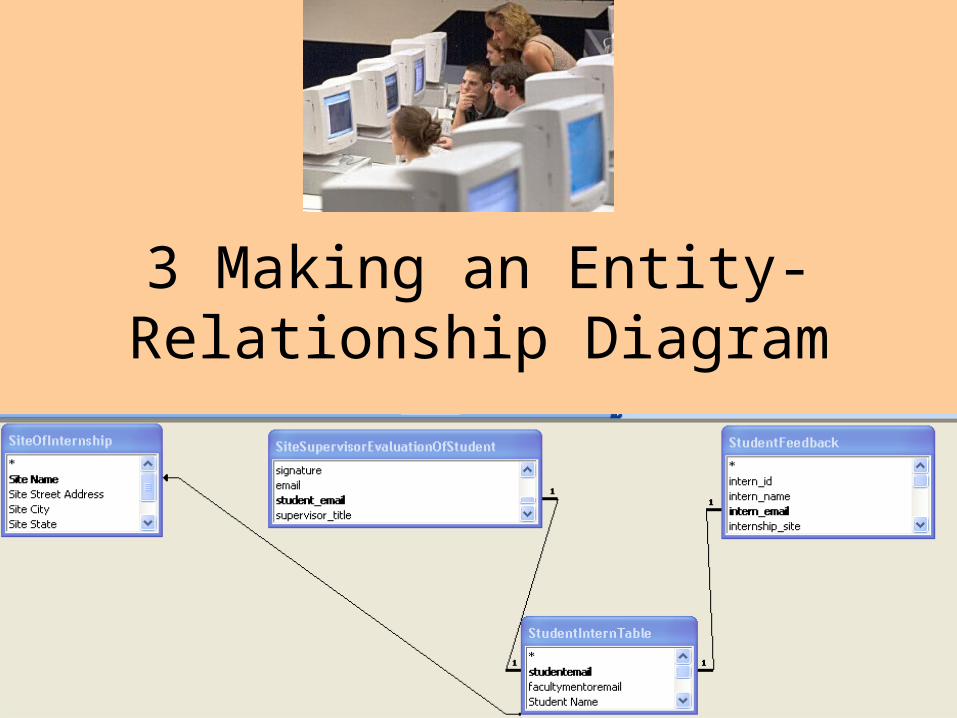
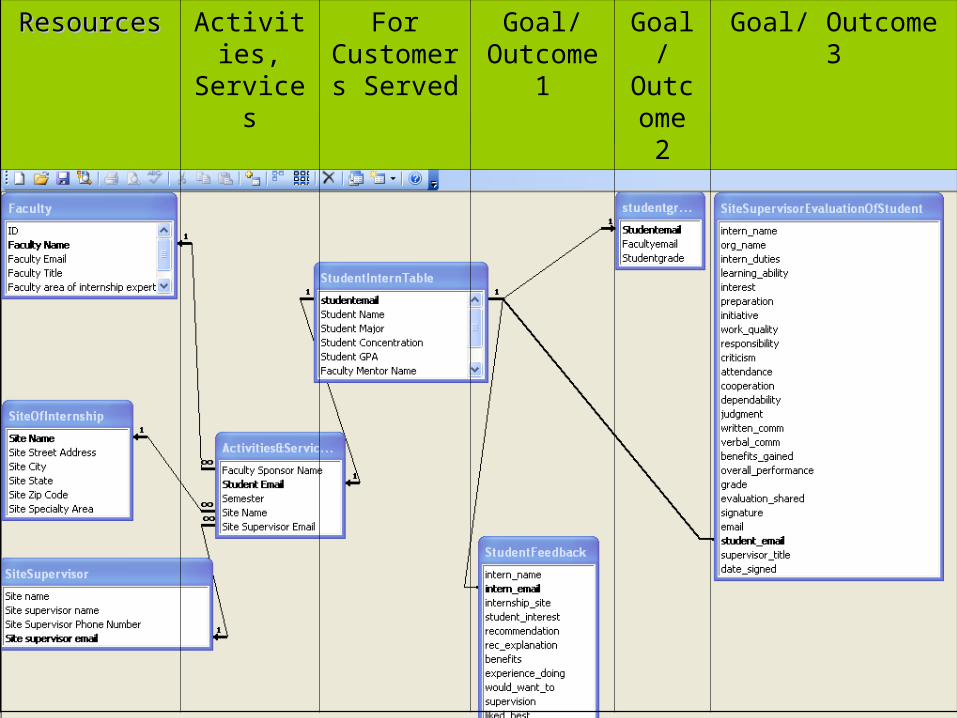
3 Making an Entity-Relationship Diagram
Problem, Need
Situation
Resources Activities, Services
For Customers Served
Goal/ Outcome
1
Goal/ Outcome 2
Goal/ Outcome 3

Problem, Need
Situation
Resources Activities, Services
For Customers Served
Goal/ Outcome
1
Goal/ Outcome 2
Goal/ Outcome 3
1. to demonstrate how experience can inform learning
2. to create a supervised context for students to be social scientists, professionals and citizens
3. to provide a context for integration of the accumulation of knowledge through the curriculum as a whole and application of that knowledge to job-related settings
1. evaluated through student feedback on field placement
2. evaluated by site supervisor evaluation of student work
3. evaluated through student journals and final paper graded by professor
Internships
Students
Faculty
Site Supervisors
Site
ResourcesResources Activities, Services
For Customers
Served
Goal/ Outcome 1
Goal/ Outcome 2
Goal/ Outcome 3


Problem, Need
Situation
Resources Activities, Services
For Customers Served
Goal/ Outcome
1
Goal/ Outcome 2
Goal/ Outcome 3
1. to demonstrate how experience can inform learning
2. to create a supervised context for students to be social scientists, professionals and citizens
3. to provide a context for integration of the accumulation of knowledge through the curriculum as a whole and application of that knowledge to job-related settings
1. evaluated through student feedback on field placement
2. evaluated by site supervisor evaluation of student work
3. evaluated through student journals and final paper graded by professor
Internships
Students
Faculty
Site Supervisors
Site

ResourcesResources Activities, Services
For Customers
Served
Goal/ Outcome 1
Goal/ Outcome 2
Goal/ Outcome 3

Program Implementation Logic Model
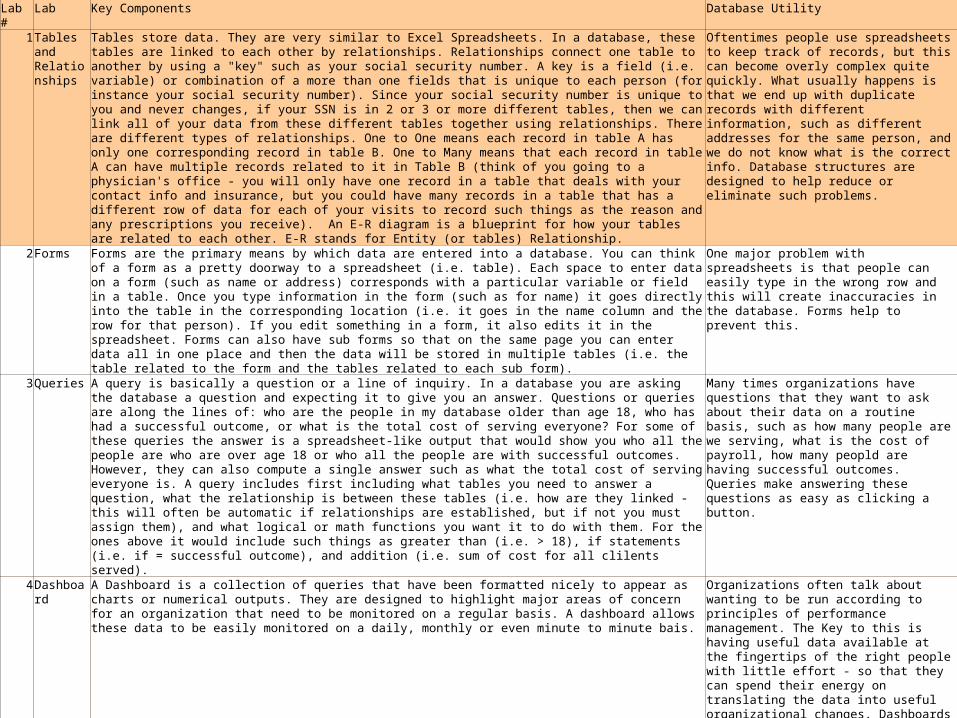
Lab # Lab Key Components Database Utility1Tables and
Relationships
Tables store data. They are very similar to Excel Spreadsheets. In a database, these tables are linked to each other by relationships. Relationships connect one table to another by using a "key" such as your social security number. A key is a field (i.e. variable) or combination of a more than one fields that is unique to each person (for instance your social security number). Since your social security number is unique to you and never changes, if your SSN is in 2 or 3 or more different tables, then we can link all of your data from these different tables together using relationships. There are different types of relationships. One to One means each record in table A has only one corresponding record in table B. One to Many means that each record in table A can have multiple records related to it in Table B (think of you going to a physician's office - you will only have one record in a table that deals with your contact info and insurance, but you could have many records in a table that has a different row of data for each of your visits to record such things as the reason and any prescriptions you receive). An E-R diagram is a blueprint for how your tables are related to each other. E-R stands for Entity (or tables) Relationship.
Oftentimes people use spreadsheets to keep track of records, but this can become overly complex quite quickly. What usually happens is that we end up with duplicate records with different information, such as different addresses for the same person, and we do not know what is the correct info. Database structures are designed to help reduce or eliminate such problems.
2Forms Forms are the primary means by which data are entered into a database. You can think of a form as a pretty doorway to a spreadsheet (i.e. table). Each space to enter data on a form (such as name or address) corresponds with a particular variable or field in a table. Once you type information in the form (such as for name) it goes directly into the table in the corresponding location (i.e. it goes in the name column and the row for that person). If you edit something in a form, it also edits it in the spreadsheet. Forms can also have sub forms so that on the same page you can enter data all in one place and then the data will be stored in multiple tables (i.e. the table related to the form and the tables related to each sub form).
One major problem with spreadsheets is that people can easily type in the wrong row and this will create inaccuracies in the database. Forms help to prevent this.
3Queries A query is basically a question or a line of inquiry. In a database you are asking the database a question and expecting it to give you an answer. Questions or queries are along the lines of: who are the people in my database older than age 18, who has had a successful outcome, or what is the total cost of serving everyone? For some of these queries the answer is a spreadsheet-like output that would show you who all the people are who are over age 18 or who all the people are with successful outcomes. However, they can also compute a single answer such as what the total cost of serving everyone is. A query includes first including what tables you need to answer a question, what the relationship is between these tables (i.e. how are they linked - this will often be automatic if relationships are established, but if not you must assign them), and what logical or math functions you want it to do with them. For the ones above it would include such things as greater than (i.e. > 18), if statements (i.e. if = successful outcome), and addition (i.e. sum of cost for all clilents served).
Many times organizations have questions that they want to ask about their data on a routine basis, such as how many people are we serving, what is the cost of payroll, how many peopld are having successful outcomes. Queries make answering these questions as easy as clicking a button.
4Dashboard A Dashboard is a collection of queries that have been formatted nicely to appear as charts or numerical outputs. They are designed to highlight major areas of concern for an organization that need to be monitored on a regular basis. A dashboard allows these data to be easily monitored on a daily, monthly or even minute to minute bais.
Organizations often talk about wanting to be run according to principles of performance management. The Key to this is having useful data available at the fingertips of the right people with little effort - so that they can spend their energy on translating the data into useful organizational changes. Dashboards provide an effective way to do this.
5Main Page A Main Page is basically a form that has buttons on it so that a person who opens a database can then select where they want to go to enter data, what types of querries they want to run, or whether they want to run a particulare dashboard. Creating one involves making buttons and then making macros linked to those buttons that do a series of things that will bring the database user to where they want to be in a database.
There are many different staff roles in an organization and they each use a database in a different way. Some people only do data entry, others only use the data to manage others. A Main Page brings each person to where they need to be.
6Uploading Fake Data to Test Database
Databases are helpful because they not only accept data that is entered in them manually through forms, but they can also accept large batches of data from other places or other databases. These often come in the form of a spreadsheet. Data such as the fake data seen here, can be uploaded into a database from multiple sources. Once the data are uploaded, you can use a database to link the data and create queries and dashboards using these data.
Many times data comes from all over or you need to buy a new database and migrate things from the old one to the new one. Uploading as shown here addresses this need.


