Lecture # 11
Batteries & Energy Storage
Ahmed F. Ghoniem March 9, 2020
• Storage technologies, for mobile and stationary applications ..• Batteries, primary and secondary, their chemistry.• Thermodynamics and electrochemistry• Performance, ….
© Ahmed F. Ghoniem 1
THE RAGONE DIAGRAM is more applicable to mobile applications. Electric mobility is totally dependent on battery storage.
an important definition: Round trip efficiency: ηround = ηch arg eηdisch arg e
For stationary applications, criteria for selection and hence technologies can be very different.
© Source unknown. All rights reserved. This content is excluded from our Creative Commons license. For more information, see https://ocw.mit.edu/fairuse.
THE RAGONE DIAGRAM. Figure shows approximate estimates for peak power density and specific energy for a number of storage technology mostly for mobile applications.
2
Round-trip efficiency of electrical energy storage technologies. Markers show efficiencies ofplants which are currently in operation.
Courtesy Elsevier, Inc., http://www.sciencedirect.com. Used with permission.
Xing Luo, et al. Applied energy, 137:511–536, 2015.Niklas Hartmann, et al. Applied Energy, 93:541–548, 2012.Behnam Zakeri and Sanna Syri. 42:569–596, 2015.
3
Energy Storage: Overview and other options
Characteristic PHS CAES Batteries Flywheel
The table shows technologies for stationary and mobile applications including mechanical and electrochemical. Capacitors are integral parts of mobile storage!
Energy Range (MJ)
Power Range (MW)
Overall Cycle Efficiency
Charge/Discharge Time
1.8x10⁶-36x106
100-1000
64-80%
Hours
180,000-18x106
100-1000
60-70%
Hours
1,800 – 180,000 0.1 – 10
~75%
Hours
1 – 18,000
1-10
~90%
Minutes
Not inclusive and other options are available and under development.
Cycle Life
Footprint/Unit Size
10,000
Large if above
10,000
Moderate if under ground
2,000
Small
10,000
Small
Does not show thermal (storage) and Siting Ease
ground Difficult Difficult- N/A N/A
chemical (hydrogen, fuels and Moderate
thermochemical) options which are very important.
Maturity Mature Development Mature except for flow type
Development
Prices change constantly but comparison is still reasonable.
Estimated Capital Costs
- Power ($/kWe)
Estimated Capital Costs
600 – 1,000 10 - 15
500-1,000
10 - 15
100-200 (LA) 150-300
200 - 500
100 - 800 - Energy ($/kWh)
4
Both images © Source unknown. All rights reserved. This content is excluded from our
Batteries
• Similar to fuel cells in that they convertchemical to electrical energy directly, and thesecondary type can reverse the reactions
• But they store their chemicals internally intheir electrodes (except for flow batteries)
• Have seen a very wide range of applications,at many scales for centuries!
• Still relatively expensive for large scalesstorage deployment, although convenient.
• Also heavier than ideal in mobile application.• Must be carefully managed thermally to avoid
thermal run away and fires.Creative Commons license. For more information, see https://ocw.mit.edu/fairuse.
© Ahmed F. Ghoniem 5
Primary Batteries: the alkaline dry cell
Zn(s) +2MnO(s) → ZnO(s) +Mn2O3(s) Non conducting tube Carbon (graphite)
electrode surrounded by carbon and manganese anode: Zn(s) + 2OHaq
− → ZnO(s) + H2O(l ) + 2e−
oxide acting as the cathode cathode: 2MnO2(s) + H2O(l) + 2e− → Mn2O3(s) + 2OHaq
− _ +
oΔG = −277kJ / mol, ne = 2 Zinc metal sleeve R acts as the anode Electrolyte contains potassium 277000 hydroxide, zinc chloride and Δεo = 1.44V water 96485 × 2
=
A schematic drawing showing the internal detail of an alkaline battery Zn: Zink Mn: Manganese
© by Ahmed F. Ghoniem 6
Secondary Batteries: The Lead Acid Battery (look under the hood)
a lead electrode and a lead oxide electrode are immersed in sulfuric acid-water solution During discharge: Pb(s) + PbO2(s) + 2H2SO4(aq) → PbSO4(s) + 2H2O(aq)
The Redox reactions: 2− → PbSO4(s) + 2e -Pb(s) + SO4(aq)
PbO2(s) + 4H+ + SO24 − + 2e− → PbSO4(s) + 2H2O(l)
Δε = 2.04V
During charging, the above reactions are reversed by applying an external voltage. Lead acid batteries charge below this value to prevent water electrolysis can be dangerous but used extensively in cars, etc.
© Source unknown. All rights reserved. This content is excluded from our Creative Commons license. For more information, see https://ocw.mit.edu/fairuse.
7 © by Ahmed F. Ghoniem
Lithium-ion batteries
• During operation, reversible Li+ intercalation (insertion) into the layered electrodes’ materials (leaving graphite anode during discharge).
• The overall reaction, where x is the fraction of the anode Li leaving and joining the cathode lithium cobalt oxide:
!"#$% + !"'(#$)*+ ↔ $% + !"$)*+
• Forward reaction: discharge (∆. < 0), Li+ move towards cathode, as shown in figure
• Reverse reaction: charge (∆. > 0) © American Chemical Society. All rights reserved. This content is excluded from our Creative Commons license. For more information, see https://ocw.mit.edu/fairuse.
• Anode (-ve electrode, electrons leaving): Li metal and graphite • Cathode (+ve electrode, electrons returning): Metal oxides (MnO2, CoO2, LiFePO4) • Electrolyte: Organic solvents, carbonates and lithium salts (LiPF6) • Current collectors, Cu on the anode side and Al on the cathode side.
Goodenough and Park, JACS 135 (2013): 1167
Xu, K. Electrolytes and interphases in Li-ion batteries and beyond. Chem. Rev. 114, 11503–11618 (2014).
8
Lithium-ion batteries
During discharge (cobalt cathode): +Anode: xLi(s) (C) → xLi(sol) +xe- + (C)
Cathode: xLi++xe- + Li1-xCoO2(s) → LiCoO2(s)
Overall: Li(s) + CoO2(s) → LiCoO2(s)
The backward reactions occur during charging.
Material Theoretical Voltage V
Theoretical specific energy Wh/kg
Li/CoO2 3.6 570 Li/Mn2O4 4 593
Lithium is single valent, giving up a single electron during discharging (more advanced batteries would use multi valent metal such as magnesium).
Li-Mn battery during discharge: Li ions move from –ve electrode (anode) to +ve electrode (cathode) through solid or liquid electrolyte
9 “Batteries, Overview” by E Cairns, Encyclopedia of Energy, V 1, 2004, Elsevier.
Courtesy Elsevier, Inc., http://www.sciencedirect.com. Used with permission.
Specific Energy
The theoretical specific energy is −ΔGR / ∑ Miwhere the sum is taken over all the reactants (and products) in the redox reaction.
This expression ignores the mass of the battery housing, inert electrode material and electrolytes.
Actual specific energy is 20-35% of this value because of the weight of these components and the energy losses
(Elton j Cairns, “Batteries, Overview, Encyclopedia of Energy, Vol 1, 2004 , Elsevier Inc) Courtesy Elsevier, Inc., http://www.sciencedirect.com. Used with permission.
© Ahmed F. Ghoniem 10
Battery Materials
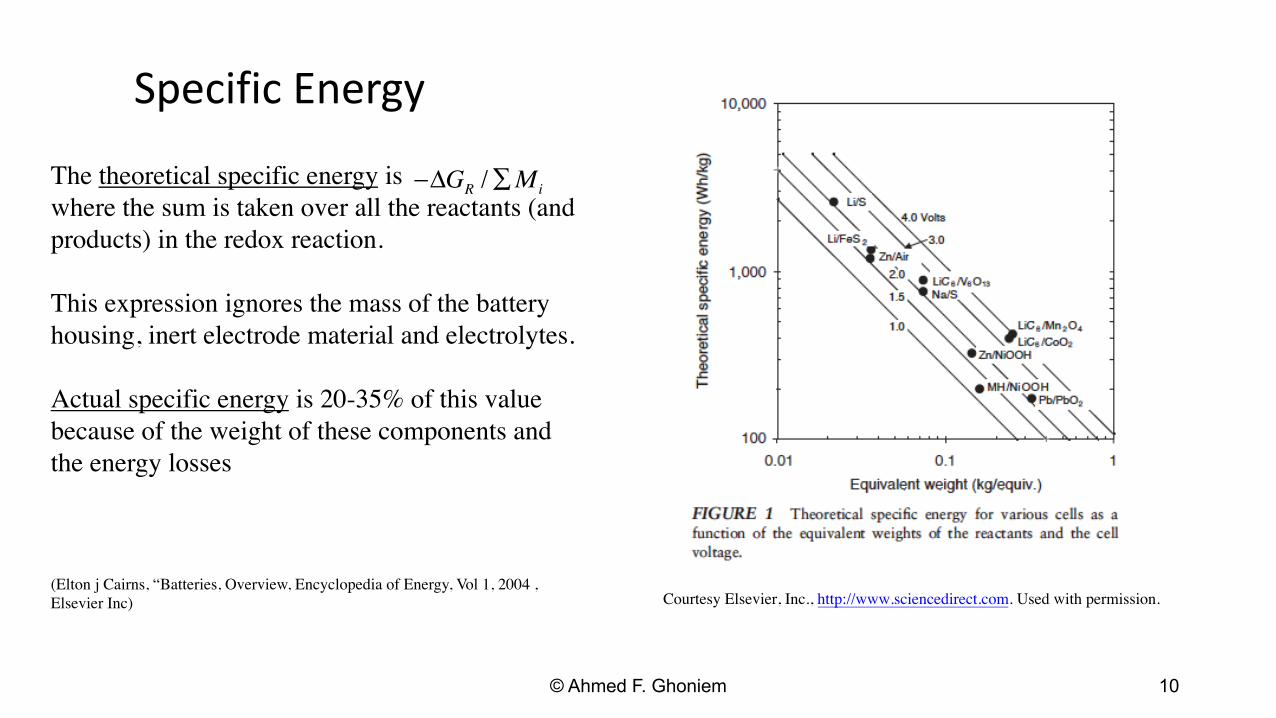
Electrode materials are selected to maximize the theoretical specific energy of the battery, using reactants/reactions with a large (-ve) DG and light weight (small SM).
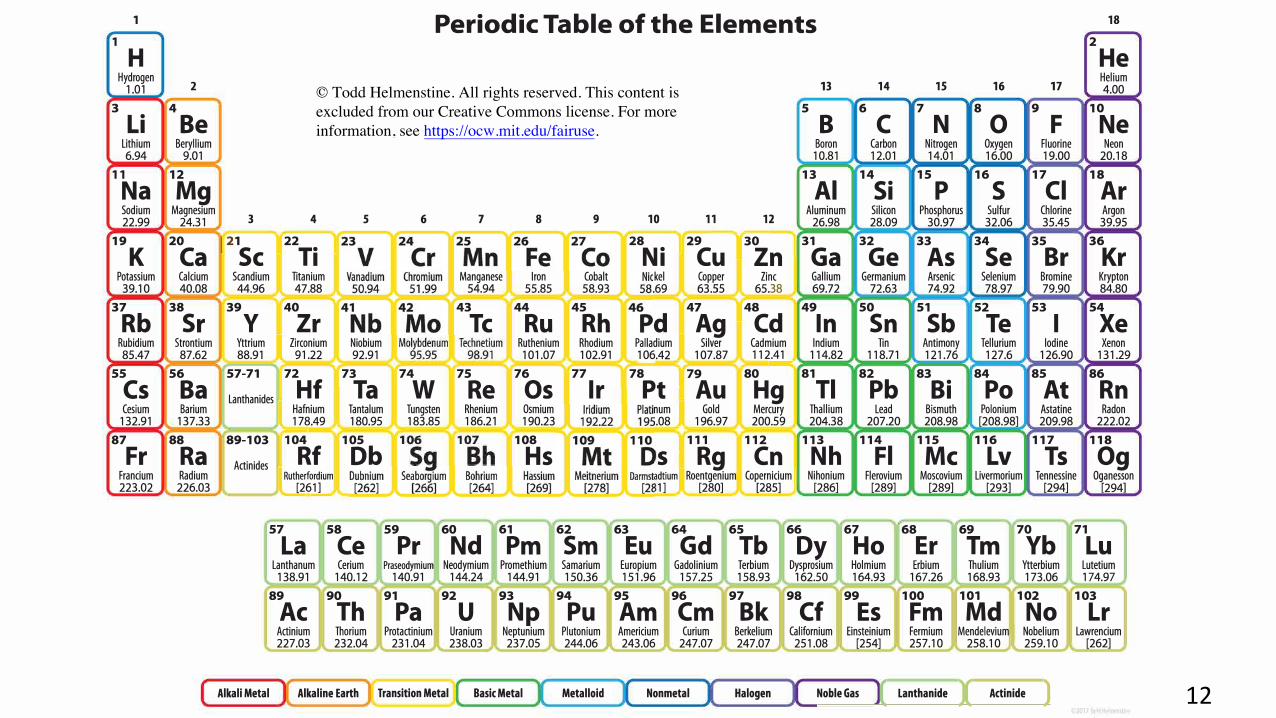
• Negative electrode (anode) reactants that can give up electrons easily have large (-ve) DG. These elements are located on the LHS of the periodic table.
• Elements with a low MW are located toward the top of the periodic table. • Positive electrode (cathode) reactants (oxides) should readily accept electrons. These elements
are located on the RHS of the periodic table.
(Elton j Cairns, “Batteries, Overview, Encyclopedia of Energy, Vol 1, 2004 , Elsevier Inc)
© Ahmed F. Ghoniem 11
- --
--
37
94
1 Periodic Table of the Elements 18
1
H 2
He Hydrogen Helium
2 13 14 15 16 171.01 4.00© Todd Helmenstine. All rights reserved. This content is3 4 5 6 7 8 9 10excluded from our Creative Commons license. For more
Li Be information, see https://ocw.mit.edu/fairuse. B C N 0 F Ne Lithium Beryllium Boron Carbon Nitrogen Oxygen Fluorine Neon 6.94 9.01 10.81 12.01 14.01 16.00 19.00 20.18
11 12 13 14 15 16 17 18
Na Mg Al Si p s Cl Ar Sodium Magnesium Aluminum Silicon Phosphorus Sulfur Chlorine Argon
3 4 5 6 7 8 9 1 0 11 1222.99 24.31 26.98 28.09 30.97 32.06 35.45 39.95
19 20 121 n22 28 2 31 32 33 34 35 361 9 n3o lK Ca Sc Ti l
N i Cu Zn Ga Ge As Se Br Kr Potassium Calcium Scandium Titanium Manganese Iron Cobalt kel Copper lnc Gallium Germanium Arsenic Selenium Bromine Krypton
L_ 39.10 40.08 44.96 47.88 54.94 55.85 58.93 .69 63.S� 65.� 69.72 72.63 74.92 78.97 79.90 84.80
Rb 38 39 40 43 44 45 4 4 49 50 51 52 53 54
Sr y Zr Tc Ru Rh Ag n In Sn Sb Te Xed Cdu
I Rubidium Strontium Yttrium Zirconium Niobium Ruthenium Rhodium Palladium � Silver Cadmium Indium Tin Antimony Tellurium Iodine Xenon
91.22 92.91 101.07 102.91 106.42 107.87 112.41 114.82 118.71 121.76 127.6 126.90 131.2985.47 87.62 88.91 ""'=
55 56 57-71 p2 73 74 75 76 77 78 80 81 82 83 84 85 86
Cs Ba Hf Ta w Re Os Ir pt J]79Au Hg Tl Pb Bi Po At RnLanthanides Cesium Barium Hafnium Tantalum Tungsten Rhenium Osmium num � Gold Mercury Thallium Lead Bismuth Polonium Astatine Radon[132.91 137.33 178.49 180.95 183.85 186.21 190.23 .08 196.97 200.5.2..... 204.38 207.20 208.98 [208.98) 209.98 222.02
_........;;.a;
87 88 89-103 po4 105 108 J]111 112 113 114 115 116 117 118
Fr Ra Rf Db Hs s Rg Cn Nh Fl Mc Lv Ts OgActinides Francium Radium tRutherfordiumj adtiuml RoentgeniumJ Copernicium j Nihonium Flerovium Moscovium Livermorium Tennessine Oganesson223.02 226.03 [261] lL _j280L _£SSL [286) [289) [289] [293] [294] [2941
57 58 59 60 61 62 63 64 65 66 67 68 69 70 71
La Ce Pr Nd Pm Sm Eu Gd Tb Dy Ho Er Tm Yb Lu Lanthanum Cerium Praseodymium Neodymium Promethium Samarium Europium Gadolinium Terbium Dysprosium Holmium Erbium Thulium Ytterbium Lutetium 138.91 140.12 140.91 144.24 144.91 150.36 151.96 157.25 158.93 162.50 164.93 167.26 168.93 173.06 174.97
Es89 90
ThAc 91 92
Pa u 93
Np Pu 95 96 97 98 99
Am Cm Bk Cf 100 101 102 103
Fm Md No Lr Actinium 227.03
Thorium 232.04
Protactinium 231.04
Uranium 238.03
Neptunium237.05
Plutonium 244.06
Americium 243.06
Curium 247.07
Berkelium 247.07
Californium 251.08
Einsteinium [254)
Fermium 257.10
Mendelevium 258.10 j
Nobelium 259.10
Lawrencium [262]
Alkali Metal Alkaline Earth Transition Metal Basic Metal Metalloid Nonmetal Halogen Noble Gas I Lanthanide I Actinide ) 12 L017 c � ,ensti
Lead-acid, nickel-metal (Cd/Fe/Mn) hydrite and Zinc batteries.
• Th round-trip efficiency ofbatteries ranges between 70% fornickel/metal hydride and morethan 90% for lithium-ion batteries.
• This is the ratio between electricenergy out during discharging tothe electric energy in duringcharging.
• The battery efficiency can changeon the charging and discharging rates because of the dependency of losses on the current.
Some rechargeable aqueous batteries
System Cell Theoretical Actual Specific Cycle life voltage specific specific power [V] energy energy [W/kg]
[Wh/kg]) [Wh/kg]
Pb/PbO2 2.1 175 30-45 50-100 >700Cd/NiOOH 1.2 209 35-55 400 2000Fe/NiOOH 1.3 267 40-62 70-150 500-2000H2/NiOOH 1.3 380 60 160 1000-2000Zn/NiOOH 1.74 326 55-80 200-300 500Zn/Air 1.6 1200 65-120 <100 300
Courtesy Elsevier, Inc., http://www.sciencedirect.com. Used with permission.
Elton j Cairns, “Batteries, Overview, Encyclopedia of Energy, Vol 1, 2004 , Elsevier Inc
The power density is ~ O(20 kW/100kg), need ~ 500 kg to power a 100 kW motor. 13
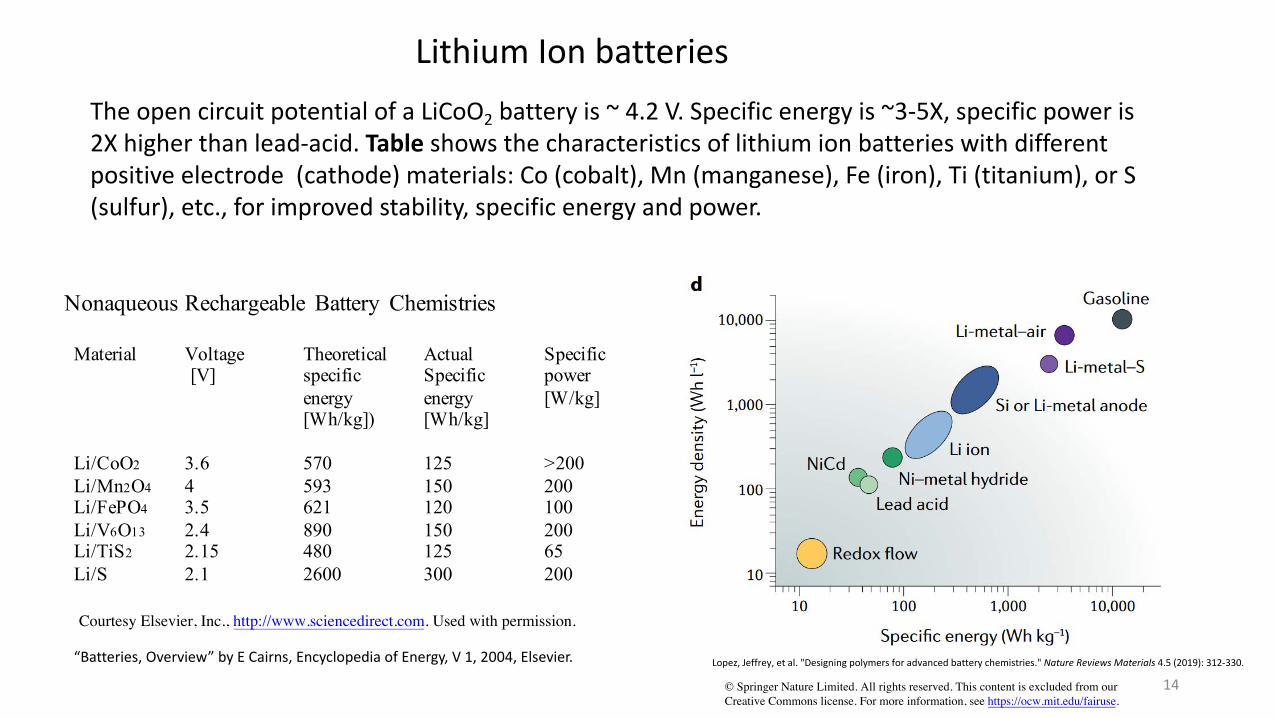
Lithium Ion batteries The open circuit potential of a LiCoO2 battery is ~ 4.2 V. Specific energy is ~3-5X, specific power is 2X higher than lead-acid. Table shows the characteristics of lithium ion batteries with different positive electrode (cathode) materials: Co (cobalt), Mn (manganese), Fe (iron), Ti (titanium), or S (sulfur), etc., for improved stability, specific energy and power.
Nonaqueous Rechargeable Battery Chemistries
Material Voltage Theoretical Actual Specific [V] specific Specific power
energy energy [W/kg] [Wh/kg]) [Wh/kg]
Li/CoO2 3.6 570 125 >200Li/Mn2O4 4 593 150 200Li/FePO4 3.5 621 120 100Li/V6O13 2.4 890 150 200Li/TiS2 2.15 480 125 65Li/S 2.1 2600 300 200
“Batteries, Overview” by E Cairns, Encyclopedia of Energy, V 1, 2004, Elsevier. Lopez, Jeffrey, et al. "Designing polymers for advanced battery chemistries." Nature Reviews Materials 4.5 (2019): 312-330.
© Springer Nature Limited. All rights reserved. This content is excluded from our 14 Creative Commons license. For more information, see https://ocw.mit.edu/fairuse.
Courtesy Elsevier, Inc., http://www.sciencedirect.com. Used with permission.
finite current performance
© PECS. All rights reserved. This content is excluded from our Creative Commons license. For more information, see https://ocw.mit.edu/fairuse.
The i-V curve of a battery resembles that of a fuel cell, with similar loss mechanisms affecting the performance at higher currents.
Cho et al., PECS 48 (2013) 84
© Source unknown. All rights reserved. This content is excluded from our Creative Commons license. For more information, see https://ocw.mit.edu/fairuse.
• Since all the reactants are stored internally, performance can change with degree of discharge.
• As more current is drawn from a battery, the reactants concentrations drop (and products concentrations increase) leading to significant increase in concentration overpotential and performance degradation under deep discharge conditions.
15
Redox Flow Batteries, the All-Vanadium design
© PECS. All rights reserved. This content is excluded from our Creative Commons license. For more information, see https://ocw.mit.edu/fairuse.
Cho et al., PECS 48 (2013) 84
16
MIT OpenCourseWare https://ocw.mit.edu/
2.60J Fundamentals of Advanced Energy Conversion Spring 2020
For information about citing these materials or our Terms of Use, visit: https://ocw.mit.edu/terms.