Lecture 13 LabVIEW and GPIB •LabVIEW (National Instruments) –Graphical program language –Widely used in academia (lab) and industry (R&D) •General Purpose Interface Bus (GPIB) –Hewlett-Packard Interface Bus (HP-IB) –IEEE 488 Bus –IEEE 488.2 Bus
Transcript
Lecture 13 LabVIEW and GPIB
• LabVIEW (National Instruments)– Graphical program language– Widely used in academia (lab) and industry (R&D)
• General Purpose Interface Bus (GPIB)– Hewlett-Packard Interface Bus (HP-IB) – IEEE 488 Bus– IEEE 488.2 Bus
Generic physics experimental setup
Analog amplifierssensors
ADC
Automatic data acquisition
DAC01010
Actuator,Heater…
control
Power amplifiers
LabVIEWGPIB
GPIB
General Purpose Interface Bus (GPIB)
PCI
USB
cable
connector
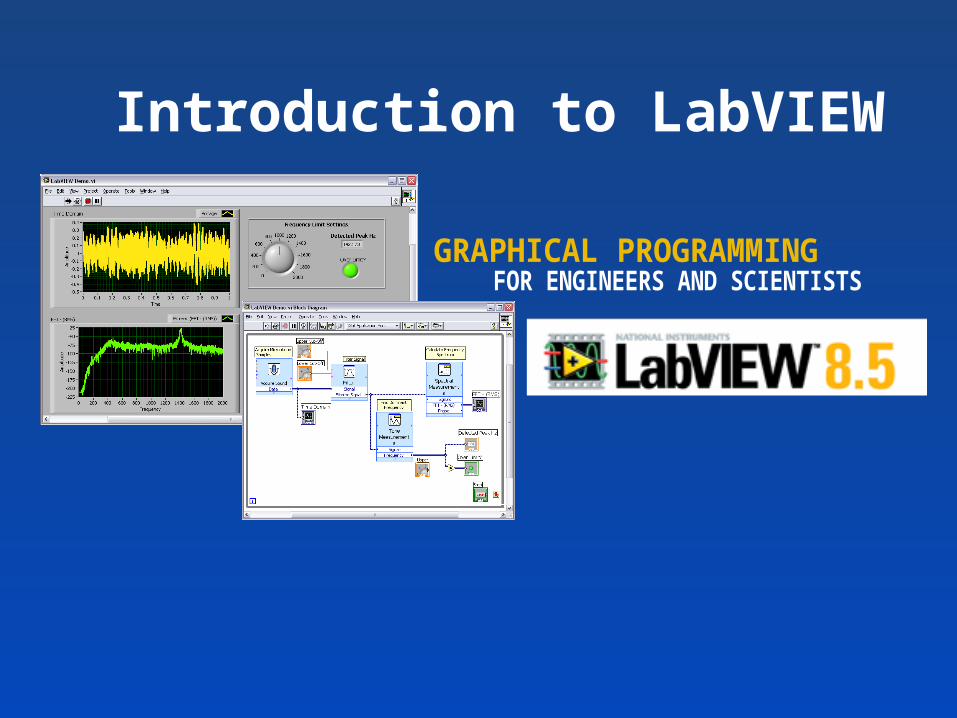
Introduction to LabVIEW
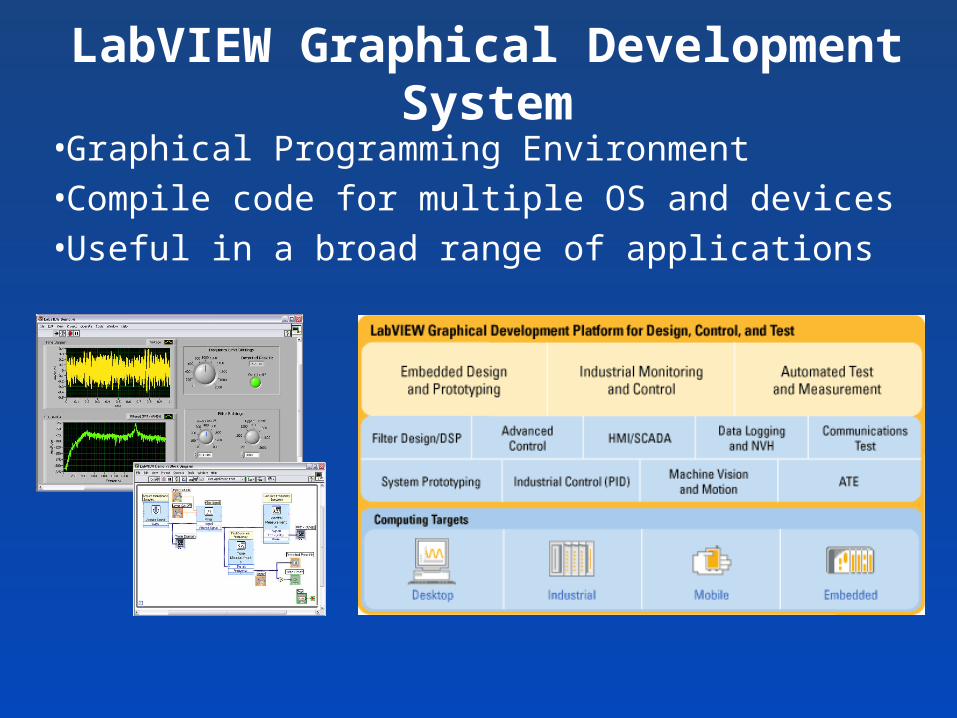
LabVIEW Graphical Development System
• Graphical Programming Environment• Compile code for multiple OS and devices• Useful in a broad range of applications
LabVIEW Environment
A. Measurement & Automation Explorer (MAX)B. LabVIEW Environment
• Front Panel / Block Diagram• Toolbar /Tools Palette
C. Components of a LabVIEW Application• Creating a VI• Data Flow Execution
D. Additional Help• Finding Functions• Tips for Working in LabVIEW
What is MAX?• MAX stands for Measurement & Automation Explorer.• MAX configures and organizes all your National Instruments DAQ,
PCI/PXI instruments, GPIB, IMAQ, IVI, Motion, VISA, and VXI devices.• Used for configuring and testing devices.
Icon Found onIcon Found on
Windows DesktopWindows Desktop
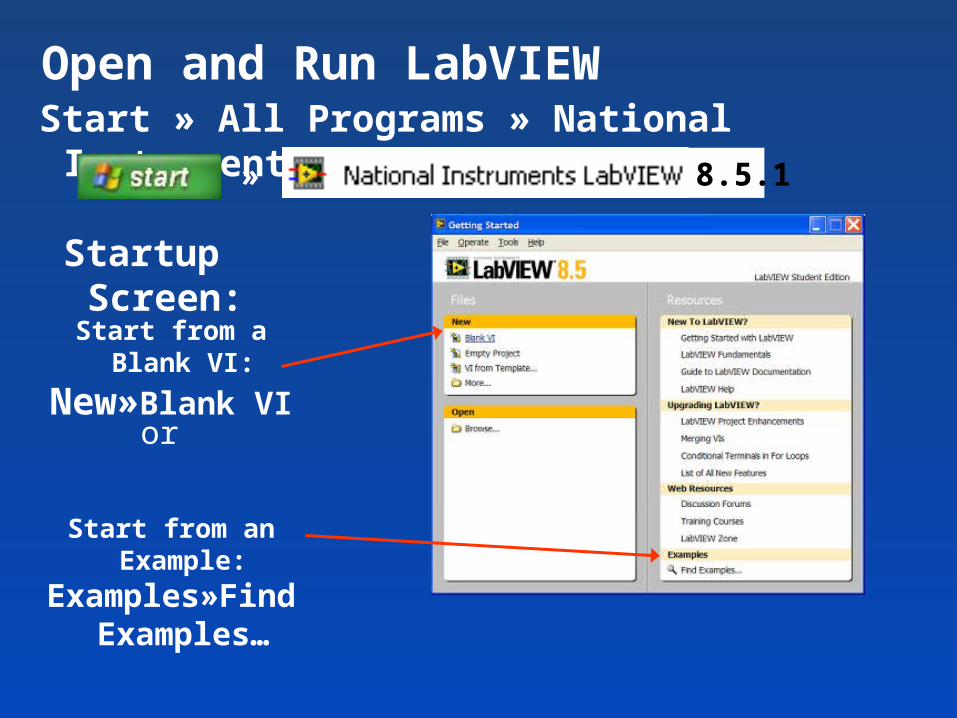
Start » All Programs » National Instruments LabVIEW 8.5.1
Startup Screen:
Start from a Blank VI:
New»Blank VI
Start from an Example:Examples»Find
Examples…
»
or
Open and Run LabVIEW
8.5.1
Each VI has 2 Windows
Front Panel• User Interface (UI)
– Controls = Inputs– Indicators = Outputs
Block Diagram• Graphical Code
– Data travels on wires from controls through functions to indicators
– Blocks execute by Dataflow
LabVIEW Programs Are Called Virtual Instruments (VIs)
Controls Palette(Controls & Indicators)
(Place items on the Front Panel Window)
Indicator:Numeric Slide
Control:Numeric
Customize Palette View
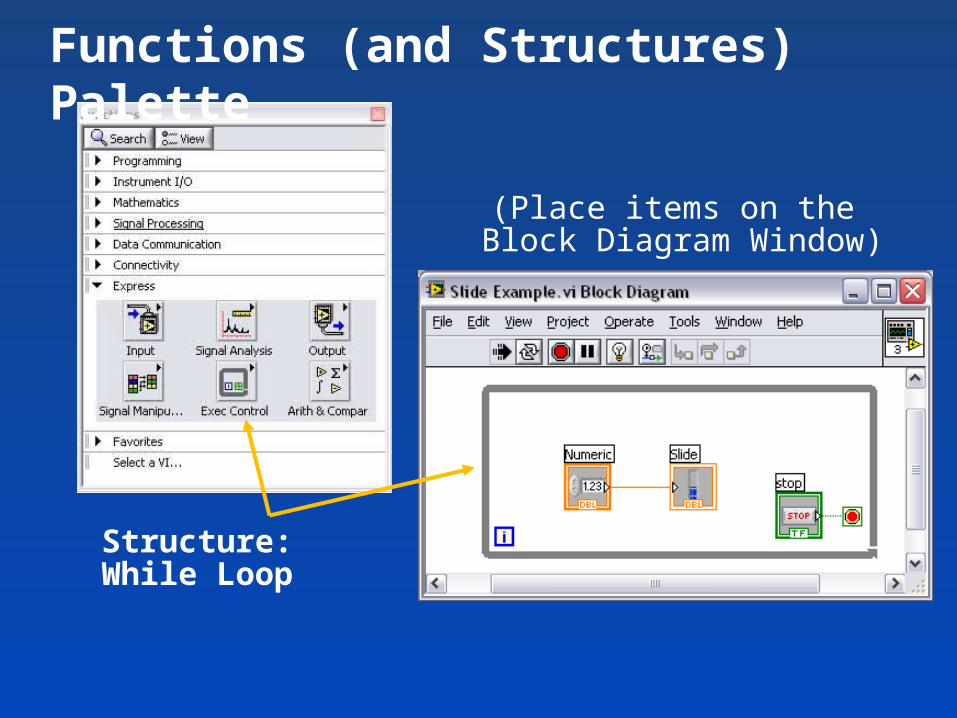
Functions (and Structures) Palette
(Place items on the Block Diagram Window)
Structure:While Loop
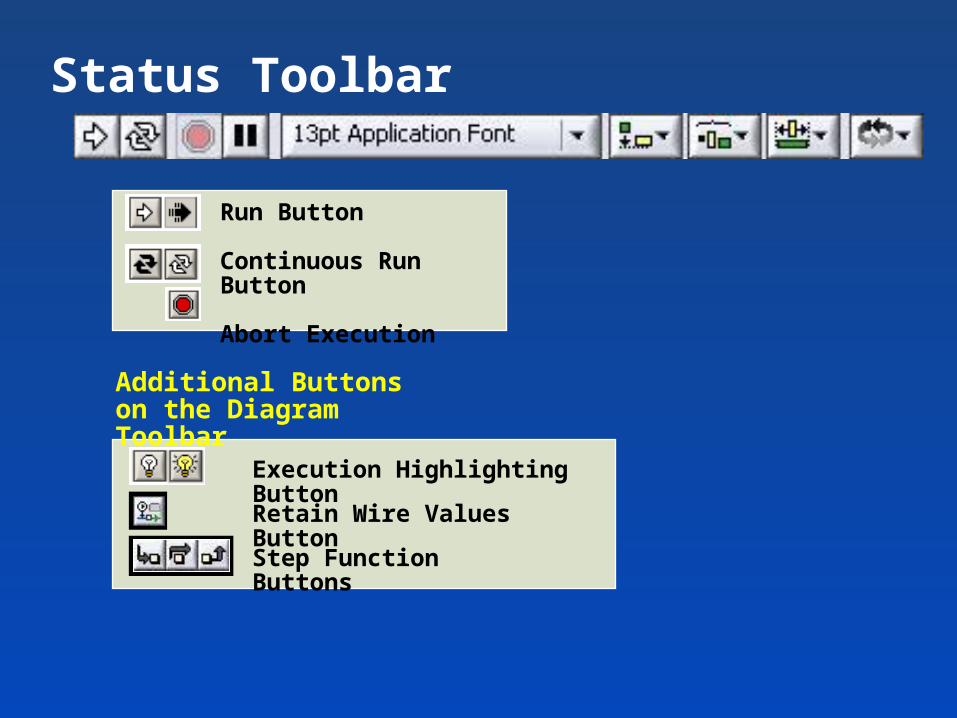
Run Button
Continuous Run Button
Abort Execution
Execution Highlighting Button
Additional Buttons on the Diagram Toolbar
Status Toolbar
Retain Wire Values Button
Step Function Buttons
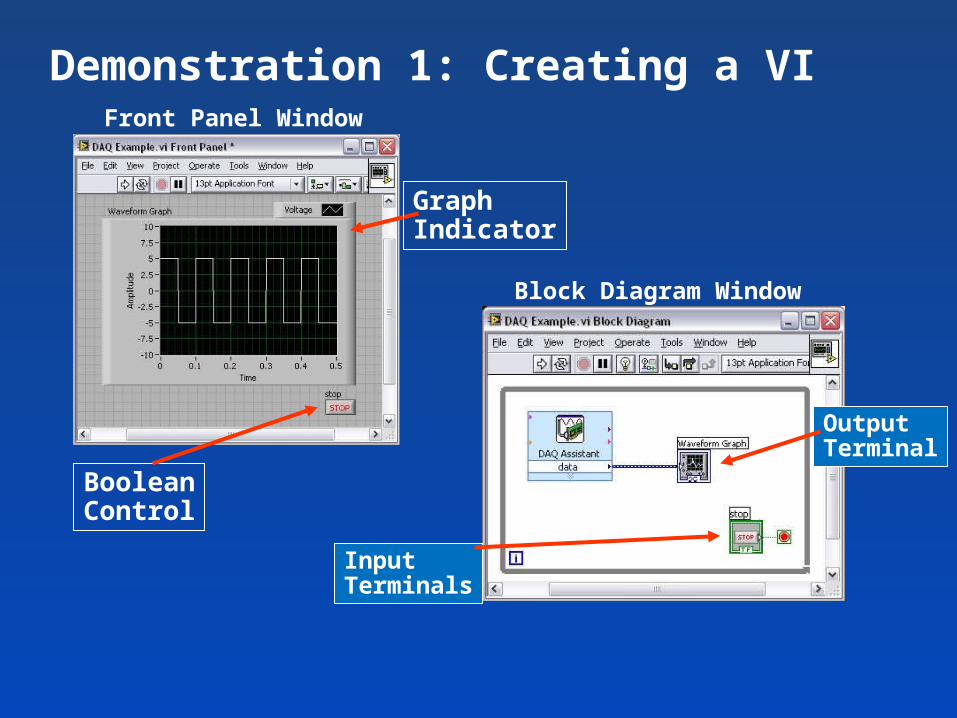
Block Diagram Window
Front Panel Window
Demonstration 1: Creating a VI
InputTerminals
OutputTerminal
BooleanControl
GraphIndicator
• Block diagram execution– Dependent on the flow of data– Block diagram does NOT execute
left to right• Node executes when data is
available to ALL input terminals• Nodes supply data to all output
terminals when done
Dataflow Programming
Debugging Techniques• Finding Errors
• Execution Highlighting
• Probes
Click on broken Run button.Window showing error appears.
Click on Execution Highlighting button; data flow is animated using bubbles. Values are displayed on wires.
Right-click on wire to display probe and it shows data as it flows through wire segment.
You can also select Probe tool from Tools palette and click on wire.
Context Help Window• Help»Show Context Help, press the <Ctrl+H> keys• Hover cursor over object to update window
Additional Help– Right-Click on the VI icon and
choose Help, or– Choose “Detailed Help.” on
the context help window
Tips for Working in LabVIEW
• Keystroke Shortcuts– <Ctrl+H> – Activate/Deactivate Context Help Window– <Ctrl+B> – Remove Broken Wires From Block Diagram– <Ctrl+E> – Toggle Between Front Panel and Block
Diagram– <Ctrl+Z> – Undo (Also in Edit Menu)
• Tools»Options… – Set Preferences in LabVIEW• VI Properties–Configure VI Appearance, Documentation, etc.
Section II – Elements of Typical ProgramsA. Loops
• While Loop• For Loop
B. Functions and SubVIs• Types of Functions• Creating Custom Functions (SubVI)• Functions Palette & Searching
C. Decision Making and File IO• Case Structure• Select (simple If statement)• File I/O
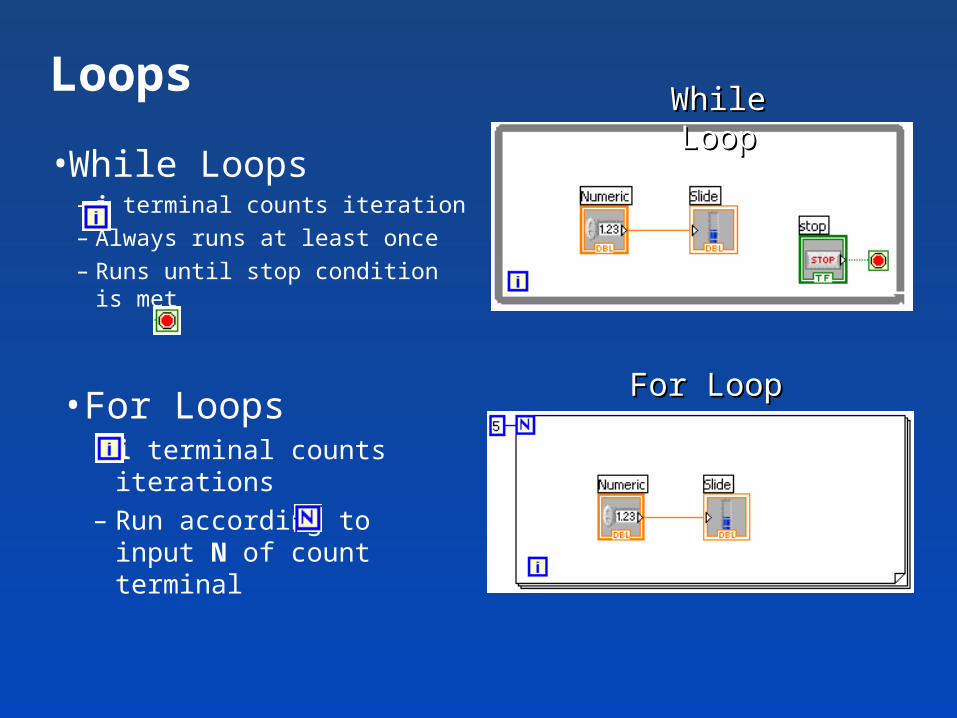
Loops
•While Loops– i terminal counts iteration– Always runs at least once– Runs until stop condition is
met
• For Loops– i terminal counts iterations– Run according to input N of
count terminal
While LoopWhile Loop
For LoopFor Loop
Drawing a Loop
1. Select the structure
2. Enclose code to be repeated
3. Drop or drag additional nodes and then wire
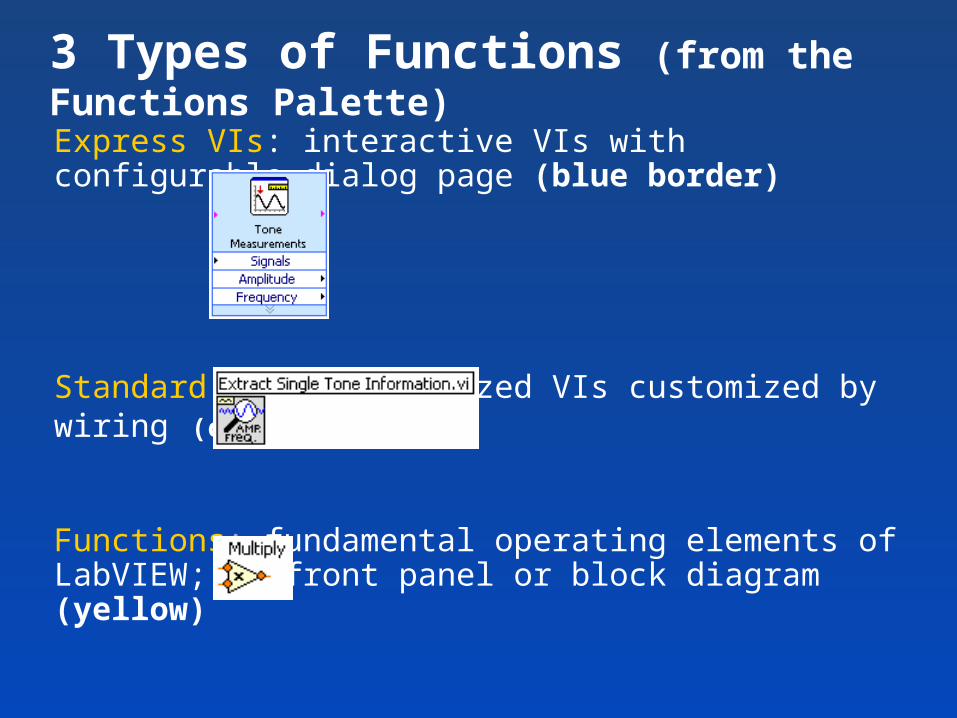
3 Types of Functions (from the Functions Palette)
Express VIs: interactive VIs with configurable dialog page (blue border)
Standard VIs: modularized VIs customized by wiring (customizable)
Functions: fundamental operating elements of LabVIEW; no front panel or block diagram (yellow)
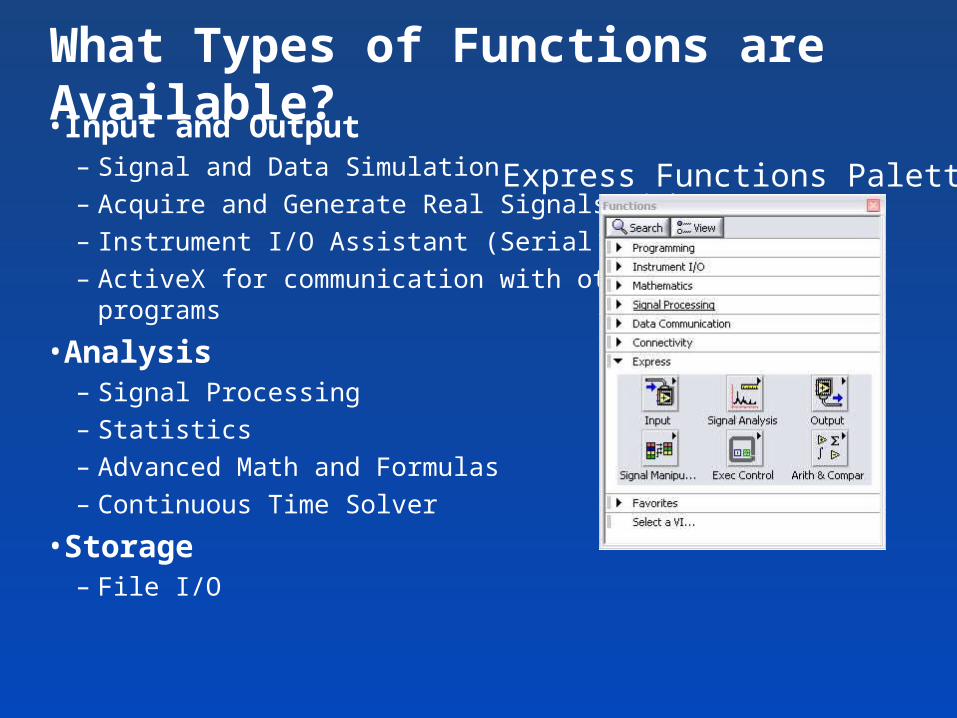
What Types of Functions are Available?• Input and Output
– Signal and Data Simulation– Acquire and Generate Real Signals with DAQ– Instrument I/O Assistant (Serial & GPIB)– ActiveX for communication with other programs
• Analysis – Signal Processing– Statistics– Advanced Math and Formulas– Continuous Time Solver
• Storage– File I/O
Express Functions Palette
Create SubVI• Enclose area to be converted into a subVI.• Select Edit»Create SubVI from the Edit Menu.
LabVIEW Functions and SubVIs operate like Functions in other languages
Function Pseudo Codefunction average (in1, in2, out){out = (in1 + in2)/2.0;}
SubVI Block Diagram
Calling Program Pseudo Codemain{average (in1, in2, pointavg)}
Calling VI Block Diagram
How Do I Make Decisions in LabVIEW?1. Case Structures
2. Select
(a) (b)
(c)
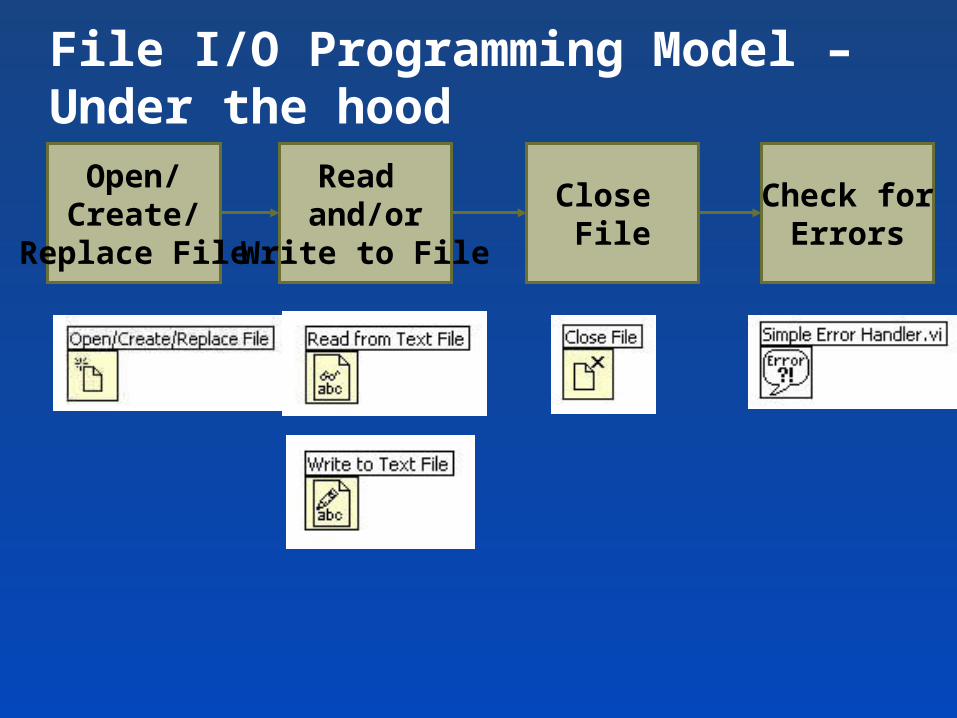
File I/O Programming Model – Under the hood
Open/Create/
Replace File
Read and/or
Write to File
Close File
Check forErrors
Section III – Presenting your ResultsA. Displaying Data on the Front Panel
• Controls and Indicators• Graphs and Charts• Loop Timing
B. Signal Processing• MathScript• Arrays• Clusters• Waveforms
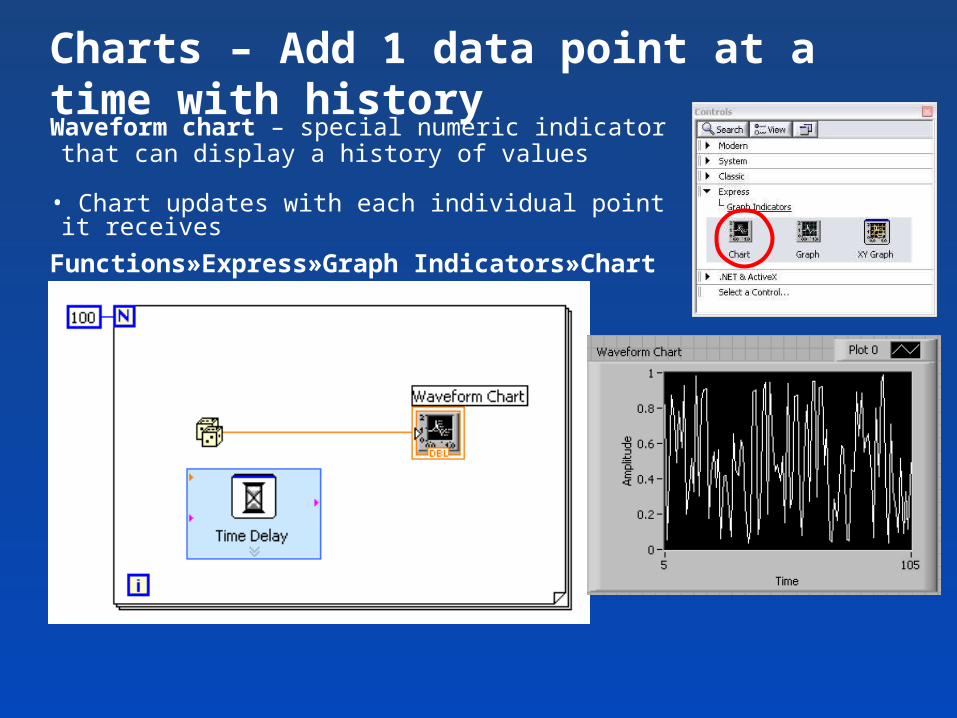
Charts – Add 1 data point at a time with historyWaveform chart – special numeric indicator that can display a history of values
• Chart updates with each individual point it receives
Functions»Express»Graph Indicators»Chart
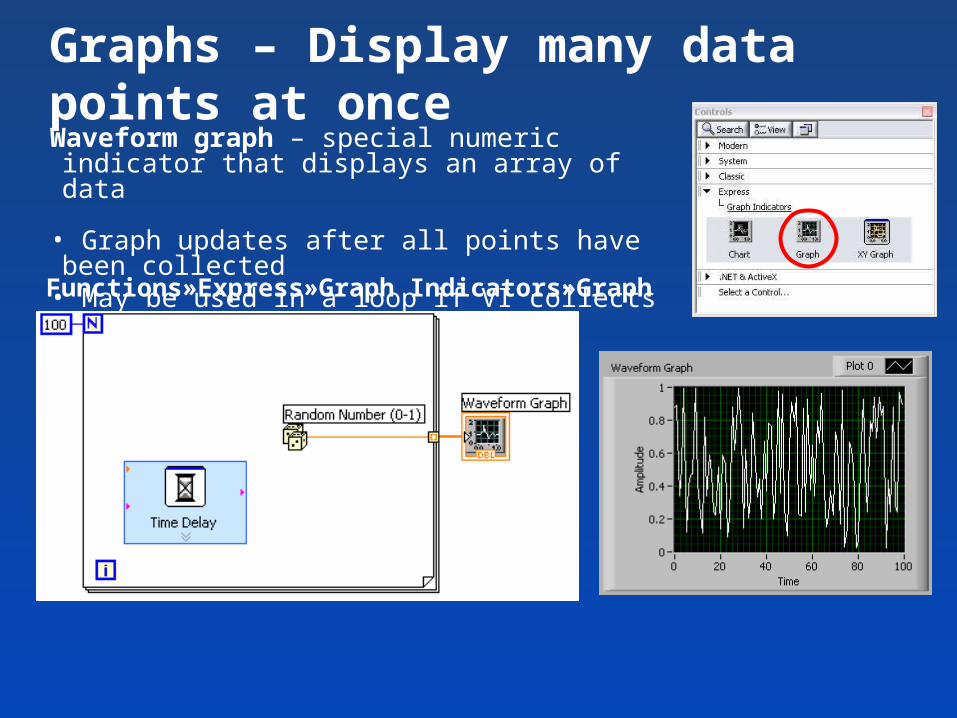
Graphs – Display many data points at onceWaveform graph – special numeric indicator that displays an array of data
• Graph updates after all points have been collected• May be used in a loop if VI collects buffers of data
Functions»Express»Graph Indicators»Graph
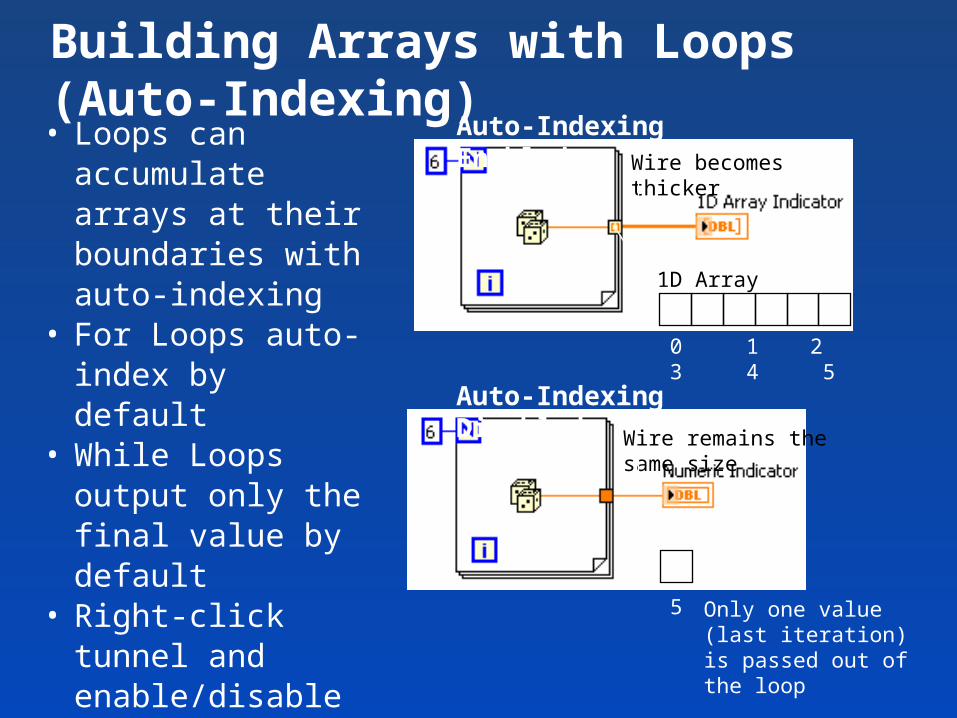
• Loops can accumulate arrays at their boundaries with auto-indexing
• For Loops auto-index by default
• While Loops output only the final value by default
• Right-click tunnel and enable/disable auto-indexing
Building Arrays with Loops (Auto-Indexing)
Wire becomes thicker
Wire remains the same size
Auto-Indexing Disabled
Auto-Indexing Enabled
Only one value (last iteration) is passed out of the loop
1D Array
0 1 2 3 4 5
5
Review of Data Types Found in LabVIEW
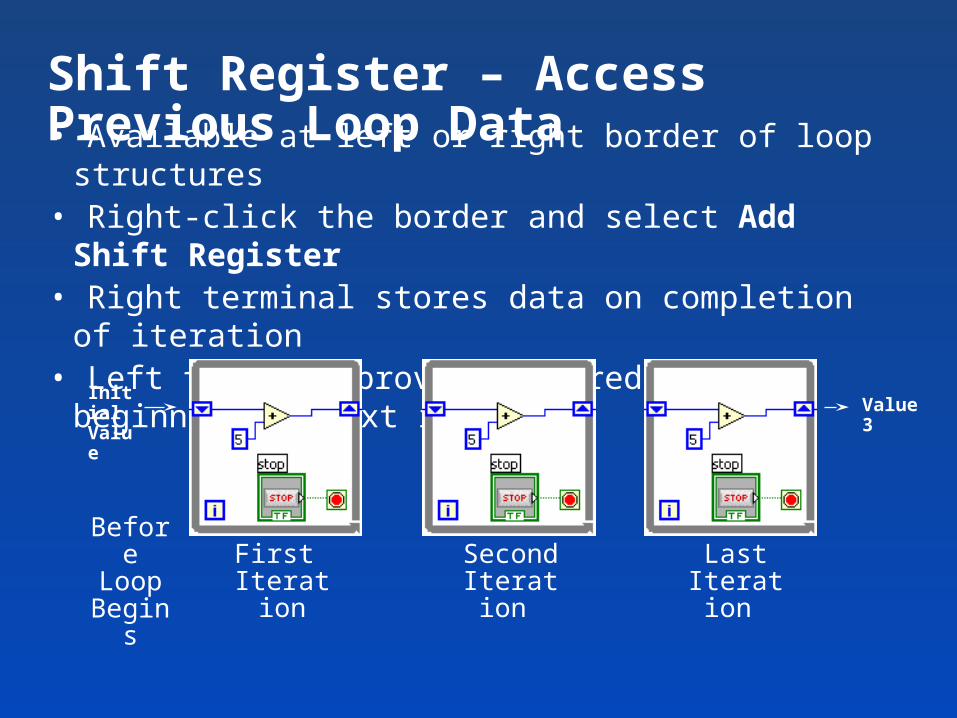
Shift Register – Access Previous Loop Data• Available at left or right border of loop structures• Right-click the border and select Add Shift Register • Right terminal stores data on completion of iteration• Left terminal provides stored data at beginning of next iteration