26
GEOGRAPHIC INFORMATION SYSTEM Eng. Siham Bataineh Lecture #2
| Date post: | 15-Jul-2016 |
| Category: |
Documents |
| Upload: | chris-tina-hayek |
| View: | 7 times |
| Download: | 1 times |

GEOGRAPHIC INFORMATION SYSTEM
Eng. Siham BatainehLecture #2
Components of ArcGIS Desktop 10
• ArcMap, ArcCatalog, (and ArcToolbox)
ArcGIS Desktop is comprised of a set of integrated
applications, which are accessible from the
Start menu of your computer: ArcMap and
ArcCatalog.
ArcMap
• ArcMap is the main mapping application
which allows you to create maps, query
attributes, analyze spatial relationships, and
layout final projects.
ArcCatalog
• ArcCatalog organizes spatial data contained on
your computer and various other locations and
allows for you to search, preview, and add data
to ArcMap as well as manage metadata.
ArcToolbox
• ArcToolbox is the third application of ArcGIS Desktop. Although it is not accessible from the Start menu, it is easily accessed and used within ArcMap and ArcCatalog.
• ArcToolbox contains tools for geoprocessing, data conversion, coordinate systems, projections.

Software Products (Licensing Levels)
• ArcMap is made up of three software product
levels: ArcView, ArcEditor, and ArcInfo.
• These products share a common architecture
but provide increasing levels of functionality.

Software level
• ArcView provides the base mapping and analysis tools.
• ArcEditor provides all ArcView capability and includes additional processing and advanced editing.
• ArcInfo provides all ArcEditor capability plus advanced analysis and processing.

• ArcMap can be opened from multiple
locations. It can be opened from the start
menu or an icon on the desktop.

• Click on the
ArcMap icon
• Upon opening
ArcMap you
may see the following
startup window:
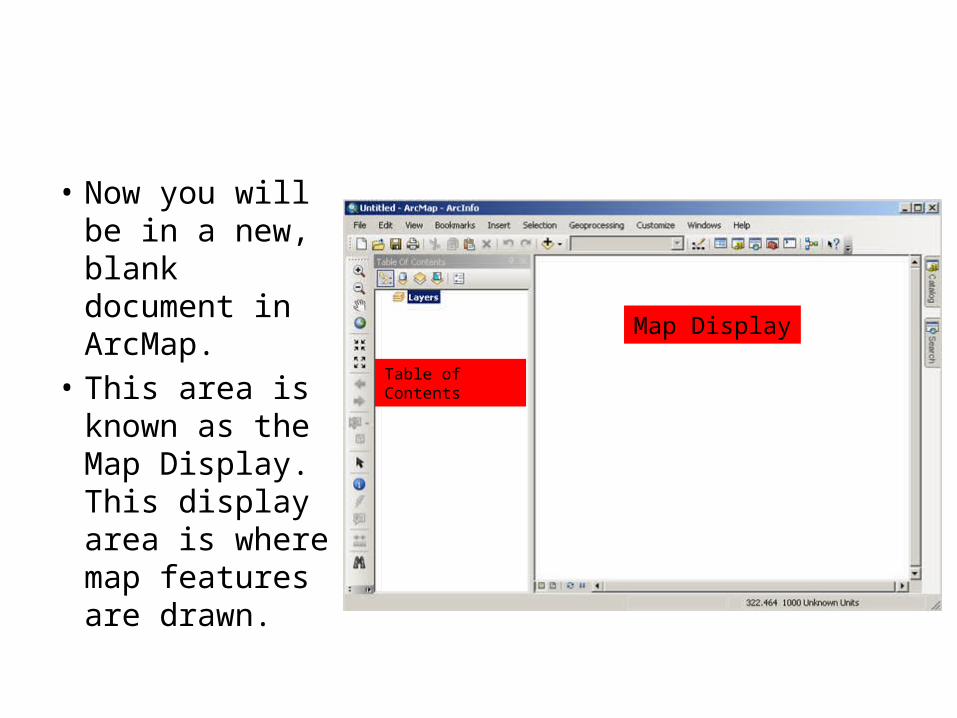
• Now you will be in a new, blank document in ArcMap.
• This area is known as the Map Display. This display area is where map features are drawn.
Map Display
Table of Contents
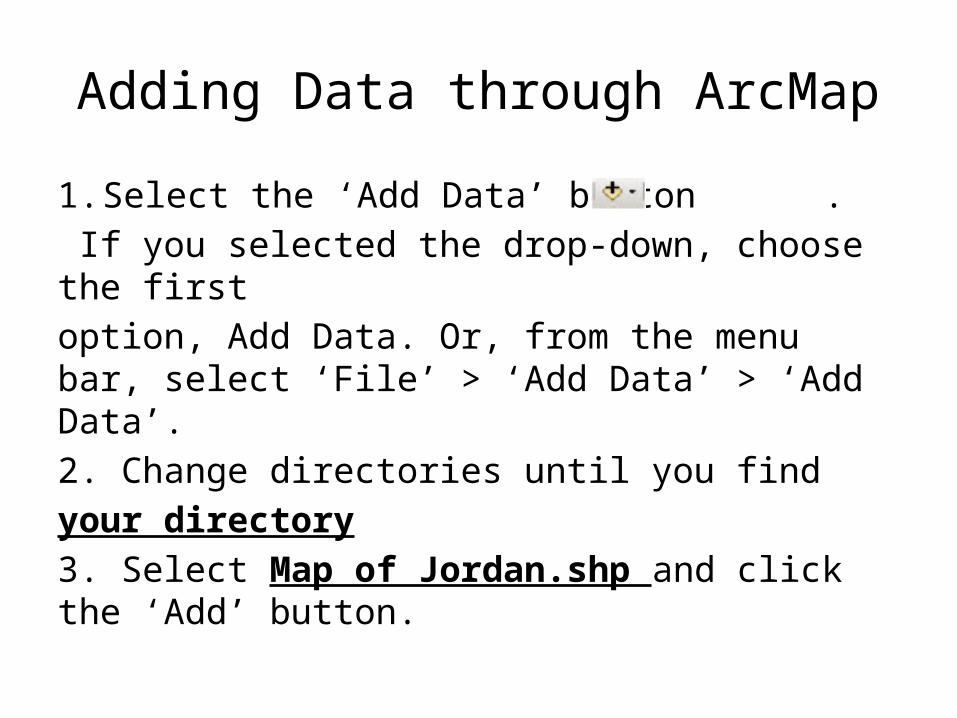
Adding Data through ArcMap
1. Select the ‘Add Data’ button . If you selected the drop-down, choose the firstoption, Add Data. Or, from the menu bar, select ‘File’ > ‘Add Data’ > ‘Add Data’.2. Change directories until you find your directory3. Select Map of Jordan.shp and click the ‘Add’ button.
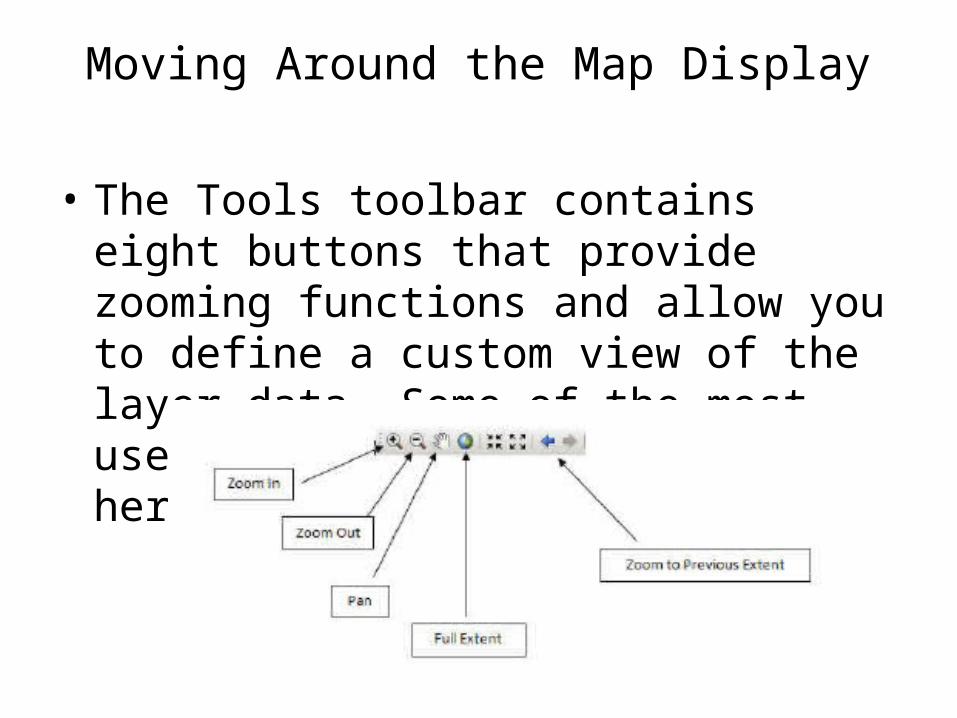
Moving Around the Map Display
• The Tools toolbar contains eight buttons that provide zooming functions and allow you to define a custom view of the layer data. Some of the most useful ones are illustrated here:
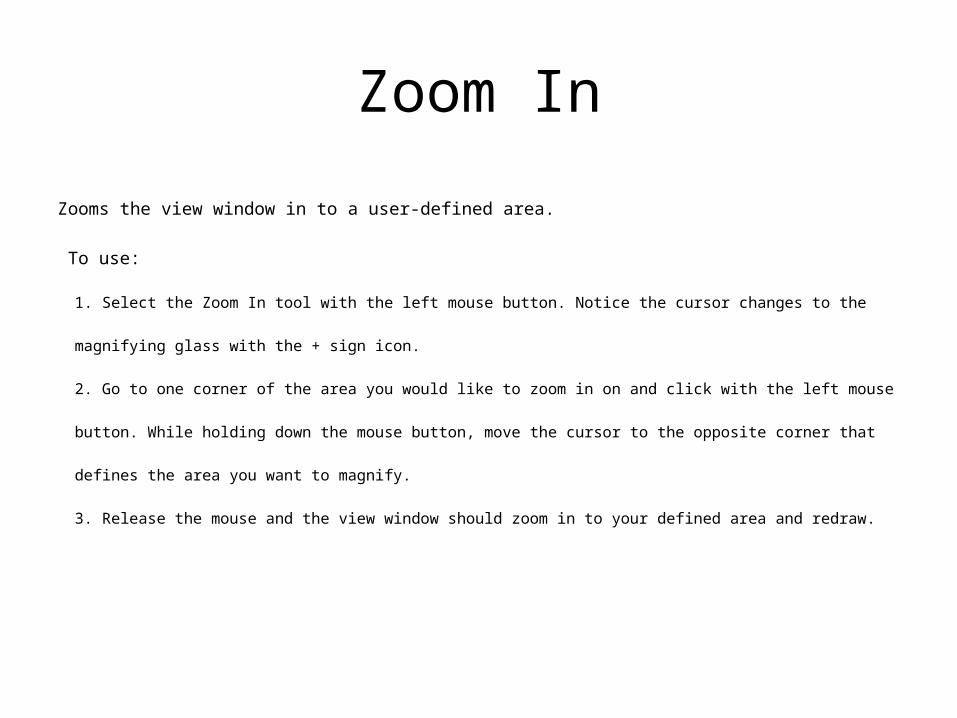
Zoom In
Zooms the view window in to a user-defined area.
To use:
1. Select the Zoom In tool with the left mouse button. Notice the cursor changes to the
magnifying glass with the + sign icon.
2. Go to one corner of the area you would like to zoom in on and click with the left mouse
button. While holding down the mouse button, move the cursor to the opposite corner that
defines the area you want to magnify.
3. Release the mouse and the view window should zoom in to your defined area and redraw.
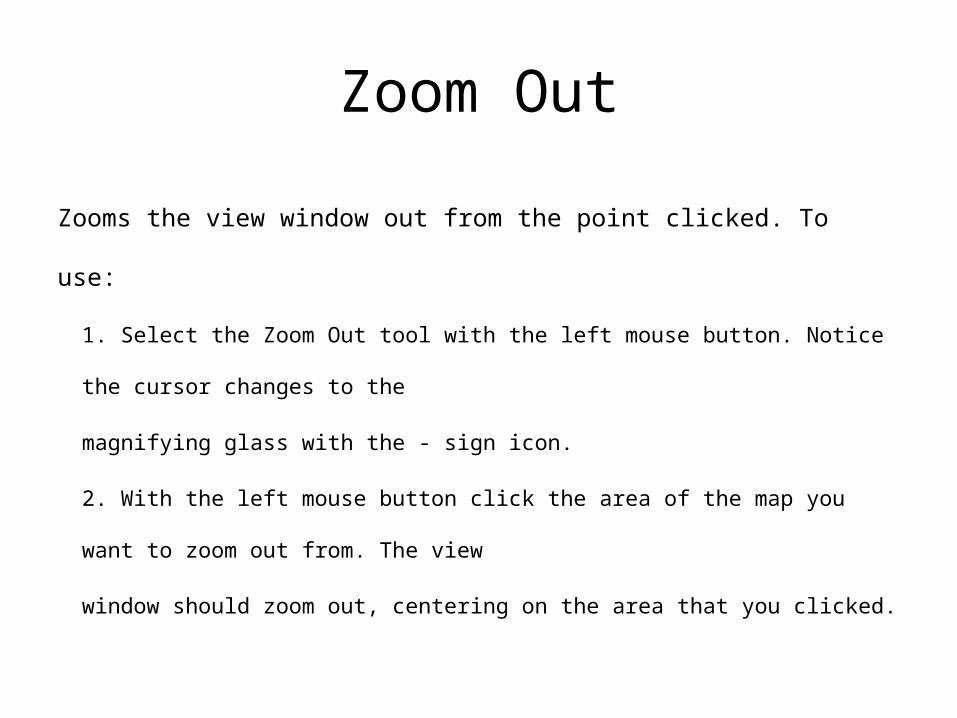
Zoom Out
Zooms the view window out from the point clicked. To use:
1. Select the Zoom Out tool with the left mouse button. Notice the cursor
changes to the
magnifying glass with the - sign icon.
2. With the left mouse button click the area of the map you want to zoom
out from. The view
window should zoom out, centering on the area that you clicked.
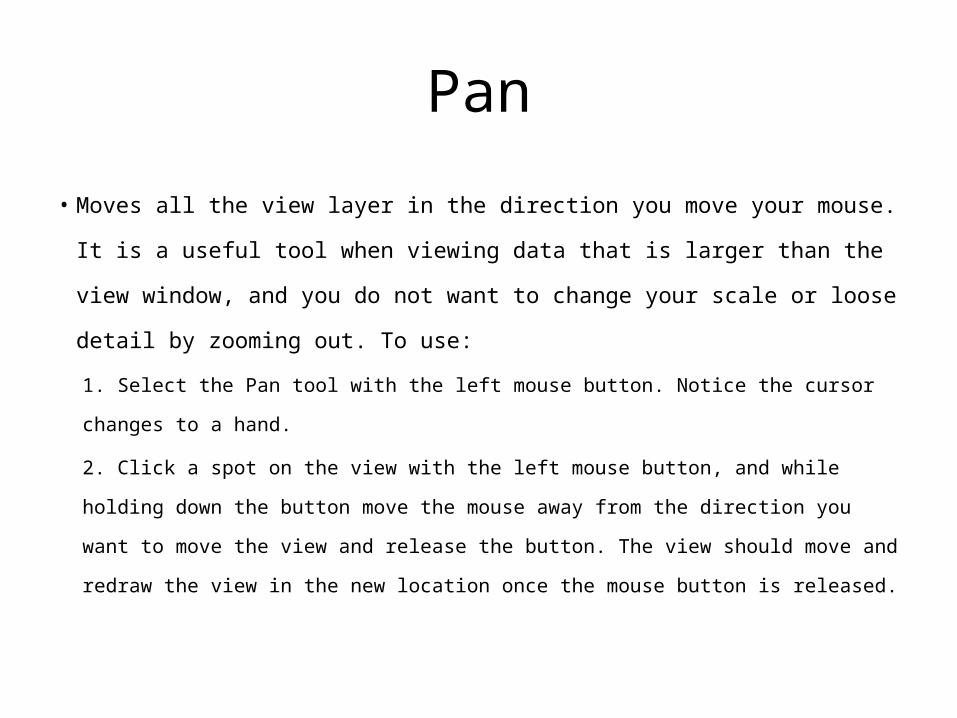
Pan
• Moves all the view layer in the direction you move your mouse. It is a useful
tool when viewing data that is larger than the view window, and you do not
want to change your scale or loose detail by zooming out. To use:
1. Select the Pan tool with the left mouse button. Notice the cursor changes to a hand.
2. Click a spot on the view with the left mouse button, and while holding down the
button move the mouse away from the direction you want to move the view and
release the button. The view should move and redraw the view in the new location
once the mouse button is released.

Full Extent & Zoom to Previous Extent
• Zooms the view window to the full extent of all layers shown
in the view. This is very handy when you want to get back to
the way things looked when you first added the layer.
• Zooms the view window back to the previous view window
extent.

Identifying Objects
• This tool helps us to identify the objects of a layer. It is located on the Tools toolbar and it has the icon with
the letter i in a blue circle. This tool will display the attributes of a particular layer object. These attributes
are actually located in a table that we will discuss later.
• To use the identify tool:
1. Click the identify tool with the left mouse button. Your cursor changes to a cross hair with the i icon. When you click
on a feature in the map, the Identify Results window will open and you can choose what layers you would like to be able
to identify or see what you have identified.

Layer Properties
• We can control the properties of each layer in the table of content by mover the cursor to that layer and click right click by the mouse.


Layer Properties
• In this step we can rename our layer and make this layer as scalable layer.
• scalable layer the visibility of this layer will depend on specific scale value range.
• From layer properties go to source tab, by click on it.
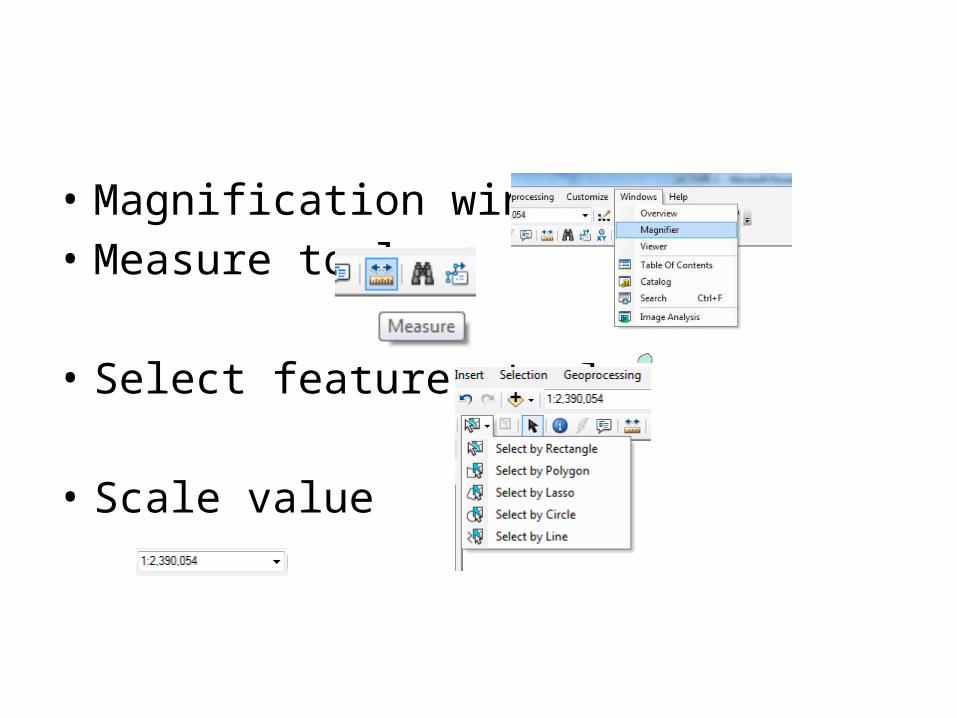
• Magnification window.• Measure tool
• Select features tools
• Scale value
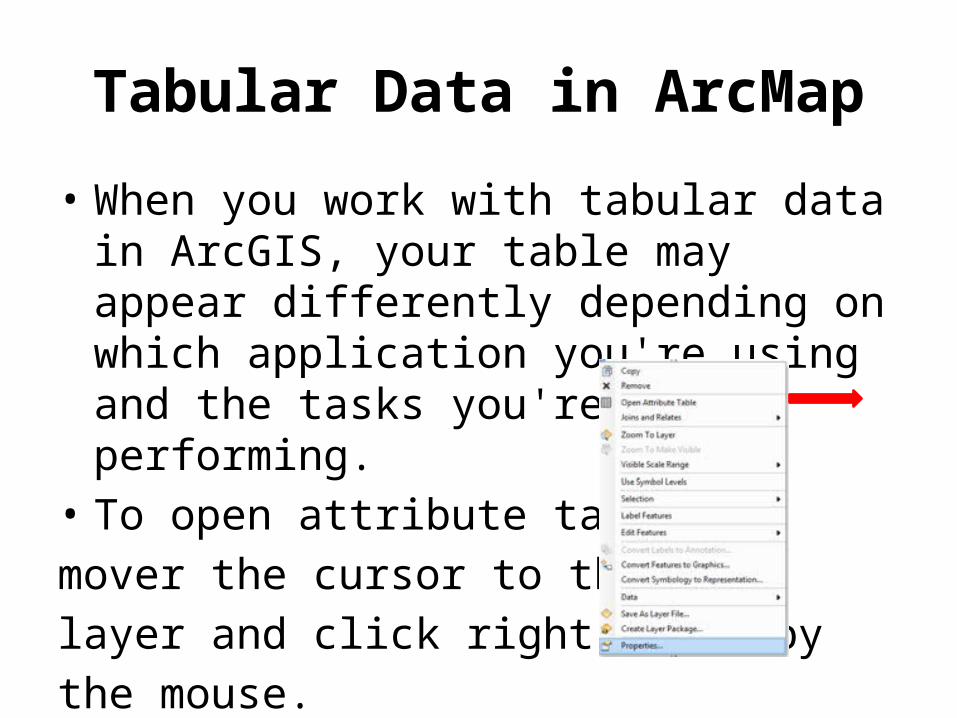
Tabular Data in ArcMap
• When you work with tabular data in ArcGIS, your table may appear differently depending on which application you're using and the tasks you're performing.
• To open attribute table by mover the cursor to that layer and click right click by the mouse.
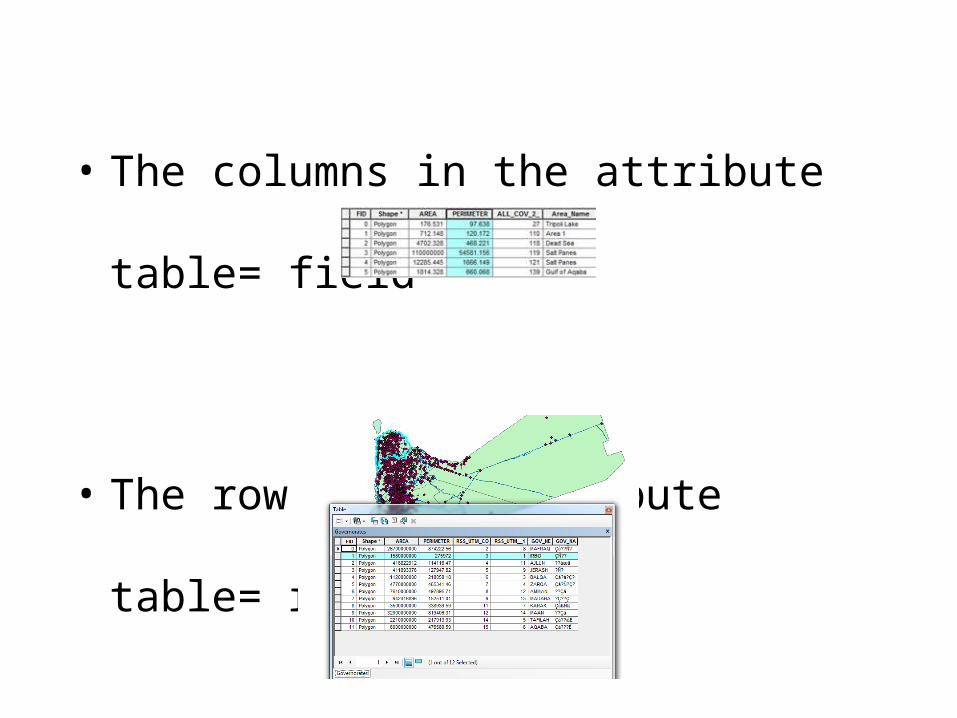
• The columns in the attribute table= field
• The row in the attribute table= records
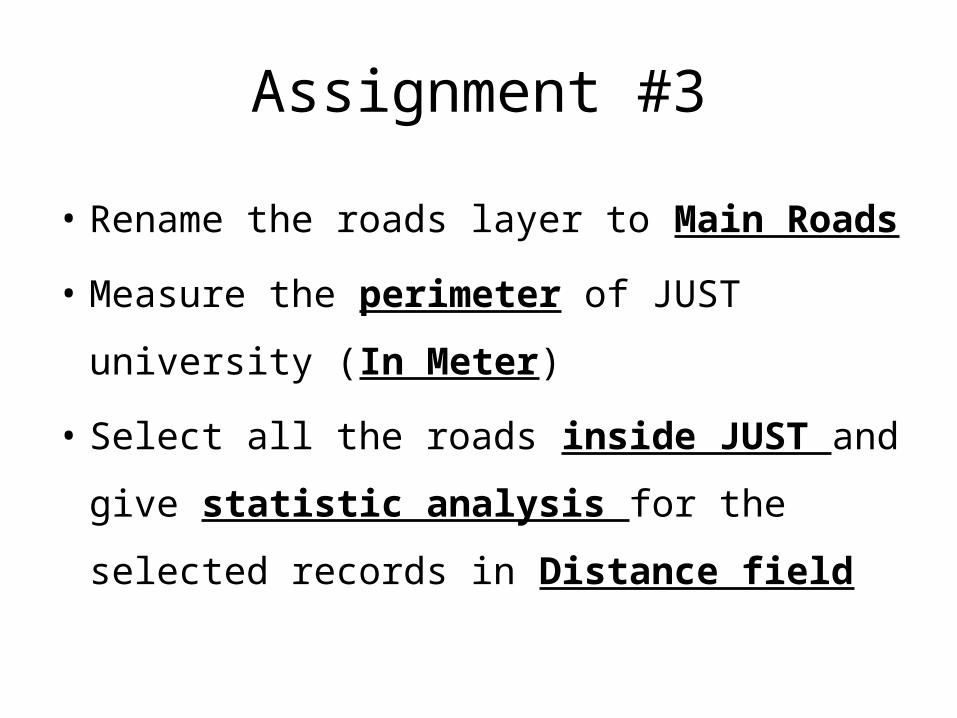
Assignment #3
• Rename the roads layer to Main Roads
• Measure the perimeter of JUST university (In
Meter)
• Select all the roads inside JUST and give
statistic analysis for the selected records in
Distance field


