Lecture 2 : Borda’s method: A Scoring System In the plurality and runoff methods discussed in the previous lecture, we do not take into account the voter’s relative preferences for all of the candidates. We do not, for example take into account which candidate was ranked last by each voter. In this and the following section, we assume that voters are required to list a full set of preferences on their ballot and we look at methods that use all of the information. Borda’s Method With Borda’s method voters rank the entire list of candidates or choices in order of preference from the first choice to the last choice. After all votes have been cast, they are tallied as follows: On a particular ballot, the lowest ranking candidate is given 1 point, the second lowest is given 2 points, and so on, the top candidate receiving points equal to the number of candidates. The number of points given to each caniddate is summed across all ballots. This is called the Borda Count for the candidate. The winner is the candidate with the highest Borda count. Example 1 A committee of 10 people needs to select a chair from among three candidates named Kelly, Holtz, Rockne. They decide to use Borda’s method. The preference rankings of the ten committee members are as follows: # Voters → 2 3 2 3 Kelly 1 3 2 3 Holtz 2 1 1 2 Rockne 3 2 3 1 Who will be the winner using Borda’s method? ———————————————— The Borda count for Kelly is given by: (no. 1st place votes)3 + (no. 2nd place votes)2 + (no. 3rd place votes)1 = 2· 3+2· 2+6· 1 = 6+4+6 = 16. The Borda count for Holtz is given by: (no. 1st place votes)3+(no. 2nd place votes)2+(no. 3rd place votes)1= 5 · 3+5 · 2+0 · 1 = 15+10+0 = 25. The Borda count for Rockne is given by: (no. 1st place votes)3+(no. 2nd place votes)2+(no. 3rd place votes)1= 3 · 3+3 · 2+4 · 1 = 9+6+4 = 19. (Not that in this case the winner using the Borda method agrees with the winner using the Plurality method) ———————————————— Example 2 Suppose that in a survey, squash players were asked to rank brands of squash racquets. The results are shown below: 1
Transcript
Lecture 2 : Borda’s method: A Scoring System
In the plurality and runoff methods discussed in the previous lecture, we do not take into account thevoter’s relative preferences for all of the candidates. We do not, for example take into account whichcandidate was ranked last by each voter. In this and the following section, we assume that voters arerequired to list a full set of preferences on their ballot and we look at methods that use all of theinformation.
Borda’s Method
With Borda’s method voters rank the entire list of candidates or choices in order of preference fromthe first choice to the last choice.After all votes have been cast, they are tallied as follows:On a particular ballot, the lowest ranking candidate is given 1 point, the second lowest is given 2 points,and so on, the top candidate receiving points equal to the number of candidates.The number of points given to each caniddate is summed across all ballots.This is called the Borda Count for the candidate. The winner is the candidate with the highest Bordacount.
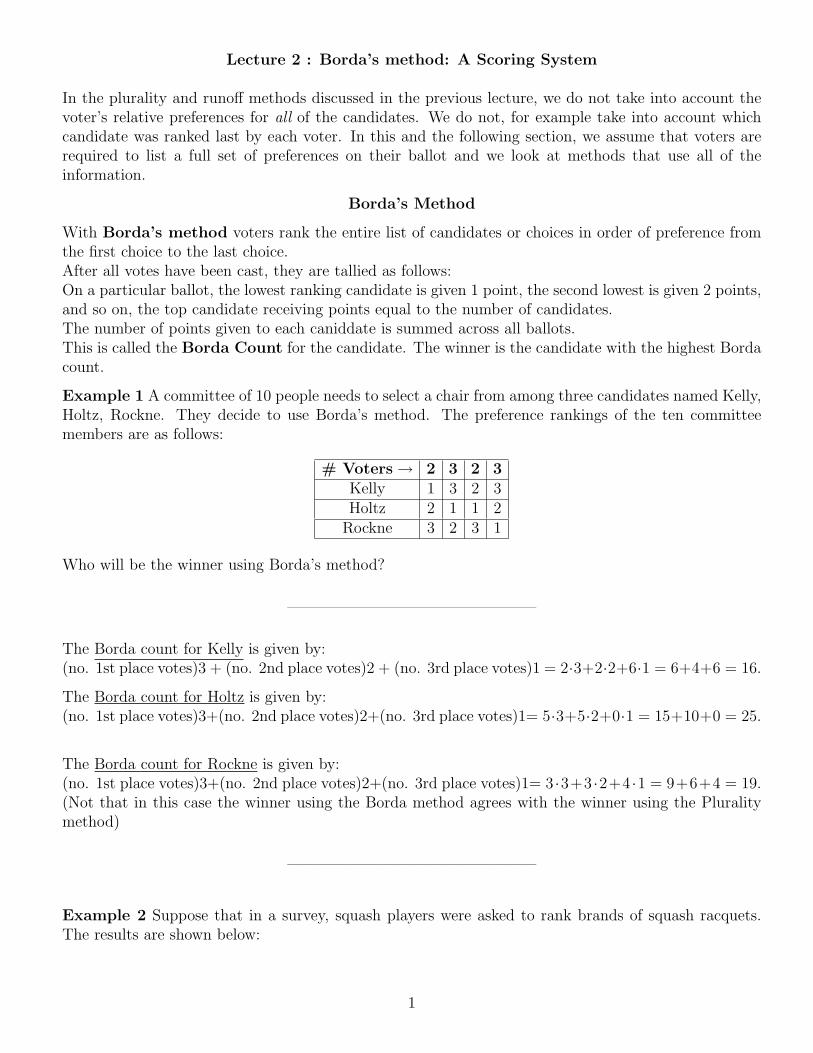
Example 1 A committee of 10 people needs to select a chair from among three candidates named Kelly,Holtz, Rockne. They decide to use Borda’s method. The preference rankings of the ten committeemembers are as follows:
# Voters→ 2 3 2 3Kelly 1 3 2 3Holtz 2 1 1 2
Rockne 3 2 3 1
Who will be the winner using Borda’s method?
————————————————
The Borda count for Kelly is given by:(no. 1st place votes)3 + (no. 2nd place votes)2 + (no. 3rd place votes)1 = 2·3+2·2+6·1 = 6+4+6 = 16.
The Borda count for Holtz is given by:(no. 1st place votes)3+(no. 2nd place votes)2+(no. 3rd place votes)1= 5·3+5·2+0·1 = 15+10+0 = 25.
The Borda count for Rockne is given by:(no. 1st place votes)3+(no. 2nd place votes)2+(no. 3rd place votes)1= 3 ·3+3 ·2+4 ·1 = 9+6+4 = 19.(Not that in this case the winner using the Borda method agrees with the winner using the Pluralitymethod)
————————————————
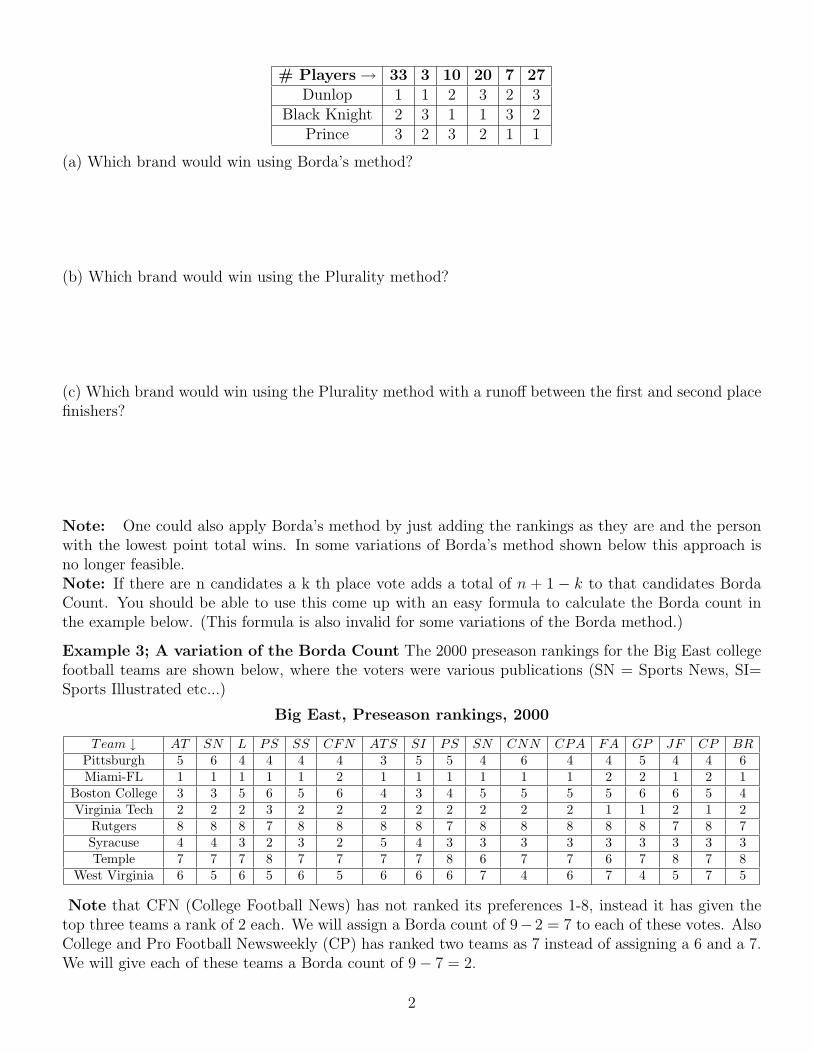
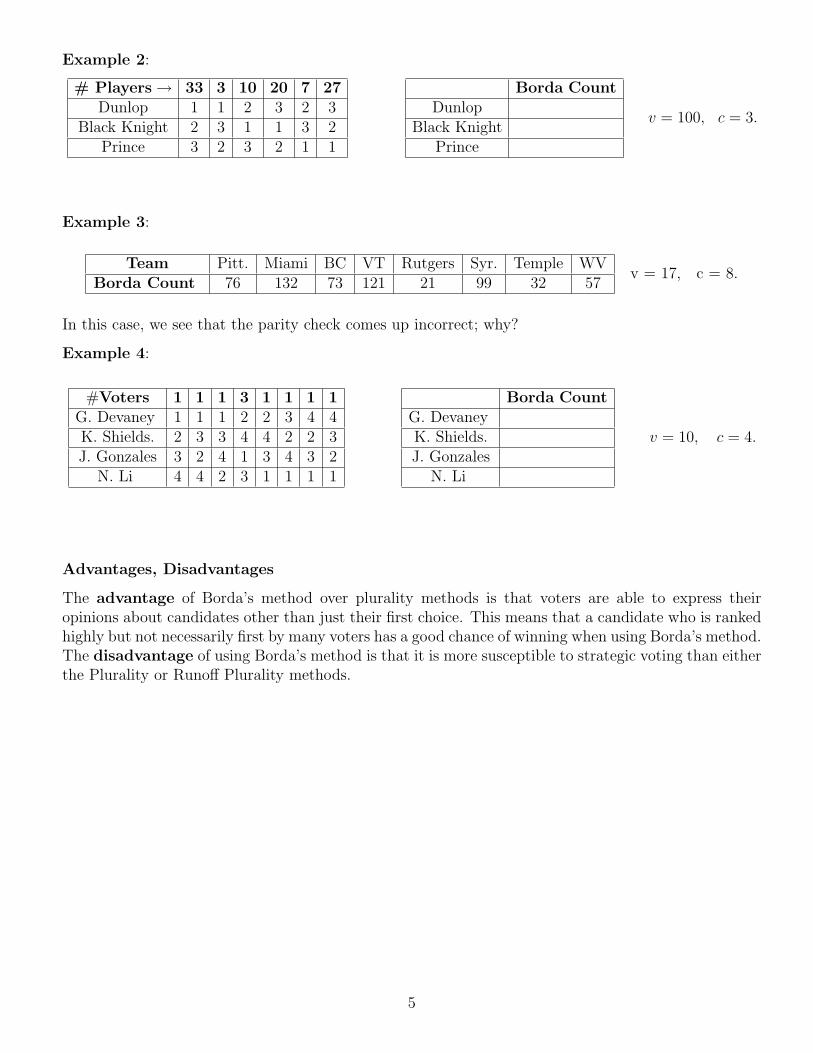
Example 2 Suppose that in a survey, squash players were asked to rank brands of squash racquets.The results are shown below:
1
# Players→ 33 3 10 20 7 27Dunlop 1 1 2 3 2 3
Black Knight 2 3 1 1 3 2Prince 3 2 3 2 1 1
(a) Which brand would win using Borda’s method?
(b) Which brand would win using the Plurality method?
(c) Which brand would win using the Plurality method with a runoff between the first and second placefinishers?
Note: One could also apply Borda’s method by just adding the rankings as they are and the personwith the lowest point total wins. In some variations of Borda’s method shown below this approach isno longer feasible.Note: If there are n candidates a k th place vote adds a total of n + 1 − k to that candidates BordaCount. You should be able to use this come up with an easy formula to calculate the Borda count inthe example below. (This formula is also invalid for some variations of the Borda method.)
Example 3; A variation of the Borda Count The 2000 preseason rankings for the Big East collegefootball teams are shown below, where the voters were various publications (SN = Sports News, SI=Sports Illustrated etc...)
Big East, Preseason rankings, 2000
Team ↓ AT SN L PS SS CFN ATS SI PS SN CNN CPA FA GP JF CP BRPittsburgh 5 6 4 4 4 4 3 5 5 4 6 4 4 5 4 4 6Miami-FL 1 1 1 1 1 2 1 1 1 1 1 1 2 2 1 2 1
Note that CFN (College Football News) has not ranked its preferences 1-8, instead it has given thetop three teams a rank of 2 each. We will assign a Borda count of 9− 2 = 7 to each of these votes. AlsoCollege and Pro Football Newsweekly (CP) has ranked two teams as 7 instead of assigning a 6 and a 7.We will give each of these teams a Borda count of 9− 7 = 2.
2
Use Borda’s method to determine a ranking for the teams using the sums of the above rankings shownbelow:
Team Pitt. Miami BC VT Rutgers Syr. Temple WVSum 77 21 80 32 132 54 121 96
Formula for Borda Count When using the Borda Method with c candidates and v voters. For anygiven candidate, let r1, r2, . . . , rv demote the ranks assigned to that candidate by each voter. Let sdenote their sum s = r1 + r2 + · · ·+ rv. Then the Borda count for that candidate is given by
b = v(c + 1)− s
Strategic Voting and Borda’s Method
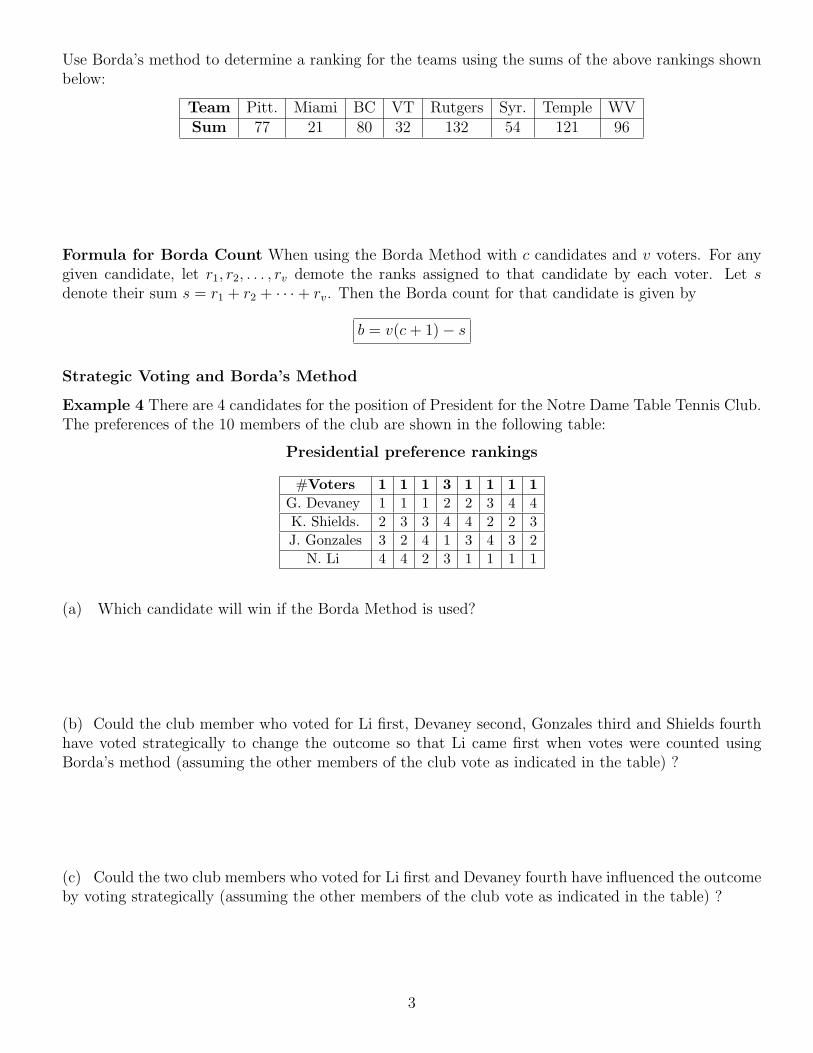
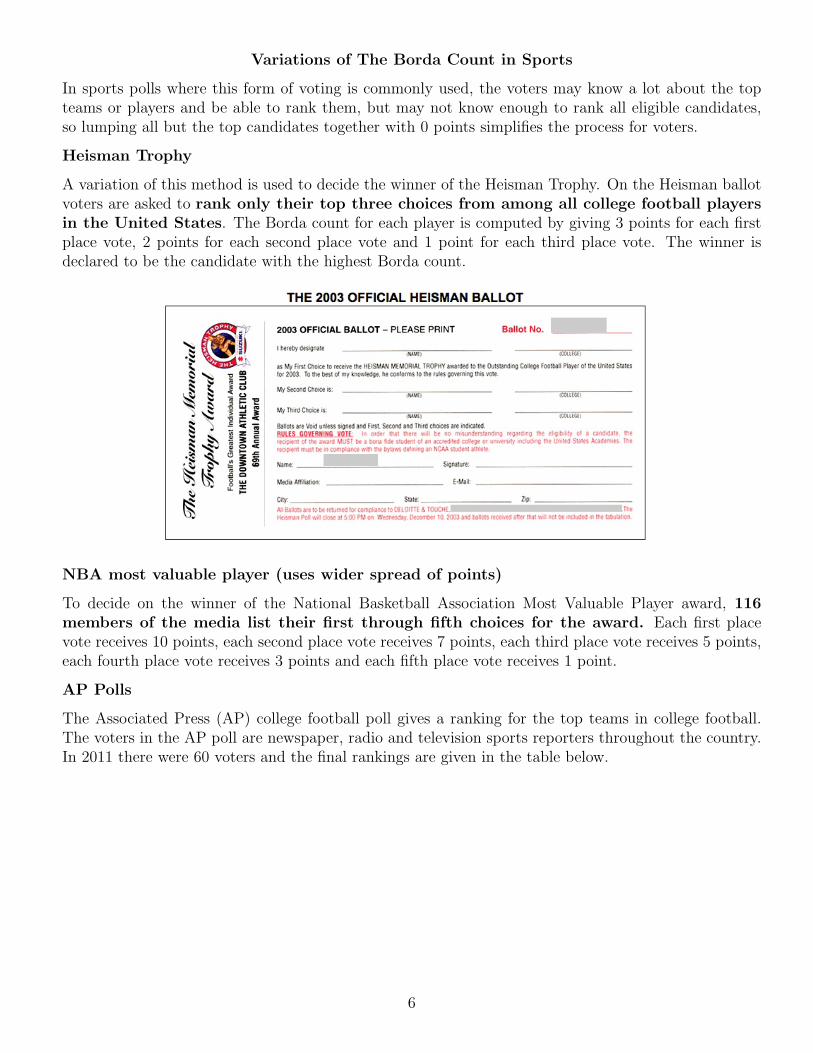
Example 4 There are 4 candidates for the position of President for the Notre Dame Table Tennis Club.The preferences of the 10 members of the club are shown in the following table:
(a) Which candidate will win if the Borda Method is used?
(b) Could the club member who voted for Li first, Devaney second, Gonzales third and Shields fourthhave voted strategically to change the outcome so that Li came first when votes were counted usingBorda’s method (assuming the other members of the club vote as indicated in the table) ?
(c) Could the two club members who voted for Li first and Devaney fourth have influenced the outcomeby voting strategically (assuming the other members of the club vote as indicated in the table) ?
3
Parity Check
Since the Borda method involves a lot of calculation, it is easy to make a mistake. we can use theformula given below to run a quick check on our answers.
Parity Check When using Borda’s method with c candidates and v voters, the sum of the Bordacounts for all candidates must be
vc(c + 1)
2.
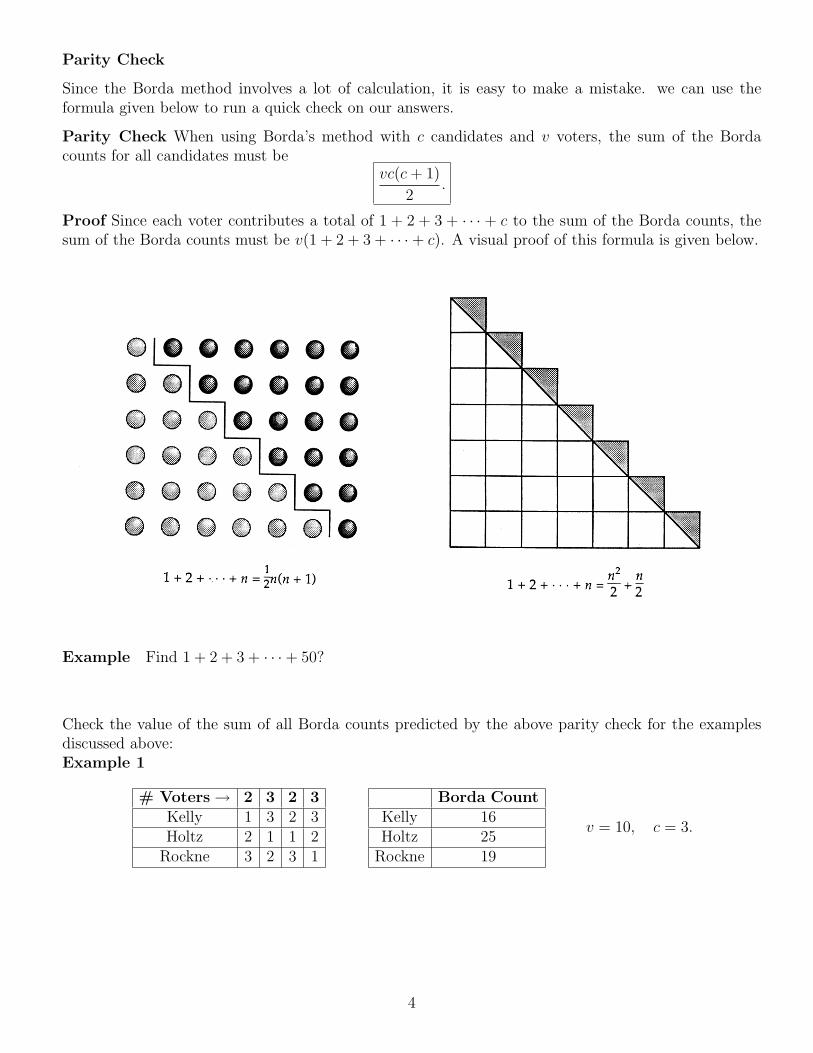
Proof Since each voter contributes a total of 1 + 2 + 3 + · · · + c to the sum of the Borda counts, thesum of the Borda counts must be v(1 + 2 + 3 + · · ·+ c). A visual proof of this formula is given below.
Example Find 1 + 2 + 3 + · · ·+ 50?
Check the value of the sum of all Borda counts predicted by the above parity check for the examplesdiscussed above:Example 1
# Voters→ 2 3 2 3Kelly 1 3 2 3Holtz 2 1 1 2
Rockne 3 2 3 1
Borda CountKelly 16Holtz 25
Rockne 19
v = 10, c = 3.
4
Example 2:
# Players→ 33 3 10 20 7 27Dunlop 1 1 2 3 2 3
Black Knight 2 3 1 1 3 2Prince 3 2 3 2 1 1
Borda CountDunlop
Black KnightPrince
v = 100, c = 3.
Example 3:
Team Pitt. Miami BC VT Rutgers Syr. Temple WVBorda Count 76 132 73 121 21 99 32 57
v = 17, c = 8.
In this case, we see that the parity check comes up incorrect; why?
The advantage of Borda’s method over plurality methods is that voters are able to express theiropinions about candidates other than just their first choice. This means that a candidate who is rankedhighly but not necessarily first by many voters has a good chance of winning when using Borda’s method.The disadvantage of using Borda’s method is that it is more susceptible to strategic voting than eitherthe Plurality or Runoff Plurality methods.
5
Variations of The Borda Count in Sports
In sports polls where this form of voting is commonly used, the voters may know a lot about the topteams or players and be able to rank them, but may not know enough to rank all eligible candidates,so lumping all but the top candidates together with 0 points simplifies the process for voters.
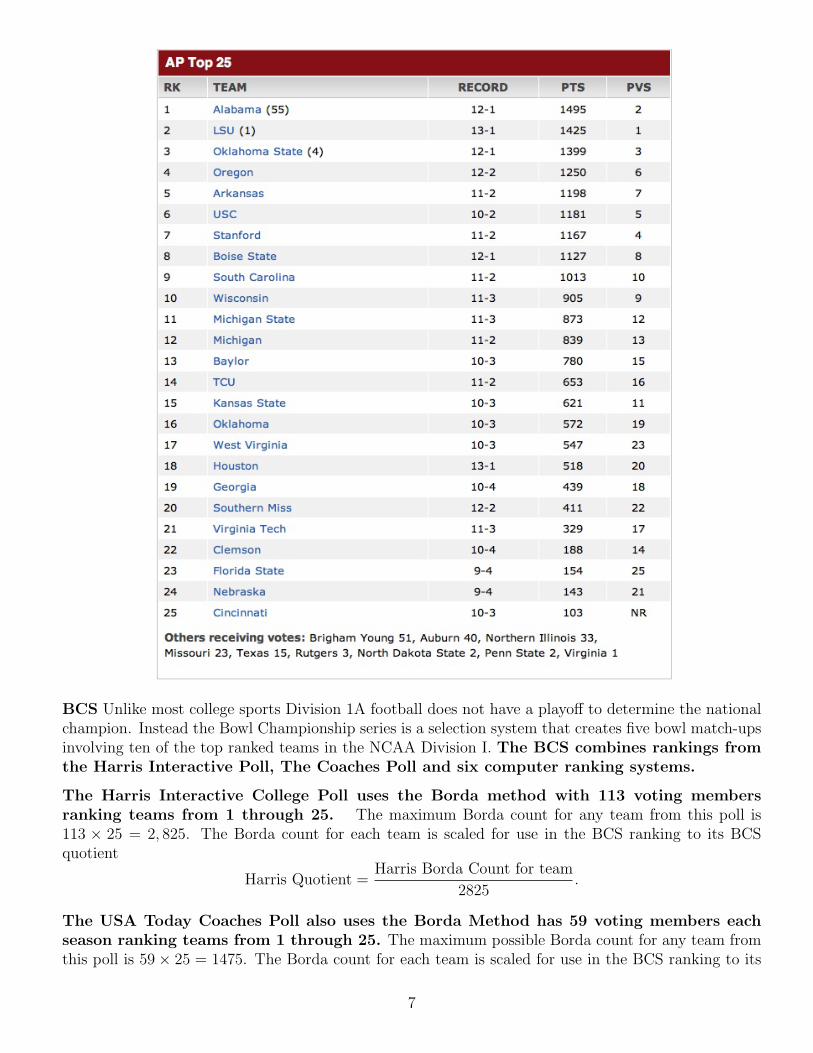
Heisman Trophy
A variation of this method is used to decide the winner of the Heisman Trophy. On the Heisman ballotvoters are asked to rank only their top three choices from among all college football playersin the United States. The Borda count for each player is computed by giving 3 points for each firstplace vote, 2 points for each second place vote and 1 point for each third place vote. The winner isdeclared to be the candidate with the highest Borda count.
NBA most valuable player (uses wider spread of points)
To decide on the winner of the National Basketball Association Most Valuable Player award, 116members of the media list their first through fifth choices for the award. Each first placevote receives 10 points, each second place vote receives 7 points, each third place vote receives 5 points,each fourth place vote receives 3 points and each fifth place vote receives 1 point.
AP Polls
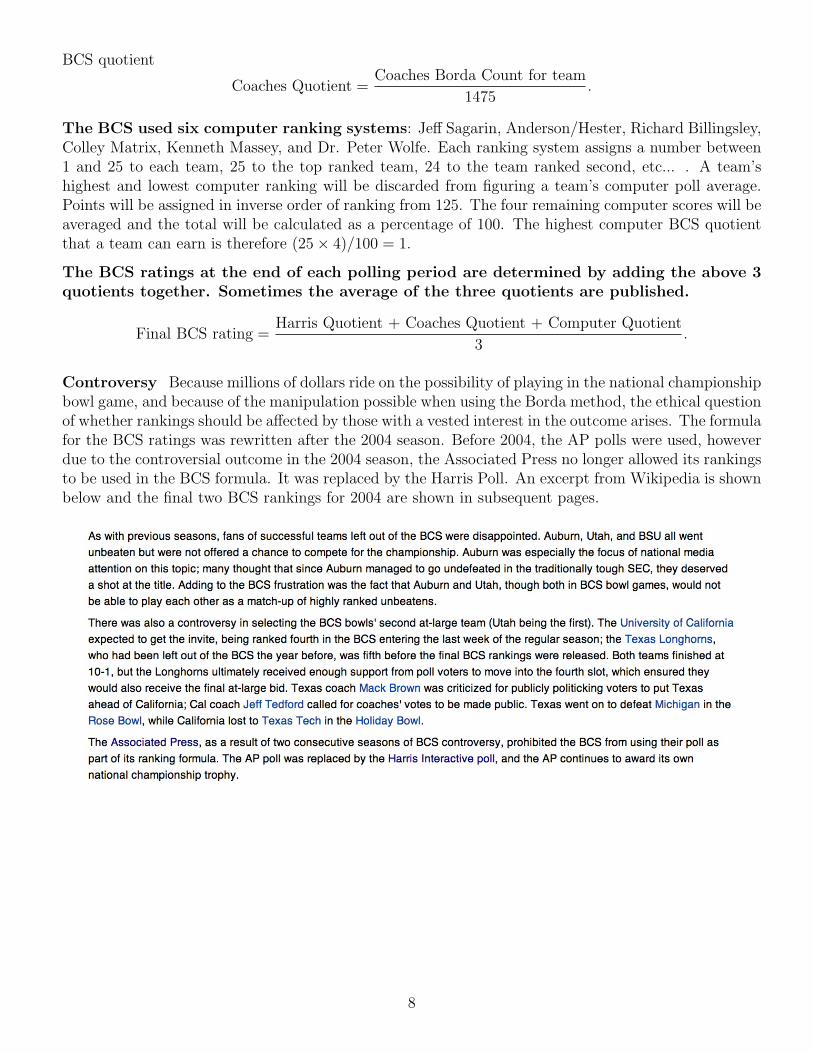
The Associated Press (AP) college football poll gives a ranking for the top teams in college football.The voters in the AP poll are newspaper, radio and television sports reporters throughout the country.In 2011 there were 60 voters and the final rankings are given in the table below.
6
BCS Unlike most college sports Division 1A football does not have a playoff to determine the nationalchampion. Instead the Bowl Championship series is a selection system that creates five bowl match-upsinvolving ten of the top ranked teams in the NCAA Division I. The BCS combines rankings fromthe Harris Interactive Poll, The Coaches Poll and six computer ranking systems.
The Harris Interactive College Poll uses the Borda method with 113 voting membersranking teams from 1 through 25. The maximum Borda count for any team from this poll is113 × 25 = 2, 825. The Borda count for each team is scaled for use in the BCS ranking to its BCSquotient
Harris Quotient =Harris Borda Count for team
2825.
The USA Today Coaches Poll also uses the Borda Method has 59 voting members eachseason ranking teams from 1 through 25. The maximum possible Borda count for any team fromthis poll is 59× 25 = 1475. The Borda count for each team is scaled for use in the BCS ranking to its
7
BCS quotient
Coaches Quotient =Coaches Borda Count for team
1475.
The BCS used six computer ranking systems: Jeff Sagarin, Anderson/Hester, Richard Billingsley,Colley Matrix, Kenneth Massey, and Dr. Peter Wolfe. Each ranking system assigns a number between1 and 25 to each team, 25 to the top ranked team, 24 to the team ranked second, etc... . A team’shighest and lowest computer ranking will be discarded from figuring a team’s computer poll average.Points will be assigned in inverse order of ranking from 125. The four remaining computer scores will beaveraged and the total will be calculated as a percentage of 100. The highest computer BCS quotientthat a team can earn is therefore (25× 4)/100 = 1.
The BCS ratings at the end of each polling period are determined by adding the above 3quotients together. Sometimes the average of the three quotients are published.
Controversy Because millions of dollars ride on the possibility of playing in the national championshipbowl game, and because of the manipulation possible when using the Borda method, the ethical questionof whether rankings should be affected by those with a vested interest in the outcome arises. The formulafor the BCS ratings was rewritten after the 2004 season. Before 2004, the AP polls were used, howeverdue to the controversial outcome in the 2004 season, the Associated Press no longer allowed its rankingsto be used in the BCS formula. It was replaced by the Harris Poll. An excerpt from Wikipedia is shownbelow and the final two BCS rankings for 2004 are shown in subsequent pages.
On January 4, 2005, the FedEx Orange Bowl will host the BCS National Championship Game and determine which team will be presented The National Football Foundation and College Hall of Fame’s MacArthur Trophy, awarded to college football’s National
Champion since 1959, as well as the ADT National Championship Trophy on behalf of the American Football Coaches Association.
The National Football Foundation and College Hall of Fame, Inc.
FOR RELEASE: Embargoed Until Noon ET, November 29, 2004 CONTACT: Rick Walls, NFF Director of Operations
Matt Sweeney, NFF Special Projects Coord. 973-829-1933 Bob Burda, Assistant Commissioner, Big 12 Conference 214-753-0107
Computers
EXPLANATION: Team percentages are derived by dividing a team’s actual voting points by a maximum 1625 possible points in the AP Poll and 1525 possible points in the USA Today/ESPN Coaches Poll.
Six computer rankings calculated in inverse points order (25 for #1, 24 for #2, etc.) are used to determine the overall computer component. The best and worst ranking for each team is dropped, and the remaining four are added and divided by 100 (the maximum possible points) to produce a Computer Rankings Percentage. The six computer ranking providers are Anderson & Hester, Richard Billingsley, Colley Matrix, Kenneth Massey, Jeff Sagarin, and Peter Wolfe. Each computer ranking accounts for schedule strength in its formula. Their individual weekly rankings of all teams may be found at www.BCSfootball.org.
The BCS Average is calculated by averaging the percent totals of the Associated Press, USA Today/ESPN Coaches, and Computer polls.
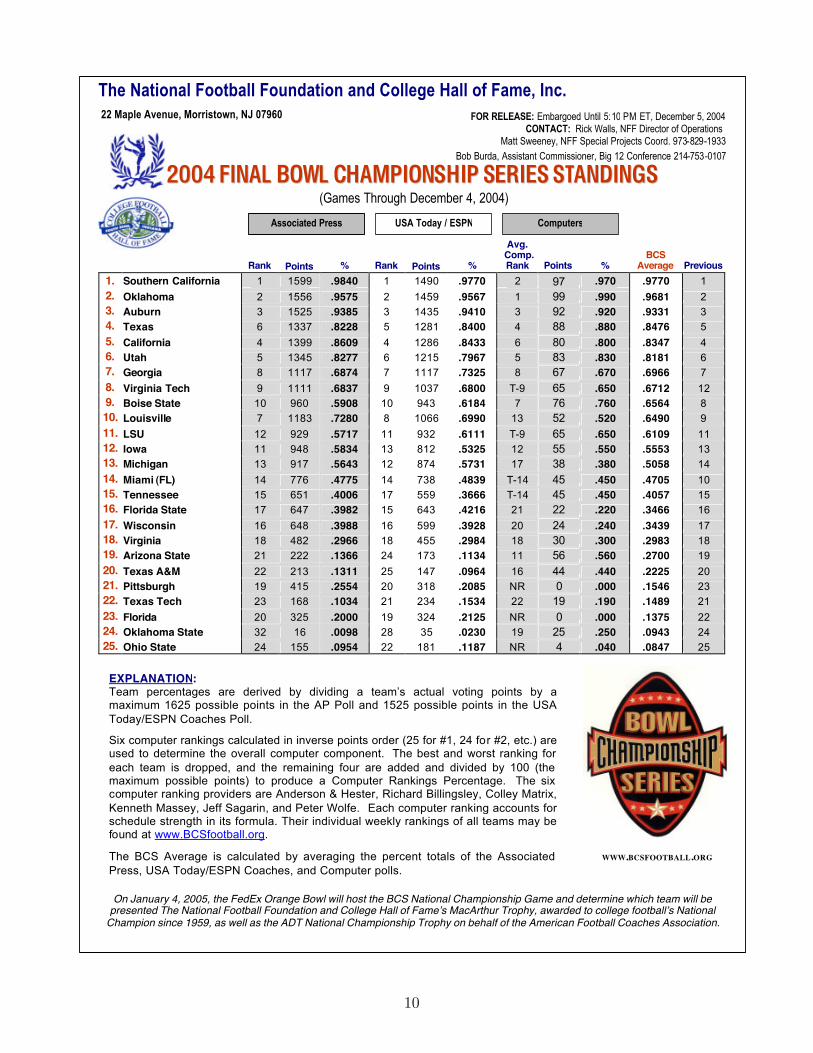
On January 4, 2005, the FedEx Orange Bowl will host the BCS National Championship Game and determine which team will be presented The National Football Foundation and College Hall of Fame’s MacArthur Trophy, awarded to college football’s National
Champion since 1959, as well as the ADT National Championship Trophy on behalf of the American Football Coaches Association.
The National Football Foundation and College Hall of Fame, Inc.
FOR RELEASE: Embargoed Until 5:10 PM ET, December 5, 2004 CONTACT: Rick Walls, NFF Director of Operations
Matt Sweeney, NFF Special Projects Coord. 973-829-1933 Bob Burda, Assistant Commissioner, Big 12 Conference 214-753-0107
Computers
EXPLANATION: Team percentages are derived by dividing a team’s actual voting points by a maximum 1625 possible points in the AP Poll and 1525 possible points in the USA Today/ESPN Coaches Poll.
Six computer rankings calculated in inverse points order (25 for #1, 24 for #2, etc.) are used to determine the overall computer component. The best and worst ranking for each team is dropped, and the remaining four are added and divided by 100 (the maximum possible points) to produce a Computer Rankings Percentage. The six computer ranking providers are Anderson & Hester, Richard Billingsley, Colley Matrix, Kenneth Massey, Jeff Sagarin, and Peter Wolfe. Each computer ranking accounts for schedule strength in its formula. Their individual weekly rankings of all teams may be found at www.BCSfootball.org.
The BCS Average is calculated by averaging the percent totals of the Associated Press, USA Today/ESPN Coaches, and Computer polls.