23
Lecture 4 Cash vs. Futures Prices Primary Texts Edwards and Ma: Chapter 4
| Date post: | 22-Dec-2015 |
| Category: |
Documents |
| Upload: | kory-summers |
| View: | 221 times |
| Download: | 3 times |

Lecture 4Cash vs. Futures Prices
Primary Texts
Edwards and Ma: Chapter 4
Futures Prices
Convention of reporting futures prices The relationship between futures prices and the cash price of the
underlying commodity the relationships between the prices of futures contracts with
different delivery dates Cost-of-Carry pricing relationship Key concepts: Basis, convenience yield, contango,
backwardation, arbitrage, speculation, spreading, hedging

Live Cattle CME (40,000lbs; cents/lbs), Aug 27, 2009Reported by Financial Times
Cont. Month
Settlement Price
Day’s Change High Low
Vol.(000s)
Open Int.(000s)
Aug 85.175 0.100 85.900 84.950 1.4 3.3
Oct 87.575 0.200 88.000 87.250 20.8 111.3
Dec 87.700 0.125 88.000 87.250 6.7 70.3
Feb 88.025 0.150 88.200 87.650 3.0 28.6
Total 34.4 243.1
• Settlement Price: The settlement price is usually determined by a formula using a range of prices recorded within the closing period (such as the last minute of trading) – it is not usually the last trading price of the day

Convention of Reporting Futures Prices
Day’s Change: The difference between today’s settlement price and yesterday’s settlement price – can be either positive or negative
Day’s change = today’s settlement – yesterday’s settlement High: The highest price of a trade recorded during the day Low: The lowest price of a trade recorded during the day Volume: The total number of futures contracts that are traded during
the day. Open Interest: The number of futures contracts that are open at the
close of the previous day’s trading. The actual figures for open interest and trading volume usually
lag price quotations by one day
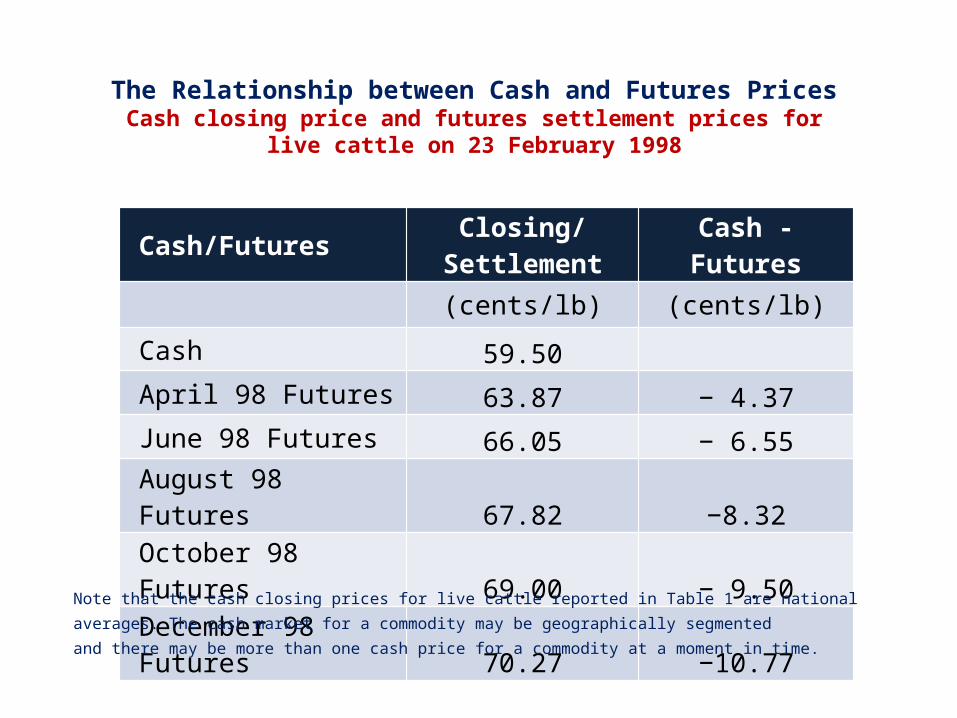
The Relationship between Cash and Futures PricesCash closing price and futures settlement prices for live
cattle on 23 February 1998
Cash/Futures Closing/Settlement Cash - Futures
(cents/lb) (cents/lb)
Cash 59.50
April 98 Futures 63.87 − 4.37
June 98 Futures 66.05 − 6.55
August 98 Futures 67.82 −8.32
October 98 Futures 69.00 − 9.50
December 98 Futures 70.27 −10.77
Note that the cash closing prices for live cattle reported in Table 1 are nationalaverages. The cash market for a commodity may be geographically segmented and there may be more than one cash price for a commodity at a moment in time.

1/2/
1998
1/17
/199
8
2/1/
1998
2/16
/199
8
3/3/
1998
3/18
/199
8
4/2/
1998
4/17
/199
8
5/2/
1998
5/17
/199
8
6/1/
1998
6/16
/199
8
7/1/
1998
7/16
/199
8
7/31
/199
8
8/15
/199
8
8/30
/199
8
9/14
/199
8
9/29
/199
8
10/1
4/19
98
10/2
9/19
98
11/1
3/19
98
11/2
8/19
9850
55
60
65
70
75 Figure 1: Live Cattle Cash and Futures Prices
Cash December Futures
Pri
ce (
cen
ts/l
b)

1/2/
1998
1/17
/199
8
2/1/
1998
2/16
/199
8
3/3/
1998
3/18
/199
8
4/2/
1998
4/17
/199
8
5/2/
1998
5/17
/199
8
6/1/
1998
6/16
/199
8
7/1/
1998
7/16
/199
8
7/31
/199
8
8/15
/199
8
8/30
/199
8
9/14
/199
8
9/29
/199
8
10/1
4/19
98
10/2
9/19
98
11/1
3/19
98
11/2
8/19
9850
55
60
65
70
75 Figure 2: Live Cattle Cash and Futures Prices
Cash Nearest Month Futures December Futures
Pri
ce (
cen
ts/l
b)

There are several obvious features of the cash and futures price relationship shown in Figures 1 and 2:
Futures settlement prices are higher than cash closing prices
Futures Price (FPt, T) > Cash Price (CPt) A distant-month futures price is higher than a near-month futures price
FPt, Dec > FPt, NM > CPt
The difference between the cash and futures price depends on, and increases with, the time to delivery
|CPt – FPt, T | increases with T−t (the time to delivery)
The futures prices slowly but inevitably converges to the cash prices as the delivery date approaches
FPt, T → CPt as t → T
These relationships exist regardless of the level of cash price.
The Relationship between Cash and Futures Prices

Cost-of-Carry: The cost-of-carry refers to the costs of purchasing and carrying (or holding) a commodity for a specified period of time.
Cost-of-Carry = financing costs + storage costs + insurance costs + shipping cost + other miscellaneous costs
CCT-t = CPt × Rt, T × (T-t)/365 + Gt, T + It, T + S + DWhere
CPt = the cash price at time t Rt, T = the annualized riskless interest rate at which funds can
be borrowed at time t for period (T − t) Gt, T = the cost of storing the physical commodity per unit for the
time period from purchase (at t) to delivery (at T) It, T = the cost of insuring the physical commodity per unit for the
time period from purchase (at t) to delivery (at T) S = The costs of shipping and handling the commodity D = Other miscellaneous costs (e.g., depreciation, etc.)
The Cost-of-Carry Price Relationship

The cost-of-carry formula is based on simple interest financing cost. It does not allow for continuous compounding interest costs. The formula assumes that there are no information or transaction costs
associated with buying or selling either futures or physical commodity, credit risks, taxes, and so on.
The Full-Carry Futures Price: The full-carry futures price of a commodity refers to the estimated futures price using the following formula.
FP* = CPt + CCT-t
Thus, at any given time t the estimated futures price with delivery time T is equal to the cash price plus the cost of carrying the commodity for the period of T-t.
The Cost-of-Carry Price Relationship

Example: Cost-of-Carry and Full-carry Futures Price
Date: Feb 02, 2010
Cash price of wheat in Lubbock (CPt): 550.50 cents per bushel
Simple interest rate (Rt, T): 10%
Storage and Ins. costs (Gt, T +It, T): 5 cents per bushel per month
Shipping costs (S) 0
Other Costs (D): 0
September 2010 Wheat CME Futures Contract:
Cost-of-Carry (CCt,T):
Full-Carry Futures Price (FP*)
Calculating the Cost-of-Carry and Full-Carry Futures Price
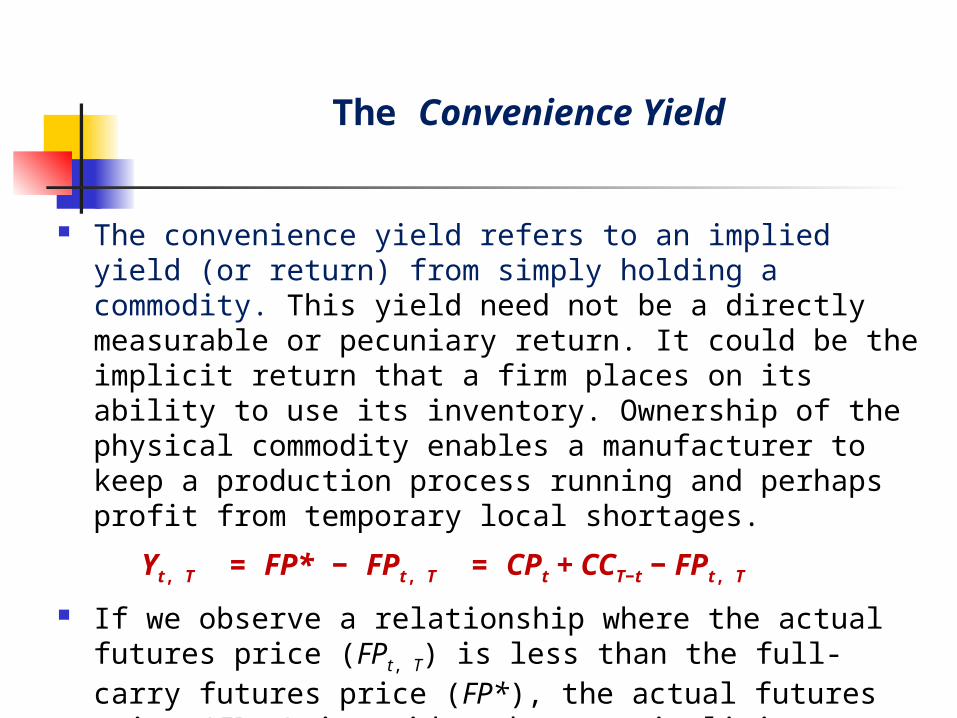
The Convenience Yield
The convenience yield refers to an implied yield (or return) from simply holding a commodity. This yield need not be a directly measurable or pecuniary return. It could be the implicit return that a firm places on its ability to use its inventory. Ownership of the physical commodity enables a manufacturer to keep a production process running and perhaps profit from temporary local shortages.
Yt, T = FP* − FPt, T = CPt + CCT−t − FPt, T
If we observe a relationship where the actual futures price (FPt, T) is less than the full-carry futures price (FP*), the actual futures price (FPt, T) is said to have an implicit convenience yield.
Example: Yt, T = FP* − FPt, T = 617.61 − 612.75 = 4.86 cents/bushel.

The Cost-of-Carry and Convenience Yield Pricing Relationship:
Based on the cost-of-carry and convenience yield concepts, the fundamental pricing formula for commodity futures is given by
FPt, T = CPt + CCT-t − Yt,T FPt, T − CPt + Yt,T = CCT-t
If Yt,T = 0, FPt, T − CPt = CCT-t => FPt, T = FP*
If Yt,T > 0, FPt, T − CPt < CCT-t => FPt, T < FP* Futures price cannot exceed the spot price by more than the cost-of-
carry,
FPt, T − CPt ≤ CCT-t
Thus, actual Futures price cannot exceed the full-carry futures price
=> FPt, T ≤ FP*

No-Risk Cash-Futures Arbitrage
What happens if the futures price of a commodity is too far above the spot price?
FPt,T > FP* => Arbitrage: Short Futures, Buy Cash Commodity Short Futures => Supply of Futures ↑ => Futures Price ↓ Buy cash comm. => Demand for Comm. ↑ => Cash Price ↑ Arbitrage => FPt,T − CPt ↓ => FPt,T − CPt ≈ CCt,T
What happens if the futures price of a commodity is too far below the spot price?
FPt,T << FP* => Arbitrage: Long Futures, Sell Cash Commodity Long Futures => Demand for Futures ↑ => Futures Price ↑ Sell cash comm. => Supply of Comm. ↑ => Cash Price ↓ Arbitrage => FPt,T − CPt ↓ => FPt,T − CPt ≈ CCt,T

Cash-Futures Arbitrage Example: Observed Futures Price is Greater than Full-Carry Futures Price
Monday, February 02, 2009
Cash price of wheat = 550.5 cents per bushelInterest rate = 10%Costs of storage and insurance = 5 cents per bushel per monthFull-carry September 09 wheat futures price = 617.61 cents per bushelSeptember 09 wheat futures contracts are now 625.50 cents per bushel
Activities Cash Flows
Monday, February 02, 2009
Sell September 09 wheat futures @ 625.50 cents 0.00Borrow 550.50 cents @ 10% interest 550.50Buy cash wheat @ 550.50 cents -550.50
Wednesday, September 02, 2009
Deliver wheat against futures 625.50Pay back the loan
Principal -550.50Interest (550.50 × 0.10 × 7/12) -32.11
Storage and insurance costs (5 × 7) -35.00
Net Arbitrage Profit 7.89

Cash-Futures Arbitrage: FPt,T > FP*
Date:
Cash price
Interest rate
Costs of storage and insurance
Full-carry futures price
Observed futures price
Activities Cash Flows
Date:
Sell futures @
Borrow @ 10% interest
Buy Cash commodity @
Date:
Deliver cash commodity
Pay Back the Loan - Principal
Interest ( )
Storage and Insurance Cost
Net Arbitrage profit

Cash-Futures Arbitrage Example: Observed Futures Price is much lower than Full-Carry Futures Price
Monday, February 02, 2009
Cash price of wheat = 550.5 cents per bushelInterest rate = 10%Costs of storage and insurance = 5 cents per bushel per monthFull-carry September 09 wheat futures price = 617.61 cents per bushelSeptember 09 wheat futures contracts are now 580.00 cents per bushel
Activities Cash Flows
Monday, February 02, 2009
Buy September 09 wheat futures @ 580 cents 0.00Sell cash commodity @ 550.50 cents 550.50Invest the proceeds at 10% interest rates -550.50
Wednesday, September 02, 2009
Take delivery of wheat against the long -580.00Withdraw cash from the risk-free investment
Principal 550.50Interest (550.50 × 0.10 × 7/12) 32.11
Net Arbitrage Profit 2.61

Cash-Futures Arbitrage: FPt,T << FP*
Date:
Cash price
Interest rate
Costs of storage and insurance
Full-carry futures price
Observed futures price
Activities Cash Flows
Date:
Buy futures @
Sell cash commodity @
Invest proceeds @ 10% interest
Date:
Take delivery of cash commodity
Withdraw cash from investment
Principal
Interest
Net Arbitrage profit

The Basis
The basis is defined as the difference between cash and futures prices. The basis can either be negative, or positive, or zero. In particular,
Bt, T = CPt − FPt, T = Yt, T − CCT−t
For Yt, T ≥ 0 and CCt,T ≥ 0, a negative basis reflects that the convenience yield is lower than the cost-of-carry.
Bt, T < 0 => CPt < FPt, T => Yt, T < CCT−t
The basis is positive when the futures price is lower than the cash price. In this case, the convenience is higher than the cost-of-carry.
Bt, T > 0 => CPt > FPt, T => Yt, T > CCT−t
The basis is zero when the convenience yield and cost-of-carry are equal or when both the convenience yield and cost-of-carry are zero.
Bt, T = 0 => CPt = FPt, T => Yt, T = CCT−t or Yt, T = 0 = CCT−t

Contango Markets
Contango: A market condition is referred to as in contango when, at a particular point in time, futures prices rise progressively with the time to delivery, i.e. the futures price of a distant delivery month is higher than the futures price of a near delivery month. Contango => FPt, T+n > FPt, T where n=1,….., N
A contango is normal for a non-perishable commodity which has a positive cost-of-carry.

Contango Market Condition
On 02 February 2009, the wheat futures market was in contango.
CBOT Wheat futures Contract and Prices on 02 February 2009
Con. Month Settlement Day's Change High Low Vol. (000s) Open Int.
Mar 563.75 -4.25 571.00 551.75 32.17 120.89
May 576.75 -4.00 584.00 565.00 7.92 47.02
Jul 588.75 -4.00 595.75 576.75 10.57 59.93
Sep 612.75 -2.75 618.25 600.50 1.48 18.17
Dec 633.00 -2.50 640.00 620.50 7.59 31.00
Total 60.18 285.97
Chicago Board of Trade: 5,000 bu min; cents/60 lb bushel

Backwardation Markets
Backwardation is commonly referred to a market condition in which, at a particular point in time, futures prices fall progressively with the time to delivery, i.e. the futures price of a distant delivery month is lower than the futures price of a near delivery month. . Backwardation => FPt, T+n < FPt, T where n=1,…..,
N
Backwardation is characterized by a shortage of the physical commodity. Backwardation often occurs at times when cash prices are high and have been rising sharply, a manifestation of a shortage in the market. In such cases, the underlying commodity is said to have a positive convenience yield.

Backwardation Market Condition
On 02 February 2009, the soybean meal futures market was in backwardation.
CBOT Soybean Meal Futures Contract and Prices on 02 February 2009
Con. Month Settlement Day's Change High Low Vol. (000s) Open Int.
Mar 306.20 -4.80 310.00 299.60 23.30 53.12
May 304.70 -4.60 307.10 298.40 7.63 30.99
Jul 304.90 -4.70 307.70 298.50 5.46 19.01
Aug 303.60 -5.70 302.50 298.40 0.75 4.27
Sep 297.30 -4.50 297.00 298.50 0.37 4.14
Oct 284.70 -3.20 302.50 280.00 0.56 2.75
Total 41.32 127.39
Chicago Board of Trade:100 tons; $/ton


