17
| Date post: | 30-Dec-2015 |
| Category: |
Documents |
| Upload: | xander-finley |
| View: | 30 times |
| Download: | 0 times |


Area Study
Residential Area
Public Area
Commercial Area
Agricultural Area
Streets

Item Area (m2)
%
Total Area 641 Donum
100
Domestic Area
Public Area
Commercial Area
Commercial Domestic Area
Agricultural Area
Industrial Area
Streets
Schools or Mosques
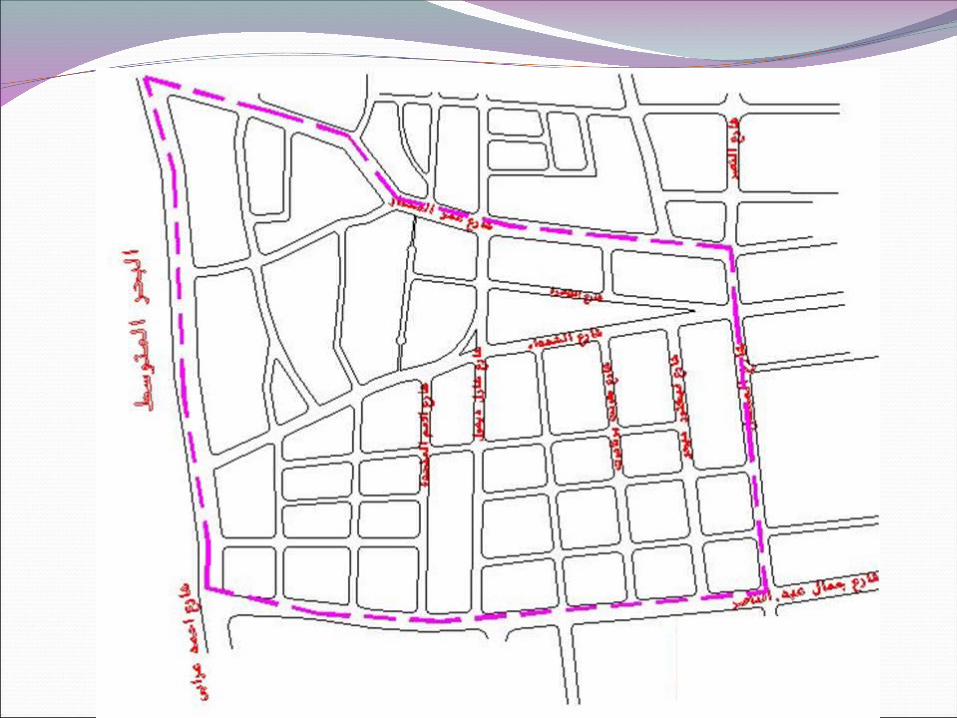
Al Remal Al Janoubi

Population DensityCalculation of total number of residents:
1. Normal Increase ( using equations)
Example:- Total Area of Southern Remal = 2,754 Dounm
- Total population in Southern Remal in 2002 = 17,500
- Total population in Southern Remal in 2008 = 29,300
tof kPP 1
112.0175006
1750029300
6 2002
20022008
P
PPk
person
PP
213,427
30)^112.01(20082038
Statistical Data
Hypothetical figures
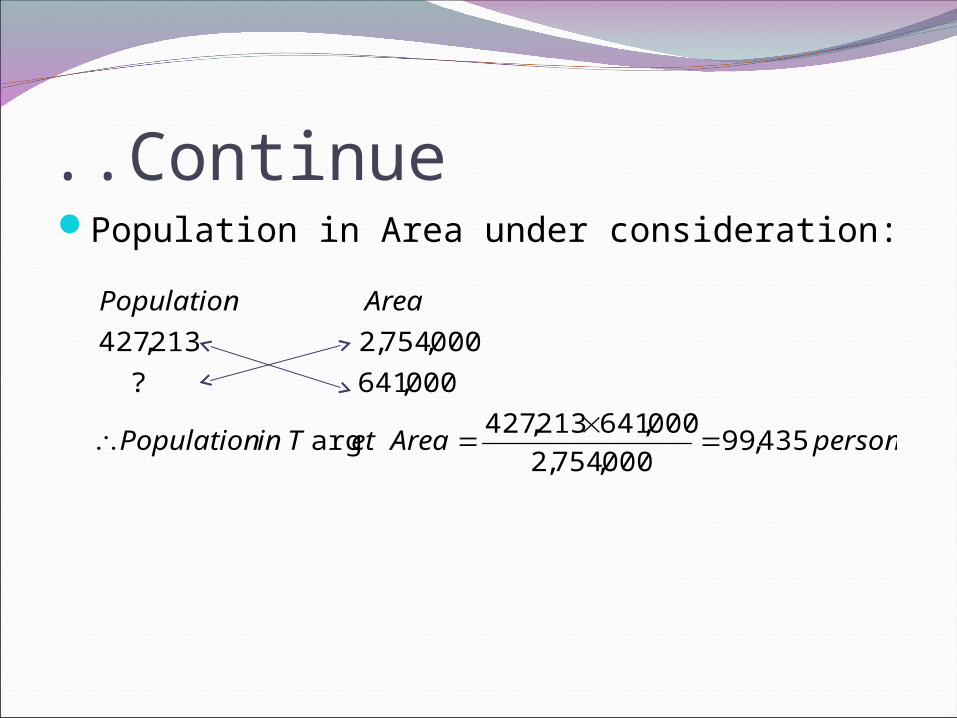
Continue..Population in Area under consideration:
personAreaetTinPopulation
AreaPopulation
435,99000,754,2
000,641213,427arg
000,641?
000,754,2213,427

Population Density2. Saturation populationTotal Residential Area = 519,917 m2
Total number of population under saturation condition = 45,721 + 59,918 = 105,639
Regular Buildings (5 floors or less)
Towers (6 floors and more)
Area 370,122 149,795
Avg. no. of floors 3 8
Avg. area of flats (m2)
170 140
# of flats (370,122/170) x 3 (149,795/140) x 8
Avg. no. of persons/flat
7 7
No. of residents 45,721 59,918

Population DensityTherefore,Population density= Population / Total Area
= 99,435 / 641,000 = 0.155 person/m2
For your project use the following
data;Total Area of Southern Remal = 2,754 Dounm
Total population in Southern Remal in 2002 = 17,500 inh.
Total population in Southern Remal in 2008 = 29,300 inh.
Regular buildings,
# of stories = 5
apartment area = 150 m2
# of family members = 7
Population density = ??!!

Allocation steps:Draw network layout for the target year and pinpoint junctions
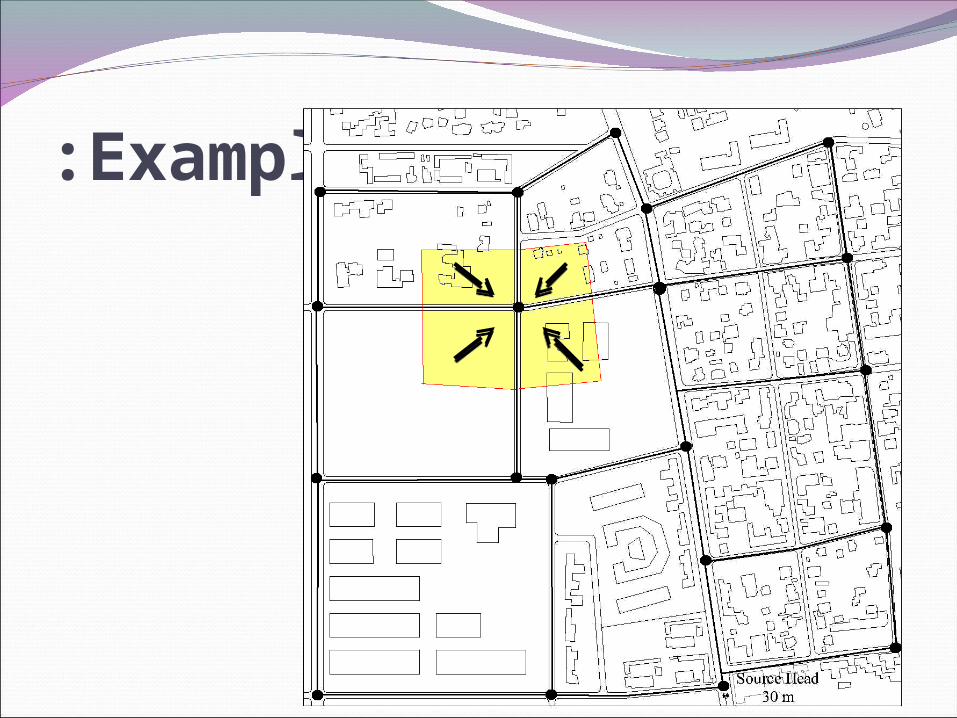
and pipelines.Draw areas around the nodes in a way that cover the entire area
under consideration.Determine the water demand type of each junction using the land
use map prepared and determine the areas that are served by each junction.
Calculate the number of population served by each junction (using the area and the density)
Calculate the demand of each junction by multiplying the population by the average consumption per capita.
Specify other types of demand and allocate them to the nearest nodes.
The demand of each junction should be multiplied by a coefficient accounts for UFW in the design year.
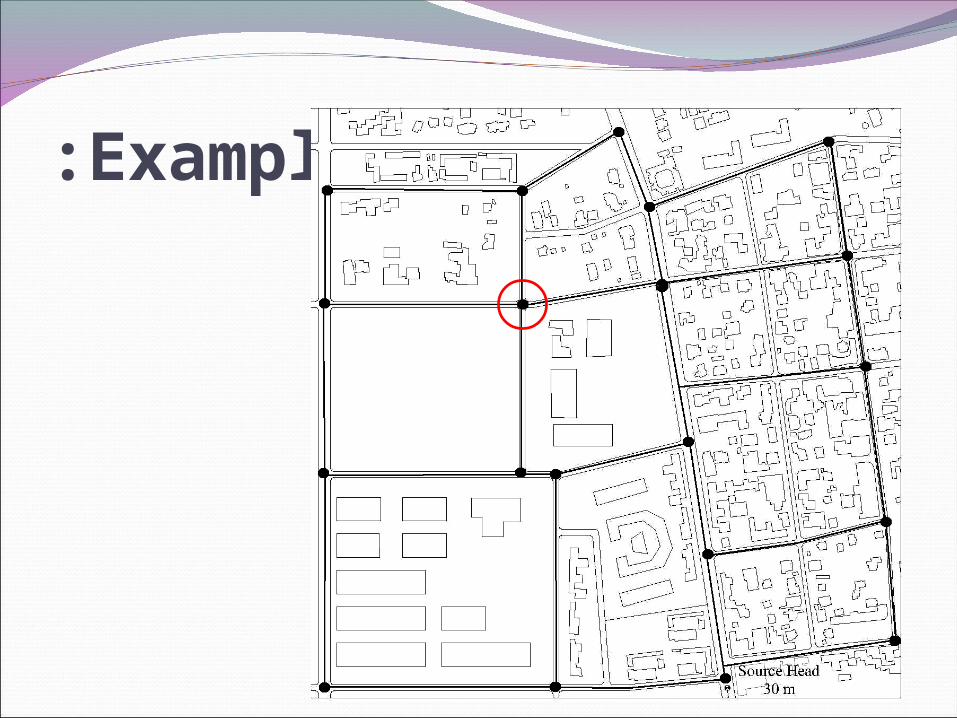
Example:
Example:
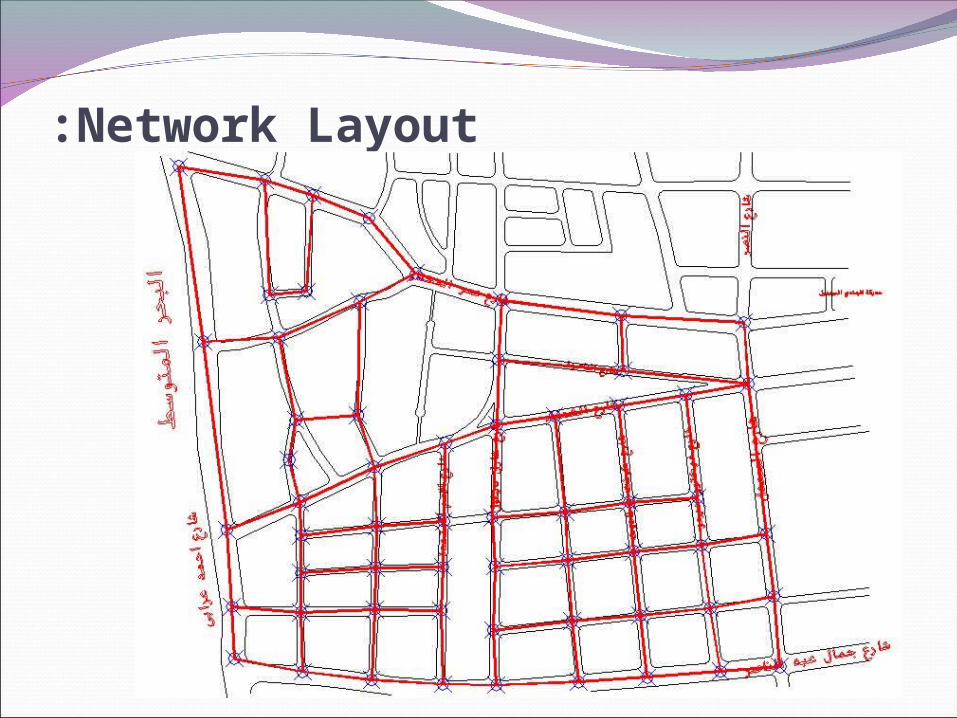
Network Layout:
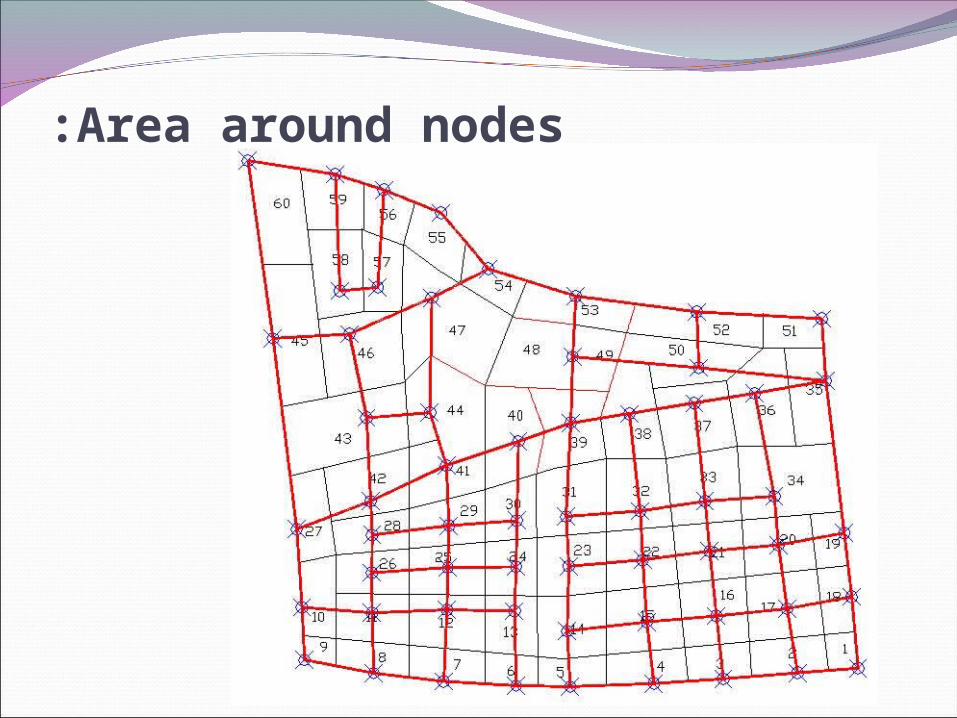
Area around nodes:
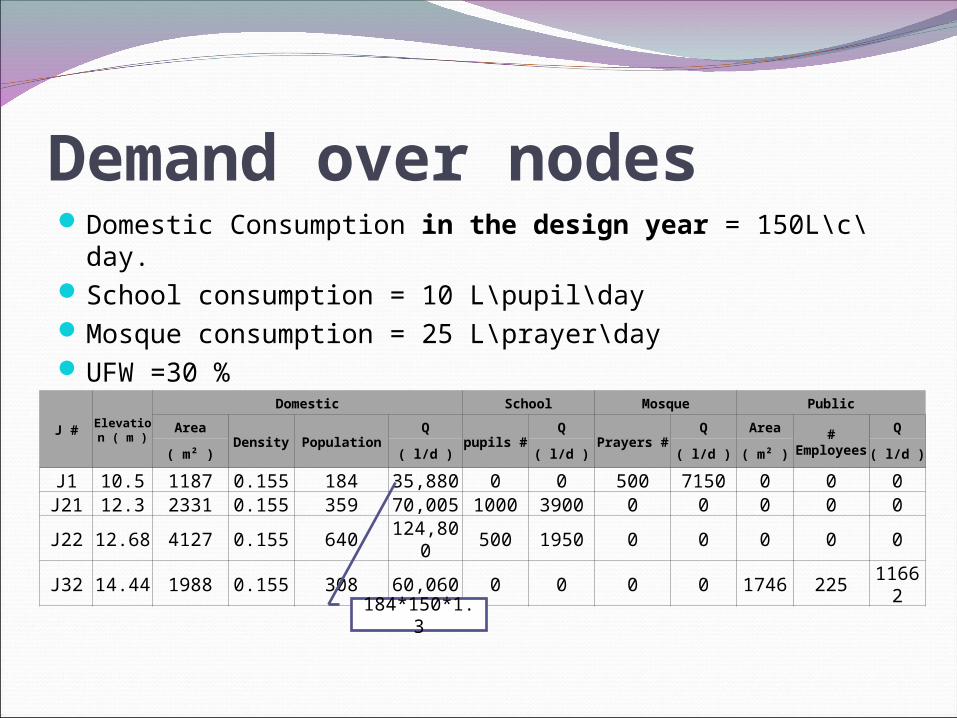
Demand over nodesDomestic Consumption in the design year = 150L\c\day.School consumption = 10 L\pupil\dayMosque consumption = 25 L\prayer\dayUFW =30 %
#J Elevation ( m )
Domestic School Mosque PublicArea
Density PopulationQ
#pupilsQ
#PrayersQ Area #
Employees
Q
(m²) (l/d) (l/d) (l/d) (m²) (l/d)
J1 10.5 1187 0.155 184 35,880 0 0 500 7150 0 0 0J21 12.3 2331 0.155 359 70,005 1000 3900 0 0 0 0 0
J22 12.68 4127 0.155 640124,80
0500 1950 0 0 0 0 0
J32 14.44 1988 0.155 308 60,060 0 0 0 0 1746 22511662
184*150*1.3

Assignment:Network layout.Area around nodes.Demand over nodes.
Due date: 07/5/2011

Questions


