sampling S.Lan Basic Concepts CI of Means CI of Variances CI of Proportions Lecture 5 Interval Estimation Shiwei Lan 1 1 School of Mathematical and Statistical Sciences Arizona State University STP427 Mathematical Statistics Fall 2019 1 / 27
Transcript
sampling
S.Lan
Basic Concepts
CI of Means
CI of Variances
CI ofProportions
Lecture 5 Interval Estimation
Shiwei Lan1
1School of Mathematical and Statistical SciencesArizona State University
STP427 Mathematical StatisticsFall 2019
1 / 27
sampling
S.Lan
Basic Concepts
CI of Means
CI of Variances
CI ofProportions
Table of Contents
1 Basic Concepts
2 CI of Means
3 CI of Variances
4 CI of Proportions
2 / 27
sampling
S.Lan
Basic Concepts
CI of Means
CI of Variances
CI ofProportions
Point Estimate vs Interval Estimate
3 / 27
sampling
S.Lan
Basic Concepts
CI of Means
CI of Variances
CI ofProportions
Point Estimate vs Interval Estimate
4 / 27
sampling
S.Lan
Basic Concepts
CI of Means
CI of Variances
CI ofProportions
Confidence Interval
5 / 27
sampling
S.Lan
Basic Concepts
CI of Means
CI of Variances
CI ofProportions
Interval Estimation
Definition (Confidence Interval)
If θl and θu are values of the random variables θl and θu such that
P[θl < θ < θu] = 1− α
for some specified probability 1− α, then we refer to the interval θl < θ < θu as a(1− α)100% confidence interval (CI) for θ. α > 0 is called confidence level,1− α is called the degree of confidence, and θl and θu are called lower and upperconfidence limits.
Example
Suppose Xiiid∼ N(µ, σ2). Then Z = X−µ
σ/√n∼ N(0, 1). We have
P[|Z | < zα/2] = 1− α
This implies x − zα/2σ√n< θ < x + zα/2
σ√n
.6 / 27
sampling
S.Lan
Basic Concepts
CI of Means
CI of Variances
CI ofProportions
Interpretation of Confidence Interval
• The (1− α)100% CI (θl , θu) is deterministic. Therefore for any specific(hypothesized) value θ0, θ0 ∈ (θl , θu) has probability either 0 or 1.P[θ0 ∈ (θl , θu)] 6= 1− α !!!
• The (1− α)100% CI for θ can be interpreted: if the experiment was repeatedfor multiple times from each a CI is obtained, then (1− α)100% of themwould contain θ.
7 / 27
sampling
S.Lan
Basic Concepts
CI of Means
CI of Variances
CI ofProportions
Table of Contents
1 Basic Concepts
2 CI of Means
3 CI of Variances
4 CI of Proportions
8 / 27
sampling
S.Lan
Basic Concepts
CI of Means
CI of Variances
CI ofProportions
One-Sample Mean, known variance
Theorem
If x is the value of the mean of a random sample of size n from a (normal)population with the known variance σ2, then
x − zα/2σ√n< µ < x + zα/2
σ√n
is a (approximate) (1− α)100% CI for the population mean.
zα/2σ√n
is called margin of error. Note that we also have
P
[X − µσ/√n< zα
]= 1− α, or P
[X − µσ/√n> −zα
]= 1− α
This gives a one-sided (1− α)100% CI for the population mean µ.
µ > x − zασ√n, or µ < x + zα
σ√n
9 / 27
sampling
S.Lan
Basic Concepts
CI of Means
CI of Variances
CI ofProportions
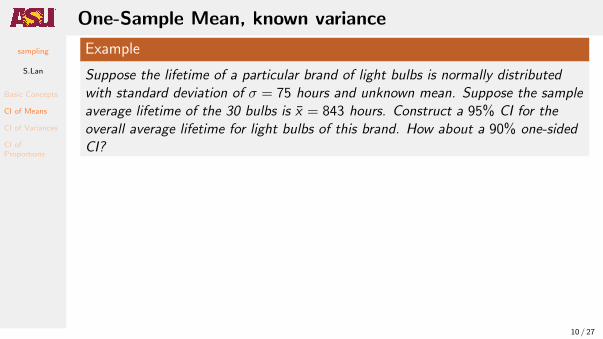
One-Sample Mean, known variance
Example
Suppose the lifetime of a particular brand of light bulbs is normally distributedwith standard deviation of σ = 75 hours and unknown mean. Suppose the sampleaverage lifetime of the 30 bulbs is x = 843 hours. Construct a 95% CI for theoverall average lifetime for light bulbs of this brand. How about a 90% one-sidedCI?
10 / 27
sampling
S.Lan
Basic Concepts
CI of Means
CI of Variances
CI ofProportions
One-Sample Mean, known variance
Example
Suppose the lifetime of a particular brand of light bulbs is normally distributedwith standard deviation of σ = 75 hours and unknown mean. What is theminimum sample size required if we wish to estimate the overall average lifetimefor light bulbs to within 10 hours with 90% confidence?
11 / 27
sampling
S.Lan
Basic Concepts
CI of Means
CI of Variances
CI ofProportions
One-Sample Mean, unknown variance
Note, when the population variance is unknown, we substitute it with the samplevariance and have the following t statistic
T =X − µS/√n∼ tn−1
Theorem
If x and s are the values of the mean and the standard deviation of a randomsample of size n from a (normal) population with unknown variance, then
x − tα/2,n−1sx√n< µ < x + tα/2,n−1
sx√n
is a (approximate) (1− α)100% CI for the population mean.
12 / 27
sampling
S.Lan
Basic Concepts
CI of Means
CI of Variances
CI ofProportions
One-Sample Mean, unknown variance
Example
Suppose the lifetime of a particular brand of light bulbs is normally distributedwith unknown mean and variance. Suppose a sample of 30 bulbs is taken and thethe sample average lifetime is x = 843 hours and the sample standard deviation iss = 75 hours. Construct a 95% CI for the overall average lifetime for light bulbsof this brand.
13 / 27
sampling
S.Lan
Basic Concepts
CI of Means
CI of Variances
CI ofProportions
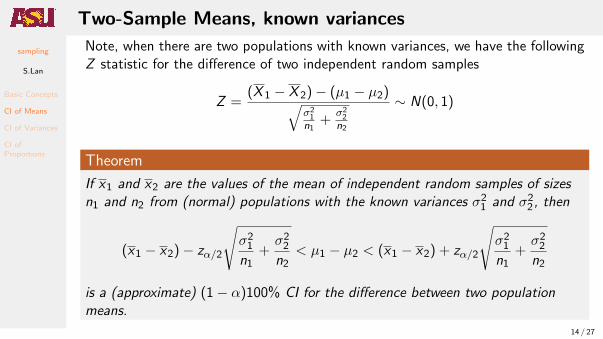
Two-Sample Means, known variances
Note, when there are two populations with known variances, we have the followingZ statistic for the difference of two independent random samples
Z =(X 1 − X 2)− (µ1 − µ2)√
σ21
n1+
σ22
n2
∼ N(0, 1)
Theorem
If x1 and x2 are the values of the mean of independent random samples of sizesn1 and n2 from (normal) populations with the known variances σ21 and σ22, then
(x1 − x2)− zα/2
√σ21n1
+σ22n2
< µ1 − µ2 < (x1 − x2) + zα/2
√σ21n1
+σ22n2
is a (approximate) (1− α)100% CI for the difference between two populationmeans.
If x1, x2, s1 and s2 are the values of the means and the standard deviations ofindependent random samples of sizes n1 and n2 from normal populations withequal variances, then
(x1 − x2)− tα/2,n1+n2−2sp
√1
n1+
1
n2< µ1 − µ2
< (x1 − x2) + tα/2,n1+n2−2sp
√1
n1+
1
n2
is a (1− α)100% CI for the difference between two population means.
What if the normality assumption is absent???
17 / 27
sampling
S.Lan
Basic Concepts
CI of Means
CI of Variances
CI ofProportions
Two-Sample Means, unknown variances (pooled)
Example
• An investigation to determine if women employees are as well paid as theirmale counterparts in comparable jobs:
• Random samples of 14 males and 11 females in junior academic positions areselected.
• Male: Sample mean $48,530, sample sd: 780
• Female: Sample mean $47,620, sample sd: 750
• Assume that the populations are normally distributed with equal variances.
Construct 95% CI for the difference between two population means.
18 / 27
sampling
S.Lan
Basic Concepts
CI of Means
CI of Variances
CI ofProportions
Table of Contents
1 Basic Concepts
2 CI of Means
3 CI of Variances
4 CI of Proportions
19 / 27
sampling
S.Lan
Basic Concepts
CI of Means
CI of Variances
CI ofProportions
One-Sample Variance
Recall that for normal population, we have the following χ2 statistic
(n − 1)S2
σ2∼ χ2
n−1
To obtain the (1− α)100% CI for the population variance σ2, we need
P
[χ21−α/2,n−1 <
(n − 1)S2
σ2< χ2
α/2,n−1
]= 1− α
Theorem
If s2 is the value of the variance of a random sample of size n from a normalpopulation, then
(n − 1)s2
χ2α/2,n−1
< σ2 <(n − 1)s2
χ21−α/2,n−1
is a (1− α)100% CI for the population variance.
20 / 27
sampling
S.Lan
Basic Concepts
CI of Means
CI of Variances
CI ofProportions
One-Sample Variance
Example
Let X1, . . . ,X13 are normally distributed, but we do not know true populationmean and variance.Let 12 ∗ S2 = 128.41. Find 90% CI for variance.χ20.05,12 = 21.03, χ2
0.95,12 = 5.226
[(n − 1)s2
χ2α/2,n−1
,(n − 1)s2
χ21−α/2,n−1
]
=
[128.41
21.03,
128.41
5.226
]=
[128.41
21.03,
128.41
5.226
]= [6.11, 24.57]
21 / 27
sampling
S.Lan
Basic Concepts
CI of Means
CI of Variances
CI ofProportions
Two-Sample Variances*
When there are two normal populations, we have the following F statistic for theratio of variances with two independent random samples
F =S21/σ
21
S22/σ
22
∼ N(0, 1)
To obtain the (1− α)100% CI for the variance ratioσ21
σ22, we need
P[f1−α/2,n1−1,n2−1 < F < fα/2,n1−1,n2−1
]= 1− α
Theorem
If s21 and s22 are the values of the variances of independent random samples ofsizes n1 and n2 from normal populations, then
s21s22
1
fα/2,n1−1,n2−1<σ21σ22
<s21s22
fα/2,n2−1,n1−1
is a (1− α)100% CI for the population variance raito.22 / 27
sampling
S.Lan
Basic Concepts
CI of Means
CI of Variances
CI ofProportions
Table of Contents
1 Basic Concepts
2 CI of Means
3 CI of Variances
4 CI of Proportions
23 / 27
sampling
S.Lan
Basic Concepts
CI of Means
CI of Variances
CI ofProportions
One-Sample Proportion
In many scenarios, we are interested in proportions. For the binomial populationX ∼∼ binom(n, θ), we have the following asymptotic Z statistic by CLT:
Zn =X − nθ√nθ(1− θ)
D→ N(0, 1)
We need to solve∣∣ xn − θ
∣∣ < zα/2
√θ(1−θ)
n . How?
Theorem
If X is a binomial random variable with parameter θ for large n, and θ = xn , then
θ − zα/2
√θ(1− θ)
n< θ < θ + zα/2
√θ(1− θ)
n
is an approximate (1− α)100% CI for the population proportion θ.
24 / 27
sampling
S.Lan
Basic Concepts
CI of Means
CI of Variances
CI ofProportions
One-Sample Proportion
Example
• Just prior to an important election, in a random sample of 749 voters, 397preferred Candidate Y over Candidate Z.
• Construct a 90% confidence interval for the overall proportion of voters whoprefer Candidate Y over Candidate Z.
• X = 397, n = 749. p = Xn = 397
749 = 0.53.
• The confidence interval: p ± zα/2
√p(1−p)
n .
• 90% confidence level: α = 0.10, zα/2 = 1.645
• 0.53± 1.645√
0.54·0.47749 = (0.50, 0.56)
25 / 27
sampling
S.Lan
Basic Concepts
CI of Means
CI of Variances
CI ofProportions
Two-Sample Proportions
Note, when there are two populations, we are interested in the difference of twoproportions. By CLT, we have the following asymptotic Z statistic with twoindependent random samples
Zn =(θ1 − θ2)− (θ1 − θ2)√
θ1(1−θ1)n1
+ θ2(1−θ2)n2
∼ N(0, 1)
Theorem
If X1 ∼ b(n1, θ1) and X2 ∼ b(n2, θ2) are independent, and θi = xin i = 1, 2, then
(θ1 − θ2)− zα/2
√θ1(1− θ1)
n1+θ2(1− θ2)
n2< θ1 − θ2
< (θ1 − θ2) + zα/2
√θ1(1− θ1)
n1+θ2(1− θ2)
n2
is an approximate (1− α)100% CI for θ1 − θ2.26 / 27
sampling
S.Lan
Basic Concepts
CI of Means
CI of Variances
CI ofProportions
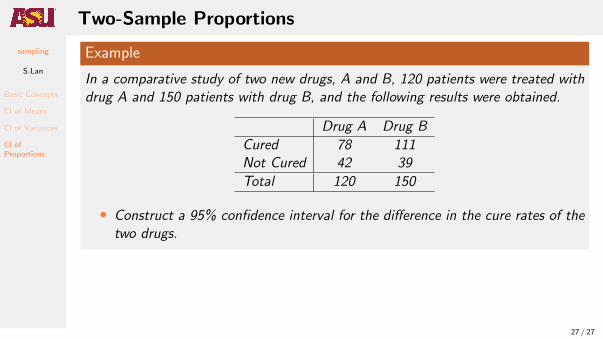
Two-Sample Proportions
Example
In a comparative study of two new drugs, A and B, 120 patients were treated withdrug A and 150 patients with drug B, and the following results were obtained.
Drug A Drug B
Cured 78 111Not Cured 42 39
Total 120 150
• Construct a 95% confidence interval for the difference in the cure rates of thetwo drugs.