Page 1
8/13/2019 Lecture 6 - Metabolic Modeling
http://slidepdf.com/reader/full/lecture-6-metabolic-modeling 1/38
USC-MSChE Course: Bioprocess Technology Metabolic Modeling Engr. Evelyn M. Buque-Taboada
Metabolic Modeling**
Introduction
Basic types of reaction and related enzyme kinetics
Biochemical Networks
Thermodynamic description of chemical networks
** adaptation of the lectures by Prof. J.J. Heijnen, TUDelft, The Netherlands
Page 2
8/13/2019 Lecture 6 - Metabolic Modeling
http://slidepdf.com/reader/full/lecture-6-metabolic-modeling 2/38
USC-MSChE Course: Bioprocess Technology Metabolic Modeling Engr. Evelyn M. Buque-Taboada
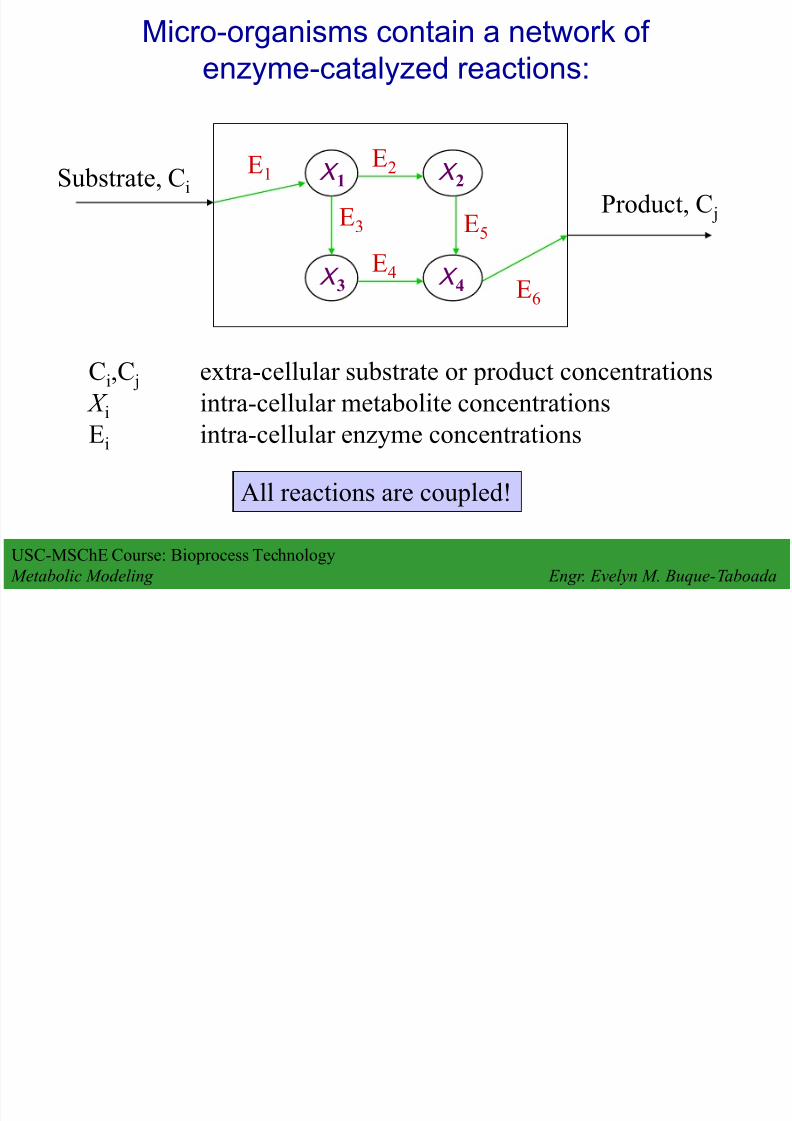
Micro-organisms contain a network of
enzyme-catalyzed reactions:
Substrate, CiProduct, C j
X 1
X 3
X 2
X 4
E1
E3
E6
E5
E4
E2
Ci,C j extra-cellular substrate or product concentrations
X i intra-cellular metabolite concentrationsEi intra-cellular enzyme concentrations
All reactions are coupled!
Page 3
8/13/2019 Lecture 6 - Metabolic Modeling
http://slidepdf.com/reader/full/lecture-6-metabolic-modeling 3/38
USC-MSChE Course: Bioprocess Technology Metabolic Modeling Engr. Evelyn M. Buque-Taboada
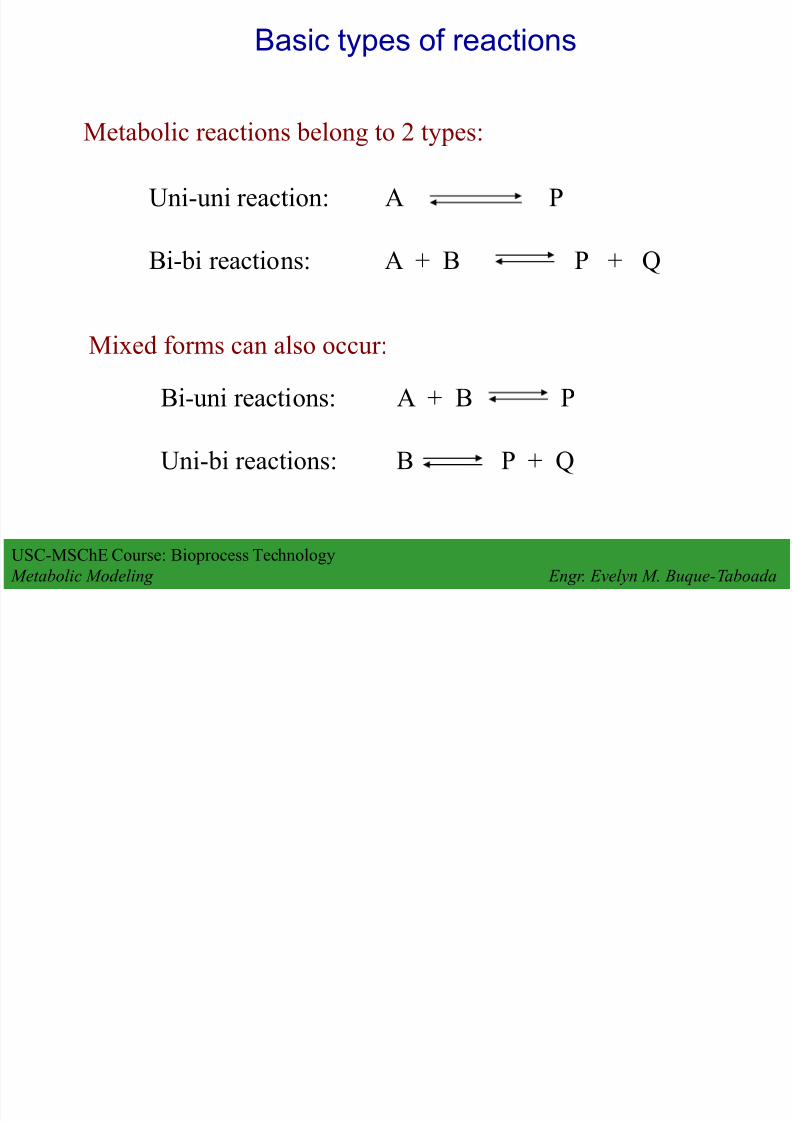
Basic types of reactions
Metabolic reactions belong to 2 types:
Uni-uni reaction: A P
Bi-bi reactions: A + B P + Q
Mixed forms can also occur:
Bi-uni reactions: A + B P
Uni-bi reactions: B P + Q
Page 4
8/13/2019 Lecture 6 - Metabolic Modeling
http://slidepdf.com/reader/full/lecture-6-metabolic-modeling 4/38
USC-MSChE Course: Bioprocess Technology Metabolic Modeling Engr. Evelyn M. Buque-Taboada
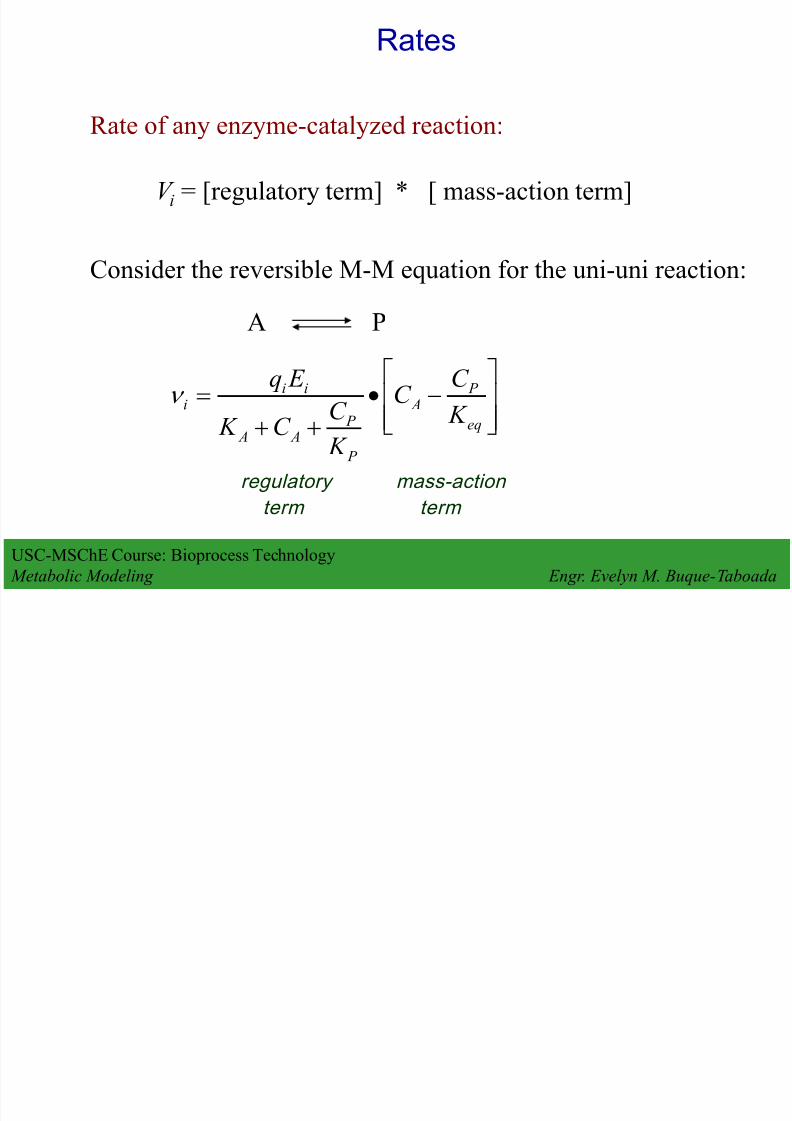
Rates
Rate of any enzyme-catalyzed reaction:
V i = [regulatory term] * [ mass-action term]
Consider the reversible M-M equation for the uni-uni reaction:
A P
eq
P A
P
P A A
iii
K
C C
K C C K
E q
regulatory mass-action
term term
Page 5
8/13/2019 Lecture 6 - Metabolic Modeling
http://slidepdf.com/reader/full/lecture-6-metabolic-modeling 5/38
USC-MSChE Course: Bioprocess Technology Metabolic Modeling Engr. Evelyn M. Buque-Taboada
Terms
Mass-action term only contains thedirect reactants and products (A and P).
Regulatory term contains:
direct reactants and products (A, P)
modifier concentrations
enzyme concentration (linear)
Page 6
8/13/2019 Lecture 6 - Metabolic Modeling
http://slidepdf.com/reader/full/lecture-6-metabolic-modeling 6/38
USC-MSChE Course: Bioprocess Technology Metabolic Modeling Engr. Evelyn M. Buque-Taboada
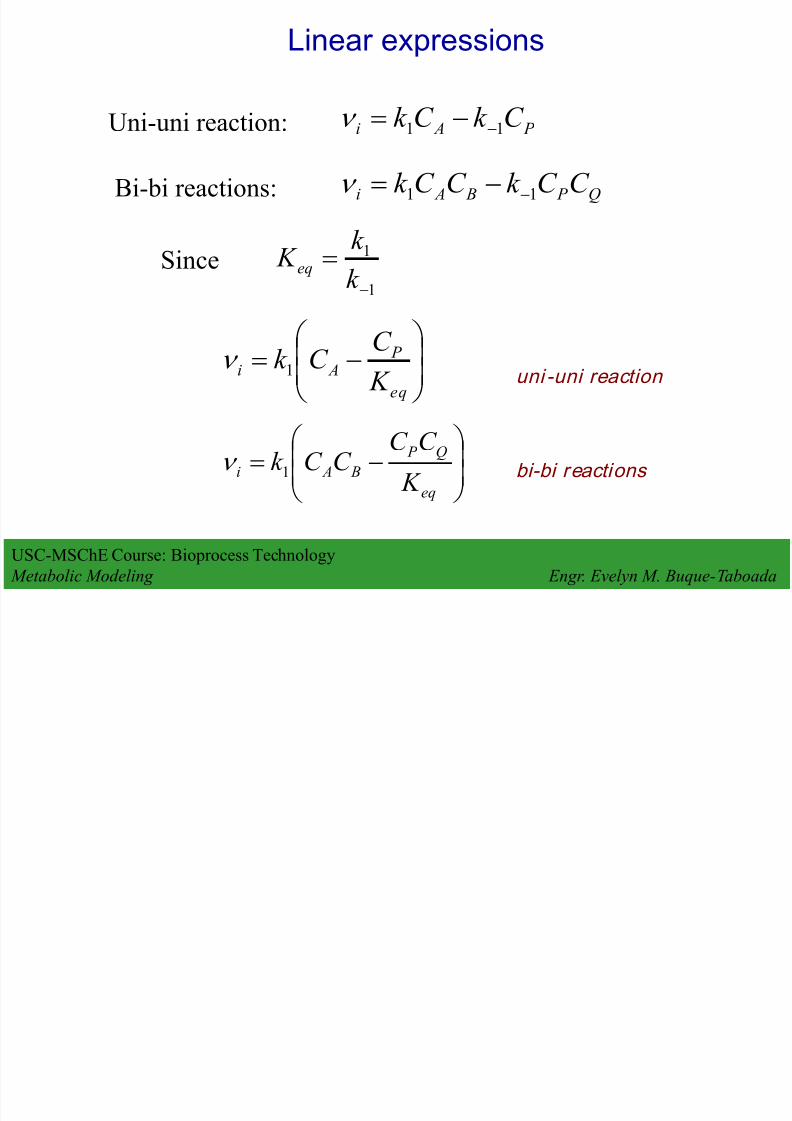
Linear expressions
Uni-uni reaction: P Ai C k C k 11
Bi-bi reactions: Q P B Ai C C k C C k 11
Since1
1
k
k K
eq
eq
P Ai
K
C C k 1
eq
Q P
B Ai K
C C C C k 1
uni -uni reaction
bi-bi reactions
Page 7
8/13/2019 Lecture 6 - Metabolic Modeling
http://slidepdf.com/reader/full/lecture-6-metabolic-modeling 7/38
USC-MSChE Course: Bioprocess Technology Metabolic Modeling Engr. Evelyn M. Buque-Taboada
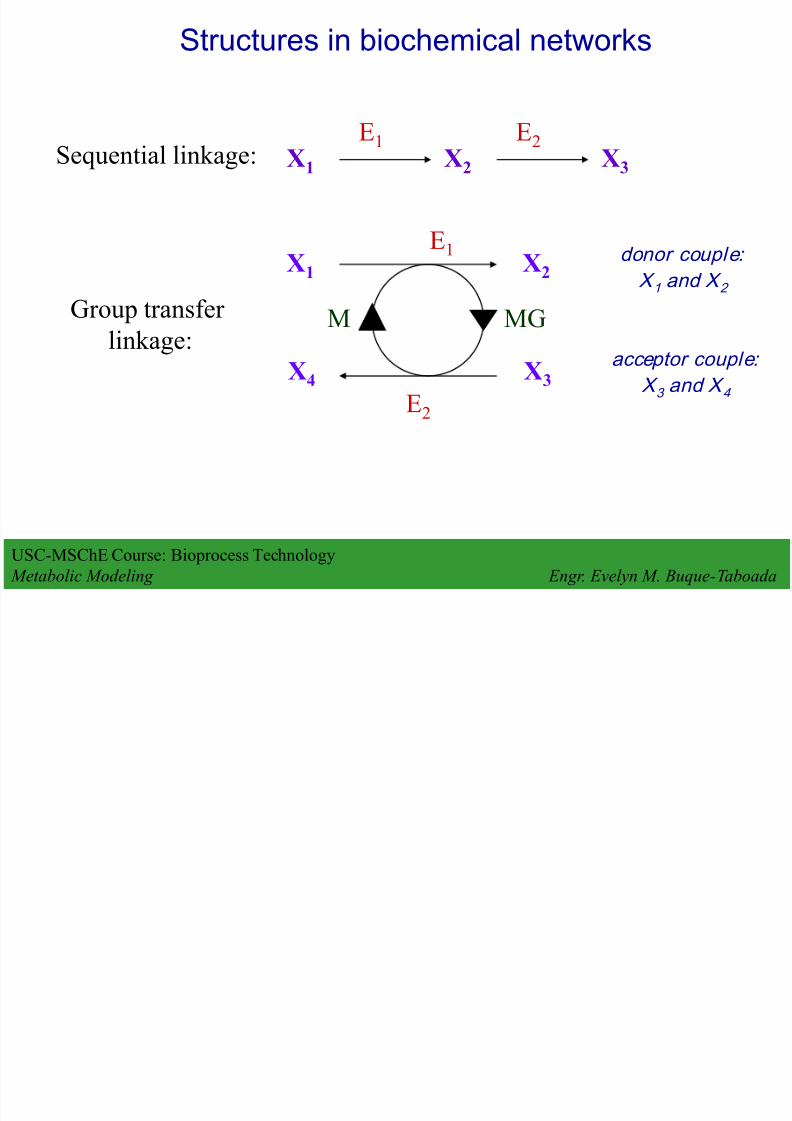
Structures in biochemical networks
X1 X2 X3E1 E2
Sequential linkage:
E1
X1 X2
X4 X3
E2
M MGGroup transfer
linkage:
donor couple:
X 1 and X 2
acceptor couple:
X 3 and X 4
Page 8
8/13/2019 Lecture 6 - Metabolic Modeling
http://slidepdf.com/reader/full/lecture-6-metabolic-modeling 8/38
USC-MSChE Course: Bioprocess Technology Metabolic Modeling Engr. Evelyn M. Buque-Taboada
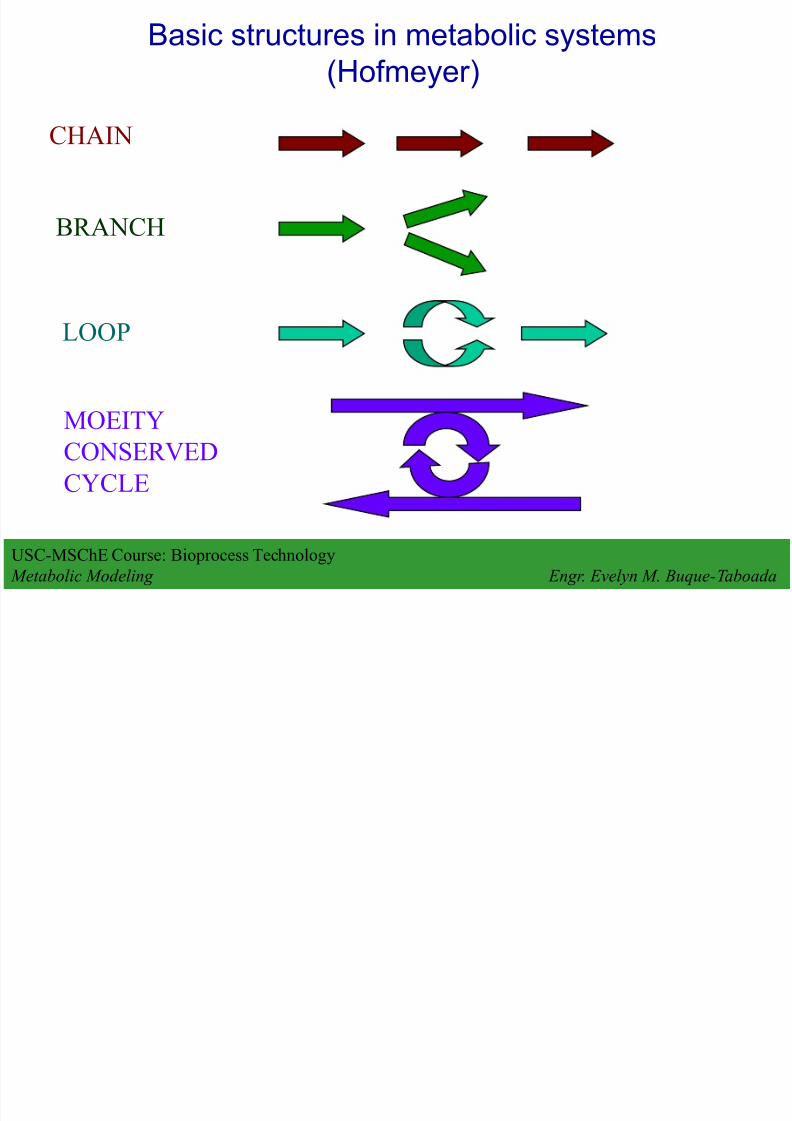
Basic structures in metabolic systems
(Hofmeyer)
CHAIN
BRANCH
LOOP
MOEITYCONSERVED
CYCLE
Page 9
8/13/2019 Lecture 6 - Metabolic Modeling
http://slidepdf.com/reader/full/lecture-6-metabolic-modeling 9/38
USC-MSChE Course: Bioprocess Technology Metabolic Modeling Engr. Evelyn M. Buque-Taboada
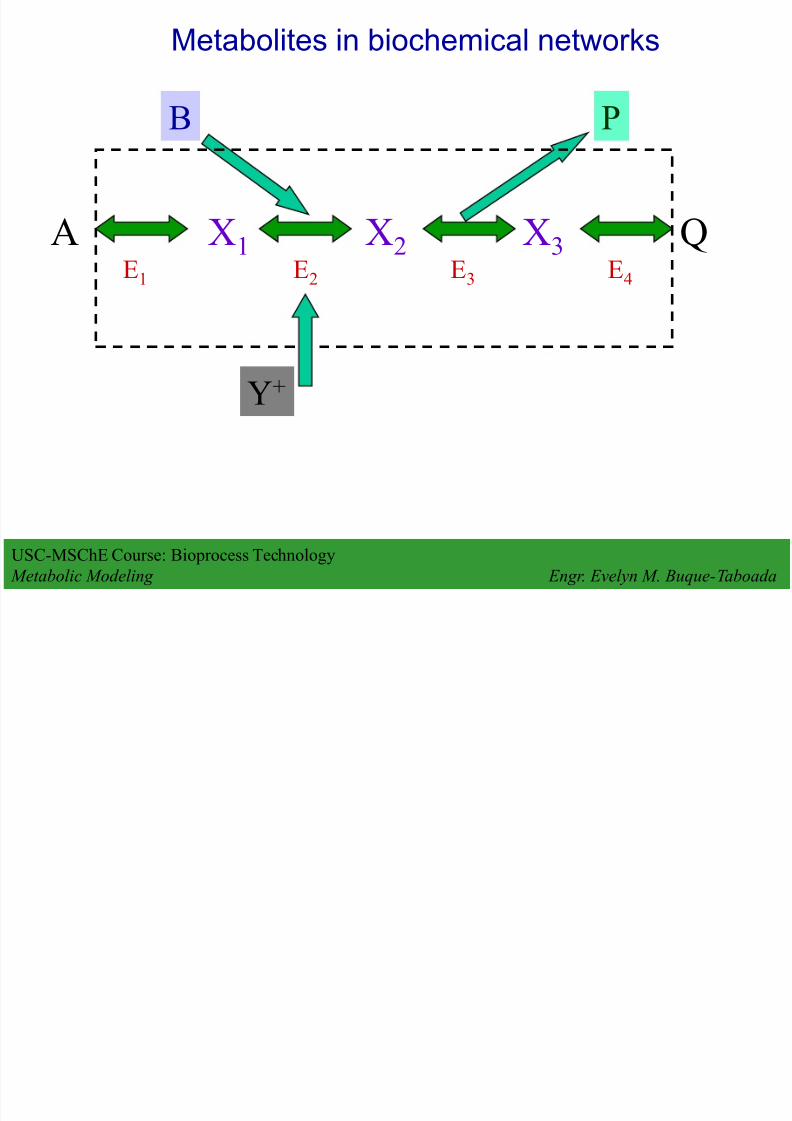
Metabolites in biochemical networks
A X1 X2 X3 Q
E1 E2 E3 E4
Y+
B P
Page 10
8/13/2019 Lecture 6 - Metabolic Modeling
http://slidepdf.com/reader/full/lecture-6-metabolic-modeling 10/38
USC-MSChE Course: Bioprocess Technology Metabolic Modeling Engr. Evelyn M. Buque-Taboada
Over-all rate equation
Rates = function of concentrations of: terminal species
modifiers
sum of conserved moeities (enzyme, NAD-/NADH, etc.)
but, not the concentrations of intermediates,which are not moeity conserved.
Concentration of intermediates = function of the concentrations of:
terminal species
modifiers
sum of conserved moeities (enzyme, NAD-, NADH, etc.)
Page 11
8/13/2019 Lecture 6 - Metabolic Modeling
http://slidepdf.com/reader/full/lecture-6-metabolic-modeling 11/38
USC-MSChE Course: Bioprocess Technology Metabolic Modeling Engr. Evelyn M. Buque-Taboada
Linear chain of enzymes
A X1 X2 X3 Pk 1 k 2 k 3 k 4
k -1 k -2 k -3 k -4
E1 E2 E3 E4
1)1(1 iiiiii X k X k E Rate of reaction:
K i = k +i/k -i Equilibrium constant:
Page 12
8/13/2019 Lecture 6 - Metabolic Modeling
http://slidepdf.com/reader/full/lecture-6-metabolic-modeling 12/38
USC-MSChE Course: Bioprocess Technology Metabolic Modeling Engr. Evelyn M. Buque-Taboada
Conversion rate of substrate A
44321332122111
4321
1111111
/
E k K K K E k K K E k K E k
K K K K C C r
P A A
Here:
44
1
32133
1
2122
1
1
1
11
1111111
E k
k
K K K E k
k
K K E k
k
K E
K
C C E k
r
eq
P A
A
eq K k k k k / k k k k K K K K 432143214321
Page 13
8/13/2019 Lecture 6 - Metabolic Modeling
http://slidepdf.com/reader/full/lecture-6-metabolic-modeling 13/38
USC-MSChE Course: Bioprocess Technology Metabolic Modeling Engr. Evelyn M. Buque-Taboada
Effect of enzyme concentration
On the reaction pathway, effect of enzyme concentration varies:
1
2r A
Ei
1. r A proportional to E i2. r A independent of E i
Page 14
8/13/2019 Lecture 6 - Metabolic Modeling
http://slidepdf.com/reader/full/lecture-6-metabolic-modeling 14/38
USC-MSChE Course: Bioprocess Technology Metabolic Modeling Engr. Evelyn M. Buque-Taboada
Flux control coefficient
Flux control coefficient, C Ei = relative change in r A upon arelative change in Ei
i
A
i
i
A
A
Ei
E
r
E E
r
r
C
ln
ln
Flux
arginine
Enzyme activity
100%
100%
Page 15
8/13/2019 Lecture 6 - Metabolic Modeling
http://slidepdf.com/reader/full/lecture-6-metabolic-modeling 15/38
USC-MSChE Course: Bioprocess Technology Metabolic Modeling Engr. Evelyn M. Buque-Taboada
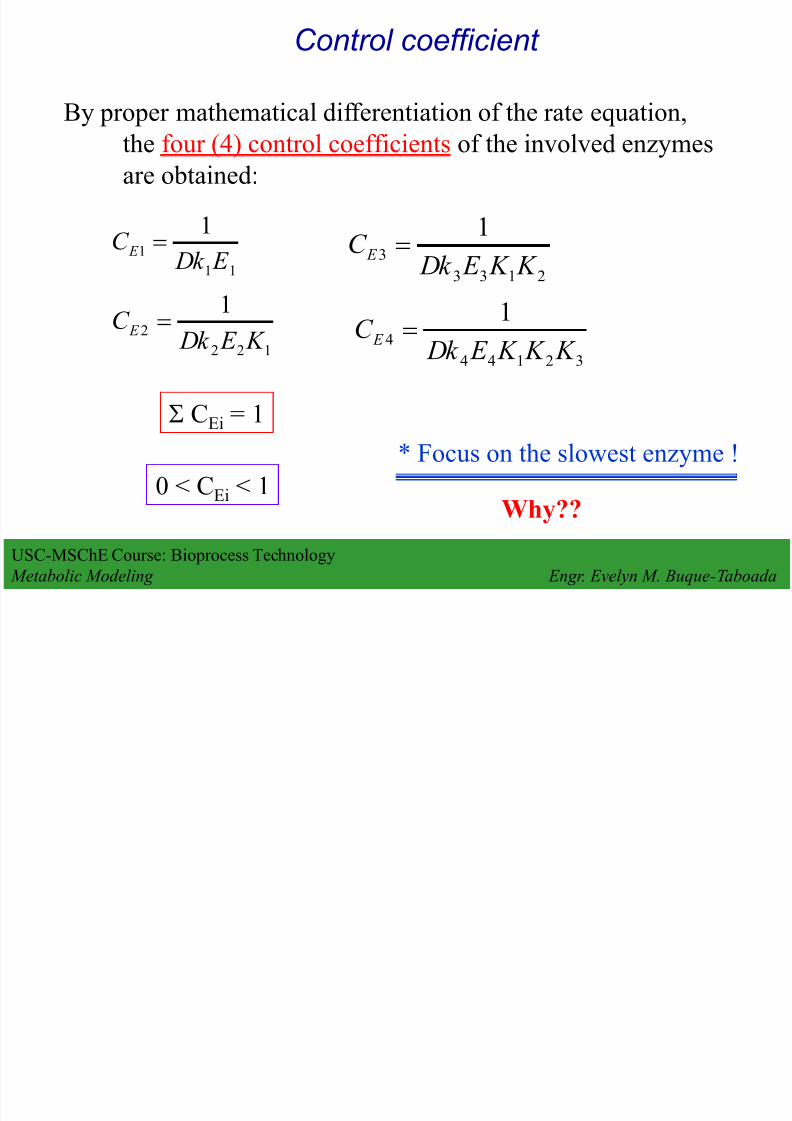
Control coefficient
By proper mathematical differentiation of the rate equation,
the four (4) control coefficients of the involved enzymesare obtained:
122
2
1
K E Dk C E
2133
3
1
K K E Dk
C E
11
1
1
E Dk C E
32144
4
1
K K K E Dk C E
S CEi = 1
0 < CEi < 1
* Focus on the slowest enzyme !
Why??
Page 16
8/13/2019 Lecture 6 - Metabolic Modeling
http://slidepdf.com/reader/full/lecture-6-metabolic-modeling 16/38
USC-MSChE Course: Bioprocess Technology Metabolic Modeling Engr. Evelyn M. Buque-Taboada
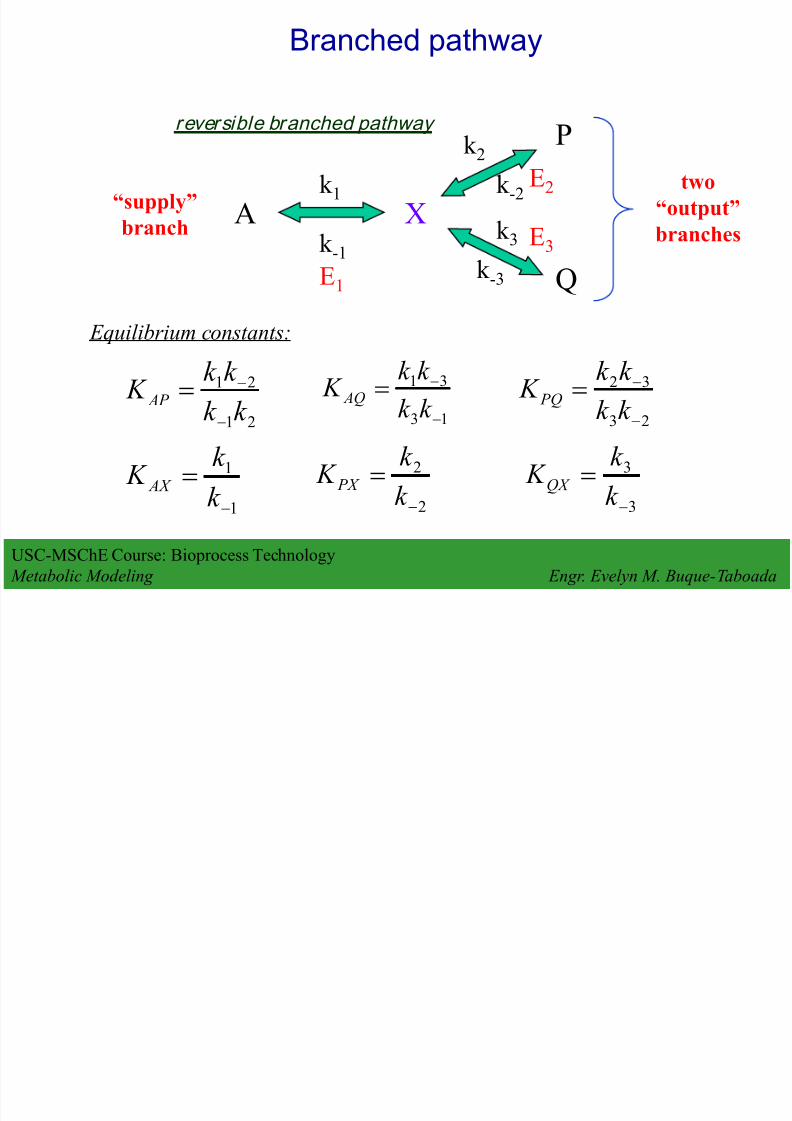
Branched pathway
“supply”
branchA
Q
P
Xk 1
k -1k 3
k 2
k -2
k -3E1
E2
E3
two
“output”
branches
reversible branched pathway
Equilibrium constants:
21
21
k k
k k K AP
1
1
k
k K AX
13
31
k k
k k K AQ
23
32
k k
k k K PQ
2
2
k
k K PX
3
3
k
k K QX
Page 17
8/13/2019 Lecture 6 - Metabolic Modeling
http://slidepdf.com/reader/full/lecture-6-metabolic-modeling 17/38
USC-MSChE Course: Bioprocess Technology Metabolic Modeling Engr. Evelyn M. Buque-Taboada
Branched pathway: Rates
221133113322
1133
111
11
E k E k K E k E k K E k E k K
K
C C
K E k K
C C
K E k r
QX PX AX
PQ
Q
P QX AP
P
A PX
P
221133113322
1122
111
11
E k E k K E k E k K E k E k K
K C C
K E k K C C
K E k r
QX PX AX
PQ
Q
P
QX AQ
Q
A
QX
Q
221133113322
2233
111
11
E k E k K E k E k K E k E k K
K
C C
K E k K
C C
K E k r
QX PX AX
AQ
Q
A
QX AP
P A
PX A
Page 18
8/13/2019 Lecture 6 - Metabolic Modeling
http://slidepdf.com/reader/full/lecture-6-metabolic-modeling 18/38
USC-MSChE Course: Bioprocess Technology Metabolic Modeling Engr. Evelyn M. Buque-Taboada
Branched pathway
Note: r A = r P + r Q
For the branch flux ratio, R:Q
P
r
r R
PQ
Q
P
QX AQ
Q
A
QX
PQ
Q
P
QX AP
P A
PX
K
C C
K E k K
C C
K E k
K
C C
K E k K
C C
K E k
R
1122
1133
11
11
Finally, for the branched-point metabolite concentration CX,
QX PX AX
Q P A
X
K
E k
K
E k
K
E k
C E k C E k C E k C
332211
332211
Page 19
8/13/2019 Lecture 6 - Metabolic Modeling
http://slidepdf.com/reader/full/lecture-6-metabolic-modeling 19/38
USC-MSChE Course: Bioprocess Technology Metabolic Modeling Engr. Evelyn M. Buque-Taboada
Cyclic structures in the pathway
X1 X3
X2
A P
X1 X3
X1 X2 X3
X4
X5
E3
E2E1
cyclic structures
Cyclic structure, the paral lel substrate loop
Page 20
8/13/2019 Lecture 6 - Metabolic Modeling
http://slidepdf.com/reader/full/lecture-6-metabolic-modeling 20/38
USC-MSChE Course: Bioprocess Technology Metabolic Modeling Engr. Evelyn M. Buque-Taboada
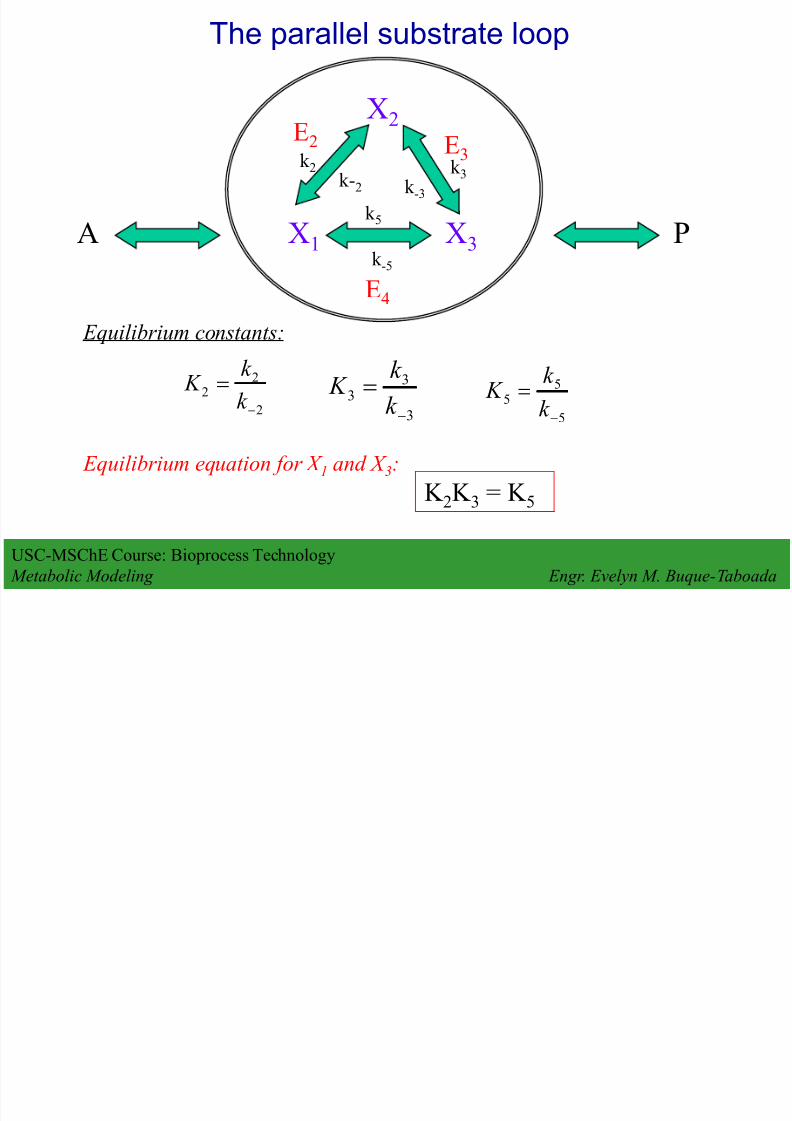
The parallel substrate loop
X1 X3
X2
A P
E4
E3E2
k -3
k 3k-2
k 2
k -5
k 5
Equilibrium constants:
2
2
2
k
k K
3
3
3
k
k K
5
5
5
k
k K
Equilibrium equation for X 1 and X 3:
K 2K 3 = K 5
Page 21
8/13/2019 Lecture 6 - Metabolic Modeling
http://slidepdf.com/reader/full/lecture-6-metabolic-modeling 21/38
USC-MSChE Course: Bioprocess Technology Metabolic Modeling Engr. Evelyn M. Buque-Taboada
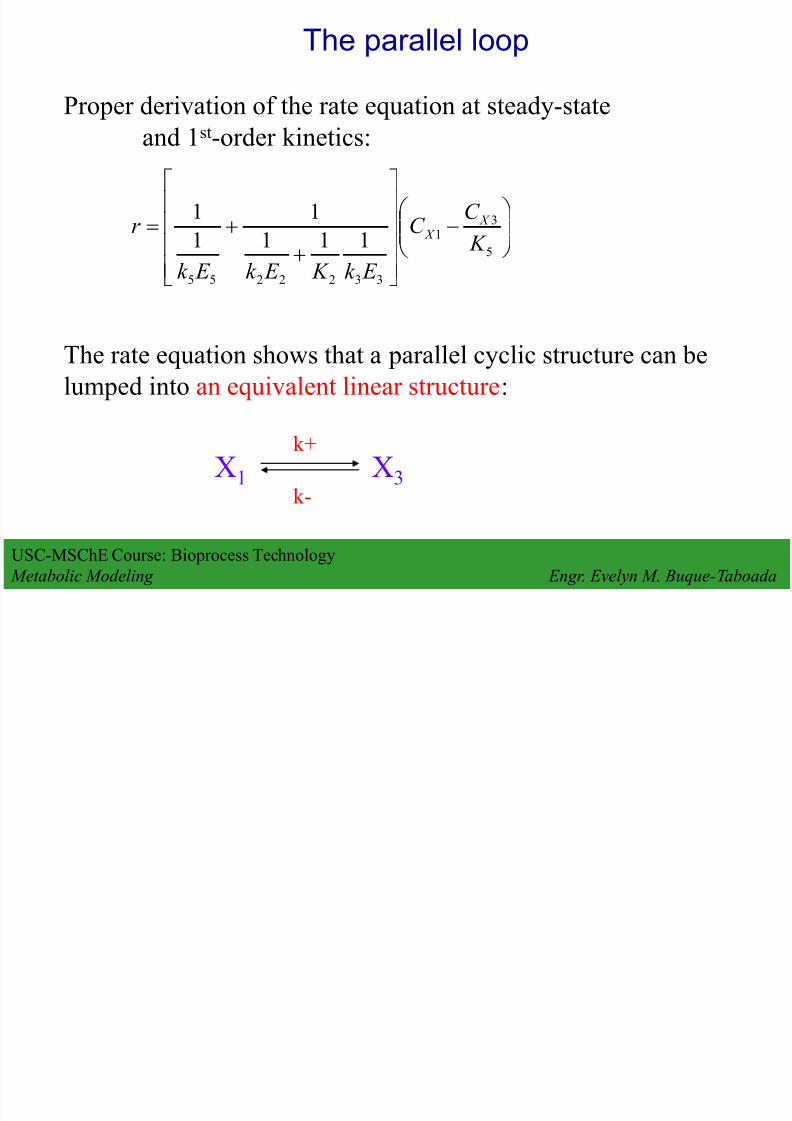
The parallel loop
5
31
3322255
111
1
1
1
K
C C
E k K E k E k
r X X
Proper derivation of the rate equation at steady-state
and 1st-order kinetics:
X1 X3
k+
k-
The rate equation shows that a parallel cyclic structure can be
lumped into an equivalent linear structure:
Page 22
8/13/2019 Lecture 6 - Metabolic Modeling
http://slidepdf.com/reader/full/lecture-6-metabolic-modeling 22/38
USC-MSChE Course: Bioprocess Technology Metabolic Modeling Engr. Evelyn M. Buque-Taboada
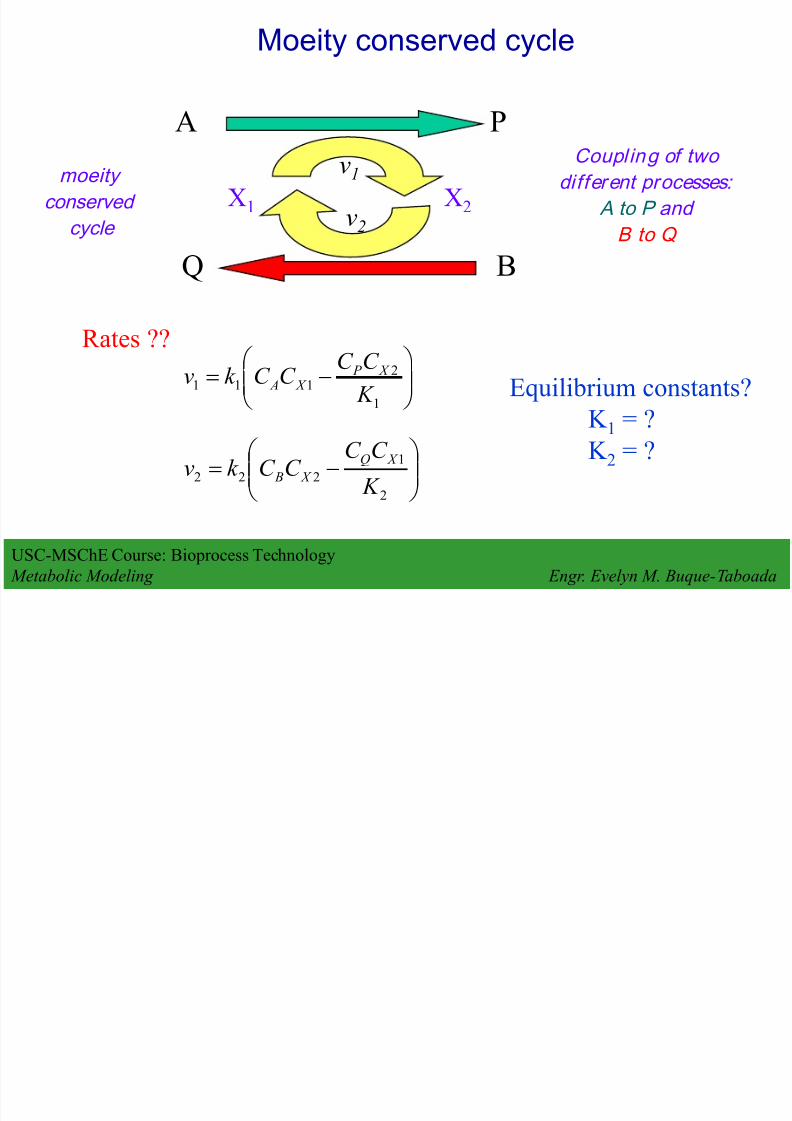
Moeity conserved cycle
A P
Q B
X1 X2
v1
v2
moeity
conserved
cycle
Coupling of two
different processes:
A to P and
B to Q
Rates ??
1
2111
K
C C C C k v X P
X A
2
1
222 K
C C C C k v X Q
X B
Equilibrium constants?
K 1 = ?K 2 = ?
Page 23
8/13/2019 Lecture 6 - Metabolic Modeling
http://slidepdf.com/reader/full/lecture-6-metabolic-modeling 23/38
Page 24
8/13/2019 Lecture 6 - Metabolic Modeling
http://slidepdf.com/reader/full/lecture-6-metabolic-modeling 24/38
USC-MSChE Course: Bioprocess Technology Metabolic Modeling Engr. Evelyn M. Buque-Taboada
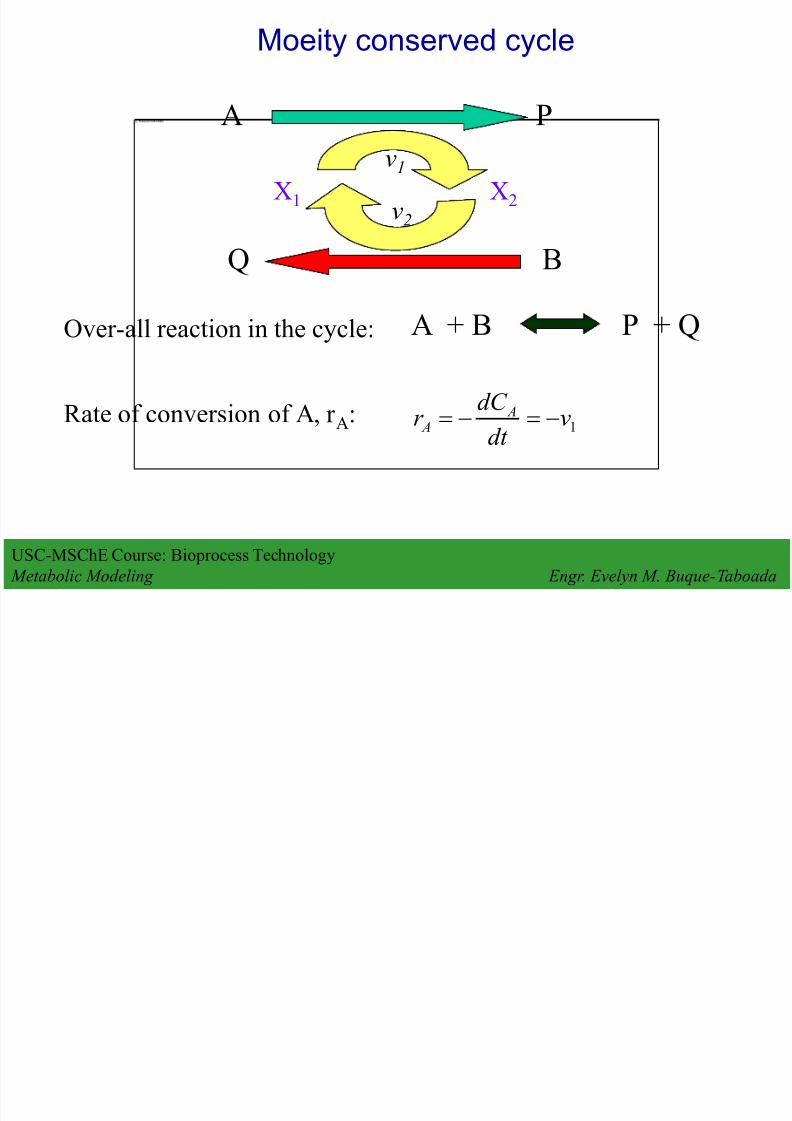
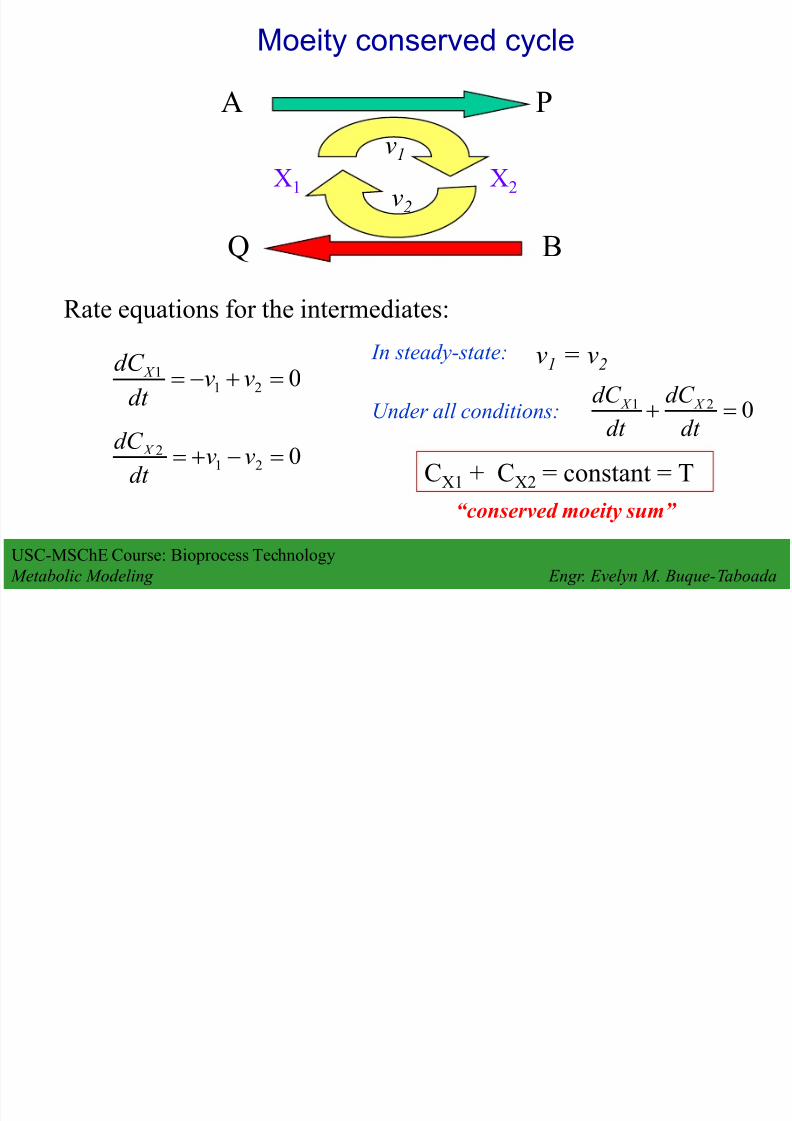
Moeity conserved cycle
A P
Q B
X1 X2
v1
v2
Rate equations for the intermediates:
0211 vv
dt
dC X
0212 vv
dt
dC X
In steady-state: v1 = v2
Under all conditions: 021
dt
dC
dt
dC X X
CX1 + CX2 = constant = T
“conserved moeity sum”
Page 25
8/13/2019 Lecture 6 - Metabolic Modeling
http://slidepdf.com/reader/full/lecture-6-metabolic-modeling 25/38
USC-MSChE Course: Bioprocess Technology Metabolic Modeling Engr. Evelyn M. Buque-Taboada
Moeity conserved cycles
Using the steady-state condition (v1 = v2 ) and the
conserved moeity sum (C X1 + C X2 = T), the followingrates are obtained:
2
22
1
11
2
1
1
1
K
C k C k K
C k C k
C k K
C k
T
C
Q
B P
A
B P
X
2
22
1
11
2
21
2
K
C k C k K
C k C k
K
C k C k
T
C
Q
B P
A
Q
A
X
2
2
1
1
2121
K
C C k
K
C C k
K K
C C
C C T k k r
Q
B P
A
Q P
B A
A
B A
B A A
C k C k
C C T k k r
21
21
Simplified to:
When??
Page 26
8/13/2019 Lecture 6 - Metabolic Modeling
http://slidepdf.com/reader/full/lecture-6-metabolic-modeling 26/38
USC-MSChE Course: Bioprocess Technology Metabolic Modeling Engr. Evelyn M. Buque-Taboada
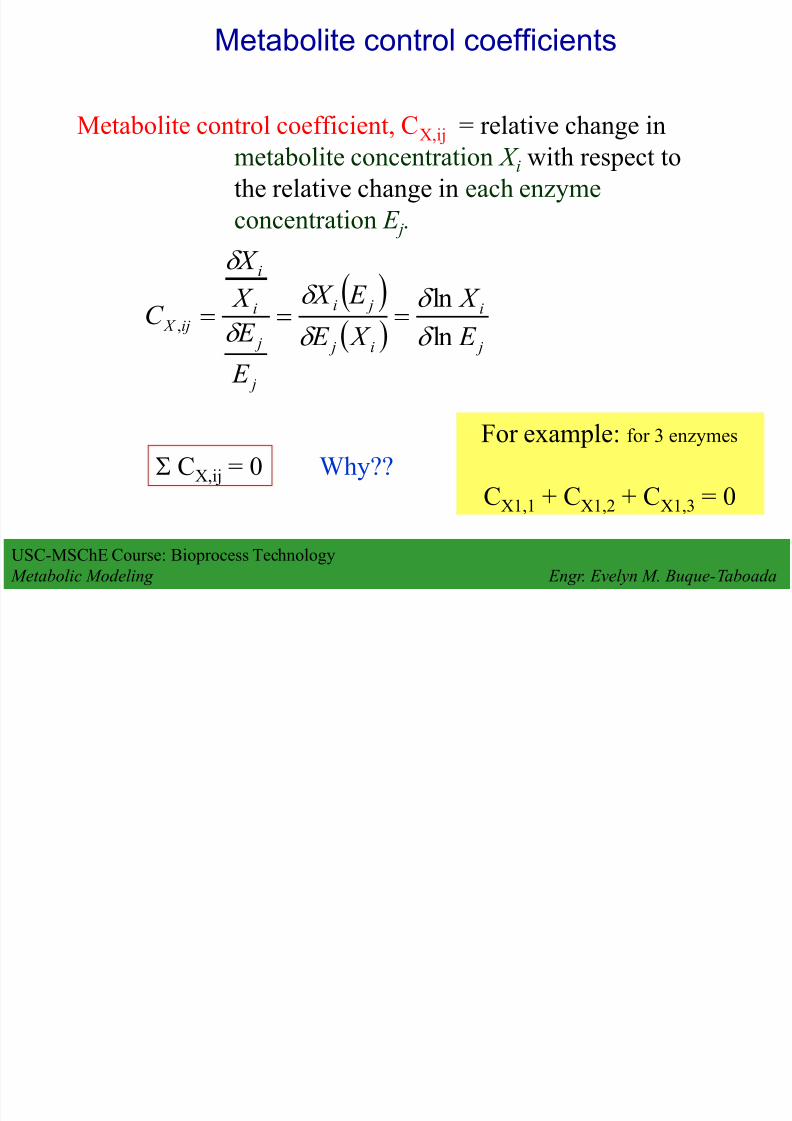
Metabolite control coefficients
Metabolite control coefficient, CX,ij
= relative change in
metabolite concentration X i with respect to
the relative change in each enzyme
concentration E j.
S CX,ij = 0 Why??
For example: for 3 enzymes
CX1,1 + CX1,2 + CX1,3 = 0
j
i
i j
ji
j
j
i
i
ij X E
X
X E
E X
E
E
X
X
C ln
ln,
Page 27
8/13/2019 Lecture 6 - Metabolic Modeling
http://slidepdf.com/reader/full/lecture-6-metabolic-modeling 27/38
USC-MSChE Course: Bioprocess Technology Metabolic Modeling Engr. Evelyn M. Buque-Taboada
Thermodynamic Driving Force
Consider a simple reaction:
A B
The kinetic driving force is:
K
B A where K = equilibrium constant
Thermodynamic theory states that for DGR :
Gibbs energy of reaction
At reference (standard) state:
DD
B
A RT GG o
R R ln
K RT Go
R lnD
Page 28
8/13/2019 Lecture 6 - Metabolic Modeling
http://slidepdf.com/reader/full/lecture-6-metabolic-modeling 28/38
USC-MSChE Course: Bioprocess Technology Metabolic Modeling Engr. Evelyn M. Buque-Taboada
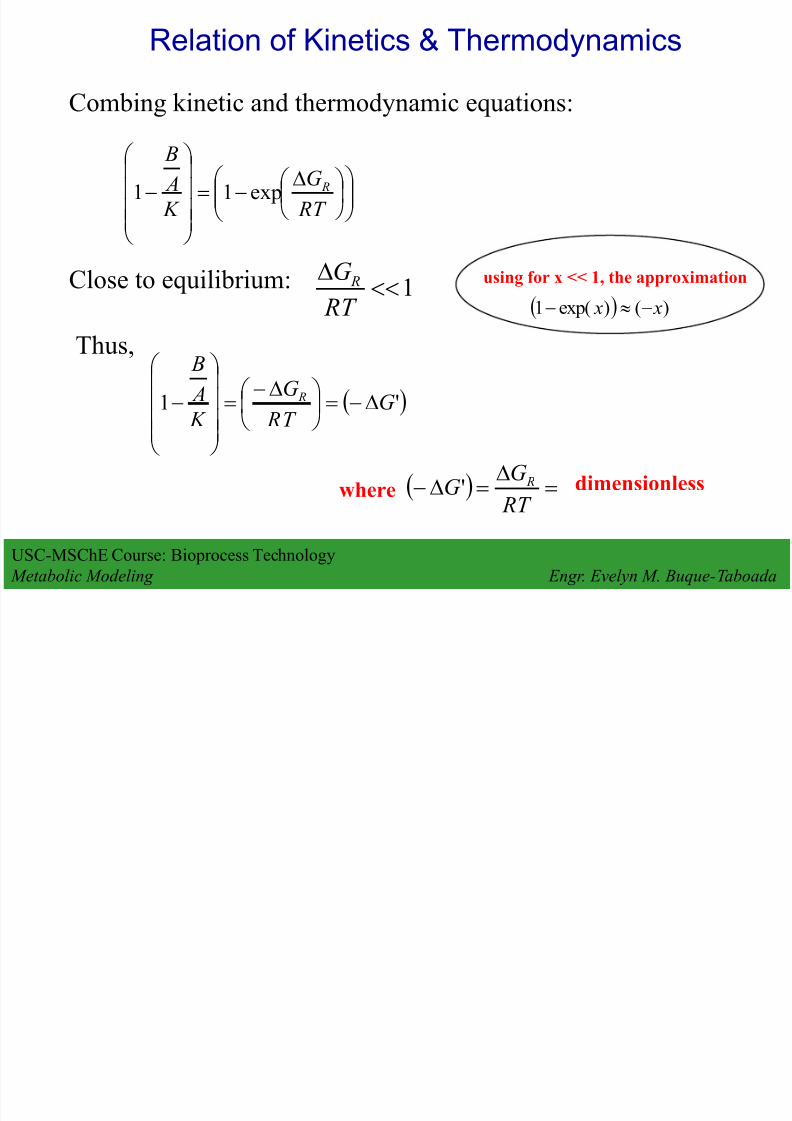
Relation of Kinetics & Thermodynamics
D
RT
G
K
A
B
Rexp11
Combing kinetic and thermodynamic equations:
Close to equilibrium: 1D RT G R using for x << 1, the approximation
)()exp(1 x x
Thus,
'1 G RT
G
K
A
B
R D
D
D
D RT
GG R'where dimensionless
Page 29
8/13/2019 Lecture 6 - Metabolic Modeling
http://slidepdf.com/reader/full/lecture-6-metabolic-modeling 29/38
USC-MSChE Course: Bioprocess Technology Metabolic Modeling Engr. Evelyn M. Buque-Taboada
Consider an example: moeity cycle
A P
Q B
X1 X2
v1
v2
Using mass-action kinetics:
1
2111
K
PX AX k V X AP K K
X
X
A
P K
1
21
Then, the rate expression is:
X AP AP K
X X
K
P k
K
P A X k V 2
11
111
kinetic kinetic driving force
Page 30
8/13/2019 Lecture 6 - Metabolic Modeling
http://slidepdf.com/reader/full/lecture-6-metabolic-modeling 30/38
USC-MSChE Course: Bioprocess Technology Metabolic Modeling Engr. Evelyn M. Buque-Taboada
Transformation of driving forces
Transforming kinetic and thermodynamic driving forces:
'1 AP
AP
G K
A P
D
'1
2
1 X
X
G K
X X
D
Then, for V1 and V2:
'
11
'
111 X
AP
AP G K
P X k G X k V D
D
'
12
'
222 X
BQ
X BQ G
K
K Q X k G B X k V D
D
Page 31
8/13/2019 Lecture 6 - Metabolic Modeling
http://slidepdf.com/reader/full/lecture-6-metabolic-modeling 31/38
USC-MSChE Course: Bioprocess Technology Metabolic Modeling Engr. Evelyn M. Buque-Taboada
Steady-state condition
At steady-state: V1 = V2
Then,
BQ
X
AP
BQ AP
X
K
Q K X k
K
P X k
G B X k G A X k G
1211
'
22
'
11'
DDD
Over-all rate equation of the coupled process:
P K K k
Q K k
G K Q
B X G K
P
A K X k k
r AP
X
BQ
BQ BQ AP AP X
21
'
2
'
121
DD
Page 32
8/13/2019 Lecture 6 - Metabolic Modeling
http://slidepdf.com/reader/full/lecture-6-metabolic-modeling 32/38
USC-MSChE Course: Bioprocess Technology Metabolic Modeling Engr. Evelyn M. Buque-Taboada
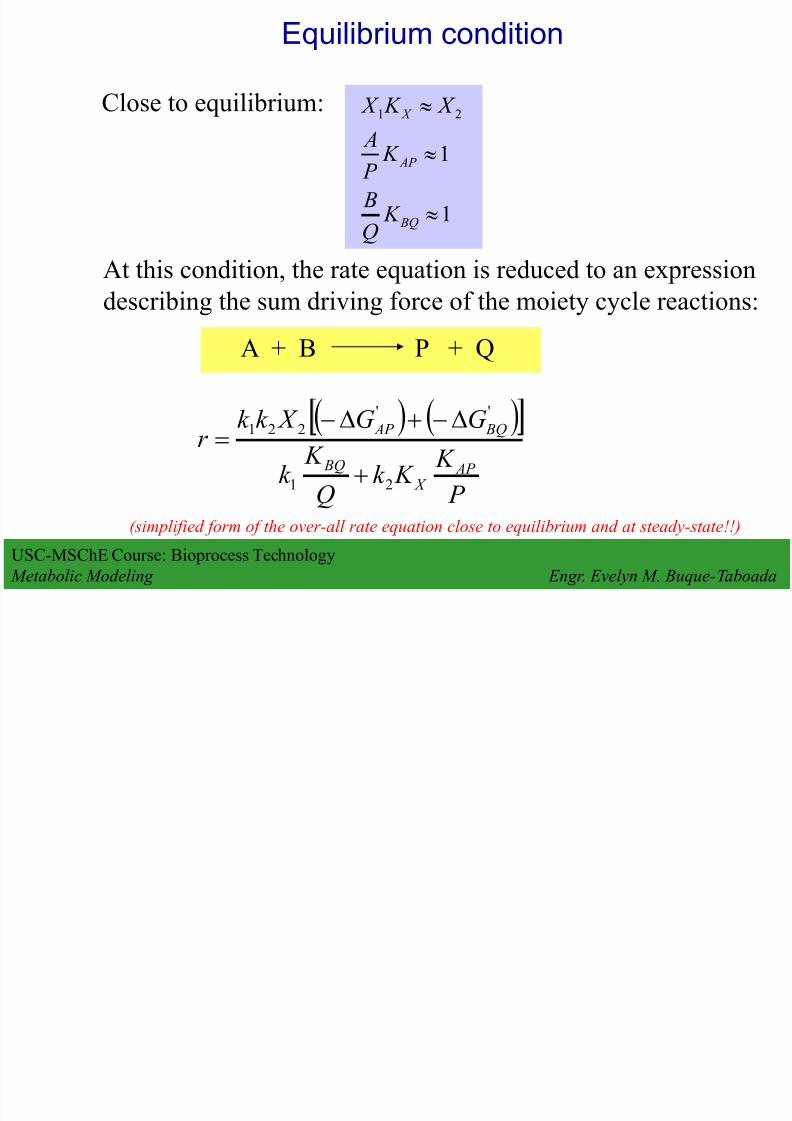
Equilibrium condition
Close to equilibrium:
1
1
21
BQ
AP
X
K Q
B
K P A
X K X
At this condition, the rate equation is reduced to an expressiondescribing the sum driving force of the moiety cycle reactions:
A + B P + Q
P
K K k
Q
K k
GG X k k r AP
X
BQ
BQ AP
21
''
221
DD
(simplified form of the over-all rate equation close to equilibrium and at steady-state!!)
Page 33
8/13/2019 Lecture 6 - Metabolic Modeling
http://slidepdf.com/reader/full/lecture-6-metabolic-modeling 33/38
USC-MSChE Course: Bioprocess Technology Metabolic Modeling Engr. Evelyn M. Buque-Taboada
FINAL EXERCISE
Metabolic Modeling
Consider the pathway for penicillin production:
AA ACV IPN Penv1
O2
IPN
O ACV
ACV
X ek v
C X ek v
K
X ek v
333
2222
1
111 1
Rate kinetics:
2.0
30
150
1
1.0
2
33
22
11
1
O
o
o
o
C
ek
ek
ek
K
At reference steady-state ( = 0.03 h -1 ):
mmol ACV per C-mol X
mmol ACV per C-mol X per h
L.mmol -1.h-1
h-1
mM
Page 34
8/13/2019 Lecture 6 - Metabolic Modeling
http://slidepdf.com/reader/full/lecture-6-metabolic-modeling 34/38
USC-MSChE Course: Bioprocess Technology Metabolic Modeling Engr. Evelyn M. Buque-Taboada
Page 35
8/13/2019 Lecture 6 - Metabolic Modeling
http://slidepdf.com/reader/full/lecture-6-metabolic-modeling 35/38
USC-MSChE Course: Bioprocess Technology Metabolic Modeling Engr. Evelyn M. Buque-Taboada
Page 36
8/13/2019 Lecture 6 - Metabolic Modeling
http://slidepdf.com/reader/full/lecture-6-metabolic-modeling 36/38
USC-MSChE Course: Bioprocess Technology Metabolic Modeling Engr. Evelyn M. Buque-Taboada
Page 37
8/13/2019 Lecture 6 - Metabolic Modeling
http://slidepdf.com/reader/full/lecture-6-metabolic-modeling 37/38
USC-MSChE Course: Bioprocess Technology Metabolic Modeling Engr. Evelyn M. Buque-Taboada
Page 38
8/13/2019 Lecture 6 - Metabolic Modeling
http://slidepdf.com/reader/full/lecture-6-metabolic-modeling 38/38