Mgmt study material created/ compiled by - Commander RK Singh rajeshsingh_r_k@rediffmail.com Date: 21 Jan 06 Professor: MR SM Fakih, BASF Ltd, Telephone: 56618064 Email: [email protected]Recommended Books: 1. Principles of Corporate Finance By Brealey and Myers, Tata Mcgraw Hill Publication. 7 th Edition List Price Rs 595 with CD, Rs 495 without CD 2. Valuation by Copeland (McKinsey Publication) Price – Approx Rs 1250. Lecture Plan Lecture No Topic 1. Cost of Capital 2. Short Presentation on Cost of Capital by two groups. Others to submit assignment on Cost of Capital. Followed by Valuation Concepts 3. Valuation continued. Exchange Ratio Determination 4. Student Presentations on case study and submission of assignments 5. LBO (Leveraged Buy Out) 6. Accounting Issues from Capital Market Perspective 7. Tax Sec 72A 8. Reverse Merger First Assignment – Select a company of your choice and calculate the cost of capital. Each assignment can be done by a group of maximum two people. COST OF CAPITAL Page 1 of 91 - Financial Management- II Jamnalal Bajaj Institute of Mgmt Studies
Transcript
Mgmt study material created/ compiled by - Commander RK Singh [email protected]
Date: 21 Jan 06
Professor: MR SM Fakih, BASF Ltd, Telephone: 56618064Email: [email protected]
Recommended Books: 1. Principles of Corporate Finance By Brealey and Myers, Tata Mcgraw Hill
Publication. 7th Edition List Price Rs 595 with CD, Rs 495 without CD2. Valuation by Copeland (McKinsey Publication) Price – Approx Rs 1250.
Lecture Plan
Lecture No Topic1. Cost of Capital2. Short Presentation on Cost of Capital by two groups. Others to submit
assignment on Cost of Capital.Followed by Valuation Concepts
3. Valuation continued. Exchange Ratio Determination4. Student Presentations on case study and submission of assignments5. LBO (Leveraged Buy Out)6. Accounting Issues from Capital Market Perspective7. Tax Sec 72A8. Reverse Merger
First Assignment – Select a company of your choice and calculate the cost of capital. Each assignment can be done by a group of maximum two people.
COST OF CAPITAL
Cost of Capital is the expected return by the providers of funds. Or it is also the opportunity cost of the funds applied.
Since, it is the EXPECTATION of the investors, it is not a precise exercise. There is no way to capture the investor expectation accurately.
Each company is funded by more than one source and each source has different rate and risks involved. Thus, final figure is arrived at by finding the Weighted Average Cost of Capital (WACC).
Weights to different funds can be applied on two basis:
1. Book Value Weights2. Market Value Weights
Page 1 of 61 - Financial Management- IIJamnalal Bajaj Institute of Mgmt Studies
Mgmt study material created/ compiled by - Commander RK Singh [email protected]
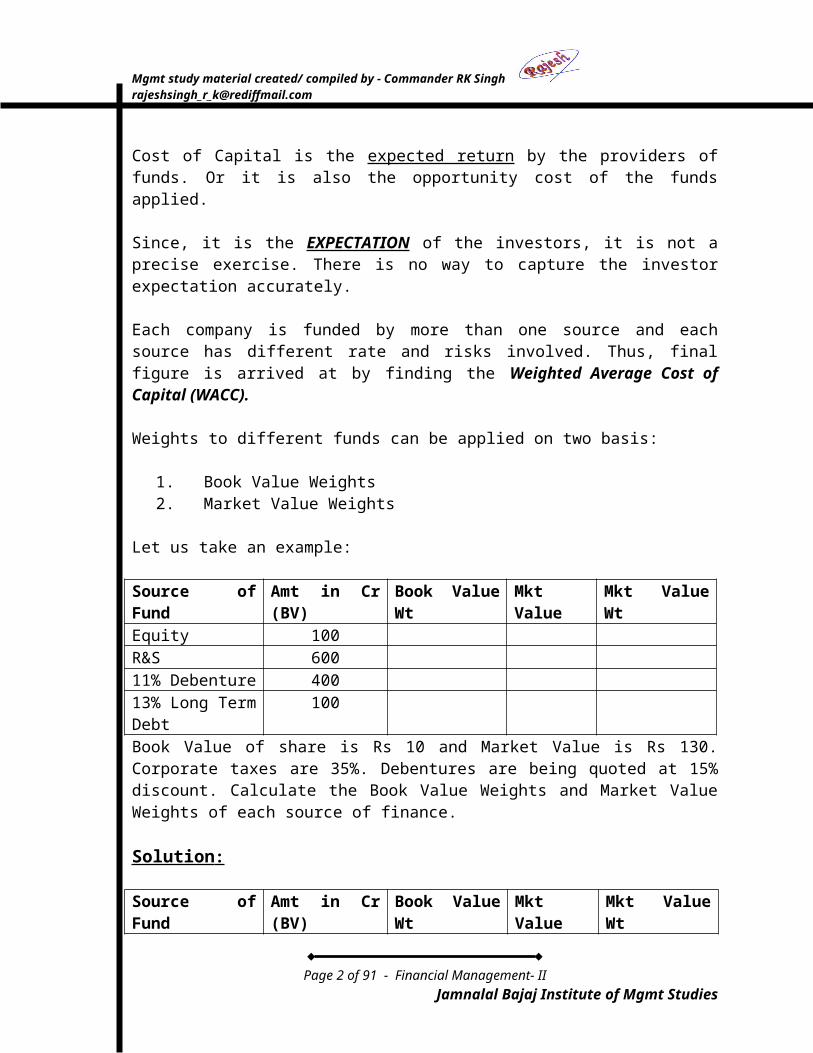
Let us take an example:
Source of Fund Amt in Cr (BV) Book Value Wt Mkt Value Mkt Value WtEquity 100R&S 60011% Debenture 40013% Long Term Debt
100
Book Value of share is Rs 10 and Market Value is Rs 130. Corporate taxes are 35%. Debentures are being quoted at 15% discount. Calculate the Book Value Weights and Market Value Weights of each source of finance.
Solution :
Source of Fund Amt in Cr (BV) Book Value Wt Mkt Value Mkt Value WtEquity 100 8.33 1300 74.71R&S 600 50.00 NIL NIL11% Debenture 400 33.34 340 19.5413% Long Term Debt
100 8.33 100 5.75
Total 1200 100.00 1740 100.00
Calculations:
Book Value Weights are obtained simply by dividing each amount by the Total Amount.100/1200 = 8.33, 600/1200 = 50, 400/1200 = 33.34
Market Value Weights are determined as follows
Step 1.Determine the market value of each fund:
Equity – (Market Value per share / Book Value per share) x amount= (130/10) x 100 = 1300
Reserves and Surplus – This amount is to be DISCARDED since the market value of equity share takes into account the R&S. Thus, including it again would amount to double accounting of this head. It is a very common mistake and should be carefully noted to avoid.
Debentures – Book Value +/- Premium/discount (If any)= 400 – 15% = 340
Long Term Debt – Book Value +/- Premium/discount (If any)= 100 – 0% = 100
Page 2 of 61 - Financial Management- IIJamnalal Bajaj Institute of Mgmt Studies
Mgmt study material created/ compiled by - Commander RK Singh [email protected]
Step 2.Add the above figures to arrive at Total Market Value of Capital.= 1300 + 340 + 100 = 1740
Step 3. Divide market value of each fund by Total Market Value of Capital (MVW) to arrive at individual weights.
MVW method of CoC is considered to be superior/more accurate reflection of CoC since it captures investors’ expectations.
Calculating Cost of Various Funds:
Cost of Equity: Cost of Equity is calculated using one of the following two models
1. Capital Asset Pricing Model (CAPM)2. Dividend Discount/Growth Model
Capital Asset Pricing Model (CAPM)
All the investments options can be put on a Risk scale of 0 – 10 signifying Safest Investment option (Investments with Sovereign Guarantee, like Reserve Bank Bonds) to Most Risky investment option (Horse Racing, Gambling, Betting, etc). Equity Investment falls some where in between. (But even in case of RBI bonds, they guarantee only the return of capital investment and promised rate of return. They provide no safeguard against changes in inflation and money market conditions which can deeply erode the value of investment). Further, the risks associated with each sector is different and within each sector, each company has different risk profile, “A” group companies bearing relatively lower risk, while “Z” group companies bear significantly higher risk.
0 5 10
ZERO Risk MAX RiskGovt Bonds Horse Races
Govt Bonds (bearing sovereign guarantee) are considered to be safest investment option because Govt can always print additional currency to meet payment obligation in case of any problem and thus need not default. (But, printing of additional currency would result in increased inflation). Capital investments are long term in nature. Therefore, we need to compare them with another long term investment only. Thus, yield on 10 Year RBI (Treasury) Bonds is considered to be the bench mark Risk Free Return Rate.
All investments in Capital Market carry Market Risk. (We hear this warning every now and then with Mutual Fund Ads). Equity Risks could be of two types – Unsystematic and systematic risks.
Page 3 of 61 - Financial Management- IIJamnalal Bajaj Institute of Mgmt Studies
Mgmt study material created/ compiled by - Commander RK Singh [email protected]
E Q U I T Y R I S KUnsystematic Risk – Risks factors affecting a group of companies in an industry segment or any particular company. Eg. Large cut in Import Duty on cars affecting car companies like Maruti, Ford, Hundai but not other Automobile companies.
OrChairman of Birla 3M dying in an Aircraft crash.
Systematic Risk – Risk factors having much broader effect, like interest rates movement affecting the cost of capital for every industry.
OrCorporate Tax increase affecting PAT of every company.
Equity investors bear the risk because they have only the residual rights on profits and proceeds of a company. Thus, such investors need to be compensated for their risk. However, Unsystematic Risks can be and are eliminated by diversifying the portfolio. (First Rule of the Stock Market – Don’t put all your eggs in one basket) And therefore, investor need not be compensated for Unsystematic Risks. Thus, investors need to be compensated for Systematic Risks only.
But again, even Systematic Risks are not uniform for every company. The effect of Systematic Risk also differs from industry to industry and company to company within an industry segment. Take for instance, effect of recession on various industries. While White Goods Industries (Consumer Durables like AC, Fridge, TV, etc) would be hardest hit, impact on Pharma companies would be very little. A sick man would beg, borrow and may even steal but will get the medicines. Even within the sector, companies’ product mix will determine the hit. Companies whose major revenue is from pleasure drugs like Viagra would be more severely hit than the companies whose major source of revenue is Life Saving drugs like penicillin. This market risk factor of each company is represented by “β” (pronounced - Beta).
“β” - Beta - This measures how much a company's share price moves against the market as a whole. A beta of one, for instance, indicates that the company moves in exact proportion with the market. If the beta is in excess of one, the share is exaggerating the market's movements; less than one means the share is more stable. Occasionally, a company may have a negative beta (e.g. a gold mining company), which means the share price moves in the opposite direction to the broader market. The logic is that when share market is booming money is invested in the market and therefore there is less investment in gold and the prices of gold fall. However, currently, Gold and Stock market are moving upward parallely.
Taking into account above facts, Cost of Equity is represented as
Re = Rf + β(Rm – Rf)
Where,Re = Expected Return on equity (Termed “K” in other model)
Page 4 of 61 - Financial Management- IIJamnalal Bajaj Institute of Mgmt Studies
Mgmt study material created/ compiled by - Commander RK Singh [email protected]
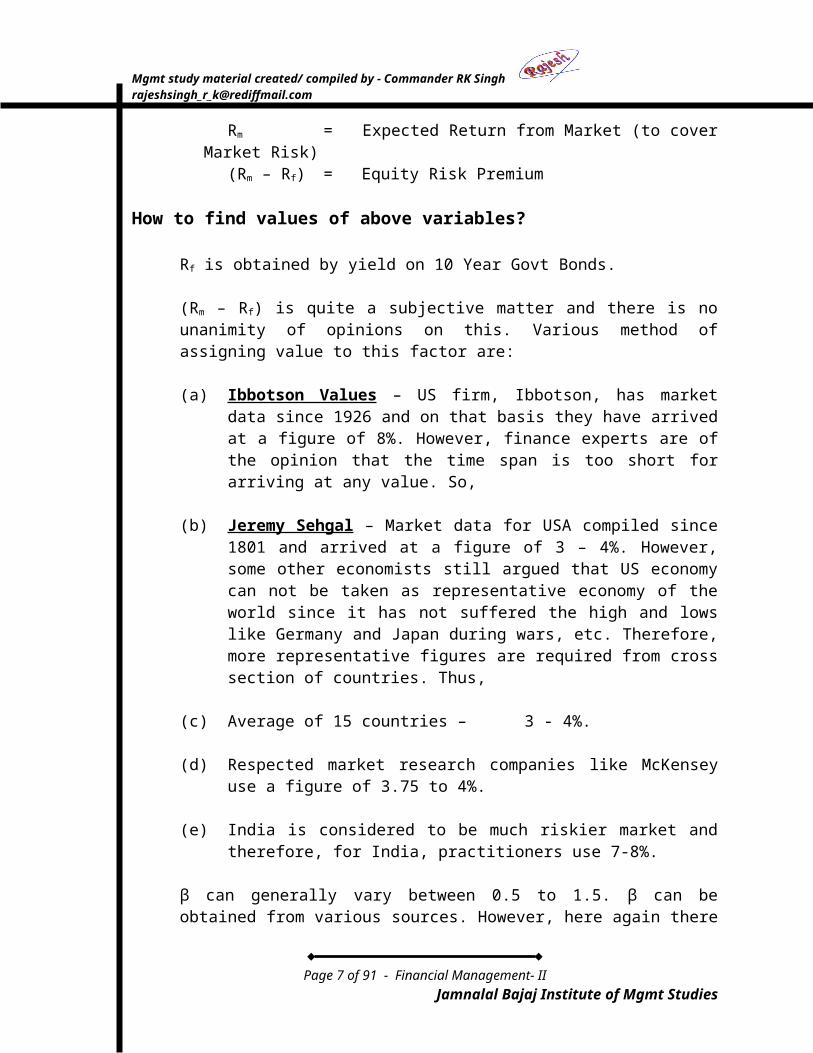
(Rm – Rf) is quite a subjective matter and there is no unanimity of opinions on this. Various method of assigning value to this factor are:
(a) Ibbotson Values – US firm, Ibbotson, has market data since 1926 and on that basis they have arrived at a figure of 8%. However, finance experts are of the opinion that the time span is too short for arriving at any value. So,
(b) Jeremy Sehgal – Market data for USA compiled since 1801 and arrived at a figure of 3 – 4%. However, some other economists still argued that US economy can not be taken as representative economy of the world since it has not suffered the high and lows like Germany and Japan during wars, etc. Therefore, more representative figures are required from cross section of countries. Thus,
(c) Average of 15 countries – 3 - 4%.
(d) Respected market research companies like McKensey use a figure of 3.75 to 4%.
(e) India is considered to be much riskier market and therefore, for India, practitioners use 7-8%.
β can generally vary between 0.5 to 1.5. β can be obtained from various sources. However, here again there is no convergence of views. Views vary widely from one source to other. Various sources for β are as follows:
(a) NSE(b) Saturday’s Business India(c) Capital Market (d) Bloomberg
Some companies give β in their Annual Report.
Page 5 of 61 - Financial Management- IIJamnalal Bajaj Institute of Mgmt Studies
Mgmt study material created/ compiled by - Commander RK Singh [email protected]
Dividend Discount/Growth Model
In this model, it is assumed that current Market Price is discounted value of future cash flows (DCF) that the stock generates and discounting factor is cost of equity.
Current Market Price = Present value of (Dividend at the end of current year + estimated Market Price at that time)
Po = D1 + P1
(1+K) (1+K)
Where Po = Current Market PriceD1 = Anticipated Dividend per share next yearP1 = Estimated Market Price next yearK = Cost of equity in decimal terms
While estimating next year’s dividend is fairly easy by extrapolation of past dividends, calculation of next year’s Market Price is comparatively difficult.
Now forecasting future dividends till infinity is impossible. In order the simplify the process, Dividend growth model assumes that dividend will grow at constant rate of “g” till infinity. As n approaches infinity, Present Value of Pn+1 would be miniscule and can be ignored.
Above is a Geometric Series and therefore can be simplified as Po = D1 (K-g)K = D1 + g Po
Page 6 of 61 - Financial Management- IIJamnalal Bajaj Institute of Mgmt Studies
Mgmt study material created/ compiled by - Commander RK Singh [email protected]
This model is applicable for companies which have matured and saturated but can not be applied to growing companies where growth rate is very high. Take for instance the case of Infosys. The growth rate of Infosys is about 30% year on year. (Amazon.com initially had growth rate of 80% per quarter). If we apply this model, then it means that this company would ultimately out grow India which has a current average growth rate of about 6-7%, which is absurd.
Thus, this model is not recommended for use. But there is another use for this model. If you find the value of Re from CAPM method and substitute for “K” in this model, inherent discount/growth rate assumed by market “g” can be known.
Cost of Debt:
Cost of Debt = i (1-t)
Where i = yield = Amount of Interest Market Value of debt
t = corporate tax rate
Above formula is valid only if debt is perpetual. (In most companies the debt is perpetual. While each debt instrument has a definite life, new debts are raised to fill the gap of retiring debts. Thus, while no individual debt may be perpetual, overall debt of the company is generally perpetual).
Problem
Calculate Cost of Capital (Previous Problem)
Source of Fund Amt in Cr (BV) Mkt Value WtEquity 100 74.71R&S 600 NIL11% Debenture 400 19.5413% Long Term Debt
100 5.75
Total 1200 100.00Additional information: Company’s β =1.1, Rf = 7.1 and Rm – Rf = 7%.
Solution:
Cost of Equity = Re = Rf + β(Rm – Rf)= 7.1 + 1.1 (7)= 14.8%
Cost of Debt = i (1-t)(a) Debenture - Yield = i = 44 = 12.94
340
Page 7 of 61 - Financial Management- IIJamnalal Bajaj Institute of Mgmt Studies
Mgmt study material created/ compiled by - Commander RK Singh [email protected]
(b) Cost of debenture = 12.94(1-0.35)= 8.41% (Effective Interest Rate)
(c) Long Term Debt - Yield = 13% (Equal to coupon rate since no discount or premium)Cost of LT Debt = 13 (1-0.35)
= 8.45% (Effective Interest Rate)
Source of Fund Amt in Cr (BV) Mkt Value Wt Cost (%) Cost of Capital (%)Equity 100 74.71 14.80 11.05R&S 600 NIL NIL NIL11% Debenture 400 19.54 8.41 1.6413% Long Term Debt
100 5.75 8.45 0.49
Total 1200 100.00 13.18
Estimating Cost of Capital of Conglomerates (Multi-business firms like L&T and ITC)
Such businesses don’t have a single Hurdle Rate (another term used for cost of capital). What we apply in such cases is Divisional Cost of Capital (Cost of capital separately for each division of business).
To find out Divisional Cost of Capital of say Cement Division of L&T, find β of all companies producing only Cement (Called Pure Play Approach since their businesses are purely Cement). Find market capitalization of each company and calculate the weighted average of β of Cement Companies. This β is the representative β for risky ness of cement industry.
Thus, cost of capital also depends on use of funds and not only on source of fund.
Page 8 of 61 - Financial Management- IIJamnalal Bajaj Institute of Mgmt Studies
Mgmt study material created/ compiled by - Commander RK Singh [email protected]
Date: 28 Jan 2006
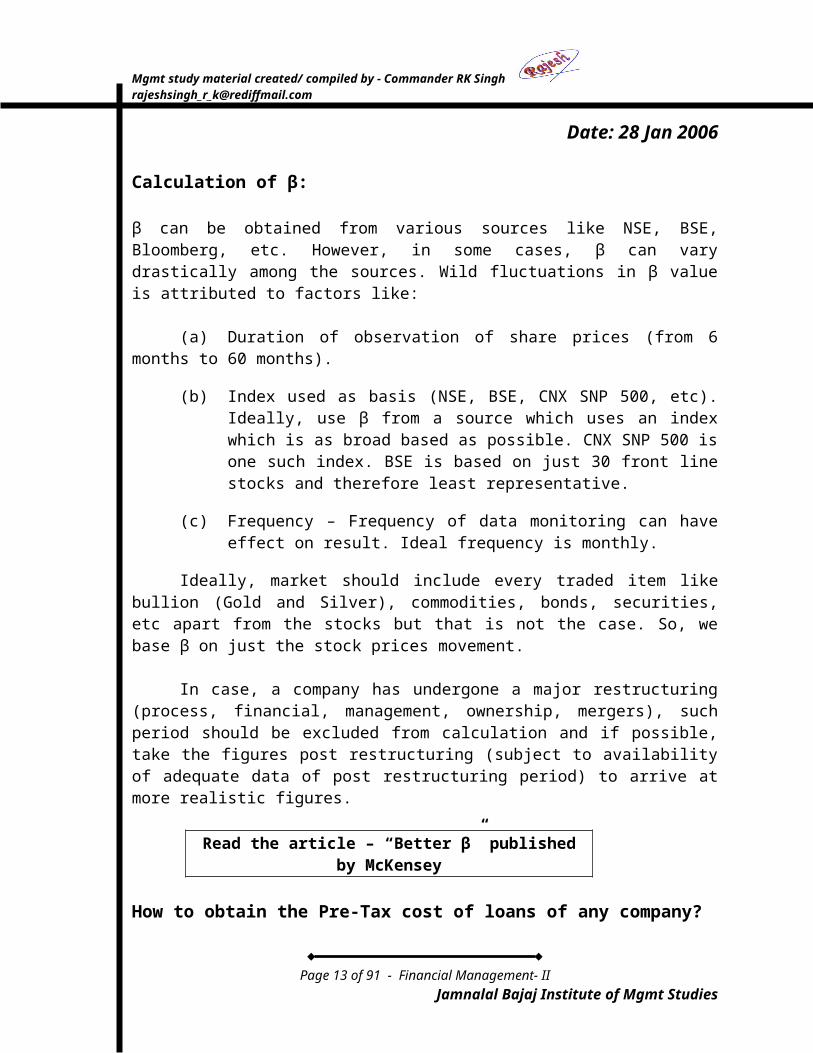
Calculation of β:
β can be obtained from various sources like NSE, BSE, Bloomberg, etc. However, in some cases, β can vary drastically among the sources. Wild fluctuations in β value is attributed to factors like:
(a) Duration of observation of share prices (from 6 months to 60 months).
(b) Index used as basis (NSE, BSE, CNX SNP 500, etc). Ideally, use β from a source which uses an index which is as broad based as possible. CNX SNP 500 is one such index. BSE is based on just 30 front line stocks and therefore least representative.
(c) Frequency – Frequency of data monitoring can have effect on result. Ideal frequency is monthly.
Ideally, market should include every traded item like bullion (Gold and Silver), commodities, bonds, securities, etc apart from the stocks but that is not the case. So, we base β on just the stock prices movement.
In case, a company has undergone a major restructuring (process, financial, management, ownership, mergers), such period should be excluded from calculation and if possible, take the figures post restructuring (subject to availability of adequate data of post restructuring period) to arrive at more realistic figures.
Read the article – “Better β” published by McKensey
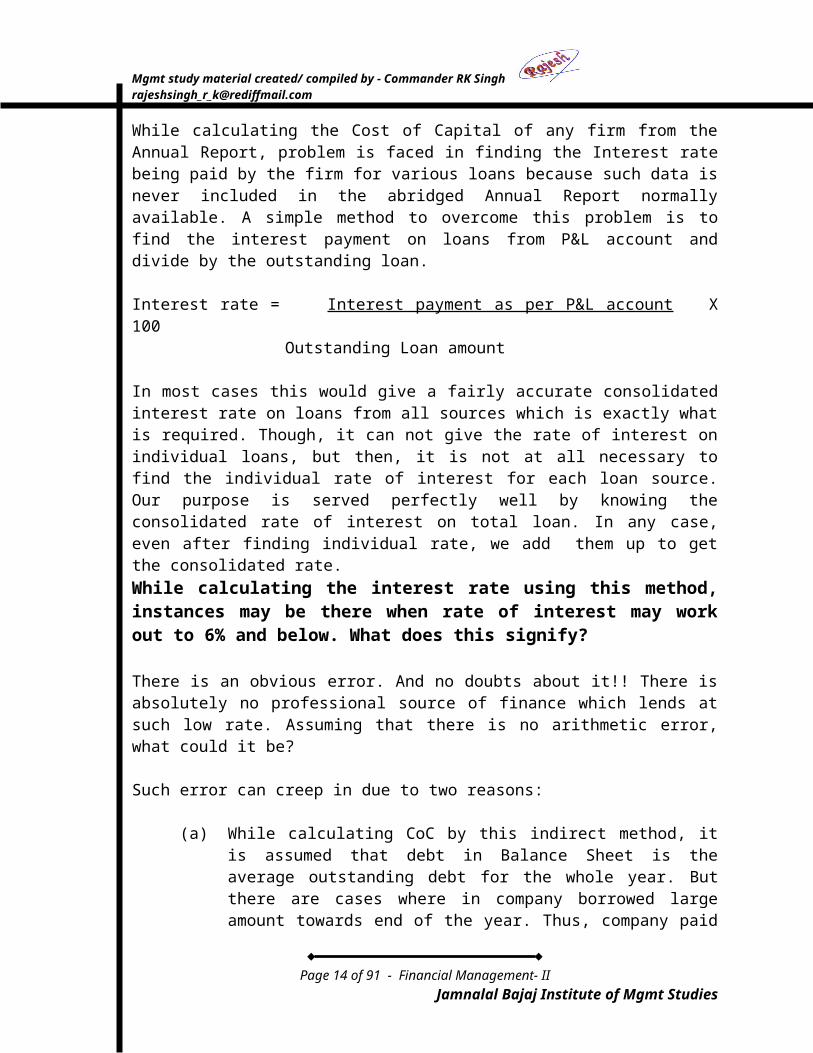
How to obtain the Pre-Tax cost of loans of any company?
While calculating the Cost of Capital of any firm from the Annual Report, problem is faced in finding the Interest rate being paid by the firm for various loans because such data is never included in the abridged Annual Report normally available. A simple method to overcome this problem is to find the interest payment on loans from P&L account and divide by the outstanding loan.
Interest rate = Interest payment as per P&L account X 100 Outstanding Loan amount
In most cases this would give a fairly accurate consolidated interest rate on loans from all sources which is exactly what is required. Though, it can not give the rate of interest on individual loans, but then, it is not at all necessary to find the individual rate of interest for each loan source. Our purpose is served perfectly well by knowing the consolidated rate of interest on total loan. In any case, even after finding individual rate, we add them up to get the consolidated rate.
Page 9 of 61 - Financial Management- IIJamnalal Bajaj Institute of Mgmt Studies
Mgmt study material created/ compiled by - Commander RK Singh [email protected]
While calculating the interest rate using this method, instances may be there when rate of interest may work out to 6% and below. What does this signify?
There is an obvious error. And no doubts about it!! There is absolutely no professional source of finance which lends at such low rate. Assuming that there is no arithmetic error, what could it be?
Such error can creep in due to two reasons:
(a) While calculating CoC by this indirect method, it is assumed that debt in Balance Sheet is the average outstanding debt for the whole year. But there are cases where in company borrowed large amount towards end of the year. Thus, company paid interest only on originally small amount of debt for most part of the year and on enlarged debt for a few months only. Thus, the basic assumption of Balance Sheet debt being average debt for the whole year goes wrong. Bloated denominator in formula results in such unrealistically small interest rate. Reverse of this is also true. A large part of the loan may have been retired towards end of the year and this will lead to error on the higher side.
(b) Check from the book “Valuation”
Effective Tax Rate Vs Nominal Tax Rate:
The tax rate announced by the Govt is called Nominal Tax Rate. But the actual tax outgo on PBT of company is called Effective Tax Rate. Companies like Reliance, before introduction of MAT (Minimum Alternative Tax), were ZERO tax companies. Even today, while the Corporate Tax rate announced by the Govt is over 30%, the tax outgo on PBT in case of Reliance is just about 10%. A natural question arises in this case as to which rate of tax to take while calculating the Net Interest Rate {r x (1– tax rate)}, the Nominal rate or the Effective rate? It is advisable to take the Nominal rate, since such concessions (Tax shield on interest payments) only have been used to lower the tax liability of the company.
How to deal with Govt Grant of Funds?
It is a gift with no returns expected on it. So, exclude it completely. In any case, cost of fund is ZERO. But do not include it in the total funds calculation also. Else, it will distort the picture.
For further details – Read Chapter 10 on Cost of Capital from “Valuation”
Page 10 of 61 - Financial Management- IIJamnalal Bajaj Institute of Mgmt Studies
Mgmt study material created/ compiled by - Commander RK Singh [email protected]
MERGERS AND ACQUISITIONS
What is the difference between Mergers and Acquisitions?
Suppose there are two companies – Co. “A” and Co. “T” (These are universal notations, “A” denoting acquiring company and “T” denoting target company). When Co. “T” is acquired by Co. “A”, there are three possibilities:
(a) Co “T” loses its legal identity and assumes the name of acquiring company after the take over. Co. “A” + Co. “T” = Co. “A”. (“T” could be one or even more than one company).
(b) After takeover of Co. “T” by Co. “A”, both lose their identity and create a third company, say Co. “X”. (Called - Amalgamation)
(c) After the takeover, both companies continue to maintain their separate name and legal identity. Only the ownership and possibly management have changed. For a layman on the street, it is business as usual.
In the above scenarios, cases (a) and (b) are called Mergers, while case (c) is called Acquisition. Thus, dividing line between the two is retention of legal identity of the “Taken-over company”. If it gets to retain its name, it is called Acquisition else Merger.
Why Mergers and Acquisitions:
Mergers and Acquisitions don’t come cheap. Mostly, there is a premium of 30% to 100% over the market price of shares that is paid by the acquiring company. Therefore, what is the motive behind going for Mergers and Acquisitions? What is the driving force for takeover bids?
Major reasons for Mergers and Acquisitions are:
(a) Synergies – Marketing, Production, Procurement, R&D, etc.
(b) Profits expected from exploiting latent growth potential of target company.
(c) Own Growth – Geographical, Product, segment, etc.
(d) Neutralising/containing the competition
(e) Diversification of Risks
Synergies
(i) Marketing – Marketing costs are often substantial, in some cases more than production costs. Instead of two companies marketing fiercely for the same market pie, a single combined company can achieve same result with much
Page 11 of 61 - Financial Management- IIJamnalal Bajaj Institute of Mgmt Studies
Mgmt study material created/ compiled by - Commander RK Singh [email protected]
lesser marketing efforts and costs. While negative effects of competitor’s advertising are not there, many overlapping costs between two companies are also saved.
(ii) Product Portfolio Rationalisation – Most companies serve only a few segments and have no products offering for other segments. Take the case of HLL - TOMCO merger. While HLL had many western brands, appealing to high and middle class segments, it did not have an ethnic brand with appeal to lower strata (volume drivers) of the society. TOMCO had reverse problem. When the two merged, HLL could penetrate ethnic segment also.
(iii) Procurement – Combined procurement of raw material and services for added capacity gives economies of scale in procurement and bulk concessions.
(iv) Production – Production yields often improve, wastages fall, batch time comes down, etc, due to sharing of technology and knowledge between the two companies.
Growth – Growth is often the reason for mergers and acquisitions. A company wanting to grow has two options. Either to erect a Green Field project and sit out through the gestation period or acquire a company. Growth is not limited to just production volume but may be in terms of Geography or product also. As quoted earlier, HLL added ethnic brands to its line of products by acquiring TOMCO. Similarly, when Kissan bought out Dippys, one of the primary purpose was to gain the market share in South India where Dippy’s brand had good market share.
Neutralizing Competition - Though it is illegal (by Competition Commission in India, Anti Trust Laws in USA and similar laws in most countries and therefore, even authors are shy of quoting this as one of the reasons), it is still the purpose behind many takeover bids. Take for instance, Coca Cola’s purchase of Thumsup, Limca, Gold Spot, etc brands from Chauhans of Parle Group. These once popular brands commanding huge market share were purchased and killed gradually to make way for Coca Cola’s products.
Diversification of Risks – Expansion of business, through product portfolio growth, geographical spread, distribution of production facilities, or spread through various segments of society reduces the risk of business.
Mergers can be of various types: -
(a) Horizontal Mergers – Merger between two firms in the same line of business is known as horizontal merger.
(b) Vertical Mergers – A vertical merger involves two companies at different stages of production. A producer expands backwards to control the source of raw material or forward towards customer to control distribution, sale and
Page 12 of 61 - Financial Management- IIJamnalal Bajaj Institute of Mgmt Studies
Mgmt study material created/ compiled by - Commander RK Singh [email protected]
service of product. Take example of Reliance. Being in refinery business, they moved backward to own oil fields and forward to open petrol pumps (though not through merger and acquisition).
(c) Conglomerate Mergers – Merger between two companies in the unrelated lines of businesses is called conglomerate merger.
VALUATION
Why is valuation required?
In case of Target Company: To assess
Is the target company a good buy?What price should one pay for the target company?What will be the synergy gain? (Valuation to be done on “As Is” basis and also “As under Co. “A” basis).
In case of the Acquiring CompanyDetermination of relative valuation for share transfer.Assessment of gains through synergy.
Basis of Valuation: Valuation could be based on
1. Assets Based Approach– Value of assets of company affects value of company. Godrej Boyce may not be the most profitable company. But the company will fetch huge valuation because it is sitting on thousands of hectares of prime land in Vikhroli. Valuation could be done on NAV, Book Value or Replacement basis.
2. Earning Based Approaches – Value of earnings of the company is also often taken as basis for valuation. Earning valuation can be done either by DCF method or CAPM or Earning Capitalisation Value (Method adopted by erstwhile Controller of Capital Issues- CCI).
3. Market Based Approach –
(i) Comparable Transactions in recent past. This method is more prevalent in commodities where there is no brand image or value.
(ii) Comparables eg EBIDTA Vs EV (Enterprise Value), PE Ratio, etc.
Underlying approach of valuation and capital Budgeting is same.
Page 13 of 61 - Financial Management- IIJamnalal Bajaj Institute of Mgmt Studies
Mgmt study material created/ compiled by - Commander RK Singh [email protected]
Procedure
1. Prepare projected income statement
(a) Sales(b) Expenses – Raw materials, Utilities, Labour, etc breaking down cost to
each element is necessary for detailed analysis.(c) PBT, Tax(d) Operating Cash inflow (PAT + Depreciation + Amortisation, etc)
2. Arrive at Free Cash Flow to the firm.
Definition of Cash Flow – Separation between Investment decision and Financing Decision.
Financial flows are not accounted in Capital Budgeting.
Time Frame taken is such where forecasting can be done with reasonable accuracy. For manufacturing companies it is 3-5 years.
3. Calculate Continuity Value (Chapter 12 of Valuation by Copeland)
Continuity/Terminal Value – It is insignificant amount in case of Capital Budgeting. However, in case of valuation of company, it is often 70 – 80% of total valuation. So, any error in assessment of terminal value in case of Capital Budgeting may not have any effect on decision making but has make or break effect on decisions based on Valuation.
4. Discount Free Cash Flow.
Page 14 of 61 - Financial Management- IIJamnalal Bajaj Institute of Mgmt Studies
Mgmt study material created/ compiled by - Commander RK Singh [email protected]
Date: 04 Feb 2006
Synergy
PVAT > PVA + PVT
1.Gains from merger = PVAT - (PVA + PVT) (When we talk about gains from merger, we only look at total gains and overlook sharing of gains between Acquiring company and Target companies (Who will get what percent of the gains is immaterial).
2.Cost of Merger = Cash – PVT Net Gains from merger = PVAT - PVA - PVT – Cash + PVT
(NPV)= PVAT - PVA – Cash
Problem
Company “A” has market value of Rs 20 lacs and company “T” has market value of Rs 2 lacs. Merging both companies will have a cost saving with PV = 1,20,000. Suppose, Co. “T” is bought by Co. “A” for cash for Rs 2,50,000, Find
(a) NPV of Project(b) What could be the reaction of stock market when merger is announced.
Solution.
(a) NPV of the project = Cost Savings – Price paid over and above the valuation of the Co. “T”.
NPV of the project = 1,20,000 – (2,50,000 – 2,00,000)= 70,000
(b) Market Reaction: Share price of Company “T” will rise by 25% and that of company A by 3.5 %.
Justification for above forecast –Share Price of a company in the market is actually the Present Value of all future cash flows (Discounted Cash Flow) generated by the company on per “Share” basis. Valuation of a company is the Present Value of all future cash flows generated by the company on cumulative basis instead of per share basis. Therefore, if there is this additional (though unexpected) cash flow in the form of premium paid on current valuation during acquisition, same needs to be factored in the share price of the company. Thus, if a company has been acquired at 25% over its current valuation, all other earning potentials remaining same, share price will go up by 25%.
Page 15 of 61 - Financial Management- IIJamnalal Bajaj Institute of Mgmt Studies
Mgmt study material created/ compiled by - Commander RK Singh [email protected]
Similarly, out of the total gain of Rs 1,20,000 achieved through synergy, Rs 50,000 have already been given to shareholders of Co. “T”. The balance amount of Rs 70,000 will be the increase in Present Value of cash flow of company “A”. In percentage terms, 70,000 works out to 3.5% of valuation of Co. “A’ ie Rs 20,00,000.
Determination of Present Price of a Share.
If Dividend at the end of current year is DIV1, Present Price of share = Po and expected Price at the end of Year 1 = P1, Then
Expected Return = r = DIV1 + (P1- Po) Po
Transposing the figures from one side to other side we get
Current Price Po = DIV1 + P1 = 1 (DIV1 + P1) (1+r) (1+r)
By the same logic P1 = 1 (DIV2 + P2) (1+r)
and P2 = DIV3 + P3 and so on … till Pn = DIV(n+1) + P(n+1)
When n is very large and tends to reach ∞, present value of such an amount is negligible. (Present Value of Rs 22,60,00,000 earned in year 2106 (100 years from now) is just about Rs 100 when discounted at 10% Cost of Capital rate. Conversely, Rs 100 deposited today at 10% compounded rate would grow to Rs 22,60,00,00 in year 2106).
Pn can be conveniently ignored being insignificant value. (1+r)n
n
Thus, P0 = ∑ DIVt t = 1 (1+r)t
It is evident from above derivation that present value of a share is actually the Discounted Cash Flow of all the future Dividends of the company.
How to Calculate the Synergy -
Page 16 of 61 - Financial Management- IIJamnalal Bajaj Institute of Mgmt Studies
Mgmt study material created/ compiled by - Commander RK Singh [email protected]
1. Like the gains from the synergy accrued to individual companies determine the share price movement of individual companies, its converse is also equally true. Share price movements after the announcement of merger indicate the market expectation about gains for each company from the merger. In the case of HDFC Bank and Times Bank merger in 2000, the Boards of two companies decided to fix the swap/exchange ratio based on market rate of two shares post announcement of merger.
2. Event Study Methodology of Synergy calculation.
3. Other methods of Determining exchange ratio.
(a) Based on EPS – EPST
EPSA
Even within this method, question arises as to which EPS to take?
(i) Current EPS- This method is not always accurate. We have seen above that a share’s current price is determined by the future cash flows of the company. Current EPS represents only a fraction of all the cash flows. Further, EPS can fluctuate wildly at times between two years due to changes in business environment. Assumption that two companies have same growth potential and will maintain the same EPS ratio in future is over simplification of things. It fails to account for the differential growth prospects of two companies. In the cases of sudden changes in business environment, like Govt policy on import/export, etc, which may have unfolded in the recent past, current EPS would not reflect even the visible current true value of the company. In any case, this method is not suitable for companies from different industry segments. It can at best be applied to similar business companies only.
(ii) Avg EPS of Past Years – This method takes care of fluctuations in EPS but leaves out the concerns of differential growth prospects. Also, as they advertise in case of Mutual Funds, “Past performance does not guarantee future performance”, past EPSs may cloud the true assessment unduly at times. So, it does not reflect the true state of company’s growth potential. It is best suited for a company which has a highly uneven EPS in the past few years.
(iii) Weighted Average of Past EPSs – This method takes care of above concern by allocation of highest weight to most recent EPS and thereafter on diminishing basis. Standard practice for allocation of weight for a three year period of say 2005, 2004, 2003 is 3:2:1. However, this decision is left to the Boards of the two companies. Yet, it does not address the issue of growth prospects of company.
Page 17 of 61 - Financial Management- IIJamnalal Bajaj Institute of Mgmt Studies
Mgmt study material created/ compiled by - Commander RK Singh [email protected]
(iv) Projected EPS – This is a forward looking method and takes care of the future growth prospects which were absent in the preceding methods.
Advantage of EPS methods in general are two fold. One - It is the simplest method. Not much calculation is required. And second is the objectivity or as we say transparency and verifiability. There is little scope of window dressing.
Disadvantages of this method are already listed. To sum them up in a single sentence, this method, like any other accounting method, does not discount the risks or factors the opportunities to the company.
(b) Book Value of Share – BVA
BVT
This is an asset based approach and based on Past. It does not reflect the future value and not even the current value. Many assets like land are always valued at purchase price where as they may have appreciated thousands of time over the period as is the case with Godrej’s Vikhroli land.
(c) Net Asset Value – NAVA
NAVT
This method captures the present value of all assets. This method is popular for valuation of companies that are currently making loss and therefore there is no EPS available. It is also used for Unlisted and Closely held companies.
(d) Market Price Based Method – MPA
MPT
As the name suggests, it is a market based approach. Valuation can be based on current Market Price of the two companies or Avg of the past market prices when there is suspicion that vested interests have manipulated the prices of the shares to get a better deal. This method is considered to be the most suitable method since it captures the expectations of the investors as well as the risks involved. But this method can be used only when both the companies are frequently traded.
(e) Earning Capitalisation Value Method – This method is most suited for closely held and unlisted companies. The modus operandi used is to attribute a relevant PE ratio after examining the company and comparing with some other company in same business and of similar characteristics and size.
EPS x Relevant PE ratio = Fair ValueFVA
FVT
(f) Combination Method – Combination method is using more than one of the above methods to arrive at the valuation. CCI (erstwhile Controller of
Page 18 of 61 - Financial Management- IIJamnalal Bajaj Institute of Mgmt Studies
Mgmt study material created/ compiled by - Commander RK Singh [email protected]
Capital Issues – Disbanded in 1991 and SEBI instituted since then) adopted this method.
EP = 1/PE = Capitalisation rate.
(g) Comparables as basis for Valuation – The method involves identifying a company as close in characteristics to the company you are valuing and listed in the Stock Exchange and then using market data of that company for the company under valuation with due intra and extrapolation of data. Various Methods are
(i) EV Sales
EV or Enterprise Value = Market Value of Equity + Book/Market Value of Debt
This is the most objective method since sales figures or EV are hard to manipulate/fudge, yet not the best.
(ii) Market Price Equity
Market Price = Market Capitalisation/PATThis is a more relevant method since what eventually matters is not sales but net profit generated. PAT is precisely that. But there is always the possibility of window dressing of PAT by manipulating the figures.
(iii) EV . EBIDTA
EBIDTA = Earning before Interest, Depreciation, Tax and Amortisation.This is half way compromise formula between first and second method. It is neither as prone to Window Dressing as the second method nor is as blind to actual profits as the first method.
(iv)Market Value Book Value
This a mixed ratio. Denominator is accounting number where as Numerator is Mkt figures.
A good valuation will include DCF method and comparables. Ideally, multiple methods should be used for valuation.
Problem
Page 19 of 61 - Financial Management- IIJamnalal Bajaj Institute of Mgmt Studies
Mgmt study material created/ compiled by - Commander RK Singh [email protected]
Given Following details: -
Company “A” Company “T”EPS 4.53 3.49No of Shares 1000 300
1. Determine Exchange Ratio based on Current EPS
EPS Ratio = 3.49/4.53 = 0.77Thus, Exchange ratio would be 0.77 shares of Company “A” for every share of Company “T”.
2. EPS of Company “A” will grow by 6% pa while EPS of “T” will grow at 4% pa. Determine Exchange Ratio based on projected earnings taking only one year perspective.
EPS of Company “A” = 4.53(1+ 6 ) 100= 4.80
EPS of Company “T” = (1+ 4 ) 100= 3.63
Exchange Rate = 3.63/4.80 = 0.756
3. Determine the Exchange Rate assuming that the above growth rate will continue for five years.
EPS of Company “A” = 4.53(1+ 6 )5
100= 6.062
EPS of Company “T” = (1+ 4 )5
100= 4.246
Exchange Rate = 4.246/6.062 = 0.7
4. Merger of both companies is likely to result in synergy of Rs 2000/=.
(a) Determine the Boundaries of Negotiations. (Boundaries of Negotiations can be described as – Under normal circumstances, what is maximum amount that Company “A” can be expected to pay and what is the minimum that Company “B” should be prepared to accept).
ERA = TE - EPSA (NA) EPSA (NT)
Where TE = Total Earnings= EA + ET + Synergy
Page 20 of 61 - Financial Management- IIJamnalal Bajaj Institute of Mgmt Studies
Mgmt study material created/ compiled by - Commander RK Singh [email protected]
(b) What would be the EPS of Company ‘A’ post merger?
Total Shares post merger = 1000 + (300x2.24)= 1672
EPS = Total EarningsTotal Shares post merger
= 7577 1672= 4.53 (Same as pre merger EPS of Co. ‘A’)
Exchange Ratio = ERT = EPST (NA) TE - EPST (NT)
= . 3.49x1000 . 7577 – (3.49x300)
= 0.534
(c) What would be the EPS of Company ‘A’ post merger ?
Total Shares post merger = 1000 + (300x0.534)= 1160.2
EPSA = Total Earnings Total Shares post merger = 7577 1160.2= 6.53
In the normal circumstances it is not possible to negotiate beyond the boundary of 0.534 and 2.24 because that would mean sacrifice by one of the companies of present EPS.
If the above results are analysed carefully, it would be evident that those long and complex formulae of ERA and ERT need not be used at all. Same results can be obtained with equal accuracy by using a simple thumb rule: -In first case, the company ‘A’ has decided to give away all the gains of Synergy to Company ‘C’ and therefore its EPS post merger remains constant at pre merger
Page 21 of 61 - Financial Management- IIJamnalal Bajaj Institute of Mgmt Studies
Mgmt study material created/ compiled by - Commander RK Singh [email protected]
value ie 4.53, where as company T’s EPS goes up by an amount arrived at by dividing entire synergy value by its number of shares.
EPST = 3.49 + (2000/300)= 3.49 + 6.67= 10.16
Exchange Rage = 10.16/4.53 = 2.24
In the second case, company ‘A’ keeps all the gains of synergy and therefore its EPS increases by corresponding amount ie
Synergy GainsNo of Shares before merger= 2000 1000= Rs 2
Company ‘A’ Company ‘T’Total Earnings 20,000 5,000No of shares 5,000 2,000Market Price 64 30EPS 4.00 2.50
Case 1. Company “A” is prepared to Value Company “T” share at Rs 35. Determine Exchange Rate using Market Based Valuation method.
= 3564
= 0.547 (ie 0.547 shares of Co. “A” for every one share of Co. “T”)
Case 2. Determine EPS of Company “A” post mergerTotal EarningTotal Shares
= 20,000+5,000 5,000+(2000x0.547)= 25,000 6094= 4.10 which is an improvement on earlier EPS of Rs 4.00.
Case 3. Company “T” insists and gets Rs 45 per share. Determine the Exchange Rate.
= 45/64= 0.703
Page 22 of 61 - Financial Management- IIJamnalal Bajaj Institute of Mgmt Studies
Mgmt study material created/ compiled by - Commander RK Singh [email protected]
PE Ratio = Total Earnings Total no of shares
= . 25000 . 5000+(0.703x2000)
= 25,000 6406.25
= 3.90 which means there is immediate dilution of EPS. This is because in this case the PE ratio at exchange rate is worse than existing PE ratio of the acquiring company.
Question 1. Do you find any thing surprising in the results?
Ans. Yes. The surprising part of the results is that despite there being no synergy effect and also payment of a premium on Company “T” shares, there still was gain of EPS in first case. This effect is called Boot Strapping effect. Boot strapping is nothing but gains or loss in EPS without any effect of synergy. This is possible because even at post premium price of Rs 35 per share, the PE ratio of Company “T” (ie 35/2.5 = 14) is better than PE ratio of company “A” (ie 64/4 = 16) and therefore resultant EPS on merger of two companies is a weighted average of two EPSs. But in the second case there was a dilution of EPS because at acquisition price of Rs 45, the PE ratio of company “T” (45/2.5 = 18) was worse than that of company “A”. The net EPS, being weighted average of two EPS, came out to be lower than original EPS post merger.
Question 2. How would stock market react to Boot Strapping Effect?
Ans. If we analyse the two companies’ market data, we would find that PE ratio of company “A” is higher than that of company B which signifies that company “A” has better growth prospects than company “T”. Thus, when there is improvement in EPS due to boot strapping effect, it is a trade-off of future growth with current earnings (reduced net growth but with increased current earnings). Net earnings over a long period of time have not changed. Therefore, unless there are gains due to synergy, stock market should discount the premium paid on company “T” share and react with downward pressure on prices of company “A” shares.
Problem
Item Company ‘A’ Company ‘T’EPS 2 2Market Price 40 20PE Ratio 20 10No of shares 1,00,000 1,00,000Total Earnings 2,00,000 2,00,000
Page 23 of 61 - Financial Management- IIJamnalal Bajaj Institute of Mgmt Studies
Mgmt study material created/ compiled by - Commander RK Singh [email protected]
Market Value 40,00,000 20,00,000 Company “A” acquires company “T” based on current Market Price exchange ratios. How should stock market look at this acquisition?
Solution.
Item Company ‘A’ Company ‘T’ Company ‘A’ post mergerEPS 2 2 2.67Market Price 40 20 40 or 53PE Ratio 20 10 15No of shares 1,00,000 1,00,000 1,50,000Total Earnings 2,00,000 2,00,000 4,00,000Market Value 40,00,000 20,00,000 60,00,000
Market Value post merger = 60,00,000
Earnings post merger = 4,00,000
Exchange ratio based on market price = 20/40 = 0.5
Total No of shares post merger = 1,00,000 + 0.5x1,00,000 = 1,50,000
EPS = Total Earning/Total No of shares post merger
= 4,00,000/1,50,000 = 2.67
PE ratio = 15
Market Price = ??????
= At existing PE ratio of 20 = 20x2.67 = Rs 53
or
= By considering all factors, like present earnings and growth prospects -Rs 40.
The current EP ratio (reverse of PE ratio) in case of company “A” is 0.05 and that of company “T” is 0.1, which means that before merger, Re 1/- invested in company “A” would fetch a return of 5 paisa + high growth potential. Re 1/- invested in company “T” would fetch a return of 10 paisa but low growth prospects. In absence of synergy gains it leads to averaging of growth and current earnings. The net present value of all future cash flows of the merged companies remain same. Therefore, stock market ought to give no attention.
Page 24 of 61 - Financial Management- IIJamnalal Bajaj Institute of Mgmt Studies
Mgmt study material created/ compiled by - Commander RK Singh [email protected]
ASSIGNMENT
Case Study - Cooper Industries, Inc.’s Take Over Bid of Nicholson File Company(Harvard Business School, 9-274-116 dated 10 Nov 1993)
Some of the key purposes of takeover of any company are to derive benefits of:
1. Synergy2. Reviving stunted growth caused by poor management.3. Growth – Geographical, Product, segment, etc. 4. Diversification of Risks
This is a classical case of a merger/acquisition offering benefits on all the four fronts.
Facts of the Case
Cooper Industries, a conglomerate, was diversifying from its core business of heavy machinery and equipment for Oil Industry to small ticket items. Primary reason for diversification was to reduce the volatility in earnings due to cyclic nature of demands for heavy machinery.
While it could takeover four companies between 1959 – 1966 and three more hand tools companies from 1967 to 1970, its attempts to take over the 100 year old family managed Nicholson File Company were unsuccessful. Company was an excellent take over target for following reasons:
1. Very strong brand name.
(a) One of the largest domestic manufacturers of hand tools.
(b) 50% share of $ 50 million market for files and rasps.
(c) 9% share in $ 200 million market for hand saws and saw blades with excellent reputation for quality.
2. Excellent distribution system – retail outlets in 137 countries. 53,000 in US alone.
3. Industry Sales growth of 6% against company’s growth of only 2%.
4. Opportunity for improving profit margins three fold.
5. Substantial improvement potential available on following fronts: -
(a) Large number of products resulting in very high inventory and high cost of sales. (reduction of approximately 4% of sales in cost of goods sold )
Page 25 of 61 - Financial Management- IIJamnalal Bajaj Institute of Mgmt Studies
Mgmt study material created/ compiled by - Commander RK Singh [email protected]
(b) Reduction of selling expenses due to overlap of tools lines between Crescent and Nicholson. (reduction of approximately 3% of sales)
(c) Penetration of products of both the companies into thitherto weak segments.
What we have seen so far was abstract facts of the case. Let us now see the current performance parameters in absolute numbers.
Acquiring Company Company “A” Cooper Industries, Inc
Target Company Company “T” Nicholson File Company.Comparative Statement of Vital Financial and Other Parameters (1971)
"A" Cooper "T" Nicholson VLN Net Worth 172,000,000 47,000,000 71,000,000No of Shares 4,218,691 584,000Common Equity 85,000,000 31,000,000 41,000,000Closing Price as on 3.5.1971 24 44Market Cap 101,248,584 25,696,000EPS 1.12 2.32 0.54Dividend 1.40 1.60 --Book Value 18.72 51.25 9.69Market Price Range 18-38 23-32 5-8PE Ratio 16-34 10-14 9-15
Gains to be realized from acquisition/merger:
(a) Increase in share valuation due to increased profits through reduction in cost of goods sold and selling, general and admin expenses.
(b) Increase in share valuation due to increased growth rate from 2% to 6%.
(c) Synergy gains due to increased penetration into market segments for both the companies and improved marketing network.
Gains due to synergy effect of increased segment penetration and marketing network are intangible and can not be monetized easily. Therefore, we leave it as such. Increase in share valuation due to increased profits.
Nicholson File Company - Operating and Stockholder Information (Million $)1971 % of Sales Estimated Reduction
Net Sales 55.3 100Cost of goods sold 37.9 69 4% of Sales 2.2Selling, General & Admin Exp 12.3 22 3% of Sales 1.7
Exchange Rate Determination
Page 26 of 61 - Financial Management- IIJamnalal Bajaj Institute of Mgmt Studies
Mgmt study material created/ compiled by - Commander RK Singh [email protected]
1. On As is Basis
(a) Mkt Price Approach
Since the closing market price of Nicholson share is $44 against $24 of Cooper Ind, exchange rate on “As is basis” would be
= 44/24= $44 or 1.833 shares of Cooper Industries for every share of Nicholson File
Co.(b) Asset Based Approach
Book Value of Nicholson File Co. = $51.25
Book Value of Cooper Industries = $18.72
Exchange Rate on as is basis = 51.25/18.72
= 2.74 shares of Cooper Industries for every share of Nicholson File Co.
2. Max That Cooper Industries should be willing to offer to Nicholson File Co.
(a) Mkt Price Approach
Increase in profits due reduction of COGS and Selling Exp
= 2,200,000 + 1,660,000
= 3,860,000
Tax on addl profits = 40% (Given in foot note of page 7)
Increase in profits net of tax = (1 – 0.4) x 3,860,000 = 2,316,000
Increase in EPS = 2,316,000/584,000
= 3.97
Existing EPS = 2.32
Total projected EPS = 2.32 + 3.97 = 6.29 (profit margins now at par with industry)
Supposing that the company is also able to achieve the annual sales growth of 6% which is industry average, then company’s share can be expected to be valued at average PE ratio of the industry = 14-17 (say, average = 15.5)
Share price based on projected EPS and growth rate of 6%
= 15.5 x 6.29 = 97.50
Max that Cooper should be willing to offer is the entire tangible gains available from synergy. Therefore
= 97.50/24
= $97.50(Cash) or 4.06 shares of Cooper Industries for every share of Nicholson File Co.
Page 27 of 61 - Financial Management- IIJamnalal Bajaj Institute of Mgmt Studies
Mgmt study material created/ compiled by - Commander RK Singh [email protected]
(b) Asset Based Approach
Max that Cooper Ind. should be willing to offer is by taking into consideration revaluation of inventories at current market price (upward valuation by $9.2 million. (Refer foot note of Exhibit 5).
= {51.25 + (9,200,000/584,000)}/18.72
= {51.25 + 15.75}/18.72
= $67 or 3.58 shares of Cooper Industries for every share of Nicholson File Co.
Class room discussion on 25 Feb 06.
Discounted Cash Flow method is a must in any valuation exercise. In case sufficient data is not available, use assumptions.
Capex and Net Working Capital is required to be calculated.
Non Operating Assets are assumed to be constant.
For slow growing companies depreciation and capex are ignored. For a matured company (where profits and growth have stabilized) CAPEX = Depreciation.
Question – Should Cooper’s Cost of Capital be merged with Nicholson and used or only Nicholson’s cost of capital be used for calculation?
Page 28 of 61 - Financial Management- IIJamnalal Bajaj Institute of Mgmt Studies
Mgmt study material created/ compiled by - Commander RK Singh [email protected]
ACCOUNTING ISSUES IN MERGERS AND ACQUISITIONS
When two businesses are merged, question arises as to how to construct the Balance Sheet of the merged business entity. One approach is to simply sum the amounts of assets, liabilities, and equity of the two firms as they stood before the combination. This is pooling of interests accounting. Or, since business combinations are typically one firm’s purchase of another firm, another valid method would value the purchased firm at its purchase price, and add the purchase price to the assets of the acquiring firm, as one would if the acquisition were of a piece of equipment. In broad terms, the latter approach is purchase accounting. The financial statements of a combined firm will vary with the choice between pooling or purchase accounting. While accounting methods for business combinations have changed over time, under today’s accounting rules both pooling and purchase are acceptable means of valuing combinations in India even though Pooling accounting was abolished in 2002 in the United States.
Thus, there are two methods of constructing the Balance Sheet of a merged company
1. Pooling of interests method2. Purchase Method
Pooling Method – The method is very simple. Add the two balance sheets line by line, each kind of asset of acquiring company with book value of corresponding asset of acquired company and each kind of liability with corresponding liability of acquired company, and arrive at new balance sheet. It is basically arithmetic addition of two balance sheets. But there is a lacuna in this system. It fails to clearly reflect the excess price paid(premium) for company “T” by company “A”.
Purchase Method – Purchase accounting is somewhat more complicated. In a typical merger, the acquiring company pays out cash or other assets or issues the stock used in the acquisition and is the larger of the firms. The acquirer is to record on its books the acquisition at the price paid to the acquired firm’s owners, using a two-step process. First, assets and liabilities from the acquired firm (target) are recorded on the acquirer’s books at individual market values. Second, any positive difference between acquisition price and market value of net assets (assets minus liabilities) is recorded as an asset called goodwill. Once recorded, goodwill is depreciated by equal annual charges against the combined firm’s earnings over a period. If the market values of the acquired assets and liabilities are accurately measured, goodwill is the value of the acquired firm as a going concern. Alternatively, goodwill can represent promising products developed by the target, or the price the acquirer is willing to pay for economic gains, such as economies of scale, expected from the merger.
In case of Purchase method, Reserves of acquired company are not added to Reserve to acquiring company since same are accounted for in purchase price.
Page 29 of 61 - Financial Management- IIJamnalal Bajaj Institute of Mgmt Studies
Mgmt study material created/ compiled by - Commander RK Singh [email protected]
Example:ITEM Company “A” Company “T”
(Book Value)Company “T”(Fair Mkt Value)
Current Assets 2,50,000 87,000 94,000Fixed Assets 7,25,000 1,39,000 1,98,000Total Assets 9,75,000 2,26,000 2,92,000Other Liabilities 2,90,000 79,000 74,000Share Capital (Face Value Rs 10)
4,00,000 96,000
Reserves and Surplus 2,85,000 51,000Total Liabilities 9,75,000 2,26,000
Current Market Price of Company “A” is Rs 35. Exchange Ration is 1:1. Prepare post merger Balance Sheet of Company “A” under Pooling of Interest Method and also Purchase Method.
Solution:
Balance Sheet – Pooling of Interest MethodLiabilties Assets
Other Liabilities 3,69,000 Current Assets 3,37,000Share Capital 4,96,000 Fixed Assets 8,64,000Reserves and Surplus 3,36,000Total Total 12,01,000Balance Sheet - Purchase Method
Liabilties AssetsOther Liabilities 3,64,000 Current Assets 3,44,000Share Capital 4,96,000 Fixed Assets 9,23,000Reserves and Surplus 2,85,000 Good Will 1,18,000Share Premium Account 2,40,000Total 13,85,000 Total 13,85,000
Calculations: -
Important - In Purchase Method of constructing Balance Sheet, market value of various items is taken and not book value.
Amount paid for acquiring company “T” = 96000/10 x 35 = 3,36,000Out of this amount – Rs 9600 x 10 = 96000 is accounted with Share Capital. Balance amount, ie Rs 9600 x 25 (share premium) = 2,40,000 is accounted as Share Premium Account.
Asset Value of company “T” = 94,000 + 1,98,000 = 2,92,000 (on fair mkt value basis)Thus Premium paid = 3,36,000 – 2,92,000 = 44,000
Page 30 of 61 - Financial Management- IIJamnalal Bajaj Institute of Mgmt Studies
Mgmt study material created/ compiled by - Commander RK Singh [email protected]
Goodwill value is found as balancing figure in the balance sheet. However, it can be found directly also.
Goodwill = Price paid – (Net Value of Asset received)= Price paid – (Value of Asset received – Other liabilities)= 336,000 – (2,92,000 – 74,000)= 1,18,000
What we observe from the above two balance sheets is that Balance Sheet is bigger under the Purchase Method since it accounts the goodwill value also. The question is - what is better – A fat balance sheet or a lean and mean balance sheet.
The first counter question to ask here is – Good from whose perspective? What is right for the Goose is often wrong for the Gander. Good and Bad will mutually change roles for two chief protagonists in any situation. Here, company management and shareholders are two main parties.
While a fat balance sheet gives more leverage to the firm to procure funds, lean balance sheet has several advantages.
1. Primarily, it will make all the ratios look better. In most vital ratios, Profit and Loss statement figures are the numerators and Balance Sheet figures denominators. Smaller denominators will lead to apparently better ratios.
2. The second problem faced in Purchase method of accounting for mergers is the presence of goodwill in the balance sheet. This goodwill is gradually amortised against yearly profits over a period of time. Thus, the reported profits are lower for a significant number of years. This amortization also does not get any Income Tax concession and is done on Profit after Tax (PAT).
3. Fixed Assets under the Pooling Method are accounted at book value where as in Purchase Method they are accounted at Fair Market Value. Thus, the depreciation accounted each year is higher. This will again lead to depressing the reported profits for next few years. This higher accounting of depreciation is also not eligible for any tax concessions since company would still be getting tax exemption on book value basis only.
4. Balance sheet is far more transparent in case of Purchase method. Balance sheet in case of Pooling method does not reflect the premium paid for acquisition any where. So, it is more convenient for the management.
Thus, we see that while pooling method is better from management perspective, it is better for investors to have it Purchase method way.
US abolished Pooling Method of Balance Sheet construction for merged companies with effect from 2002. This led to loud uproar and protest from corporate world there. As a
Page 31 of 61 - Financial Management- IIJamnalal Bajaj Institute of Mgmt Studies
Mgmt study material created/ compiled by - Commander RK Singh [email protected]
concession, US govt allowed that Goodwill need not be written off if actual Goodwill is equal to or higher than paid during the acquisition. This was included as Accounting Standard 42 in US.
In India, option is still left to the management to take any of the two methods subject to certain conditions. There are six conditions laid down as per Accounting Standard 14 which need to be fulfilled to opt for Pooling method of accounting. However, it is only a matter of time before we also follow US way and withdraw the Pooling method option.
Warner Inc and AOL merger took place in 2000 during the dot com boom in US. In the year of abolition of Pooling Method of accounting, ie 2002, Warner Inc reported loss of $ 60 billion, biggest loss in American Corporate history because the dot com burst had taken place by then and there was goodwill loss which had to be reported.
Question – How would Stock Market react to reporting of such huge loss?
Question – How would stock market react to choice of method of accounting? (read from Copeland)
Empirical investigation supports the argument that the differences in reported earnings under pooling and purchase do not sway investors. Hong, Kaplan, and Mandelker (1978) examined empirically the stock price reaction to acquirers’ pooling-purchase choice. They did so by using a statistical technique known as event study, which isolates the stock market’s reaction to the event in question. In this case the event was business combinations accounted for either by pooling or by purchase methods.
Hong & co investigated acquisitions made in the period 1954 through 1964, when rules that limited the choice between the two accounting methods were more lax than those adopted in 1970. All acquisitions in the authors’ sample were tax free. They found no evidence that stock prices of acquirers using purchase accounting suffered relative to that of acquirers using pooling accounting. In fact, just the opposite was true—the stock price of acquirers using purchase accounting rose around the time of the acquisition while the stock price of poolers demonstrated no significant change. Hong et al. (1978) concluded that “investors do not seem to have been fooled by this accounting convention into paying higher stock prices even though firms in our sample using pooling-of-interests accounting report higher earnings than if they had used the purchase method”
The results of empirical research by Hong, were confirmed by Davis who conducted his research in 1990 for merger of firms between 1971-82 and enlarging the sample size.
Despite availability of all the empirical evidence which suggests no gains for firms opting for Pooling method, corporates continued to show strong preference for Pooling method. The preference was so strong that many firms paid extra premium to the acquired firm to be allowed to follow the pooling method. AT&T paid an extra $325 million to NCR Corp to be able to use Pooling method.
Page 32 of 61 - Financial Management- IIJamnalal Bajaj Institute of Mgmt Studies
Mgmt study material created/ compiled by - Commander RK Singh [email protected]
My Personal Assessment - It certainly looks silly to assume that financial managers of such a hugely successful firm as AT&T would throw away $325 million for no real benefit. And the reason seems to be more embedded in human behaviour than financial matters. One plausible explanation that I can think of is managers’ long term perspective. Human memory is pretty short. While efficient markets are able to discount the effects of accounting numbers on reported profits and other ratios by reworking them sans bloated accounting number or looking at the free cash flow generated by the company, for a short period of time, they may not be as inclined to rework the numbers after some time. The effect of these accounting numbers runs rather far and long. Like, period allowed for amortization of goodwill in US was 40 years. It is not reasonable to expect financial analysts to continue to rework the numbers every quarter for next 40 years. Thus, after a certain period of time, the reported figures begin to be looked at on face value and that is when shares begin to take a beating on the stock market in purchase method of accounting. However, no study has been done to assess impact of accounting methods over a fairly long period. So, what I have surmised above is pure gut feeling without any empirical research to support it.
Study by Hong, Kaplan and Manchelkar concluded that companies using Purchase Method performed better during 12 preceding months of merger compare to the firms using Pooling Method.
Is it because the firms already performing better felt more comfortable and bold and therefore were less worried about deteriorating ratios than companies which had their ratios already strained?
Page 33 of 61 - Financial Management- IIJamnalal Bajaj Institute of Mgmt Studies
Mgmt study material created/ compiled by - Commander RK Singh [email protected]
Date: 04 Mar 2006
THEORIES OF CAPITAL STRUCTURE
Read Chapters 17 (Does Debt Policy Matter), 18 (How much should a firm borrow) and 19 (Financing and Valuation) from the book Principles of Corporate Finance (Seventh Edition) by Brealey and Myers.
What is Capital Structure??
It is mix of finance of a company. Corporate finance is principally divided into two parts, equity and debt. Thereafter, there are sub classes within them. Capital Structure is about selecting Financing Options. In short and simple terms – It is all about working out, “How much of company’s funds should be sourced from debt and how much from equity?”
Two questions that seek our attention are: -
1. What happens to Cost of Capital when leverage increases?2. Is it possible to have optimal capital structure?
Following notations will be used extensively while studying this topic
Kd = F = Annual Interest ChargesD Market Value of Debt
Ke = S = Earnings available to ShareholdersE Market Value of Equity
V = D+E = Value of Firm = Market Value of Debt + Market Value of Equity
Ko = O = Net operating earningsV Value of Firm
Ko = Kd ( D ) + Ke ( S ) (This is nothing but weighted average cost of capital) D+E D+E
There are three basic approaches to Theories of Capital Structure.1. Net Income Approach2. Net Operating Income approach3. Traditional Approach
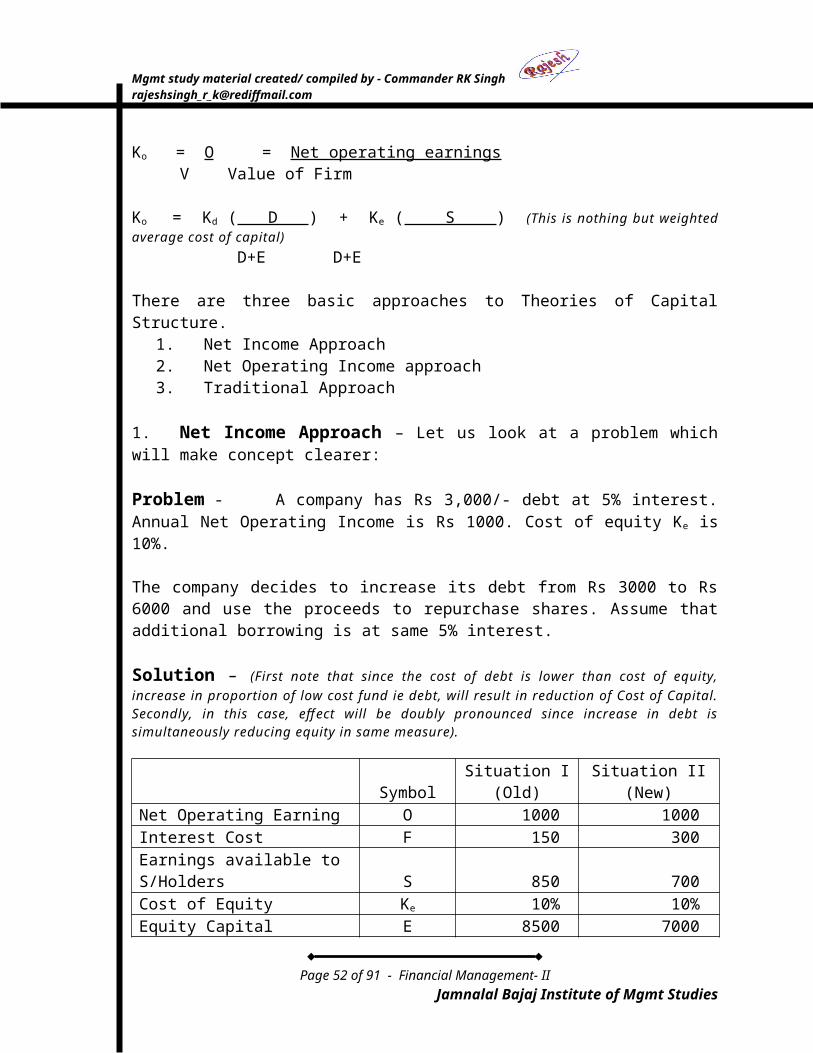
1. Net Income Approach – Let us look at a problem which will make concept clearer:
Page 34 of 61 - Financial Management- IIJamnalal Bajaj Institute of Mgmt Studies
Mgmt study material created/ compiled by - Commander RK Singh [email protected]
Problem - A company has Rs 3,000/- debt at 5% interest. Annual Net Operating Income is Rs 1000. Cost of equity Ke is 10%.
The company decides to increase its debt from Rs 3000 to Rs 6000 and use the proceeds to repurchase shares. Assume that additional borrowing is at same 5% interest.
Solution – (First note that since the cost of debt is lower than cost of equity, increase in proportion of low cost fund ie debt, will result in reduction of Cost of Capital. Secondly, in this case, effect will be doubly pronounced since increase in debt is simultaneously reducing equity in same measure).
Symbol Situation I (Old) Situation II (New)Net Operating Earning O 1000 1000Interest Cost F 150 300Earnings available to S/Holders S 850 700Cost of Equity Ke 10% 10%Equity Capital E 8500 7000MV of Debt D 3000 6000Valuation of Company V 11500 13000Cost of Capital Ko 8.70 7.69
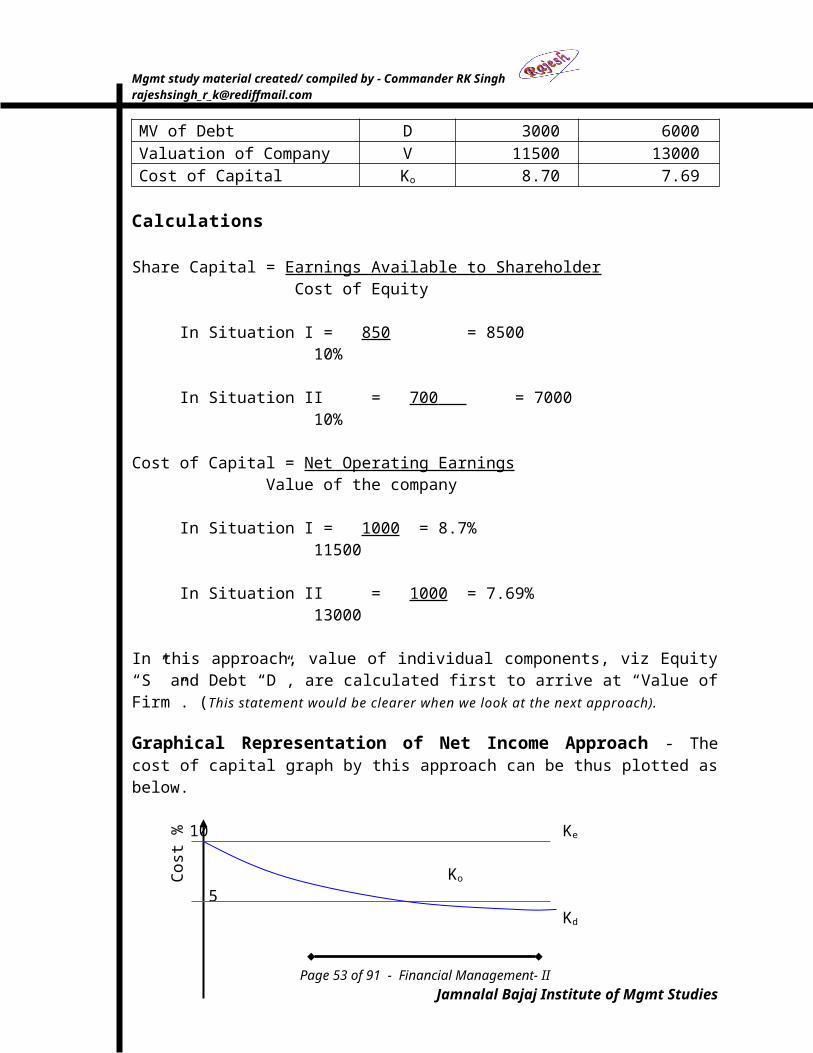
Calculations
Share Capital = Earnings Available to Shareholder Cost of Equity
In Situation I = 850 = 8500 10%
In Situation II = 700 = 7000 10%
Cost of Capital = Net Operating Earnings Value of the company
In Situation I = 1000 = 8.7% 11500
In Situation II = 1000 = 7.69% 13000
In this approach, value of individual components, viz Equity “S” and Debt “D”, are calculated first to arrive at “Value of Firm”. (This statement would be clearer when we look at the next approach).
Page 35 of 61 - Financial Management- IIJamnalal Bajaj Institute of Mgmt Studies
Mgmt study material created/ compiled by - Commander RK Singh [email protected]
Graphical Representation of Net Income Approach - The cost of capital graph by this approach can be thus plotted as below. 10 Ke
Ko
5Kd
0D/E
Interpretation of the Graph
On the horizontal line, D/E is the debt equity ratio increasing from left to right. On the extreme left, debt (ie “D”) is “0” and therefore D/E = “0”. Entire company is financed by equity and cost of equity Ke is given as 10%. So, overall cost of capital Ko = Ke = 10%. Thereafter, as the debt component in the finance increases with simultaneous reduction in equity component, company moves towards a situation where it is completely financed by debt (a hypothetical situation). As the debt component reaches near 100% capital of company and equity approaches “0” % level, cost of capital Ko also approaches cost of debt Ke rate, ie 5%. Above is based on the assumption that lenders will continue to lend at the same rate and will not hike the lending rate as leverage increases (another hypothetical situation which would never be true).
What we see from above graph is that optimal capital structure is possible in this case, which is maximizing the debt component in the finance mix.
However, problem with this approach is that, as the debt component in the finance increases, there are lesser investors left to share the risk and therefore expected return on investment or cost of equity goes up. But this approach assumes that cost of equity is constant.
2. NOI Approach – We will continue with the same set of numbers with a minor difference that this time Ko is given instead of Ke.
Symbol Situation I (Old) Situation II (New)Net Operating Earning O 1000 1000Cost of Capital (CoC) Ko 10% 10%Valuation of Company V 10000 10000MV of Debt D 3000 6000Equity Capital E 7000 4000Interest Cost F 150 300Earnings available to S/Holders S 850 700
Page 36 of 61 - Financial Management- IIJamnalal Bajaj Institute of Mgmt Studies
Cos
t %
Mgmt study material created/ compiled by - Commander RK Singh [email protected]
Cost of Equity Ke 12.14% 17.50%
Calculations
Valuation of company = NOI = 1000 = 10000 CoC 10%
Share Capital = (Value of Company - MV of Debt)
In Situation I = 10000 – 3000 = 7000
In Situation II = 10000 – 6000 = 4000
Cost of Equity = Earnings Available to Shareholder Share Capital
In Situation I = 850 = 12.14% 7000
In Situation II = 700 = 17.5% 4000
Graphical Representation of NOI ApproachKe
10 Ko
5Kd
0D/E
Interpretation of the Graph: -
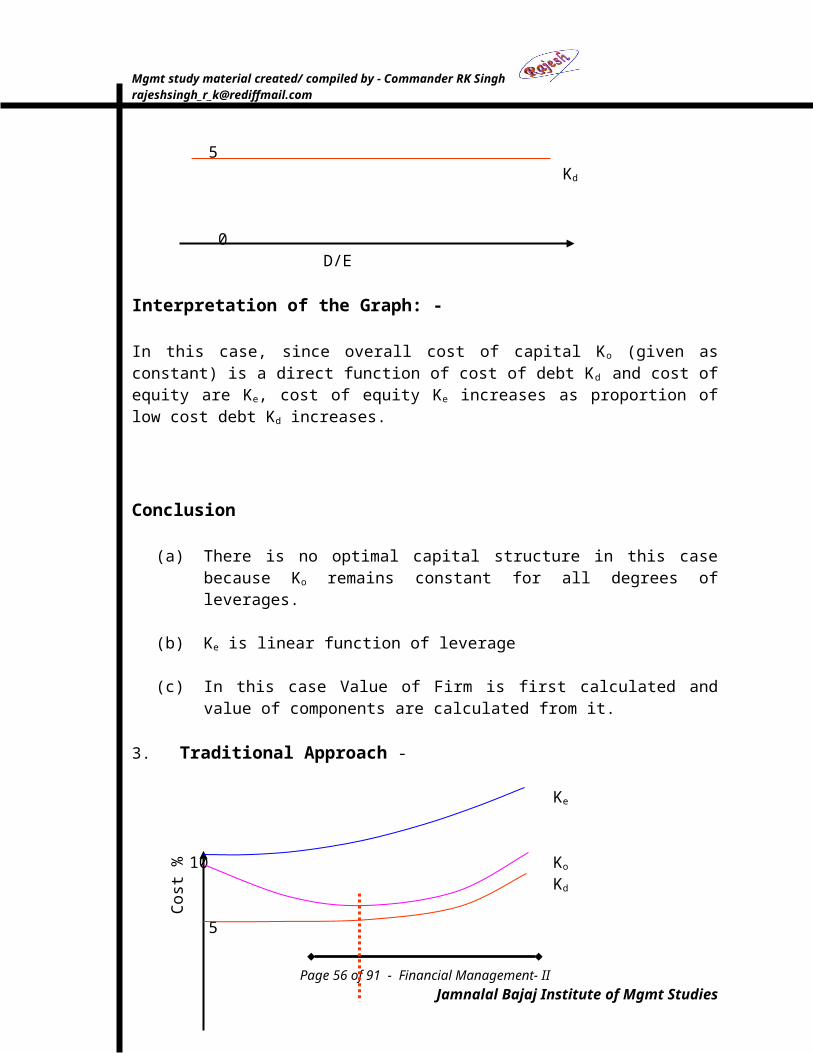
In this case, since overall cost of capital Ko (given as constant) is a direct function of cost of debt Kd and cost of equity are Ke, cost of equity Ke increases as proportion of low cost debt Kd increases.
Conclusion
Page 37 of 61 - Financial Management- IIJamnalal Bajaj Institute of Mgmt Studies
Cos
t %
Mgmt study material created/ compiled by - Commander RK Singh [email protected]
(a) There is no optimal capital structure in this case because Ko remains constant for all degrees of leverages.
(b) Ke is linear function of leverage
(c) In this case Value of Firm is first calculated and value of components are calculated from it.
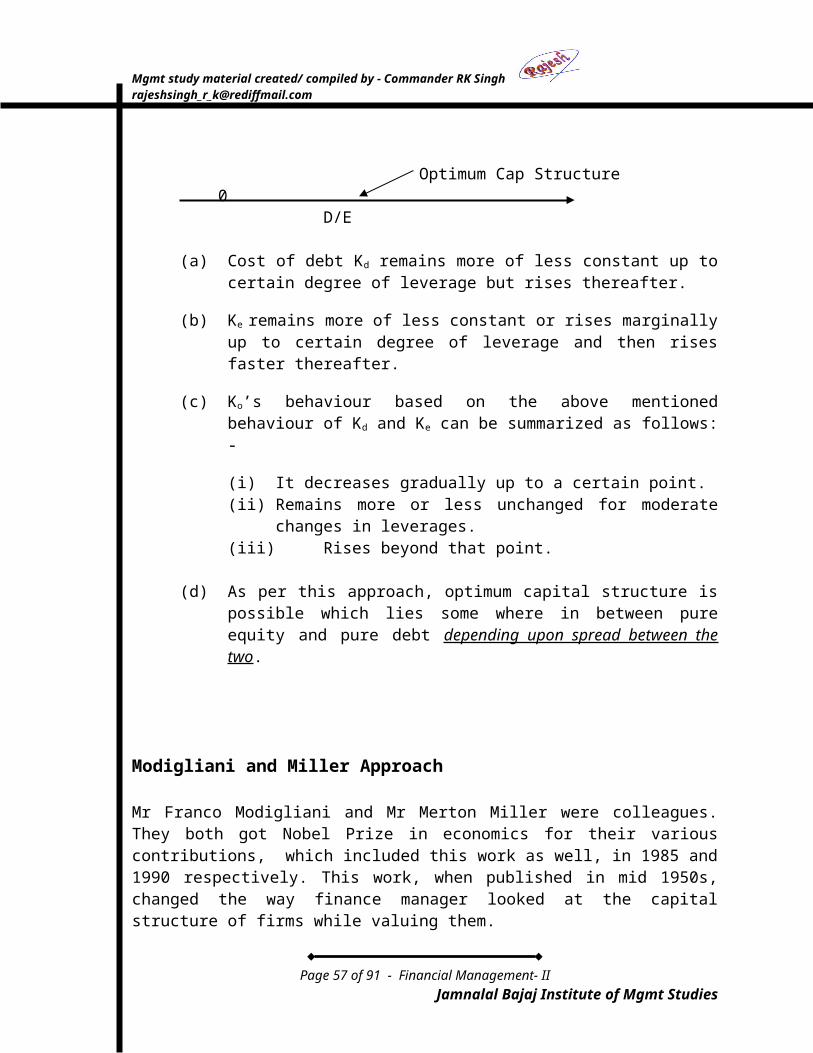
3. Traditional Approach -
Ke
10 Ko Kd
5
Optimum Cap Structure 0
D/E
(a) Cost of debt Kd remains more of less constant up to certain degree of leverage but rises thereafter.
(b) Ke remains more of less constant or rises marginally up to certain degree of leverage and then rises faster thereafter.
(c) Ko’s behaviour based on the above mentioned behaviour of Kd and Ke can be summarized as follows: -
(i) It decreases gradually up to a certain point.(ii) Remains more or less unchanged for moderate changes in leverages.(iii) Rises beyond that point.
(d) As per this approach, optimum capital structure is possible which lies some where in between pure equity and pure debt depending upon spread between the two.
Modigliani and Miller Approach
Page 38 of 61 - Financial Management- IIJamnalal Bajaj Institute of Mgmt Studies
Cos
t %
Mgmt study material created/ compiled by - Commander RK Singh [email protected]
Mr Franco Modigliani and Mr Merton Miller were colleagues. They both got Nobel Prize in economics for their various contributions, which included this work as well, in 1985 and 1990 respectively. This work, when published in mid 1950s, changed the way finance manager looked at the capital structure of firms while valuing them.Mr Modigliani and Miller showed that financing decisions (read capital structure of firms) do not matter in PERFECT MARKETS. Their “Proposition I” stated that a firm can not change its value merely by splitting its cash flow into different streams. The firm’s value is determined by its assets and not by securities it issues. Thus capital structure is irrelevant as far as value of the firm is concerned.
Please mind the word PERFECT MARKETS in capital bold italics and underlined. Because this proposition is true only in perfect market conditions. While capital markets are efficient, they are certainly not perfect. Else, we would not have seen regular scams and bubble formations and bursts. Remember Harshad Mehta bubble of 1992 and Dot Com bubble of 1999-2000??? So, while this theory gives a new insight into capital structure decisions, this is definitely not the final word on capital structuring decisions. The duo themselves came up with another theory a few years later which highlighted the deficiencies of this approach.
So, capital structuring decisions do pay reasonable returns due to market imperfections. We will discuss those imperfections later.
How is the Capital Structuring believed to be adding value to the firm?
Capital Structuring is believed to be adding value by reducing cost of capital and thus increasing returns for the shareholders.
MODIGLIANI AND MILLER APPROACH
MM1 or Capital Structure Irrelevance Theory. Modigliani and Miller recommended Net Operating Income Approach which states that
(a) Cost of capital is invariant to capital structure.(b) Even if a levered firm has higher value, it would be temporary smart
investor would see an arbitrage opportunity and encash it.
How does the Arbitrage theory work?
There are two firms. Company “A” is not leveraged at all and Company “B” has Rs 30000 debt at 5% interest. Net operating income for companies is Rs 10000 each. Cost of Equity of company “A” KeA = 10% and Company “B” KeB = 11%. Both firms are identical in all respects except capital structure.
Symbol “A” “B”
Page 39 of 61 - Financial Management- IIJamnalal Bajaj Institute of Mgmt Studies
Mgmt study material created/ compiled by - Commander RK Singh [email protected]
Net Operating Earning O 10000 10000Interest Cost F 0 1500Earnings available to S/Holders S 10000 8500Cost of Equity Ke 10% 11%Equity Capital E 100000 77272MV of Debt D 0 30000Total Value of Firm V 100000 107272Overall cost of Capital Ko 10% 9.3%D/S 0:1 0.4:1
Above calculations are as per Net Income Approach. In this case leveraged firm “B” has higher value than Firm “A” which is unleveraged.
Arbitrage Process
(a) Suppose a rational investor has 1% equity of company “B”. (b) He sells his shares of company “B” and gets - 77272 x 1% = Rs 772.27(c) Next, he borrows Rs 300 at 5% interest.(d) He buys 1% equity of Company “A” and pays Rs 1000.
Earning before this arbitrage process = 1% of Rs 8500 = Rs 85/-Earnings after the arbitrage process = 1% of Rs 10000 = Rs 100
Less – Interest paid on Rs 300 = Rs 15/-Net earning after arbitrage process = Rs 85/-
Despite earning the same amount as return on investment, he has Rs 72.27 left with him. Or he could have invested this money also in Company “A” and earned extra returns. Thus, investors will start selling shares of higher priced shares of company “B” and buy shares of company “A”. This selling and buying pressure on respective companies will lead to fall in share prices of company “B” and rise in prices of company “A” shares till they both become equal and arbitrage opportunity is extinguished.
This method is called MM1 or Capital Structure Irrelevance Theory.
In the above method, perfect market conditions have been assumed
Assumptions
(a) There are no transaction cost (Brokerage, Stamp Duty/Securities Transaction Tax, etc) involved in selling and buying of shares.
(b) There is no tax shield available on corporate borrowings
(c) Information regarding company’s capital structure is freely available.
(d) Large number of investors are buying and selling shares.
Page 40 of 61 - Financial Management- IIJamnalal Bajaj Institute of Mgmt Studies
Mgmt study material created/ compiled by - Commander RK Singh [email protected]
(e) Borrowing rates for corporates and investors is same.
Let us test if MM1 theory holds good even when above assumptions do not hold good.
Transaction Costs – Transaction costs are about 0.8% maximum on each transaction. Thus, for one transactions of selling and one transaction of buying, total transaction cost works out to Rs 14.18. Thus, even when transaction cost of Rs 14.18 is paid, there is still a surplus of Rs (72.27 – 14.18) = Rs 58.09 available to the investor.
Information availability – Information availability has only improved over time due to stringent rules of Stock Exchanges as well as internet revolution.
Large Number of Investors – Share culture has become more wide spread over the last few decades.
Borrowing rates are same for Corporates and Investors – This assumption is not far from reality. While there might be some deviations in interest rates for individual investors, big ticket investors like institutional investors, high net worth individuals, investment houses, etc can get their funds from same source as the company and also at the same rate.
This assumption is called Home Made Leverage. Since, the leverage of company “B” is being replicated by the investor, similar Debt to Self Finance ratio as the company B’s Debt to Equity ratio.
The only assumption left now is availability non availability of Tax Shield on borrowings. Tax shield is available on corporate borrowings in most of the countries.
MM2 Theory – Cost of equity increases when leverage increases.
Problem. ABC Ltd, an all equity firm has expected earning of Rs 10 Cr/Year in perpetuity. The firm has a 100% payout policy. So, Rs 10Cr can be considered as expected cash flow to shareholders.
Number of shares are 10 Cr. Cash flow per share is Re 1/-. Cost of capital is 10%.Firm will build a new plant for Rs 4 Cr. New plant will generate additional annual
cash flow of Rs 1 Cr. The new plant has the same risk class as the existing business.
Find, what happens to Ke whenI. Project is financed entirely by equity.II. Project is financed entirely through debt finance @ 6%.
Solution
I. When the project is completely financed by equity
Value of company = MV of equity + MV of debt
MV of equity = Cash Flow to shareholders
Page 41 of 61 - Financial Management- IIJamnalal Bajaj Institute of Mgmt Studies
Mgmt study material created/ compiled by - Commander RK Singh [email protected]
Cost of capital
It is a fully equity financed company and debt is NIL,
Value of company in this case = Cash Flow to shareholdersCost of capital
Since cost of Capital = 10%, and Cash flow to shareholder = 10 Cr
Value of company = 10 Cr = 100 Cr10%
Therefore Market Price of share = Value of Company = 100Cr = Rs 10/- Number of Shares 10 Cr
1. Balance Sheet of the company before announcement of the project
LiabilitiesEquity 100
. .Total 100
AssetsOld Assets 100
. .Total 100
2. Balance Sheet after project announcement
LiabilitiesEquity 106 Total 106
AssetsOld Assets 100NPV of new project (See Calculations) 6 Total 106
Market Price of Share now = 106/10 = Rs 10.60
Calculation of NPV – If you want to get a return of Rs 1 Cr per year from a fixed deposit in bank which offers you interest rate of 10%, how much money do you need to invest in fixed deposit? Answer is obvious – Rs 10 Cr. Any investment that offers a fixed amount at the end of every term till eternity is called Perpetuity.
Thus, PV of Perpetuity = Income required = (Refer page 37 of Principles of Corporate Interest rate Finance by Brealey and Myers)
In this case, new plant becomes a Perpetuity which will generate Rs 1 Cr for company every year.
Thus, PV of this plant (Perpetuity) – Project cash flow every year = 1 Cr = 10 Cr Cost of Capital 10%
Net Present Value (NPV) = PV – Investment = 10 Cr – 4 Cr = 6 Cr.
Page 42 of 61 - Financial Management- IIJamnalal Bajaj Institute of Mgmt Studies
Mgmt study material created/ compiled by - Commander RK Singh [email protected]
3. Balance Sheet after obtaining the finance through fresh equity
Fresh equity issued at Rs 10.60 per share for Rs 4 Cr.
Number of additional shares issued = 4,00,00,000/10.60 = 37,73,585 shares
LiabilitiesEquity 110
Total 110
AssetsOld Assets 100NPV of new project 6Cash 4 Total 110
Market Price of Shares = 10.60
4. Balance Sheet post implementation of project
LiabilitiesEquity 110 Total 110
AssetsOld Assets 100New Assets 10 Total 110
Note – Even though the cost of new project is only Rs 4 Cr, Present value of the project is Rs 10 Cr and therefore it will be valued as such and not at cost price.
Market Price of Share = 1,10,00,00,000 /10,37,73,585 = Rs 10.60
II. When the project is completely financed by through debt.
First two balance sheets will remain same since there is no finance option involved in them.
3. Balance Sheet after obtaining the finance through debt
LiabilitiesEquity 106Debt 4 Total 110
AssetsOld Assets 100NPV of new project 6Cash 4 Total 110
4. Balance Sheet post implementation of the project
LiabilitiesEquity 106Debt 4 Total 110
AssetsOld Assets 100New Assets 10 Total 110
Cost of Equity Ke = Cash available for equity holdersNumber of Shares
Page 43 of 61 - Financial Management- IIJamnalal Bajaj Institute of Mgmt Studies
Mgmt study material created/ compiled by - Commander RK Singh [email protected]
Cash available for equity holders = Rs 10 Cr + Rs 1 Cr – Rs 24 lakhs (interest @ 6% on Rs 4 Cr) = Rs 10.76 Cr
Cost of Equity Ke = 10.76/106 = 10.15%Cost of equity can also be calculated by
Ke = Ko + D (Ko + Kd) (This equation valid when we are dealing with market values.) S
Thus, we see that cost of equity increases as the leverage increases.
Modigliani and Miller later presented another paper where in they considered the effect of tax shield on leveraged companies.
Problem
Companies “A” and “B” are identical in all respects except that Company “A” is not leveraged while company “B” has a debt of Rs 8000 at 5% interest. Both have Net Operating Income of Rs 2000 each. Corporate tax is at 50%. Overall capitalization rate for both companies is 8%.
Solution
“A” “B”NOI 2000 2000Less Tax @ 50% 1000 1000Profit after Tax but before Interest 1000 1000Capitalisation Rate 8% 8%Capitalised Value 12500 12500Interest on debt 0 400Tax saving due to interest on debt 0 200Capitalised value of tax saving @ cost of debt ** 0 4000Value of firm 12500 16500**Capitalised value of tax saving – It is a contentious topic to find as to which cost is to be taken to capitalize the value of tax saving, whether at the cost of debt or the capitalization rate of company. If company’s capitalization rate is taken, even though capitalized value would be less than otherwise, it will remain in positive nevertheless.
Value of leveraged firm = Value of Unleveraged firm + Value of tax saving
= EBIT (1-Tc) + (D Tc Kd)Ko Kd
= EBIT (1-Tc) + D Tc
Ko
Page 44 of 61 - Financial Management- IIJamnalal Bajaj Institute of Mgmt Studies
Mgmt study material created/ compiled by - Commander RK Singh [email protected]
Thus, we see that tax shield does offer value to company which is leveraged. As per this approach, there is an optimum capital structure which is farthest away from the origin, ie Zero debt structure.
American firms financing was historically heavily equity oriented. They were thus missing the opportunity to increase value of the firm by debt financing.
In 1978, a new thought was introduced which took personal taxation also into consideration while calculating value of the firm.
Let Tpe = Personal Tax on equity earnings And Tpi = Personal Tax on interest income
Equity earning could be through dividend, or capital gains. Capital Gains could be further divided into short term and long term gains.
Problem
ABC Ltd has an expected EBIT of Rs 1 Cr per year. Corporate tax is 35%. Entire PAT is distributed as dividend. Tpe = 20% and Tpi = 33%.The company is considering two alternative capital structures. Under plan one, there will be no debt and under plan two there will be debt of Rs 4 Cr at 10% interest.
In this case 2nd option is better as there is more cash flow to investors.
At investor level - I II
Dividend 0.65 0.39Less Tpe (0.13) (0.078)
Cash Flow post personal tax 0.52 0.312Interest - 0.4
Less Tpi - (0.132)Net Interest Income - 0.268Total Cash Flow to investor 0.52 0.58 (0.312 +0.268)
Page 45 of 61 - Financial Management- IIJamnalal Bajaj Institute of Mgmt Studies
Mgmt study material created/ compiled by - Commander RK Singh [email protected]
It is seen in this case that even though the relative advantage of tax shield has come down, it is still there in some measure.
Page 46 of 61 - Financial Management- IIJamnalal Bajaj Institute of Mgmt Studies
Mgmt study material created/ compiled by - Commander RK Singh [email protected]
Date: 18 Mar 2006
Question – Is is true that if a company has not paid any dividend in the past, it willnot have any value as per Dividend Discount Model.
Ans. False. Because Dividend Discount Model is based on future dividends and not past dividends. Therefore, even if a company has not paid any dividend in past, it does not matter in valuation of company by Dividend Discount Model.
Question – Comment on “In calculating risk free rate you can take yield on any Govt Bond”.
Ans. False. Since the time duration of borrowing in case of capital budgeting is long, you need to take the current interest rate of 10 Year Treasury Bond as the risk free rate of return.
Section 72A (Income Tax Act)
When a profit making company “A” acquires a loss making company “T”, then the accumulated losses and unabsorbed depreciation of company “T” can be set off against the profits of company “A”, beginning with the year of acquisition. Thus, the tax levy on company “A” is reduced.
This is what is the essence of Section 72A of the Income Tax Act. However, benefits under this provision were not applicable through automatic route and had arbitrary conditions to be fulfilled till about year 2000 when the provision were changed to make them more transparent and realistic.
Tax saving by Business is Revenue loss of Govt. So, this section causes revenue loss to the Govt. Govt has granted this tax shield as an incentive to successful industrialists so that sick companies can be revived though involvement of better management. Certain conditions have been imposed to ensure that only companies which meet the above social objective are given the tax break.
Under the old provisions of Section 72A, in order to avail the benefits, acquiring company was required to make a written application which was scrutinized by a “Competent Committee” of bureaucrats and decided on ?case to case basis. Provisions were changed in the year 2000 which are in force now. Let us first see what were the provisions of old Section 72.
Benefit was available only if company “A” took prior permission from the competent authority. Competent authority would accord approval subject to fulfillment of following conditions:
(a) Company “T” was not financially viable. (No guide lines were available to determine the financial viability of loss making company. So, it was arbitrary decision).
Page 47 of 61 - Financial Management- IIJamnalal Bajaj Institute of Mgmt Studies
Mgmt study material created/ compiled by - Commander RK Singh [email protected]
(b) Merger was in public interest. (Again, public interest was not defined and therefore, decisions were arbitrary).
(c) Any other conditions. (Outrightly arbitrary clause but necessitated by most fertile Indian brain, adept at finding way to beat regulations, however elaborately and craftily worded. It is a standard feature in most of the Govt/IT Act clauses where conditions are laid down granting some relief or concession. In IT Act parlance, it is called inclusive definition).
Company “A” was to submit revival plan together with source of finance for revival activities.
After examining above information, permission was granted for ONE year. In case entire accumulated losses of the acquired company could not be offset against profits of company “A” in one year, entire exercise had to be repeated in each of the subsequent years.
But the situation changed in year 2000. All the above draconian and arbitrary conditions with withdrawn and companies were allowed to merge and absorb the losses of acquired company into profit making company. However, post merger following conditions had to be complied with.
(a) Company “A” should continue with business of company “T”. (Company “A” is deemed to be continuing the business of company “T” if it is utilizing at least 50% of the established capacity at the time of acquisition).
(b) Three fourth of assets of company “T” should remain with company “A” at the end of 5 years. (Purpose of this clause was to deny tax benefit to those companies which did acquisitions to take benefits of under valued assets of company, like real estate. However, this purpose was not fully met book value of real estate is at historical value of purchase and generally gets appreciated many times over in course of time. Machinery and other assets are more current in nature and therefore are closer to market price. Thus it possible to sell most of the real estate and yet retain 75% of the assets).
(c) Any other condition.
Close examination of condition (b) reveals that this section is meant for manufacturing companies (Software development companies included) and not for service companies. IT Act clearly lists all industries which can claim benefits under this section.
In case of failure to follow any of the above conditions in the years subsequent to merger, tax benefits availed by the acquiring company would be reversed by reassessing the Income for the relevant year.
Reverse Merger
Though this term is used in business, it is not clearly defined as yet. It is not demerger as many would tend to get misled by word Reverse. It is still a merger between two companies. But in the normal wisdom, it is profit making company which acquires a loss
Page 48 of 61 - Financial Management- IIJamnalal Bajaj Institute of Mgmt Studies
Mgmt study material created/ compiled by - Commander RK Singh [email protected]
making company and merges with it. In case of Reverse Mergers, this conventional wisdom gets turned on its head. It is the loss making company which acquires the profit making company. The purpose of this merger also is same as the old regular mergers – To get the tax benefits. Losses of acquiring company get off-set against the profits of acquired company and the tax liability comes down.
Many different kinds of mergers at different times have been called as Reverse Merger. There are at least three definitions of Reverse Merger which can be put forth as of now:
1. Most popular definition - If a profit making company merges into a loss making company, then it is called a reverse merger. Since merger is about only one company retaining its legal identity and other/s losing its/their legal identity, it is loss making company which retains the identity and profit making company loses it.
Examples –
(a) Kirloskar Pneumatics Ltd (Face Value Rs 10 and Market Value Rs 50) merged into Kirloskar Tractor Ltd (Face Value Rs 10 and Market Value Rs 2).
(b) Asian Cables Ltd merged into Wiltech Ltd.(c) Atul Products Ltd merged into Gujrat Aromatics(d) Godrej Soaps Ltd merged into Gujrat Godrej Innovative Chemicals Ltd.
If you keenly observe the above examples, it would be evident that in each of the case, the acquiring and the acquired company belonged to same group of companies. No prizes for guessing relation between companies in Sl (a). Asian Cables and Wiltech are both owned by RPG group. Atul Products was Co-promoter of Gujrat Aromatics Ltd. And, Godrej Soaps was co-promoter of Gujrat Godrej Innovative Chemicals Ltd along with GIIC. Actually, there is no example of two completely independent companies going for reverse merger.
Question arises as why this trend of only sister companies going for reverse merger. The answer lies in difficulties in getting the shareholders’ approval for merger. Any merger requires shareholders’ approval. And it would be quite tough to convince the shareholders of profit making company to approve merger with a loss making company.
In all the above cases, post merger, when legal existence of profit making company was extinguished, loss making company changed its name to the name of profit making company. The benefits of brand equity of profit making company were still available for exploitation. Thus, through this small jugglery of name change, benefits of Section 72 were availed through Reverse Merger route.
Let us now examine the Godrej Merger in greater detail and procedure adopted for it.
Joint/Comparative Balance Sheet of two Companies before Reverse Merger:
Page 49 of 61 - Financial Management- IIJamnalal Bajaj Institute of Mgmt Studies
Mgmt study material created/ compiled by - Commander RK Singh [email protected]
(Figures in million rupees)Liabilities Assets
Godrej Soaps
GGICL Godrej Soaps
GGICL
Share Capital 340 700 Total Assets 2070 250R&S 1730 -- Losses -- 950Other Liabilities -- 500Total 2070 1200 Total 2070 1200
Both companies approached High Court for two purposes:
(a) Permission for share capital reduction of loss making company(b) Merger of profit making Co with loss making company.
Both the prayers were to be read in conjunction. That means approval or rejection of both prayers was to be together. If one prayer was rejected then the other was to be rejected automatically.
Proposal was - Rs 10 Face Value share of GGICL was to be reduced to Re 1 share and then 10 shares of Re 1 each were to be merged to form one share of Rs 10. (In those days all shares had to have face value of Rs 10 or 100 only). This in effect reduced the share capital to 1/10, from Rs 700 million (Rs 70 Cr to Rs 7 Cr only).
Balance Sheets as per proposed reduction in capital looked as follows:
Liabilities AssetsGodrej Soaps
GGICL GGICL Godrej Soaps
GGICL GGICL
Share Capital 340 700 70 Total Assets 2070 250 250R&S 1730 -- -- Losses -- 950 320Other Liabilities -- 500 500Total 2070 1200 570 Total 2070 1200 570
What we see in the above Balance Sheet is that Rs 630 Cr of accumulated losses have been set off against Rs 630 Cr of the share capital of the company. Thus, unabsorbed losses post reduction in capital of company stands at Rs 320 Cr.
The companies went for pooling option of merger rather than Purchase option. No let us see how does the merged balance sheet looks like:
(Balance accumulated losses of Rs 320 million were set off against Reserves and Surplus of Combined Balance Sheet. Other figures were simply added.
Page 50 of 61 - Financial Management- IIJamnalal Bajaj Institute of Mgmt Studies
Mgmt study material created/ compiled by - Commander RK Singh [email protected]
As we see in this case, the accumulated losses in balance sheet fell by Rs 630 million due to reduction in share capital. So, the question is
Find the Answer.Exam Question
(i) Was there an opportunity loss of availing tax benefits by adjusting accumulated losses against profits of merged company due to reduction of share capital?
(ii) If yes, then where was the need to go for capital reduction?
2. Reverse Merger is also the case when a parent company merges into a daughter company. Eg. ICICI Ltd merger into ICICI Bank Ltd.
3. When an active but unlisted company merges into a publicly listed shell company. (A shell company is one which has no business. It exists only on paper). Purpose of such merger or Reverse Merger is to get listing benefits without going through IPO route.
Advantage – Strict Disclosure norms to be followed in case of IPO process are not required. This system is very popular in US.
Take Over/Acquisition
Theoretically, in order to control a company, minimum 51% or 76%, if so provided in MOA, of shares are required. However, in practice, companies are controlled with far less share holding. In most of the big Indian companies, a large number of shares are held by Financial Institutions or general public who are sleeping members. Thus, take over process is not as vigorous in India in lot many cases as it ought to be.
RPG (RP Goenka) group has used Take Over as a means for growth. In the past it has taken over companies like Culcutta Electric Supply Co., Harrison Malyalam (Tea Co.) erstwhile HMV (now RPG), ICIM.
Similarly Manu Chhabaria has used it as a entry strategy into the country. Shaw Wallace, General Electric and Dunlop were the companies that he took over.
Role of Financial Institutions in Take Over – How would the financial Institutions react in case of a take over bid, regular or hostile.
No major take over would succeed in India unless supported by Financial Institutions because they are generally the largest holders of equity in Indian companies. Past experience of behaviour of Financial Institutions gives no indication regarding their behaviour. There were instances where they opposed take over a loss making company and then there were cases where they supported take over a profit making company. They had opposed take over of Larsen & Toubro by Reliance. They had also opposed take over of DCM by Escorts. So, their response has been erratic.
Page 51 of 61 - Financial Management- IIJamnalal Bajaj Institute of Mgmt Studies
Mgmt study material created/ compiled by - Commander RK Singh [email protected]
In many cases their response of dictated by the kind of their exposure in the company. There are some FIs who have larger exposure in loans and in other cases equity exposure is high.
How did FIs get such large holdings in the Indian companies.
FIs got to own such large shares in the companies through three routes
(a) By convertibility clause in the loan – Earlier, the loan extended by FIs use to have a convertibility clause by which part of the loan got converted into equity share at pre-decided rate at specified time. This is the biggest chunk of shares owned by them.
(b) By Underwriting – During the IPOs in the olden days, FIs also use to act as underwriters to the issue. So, they acquired the unsubscribed portion of shares as underwriters.
(c) By Financial Investments – Many FIs make invest their spare cash in secondary and even primary market as part of treasury operation.
Malhotra Committee Report on entry of Foreign Insurance Cos. in India recommended that no insurance company should be allowed to hold more than 5% stake in any single company. This recommendation was not accepted since sale of large quantities of shares by existing Insurance Companies like LIC would have opened doors for take over. This bares the fact that in the field of acquisitions and takeovers, we need to be alive to various developments in periphery also. Another such peripheral development which jolted the Indian industry in 1990s is explained below.
In the earlier days, lottery system was used as basis for allotment of shares in case of oversubscription of IPO. That led to people applying in name of all the relatives to improve the chances of allotment causing extra burden due to large number of applications and other malpractices. Some time in early 1990s, proportionate allotment system was introduced, while retaining the lottery system in the interim, leaving the final choice between the two system on the company offering the shares. Nirma and Lupin were the two companies which opted for proportionate system in their IPO.
In the applications which were received, two corporates made applications for huge quantities. In case of Nirma, it was Hindustan Lever and in case of Lupin, it was Reliance. It was an attempted take over through the back door of IPO.
IPO management teams of both Nirma and Lupin rejected the applications of HLL and RIL on very flimsy ground which would not have stood the test of judicial scrutiny. For inter-corporate equity investments, approval of shareholders authorising the Board of Directors is necessary. Both the companies had attached general resolution approved by shareholders empowering the Board of Directors for investing in any company. Despite so, the
Page 52 of 61 - Financial Management- IIJamnalal Bajaj Institute of Mgmt Studies
Mgmt study material created/ compiled by - Commander RK Singh [email protected]
applications were rejected on the ground that the approvals were not specific to the particular companies.
Despite unambiguous tilt of judicial scale in their favour, both companies chose not to contest the disqualification of their applications because they fully knew that what they were doing may have been legal by law but was unethical nonetheless. They did not want to soil their reputation in the market.
This episode revealed the major flaw in the system and subsequently, various caps were put on investment to ensure that no such back door take over is attempted in future.
Next Lecture – Regulatory Framework regarding take over/acquisitions. Read Clause 40, 40A and 40B of listing agreement.
Page 53 of 61 - Financial Management- IIJamnalal Bajaj Institute of Mgmt Studies
Mgmt study material created/ compiled by - Commander RK Singh [email protected]
Date: 25 Mar 06
REGULATORY FRAMEWORK OF M & A
Why is Regulatory Framework required?
Regulatory framework is required to safeguard the interest of minority shareholders. To ensure that minority shareholders are not exploited by the majority group through Mergers and Acquisitions.
Who is a minority shareholders?
It is such a travesty of the Indian system that the majority shareholders become the minority. While theoretically 51% shares are required to control a company, in effect, much smaller ownership is often sufficient to control the company. Most shares are distributed among small investors who are not united and do not attend the AGMs and EGMs. Thus, often largest individual shareholder or small group of large shareholders take control of the company. Such shareholders are called the Controlling Group. Shareholders who are not part of the controlling group, though in majority, are termed as minority shareholders.
History of Regulatory Framework in India
Till 1990, there was no law specifically dealing with the mergers and acquisitions. Clause 40 of the Listing Agreement was only regulation governing the M&A and it was grossly flawed.
Clause 40 of the Listing Agreement: If a company acquires 25% of the shares of another company, then it should:
(a) Make a public offer to acquire additional 20% of the equity at the price paid for the shares of the outgoing management.
(b) After public offer there should be at least 20% of the equity shares left in the market for the company to remain listed.
Above regulations were drafted to ensure that management does not act in concert with the acquirer to extract a good price for their shares while leaving the un-informed small shareholders in lurch. However, later events proved the inadequacy of the regulations to curb the misuse.
Inadequacies in Clause 40: 1. High Threshold - Threshold of 25% shares acquisition for public offer was too
high to curb the malpractice since control of company was almost always possible with much less holding of the shares.
Page 54 of 61 - Financial Management- IIJamnalal Bajaj Institute of Mgmt Studies
Mgmt study material created/ compiled by - Commander RK Singh [email protected]
2. Price Manipulation - There was no mechanism to check that deal price of the shares of controlling group is not being understated. The difference between actual price and the declared (Understated) price could always be paid by black money or some other ingenious way as was done in case of acquisition of GEC by Manu Chhabria group.Manu Chhabria Vs GEC. Manu Chhabria acquired GEC shares from the promoters at much below market price. Then, in accordance with the law, he made public offer to acquire shares at same price. Obviously, no one sold his shares to Manu Chhabria at less than market price. No shares were acquired from public. After the offer period was over, a personal property of the GEC promoter was purchased by Manu Chhabria at highly inflated price. Thus, the rate demanded by GEC promoter for his shares was paid partly as share price and partly through inflated price of land. This way, Mr Manu Chhabria escaped the requirement of procuring additional 20% shares.
3. Minimum Market Float (20% shares) – Inadequacy of this law surfaced when RPG group acquired Spencer. Controlling Group of Spencer held 67% shares and public holding was merely 33%. Controlling group sold all its holding of 67% shares. Now acquiring company was in dilemma as to how it could acquire 20% shares from the remaining 33% float in the market. Therefore, they decided that only 13% shares be acquired from the public. However, Madras Stock Exchange decided that 20% float and 20% acquisition from public were both mandatory. Thus, RPG could acquire only 60% shares from the Spencer promoters.
In May 1990, Clause 40A and 40B were introduced to overcome above limitations. Salient features of these new clauses were as follows:
1. Mandatory Disclosure Limit - A new threshold limit was introduced. Any company acquiring 5% shares of another company was to inform Stock Exchange of its acquisition. It was only for information purpose and no reasons for acquisition were required to be furnished. However, it served as a notice to the people that some one is taking interest in the company.
2. Public Offer - In case a company’s equity holding in the other company exceeded 10%, it had to make the public offer.
3. Public Offer Pricing - Public offer was to be at the price negotiated for their shares by outgoing controlling group or the market price, whichever was higher.
Limitations of Clause 40A and 40B.
1. Limited Applicability - Since this code was based on Listing Agreement, it applied only if the acquirer was a listed company. It was not applicable to unlisted companies, partnership firms and individuals.
2. No Safeguard Against Cartelization - There was no safeguard against cartelization. If 3 or 4 listed companies acted in concert and acquired requisite number of shares in a manner that no one’s holding reached 5% limit, the purpose of section was defeated.
Page 55 of 61 - Financial Management- IIJamnalal Bajaj Institute of Mgmt Studies
Mgmt study material created/ compiled by - Commander RK Singh [email protected]
3. Poor Enforceability - Enforceability was very poor. Maximum punishment was common to all violations of listing agreement, namely Delisting of shares. Imposition of punishment would hurt the interest of small shareholders more than the acquirers.
In 1994, Justice Bhagwati Committee was appointed by SEBI to draft a Comprehensive Take Over Code. This code was adopted in 1997. (This draft was largely based on United Kingdom’s “The City Code on Mergers and Acquisitions”. This is the most comprehensive take over code any where in the world, but its compliance is voluntary. And in India, voluntary rules rarely, if ever, work) . Salient Features of this code were as follows:
1. Mandatory Disclosure – Disclosure threshold was retained at 5%. Disclosure was to be made to SEBI by the concerned person (not only the listed companies but every one was covered by it) within two days of acquisition.
2. Continual Disclosures – If a person holds more than 10% shares or voting right in a company, he has to disclose his holding within 21 days from the financial year ending on 31 march. (Note: This limit was revised to 15% in Oct. 98)
3. Consolidation of Holdings/Creeping Acquisition – If a person holds more than 10% but less than 51% shares or voting right in a company and wants to acquire more than 2% in a financial year, he can do so only through public offer.
4. Minimum Price – Minimum price to be offered to shareholders will be average of highest and lowest in the preceding 26 weeks.
5. Persons Acting in Concert – A clause was inserted regarding “Persons Acting in Concert”. There have not been any cases of persons acting in concert thereafter.
6. Hostile Takeover – Hostile Takeover, which was not possible earlier, became possible now to the benefit of shareholders. (The biggest beneficiaries in case of hostile takeover are the shareholders).
Transfer of Shares
Transfer of shares is hardly an issue in the normal course of things. However, in case of mergers and acquisitions, it assumed significant importance. This was one of the tool used by target companies’ managements to ward off any hostile takeover bids. Following are the important provisions regulating transfer of shares:
(a) Companies Act, Sections 111 and 111(A).
(b) Sections 22A of Securities (Contract) Regulatory Act.
(c) Depositories
(d) FIPB regulations, if acquiring company is MNC.
Page 56 of 61 - Financial Management- IIJamnalal Bajaj Institute of Mgmt Studies
Mgmt study material created/ compiled by - Commander RK Singh [email protected]
Suppose Company ‘A’ acquired shares of Company ‘T’ from the public. Shares were then required to be sent to the Company ‘T’s Head Office for their transfer to acquirer’s name. Under the old code, management of company ‘A’ could refuse to transfer the shares in the name of new shareholder without giving any reason for its refusal. It was assumed that refusal was in the company’s and shareholders’ interest. The onus of proving that the denial/refusal was malafide was on the acquirer. Sections 22A of Securities (Contract) Regulatory Act – As per this section transfer of shares can be refused only under following four reasons:
(a) Defective Instrument - If instrument of transfer is defective, like signature of transferor not matching/absent, necessary stamps not affixed, etc. (No controversies about this provision).
(b) Prohibition by Court - If transfer is prohibited by any court order. Like Harshad Mehta’s holdings were attached by court. (Again, no controversies).
(c) Contravention of Law - The transfer is in contravention of any law, rules, administrative instructions or conditions of listing agreement;
(d) Prejudicial to Interest of the Company - The transfer is likely to result in change in the composition of the Board of Directors, which would be prejudicial to the interest of the company or public.
Provisions at serial (c) and (d) above left lot of scope for manipulation by the Target company’s management. It was left to Target company’s management to decide if the transfer of shares is in contravention of any law or, if it will be detrimental to the interest of company or public. Thus, there was scope for arbitrariness and manipulation by interest parties.
Depository Ordinance – Depository Ordinance was passed in 1996. Securities (Contract) Regulatory Act was deleted via this ordinance. Once the depository system was introduced, the Target Company comes to know of the transfer after it is completed. But it does not mean that pendulum of justice which was resting on Target company’s side earlier had now swung in exactly opposite direction.
Section 111A in Companies Act provides for relief. This clause is about rectification of register on transfer. The section declares that the shares and debentures are freely transferable. In case of any refusal or delay in transfer exceeding two months, CLB has been given power to examine the issue and pass necessary directives to the Management of Target company. Similarly, in case the transfer is in contravention of Sick Industrial Companies Act 1985 or SEBI regulations, company can approach CLB for reversal of transfer within 2 months of receiving information about transfer.
With introduction of Section 111A of Companies Act in Nov 1996, the economic rights and voting rights of the shareholders were separated. As per this section, even if the transfer was in contravention of any regulations, CLB can suspend only the voting rights. It can not suspend economic rights viz, right to receive dividend, bonus, Rights issue, etc. This issue of separation of two rights had assumed significance in the light of Swaraj Paul
Page 57 of 61 - Financial Management- IIJamnalal Bajaj Institute of Mgmt Studies
Mgmt study material created/ compiled by - Commander RK Singh [email protected]
Vs DCM and Escorts case. In 1981-82, a prominent NRI, Mr Swaraj Paul made a hostile take over bid on DCM and Escorts. He purchased shares from the market and sent for transfer. However, both the companies refused to transfer the shares under the pretext that he had violated FERA. In the pendency of the case for transfer, which lasted a few years, acquirer did not get any dividend or any other economic benefits from his investment.
FIPB if acquiring company is MNC – Case Law
In 1997, had purchased one of the four promoters' (Atul Choskey) 9.1 per cent stake in Asian Paints @ RS 378 per share for Rs. 128.70 crores through a deal brokered by Kotak Mahindra Capital Company. Shares were in physical form and therefore had to be sent to Asian Paints for transfer. The other promoters of Asian Paints — The Dani, Choksi and Vakil families — had refused to allow the transfer of shares and instead offer to buy back Atul Choksey's stake in ICI.
The technical point that they exploited was – The guidelines to FIPB states that if an MNC is bringing in money, then it should intimate the Board of Directors and then approach FIPB. Board of Directors insisted that ICI Plc should first get the approval of the FIPB. However, The Foreign Investment Promotion Board had refused to consider the application of the British company, saying that the deal could not be considered without a supporting board resolution from Asian Paints.
Eventually, Kotak Mahindra had to sell the shares at Rs 280 per share thereby ICI Plc incurring a loss of Over Rs 25 Crores.
Question – Should MNCs be allowed to take over Indian Companies? (It is a value based question and has no right or wrong answer).
Page 58 of 61 - Financial Management- IIJamnalal Bajaj Institute of Mgmt Studies
Mgmt study material created/ compiled by - Commander RK Singh [email protected]
Leveraged Buy Out (LBO)
Leveraged Buy Out is acquisition of a company financed primarily through debt.
It started with Management Buy Out which is when the Management of the company itself decides to buy out the company. Since the management did not have enough cash to buy out the company, they resorted to financing the purchase through debt. MBO has since died down and its later avatar was Leveraged Buy Out has taken over.
LBO is also called HLT (Highly Leveraged Transaction) and Bootstrap Transaction.
As against the MBO, LBO is done by a professional acquirer who finances the purchase almost entirely through debt and later sells it off.
The largest LBO in the history was acquisition of Nabisco by a partnership firm KKR in US for US$ 25 billion in 1988. The acquisition was financed by US$ 20 bn through debt, 5 bn from non debt sources. Acquirer’s own contribution was merely 0.06%.
Nabisco was a food and beverages company with main brand being CAMEL cigarettes which was second largest selling brand in US.
Pre-requisites of a Target Company selected for LBO.
1. High potential for further improvement. (The aim of the acquirer is to sell it off later at profit. So, to enhance value, improvement is necessary)
2. Large and stable cash flows.(Since company will have to service huge amount of interest and principal repayment after buyout, large and stable cash flows are must).
3. Tangible Asset Base. (Tangible asset base is required for more than one reason. Firstly, they are used as securities to raise the high proportion of loan. Secondly, some assets are sold to generate cash to meet the short term requirement of cash to meet loan and interest obligations).
Going by the above pre-requisites, an IT industry is a very poor candidate for leveraged buyout since it has few tangible assets.
Cement companies though have large asset base and large and stable cash flows, have little scope for improvement. Thus, they are again poor candidate in general.
Steps in LBO
1. Acquirer identifies the company and then buys small quantum of shares from the market.
2. Appoints advisors like bankers, etc and creates an SPV (Special Purpose Vehicle).a. SPV becomes the acquirer and makes an offer for buying all the shares.
Page 59 of 61 - Financial Management- IIJamnalal Bajaj Institute of Mgmt Studies
Mgmt study material created/ compiled by - Commander RK Singh [email protected]
b. Works on financing of acquisition through various instruments. SPV will have to look for instruments of various types and maturities since debt is very large. One of the major financing instruments is Junk Bonds (These are bonds of companies which are below investment grade in rating. These bonds carry high interest rate to cater for the high risk). Other options are Financial Institutions, Banks and Hedge Funds. Off late Mutual Funds have been launching special funds for financing LBOs.
3. SPV balance sheet will have large debt on liability side and shares of Target company on asset side.
4. SPV is then merged with target company and the balance sheet are merged. While all the other shares were bought by SPV, acquirer had not sold his shares to SPV. Thus, the acquirer becomes the owner of the company. Company is then delisted and becomes a closely held private company which is heavily levered.
Post LBO.
1. Ensure good cash flow and save any leakages of cash.2. Sell assets strategically, specially luxury kind like fleet of Mercedes, Jet planes,
Holiday homes, etc, to generate cash flow to meet immediate needs.3. Sell non core businesses.4. Cut R&D to save money (Since the focus is short term. Acquirer has a 5-6 years focus). 5. Retrench employees to cut expenses.6. Drive hard negotiations with vendors to extract maximum margins.7. If acquirers were successful, company would emerge as a lean and focused
company and fetch good price in the market.
Gainers1. Shareholders of the Target company (due to share price appreciation)2. Financial Institutions though at the cost of high risk.3. Advisors, like bankers, etc. (In case of Nabisco, advisors were paid to the tune of US$ 1.2
billions. KKR was itself one of the advisors).
Losers1. Old Creditors (Due to abnormal increase of leverage (debt) on the company, their debt to the
company will become extremely high risk. The returns on the debt are not commensurate with the risk associated with it and therefore its market value will be discounted accordingly).
2. Employees (While a large number will be retrenched, other might see cut in the salaries or increased work load without commensurate compensation).
3. Government (Due to high leverage, the tax liability of the company will company will reduce at the cost of govt tax collection).
Q – How else does the government stand to lose out?
Case Study of Nabisco LBO:
Nabisco management wanted to make the company private and therefore offered to buy back the shares at US$ 55 which was the prevailing market price. KKR stepped in and
Page 60 of 61 - Financial Management- IIJamnalal Bajaj Institute of Mgmt Studies
Mgmt study material created/ compiled by - Commander RK Singh [email protected]
offered to buy the shares at $90. Eventually, independent directors of the company called for the sealed bids. Management offered $ 109 in cash and securities and KKR offered $ 108 also in cash and securities. However, KKR’s offer had higher component of cash and therefore, Independent Directors favoured the KKR offer though numerically lower.
Nabisco had 10 jets for use by the management which were the first target of sell off. Next in line was Canadian food business.However, in 1993, some thing unthinkable happened. Market leader in Cigarettes Marlboro reduced the price of cigarettes by 23%.. It is called black day in Marketing History. Market leaders never compete on price. Here was a market leader which went for such deep cut in prices. Nabisco had to follow the suite
Such deep cut in prices had debilitating effect on core business of Camel brand of cigarettes of Nabisco. While debt servicing for Marlboro was merely 3% of sales, it was 9% in case of Nabisco. Eventually, KKR sold off Nabisco for approximately same price in 1995. This particular LBO was termed as failure.
In India Tata acquisition of Tetly (the leading tea brand in UK) is an example of LBO even though it was not as heavily levered as in West.
Positive Developments in Indian Financial Market for LBO:
1. Interest rates in the past decade have come down drastically even though they are still substantially higher than US and Europe. (High cost of debt is one of the major causes why LBO did not happen in India till 1990s). Against govt regulated interest rate regime, it is now largely market driven. (RBI and Govt still dictate the interest through various monetary and fiscal policies).
2. Improved liquidity. (Improved economy, reduced CRR and SLR, FDI, FII investments, GDR, etc, have improved the liquidity in the market).
3. SEBI allows the companies to go private by 100% buy back of shares. (It is important to go private in case of LBO as the restructuring of company at the required pace would face hurdles from disclosure norms, shareholders’ approval, independent directors, etc).
Bottlenecks in LBO
Process of restructuring is very slow and time is the essence in LBO. Mounting debts would kill the company in case of delays.
Page 61 of 61 - Financial Management- IIJamnalal Bajaj Institute of Mgmt Studies