40
1 Lecture Notes Lecture Notes

1Lecture Notes
LectureNotes

Introduction to Decision Analysis2
Beginning principles.
The best you can do is integrate in a logical manner:
• What you can do• What you know• What you want or value
DecisionModel
What you want
What you can do
What you know
What is decision analysis?
Decision analysis IS:A methodology based on a set of probabilistic frameworks whichfacilitates high-quality, logical discussions, leading to clear and com-pelling action by the decision maker.
Decision analysis is NOT:A method for justifying decisions already made.Cost-benefit analysis.A cookbook. Decision
Analysis
Cookbook
Everything you wanted to know about decisionanalysis...
3Lecture Notes
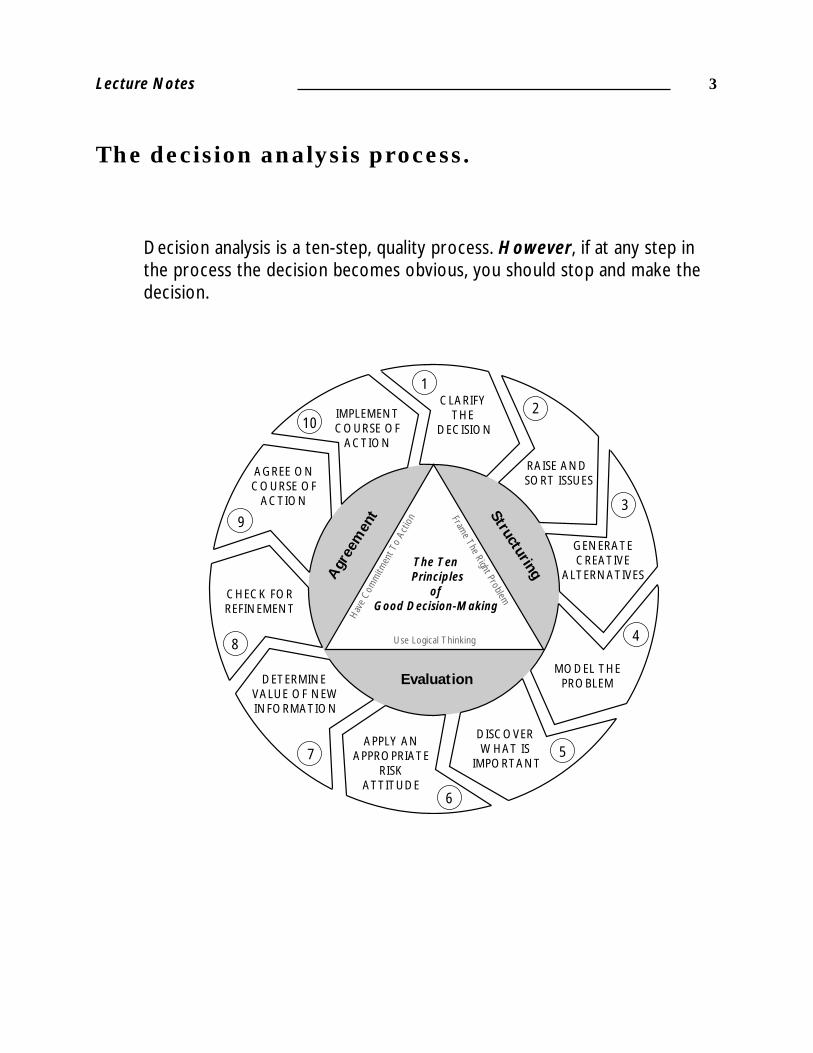
Decision analysis is a ten-step, quality process. However, if at any step inthe process the decision becomes obvious, you should stop and make thedecision.
Structuring
Evaluation
Agr
eem
ent
CLARIFY THE
DECISION
RAISE AND SORT ISSUES
MODEL THEPROBLEM
GENERATECREATIVE
ALTERNATIVES
DISCOVER WHAT IS
IMPORTANT
DETERMINE VALUE OF NEWINFORMATION
APPLY ANAPPROPRIATE
RISKATTITUDE
CHECK FORREFINEMENT
AGREE ONCOURSE OF
ACTION
IMPLEMENTCOURSE OF
ACTION
1
2
3
4
5
6
7
8
9
10
The Ten Principles
of Good Decision-Making
Frame The Right Problem
Hav
e C
omm
itmen
t To
Actio
n
Use Logical Thinking
The decision analysis process.

Introduction to Decision Analysis4
The term decision analysis is becoming a broadly used term in manyindustries. While it can be used descriptively, in this course we will usethe normative meaning.
Descriptive decision analysis is a present-state approach, describinghow things are.
Normative decision analysis is a future-state approach, describinghow things should be.
Describe a normative situation which applies to you?
Decision analysis is a normative process.
Distinctions are a break in the world: If something is this, it is notthat.
Example: A person is either male or female.
Distinctions are used to define the problem to be solved.
Distinctions about distinctions• Must be clear• Must be observable• Must be useful
There are kinds and degrees of distinctions.
Creating distinctions:
5Lecture Notes
What is probability?
The difference between objective andsubjective probability:
Probabilities obtained from a large data set are usually considered tobe objective.
• Cancer risk factors• Lightning strikes• Tossing a coin
Probabilities obtained from experts, based on their knowledge,experience, beliefs, and data, are considered subjective. Mostdecisions require subjective probabilities.
• Probability of market acceptance of a new product• Probability of the Yankees making it to the World Series
There are two distinct views of probability—frequentist andBayesian.
Frequentists view probability as an empirical set of data defined bythe total number of times something has happened. This viewpointworks as long as you have a sufficient data set.
The Bayesian view of probability is a state of knowledgebased upon your experience, beliefs, knowledge, and data.This provides a means to assess situations where something haseither never occurred or is a rare event.

Introduction to Decision Analysis6
An example of subjective probability.
You are shown a dictionary containing 1,400+ pages of information.What is the probability the first word listed on page 1025 begins withthe letter Q. (This experiment can only be run once.)
Write your probability here_________
States of knowledge:
Subjective probabilities rely upon expert knowledge which is alwayschanging as new information becomes available. Therefore probabili-ties should also change as new information becomes available.
We use a simple nomenclature for describing the state of informa-tion for a given probability.
p(D|&)
This states the probability we assign to event D given our presentstate of information &.

7Lecture Notes
Helpful hints:
• Q is the 17th letter of the alphabet• Page 1025 is in the last third of the dictionary• You have knowledge that some letters have less words than others, such as the letters Z, X, and Y
Understanding states of knowledge:
Your state of knowledge prior to the helpful hints page was:
p(D1|&)
Your new state of information may be the same if you incorporatedall the helpful hints previously. But what if you learned the last wordthat started with the letter P was on page 1010. How would youincorporate this new information?
p(D1|&')
&' indicates a new state of knowledge. If the knowledge was condi-tioned upon several pieces of information you can write them withthe "," to denote "and".
p(D1|X,&)
Does this change your probability?
If so, what is it now_________
Is your probability assessment correct?
Lecture Notes - Probability
Introduction to Decision Analysis8
Must be able topeel away layers.
Probability Wheel
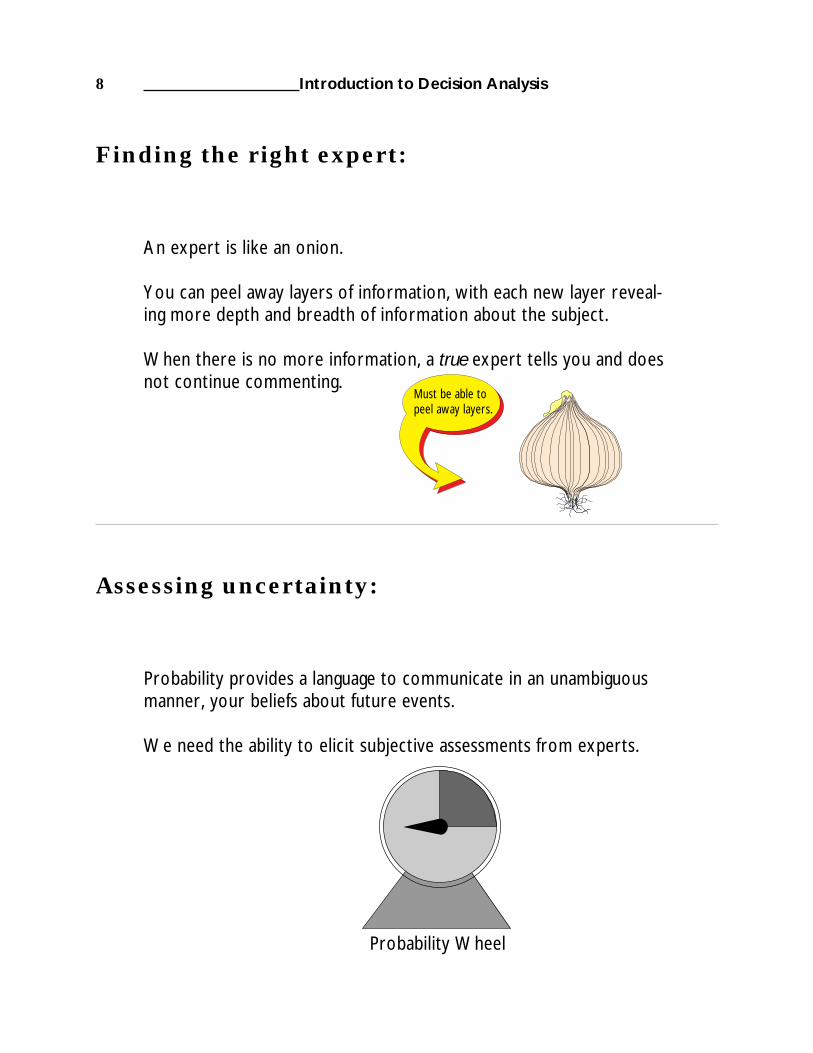
Finding the right expert:
An expert is like an onion.
You can peel away layers of information, with each new layer reveal-ing more depth and breadth of information about the subject.
When there is no more information, a true expert tells you and doesnot continue commenting.
Assessing uncertainty:
Probability provides a language to communicate in an unambiguousmanner, your beliefs about future events.
We need the ability to elicit subjective assessments from experts.
9Lecture Notes
Issues Issues
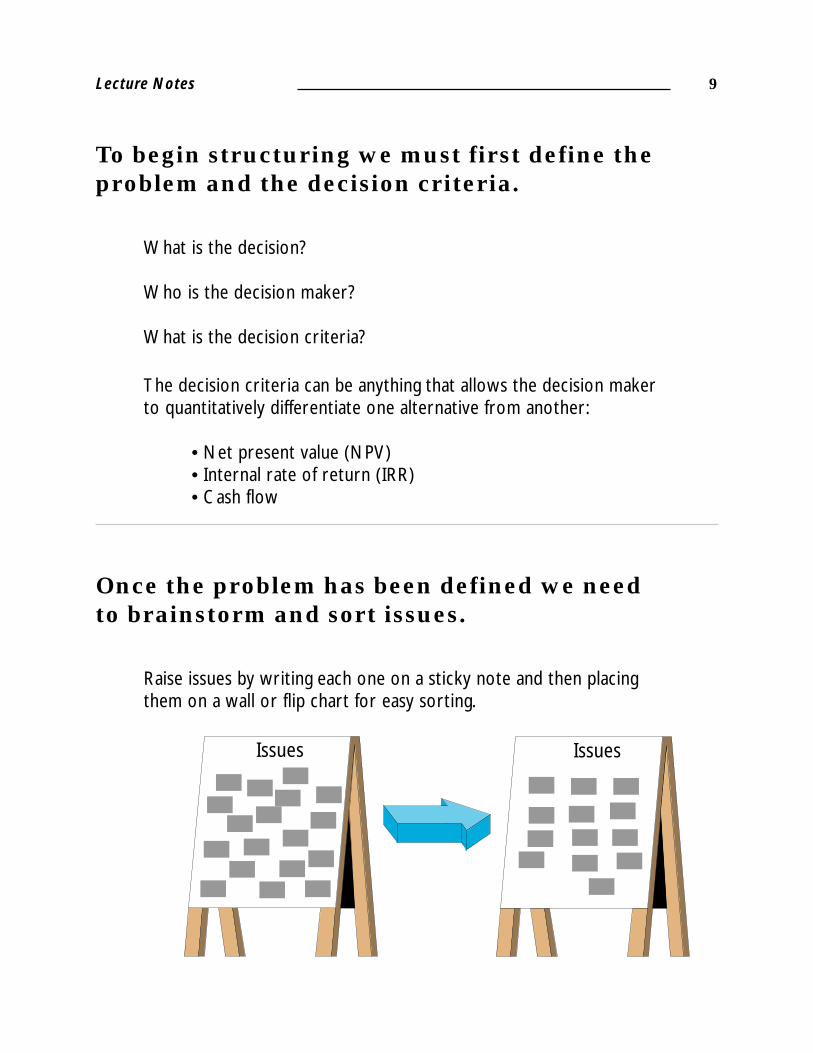
To begin structuring we must first define theproblem and the decision criteria.
What is the decision?
Who is the decision maker?
What is the decision criteria?
The decision criteria can be anything that allows the decision makerto quantitatively differentiate one alternative from another:
• Net present value (NPV)• Internal rate of return (IRR)• Cash flow
Once the problem has been defined we needto brainstorm and sort issues.
Raise issues by writing each one on a sticky note and then placingthem on a wall or flip chart for easy sorting.
Introduction to Decision Analysis10
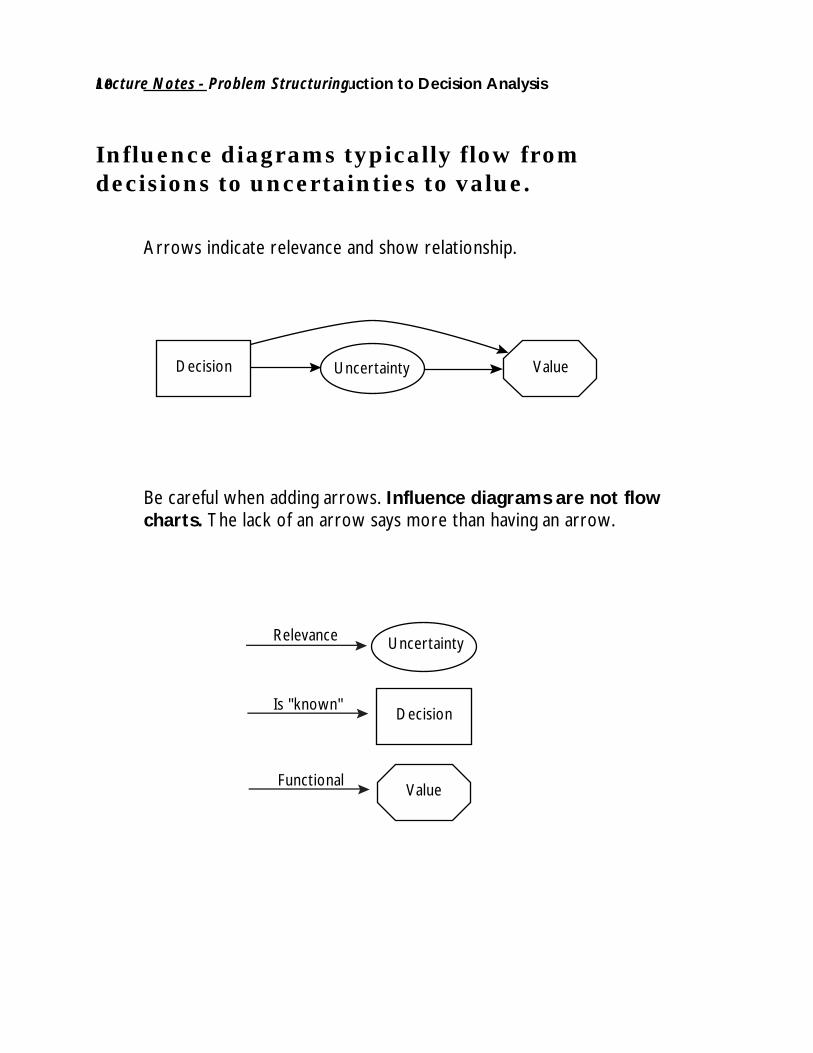
Influence diagrams typically flow fromdecisions to uncertainties to value.
Arrows indicate relevance and show relationship.
UncertaintyDecision Value
Be careful when adding arrows. Influence diagrams are not flowcharts. The lack of an arrow says more than having an arrow.
Uncertainty
Decision
Value
Relevance
Functional
Is "known"
Lecture Notes - Problem Structuring
11Lecture Notes
Value
Value NPV ofProject A
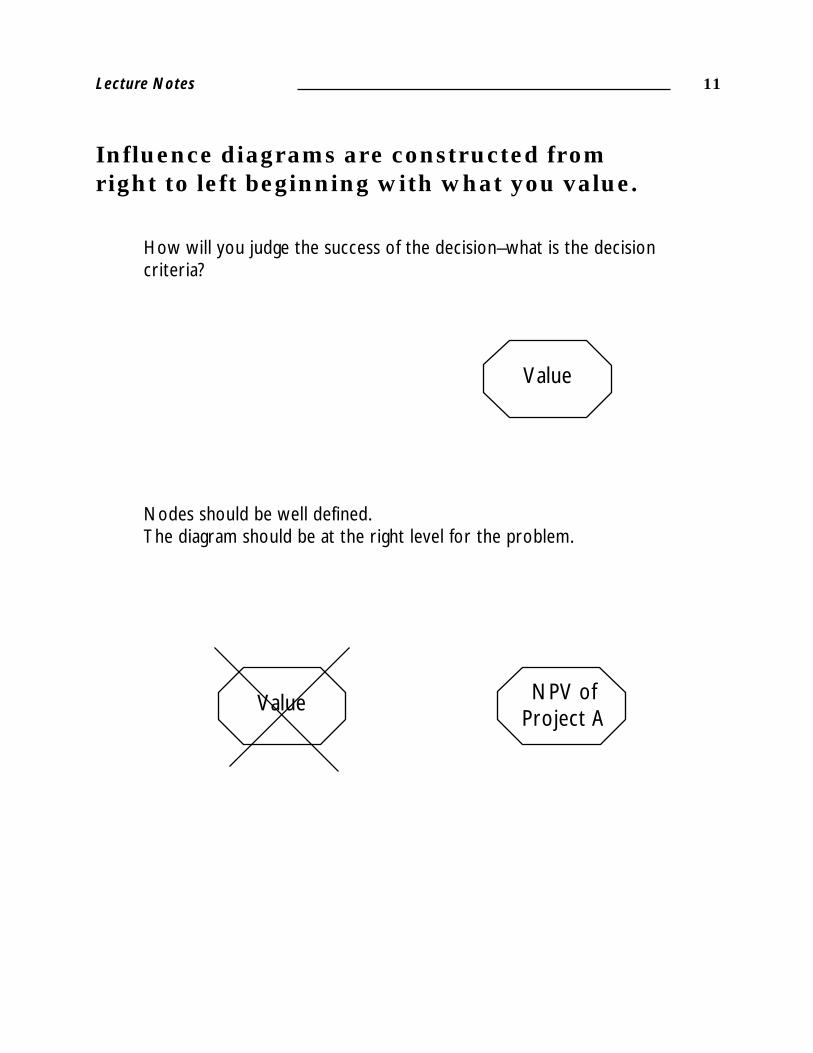
Influence diagrams are constructed fromright to left beginning with what you value.
How will you judge the success of the decision–what is the decisioncriteria?
Nodes should be well defined.The diagram should be at the right level for the problem.

Introduction to Decision Analysis12
Consider the following problem:
The Swanson Company has developed a new product—S234. Whileyou think this product has great potential, you are unsure whetherS234 will be profitable if brought to market.
Issues about S234 include:• Whether to:
– launch S234– sell S234 to another company– license S234
• Market size
• Revenue
• Marketing costs
• Profit
• Stock price
• Manufacturing costs
Lecture Notes - Problem Structuring
13Lecture Notes
NPV ofS234
Revenue
Costs
NPV ofS234
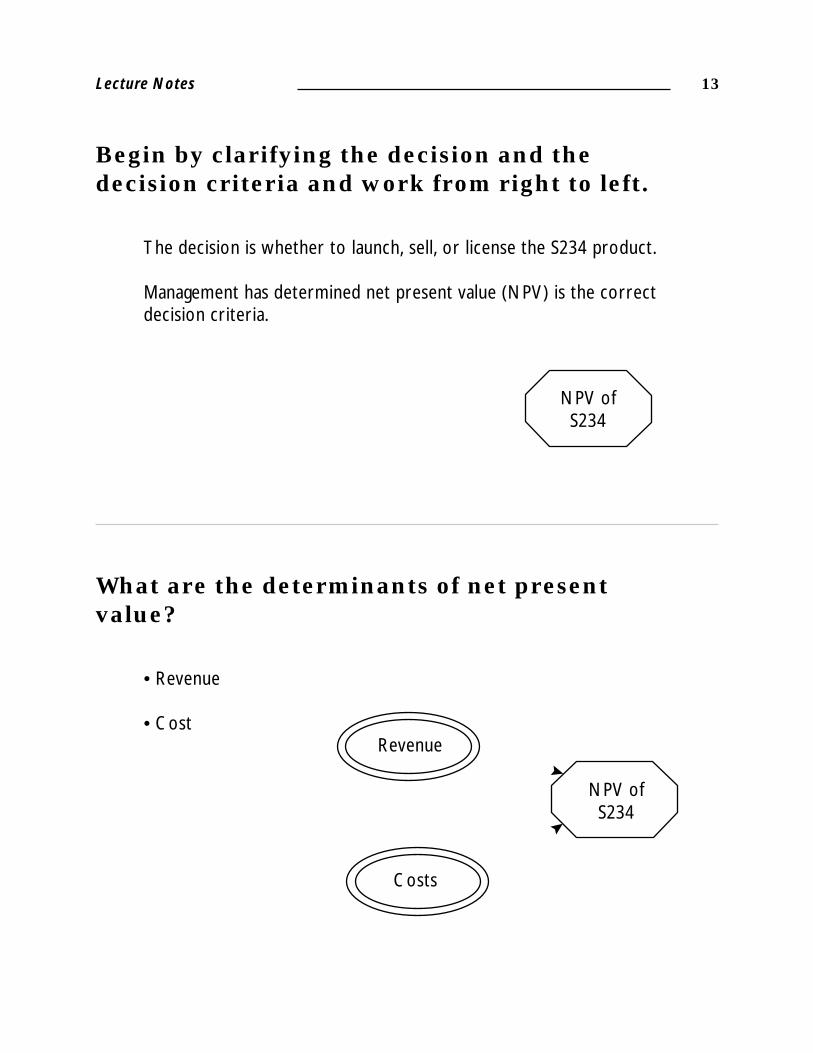
Begin by clarifying the decision and thedecision criteria and work from right to left.
The decision is whether to launch, sell, or license the S234 product.
Management has determined net present value (NPV) is the correctdecision criteria.
What are the determinants of net presentvalue?
• Revenue
• Cost
Introduction to Decision Analysis14
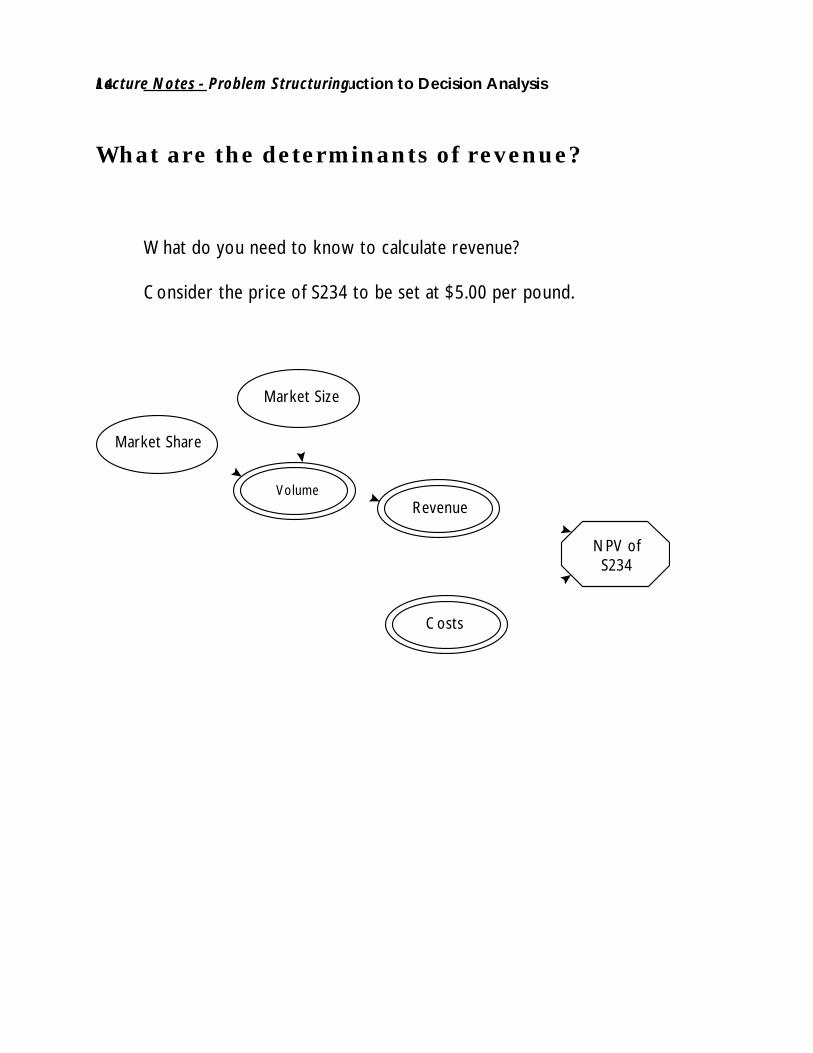
What are the determinants of revenue?
What do you need to know to calculate revenue?
Consider the price of S234 to be set at $5.00 per pound.
Revenue
Costs
NPV ofS234
Market Share
Market Size
Volume
Lecture Notes - Problem Structuring
15Lecture Notes
Revenue
Costs
NPV ofS234
Market Share
Market Size
Volume
ManufacturingCosts
MarketingCosts
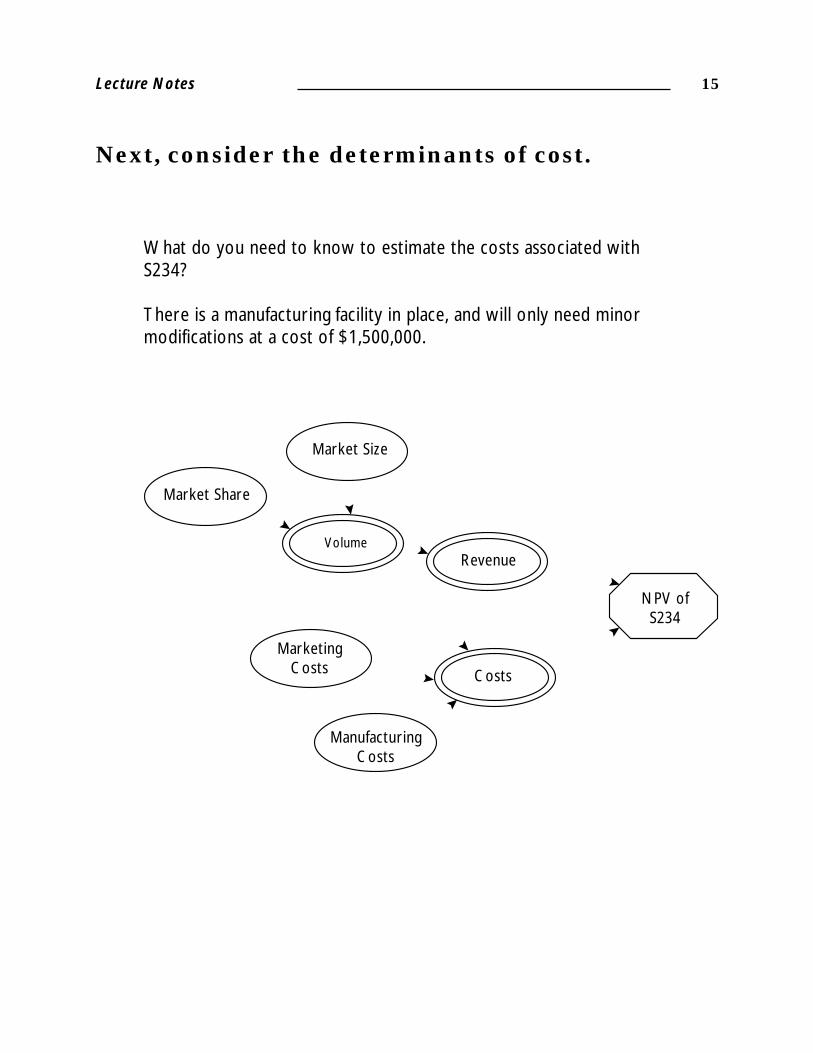
Next, consider the determinants of cost.
What do you need to know to estimate the costs associated withS234?
There is a manufacturing facility in place, and will only need minormodifications at a cost of $1,500,000.
Introduction to Decision Analysis16
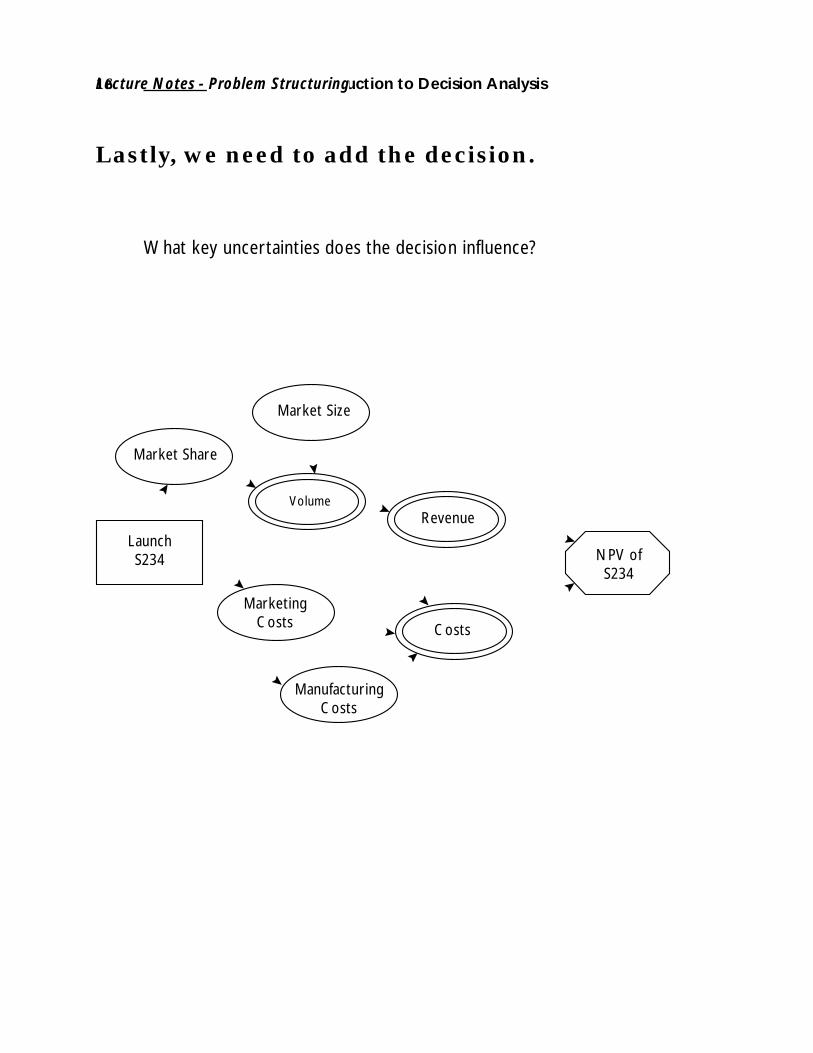
Lastly, we need to add the decision.
What key uncertainties does the decision influence?
LaunchS234
Revenue
Costs
NPV ofS234
Market Share
Market Size
Volume
ManufacturingCosts
MarketingCosts
Lecture Notes - Problem Structuring
17Lecture Notes
Checklist for structuring:
Summary
Influence diagrams provide a graphical description of the problem.
Influence diagrams are a good communication tool.
The focus of a decision analysis should be at the strategic level.
Brainstorming issues and then separating the issues into decisions,uncertainties, objectives, and facts helps to frame the problem.
√ Have the objectives for this project been defined and agreed to?
√ Has the scope of this project been defined appropriately?
√ Who is the sponsor of the project?
√ What is the decision criteria?
√ Have appropriate resources been committed?
√ Are the right people on the project team?

Introduction to Decision Analysis18
The product of any analysis should be newinsights which clarify a course of action.
There are several tools which we will use to generate these newinsights into the problem.
The process of evaluation has three parts:
Deterministic evaluation• Sensitivity analysis• Tornado diagrams
Probabilistic evaluation• Cumulative distribution• Sensitivity to probability
Value of information• Value of perfect information• Value of imperfect information
Lecture Notes - Gaining Insight

19Lecture Notes
Deterministic evaluation:
Deterministic evaluation is probably most consistent with the wayyou currently perform analyses.
A x B = C
Sensitivity analysis provides the ability to determine the most impor-tant factors which affect either the decision or the bottom line. Wecan then use the tornado diagram to graphically illustrate the sensitiv-ity of each variable.
Variable ranges for S234.
10 50 90Market size (Mlbs.) .2 1 2Market share (%) 15 20 25Mfg. Costs ($/lb.) 1 1.5 2Mkt. Costs ($/lb.) .5 .75 1

Introduction to Decision Analysis20
Building the value model:
The value model for S234—
Fixed inputs:Discount rate = 10%Tax rate = 40%S234 price/lb. = $5.00Project length = 10 years
NPV of S234 = (Revenue – Cost) x Discount Factor for each year(See discount factor table in Appendix)
Revenue = Price x VolumeVolume = Mkt. Size x Mkt. ShareCost = (Mfg. Cost + Mkt. Cost) x Volume
Base case value =Revenue = $5.00 x 1,000,000 lbs. x 20%Costs = ($1.50 + $0.75) x 1,000,000= $1,000,000 – $450,000= $550,000 /yr x (1– .40) Tax rate= $330,000 x 10 years x 10% discount rate= $1,209,525
ValueModelS234 Price
Discount Rate
Tax Rate
Project Length
21Lecture Notes
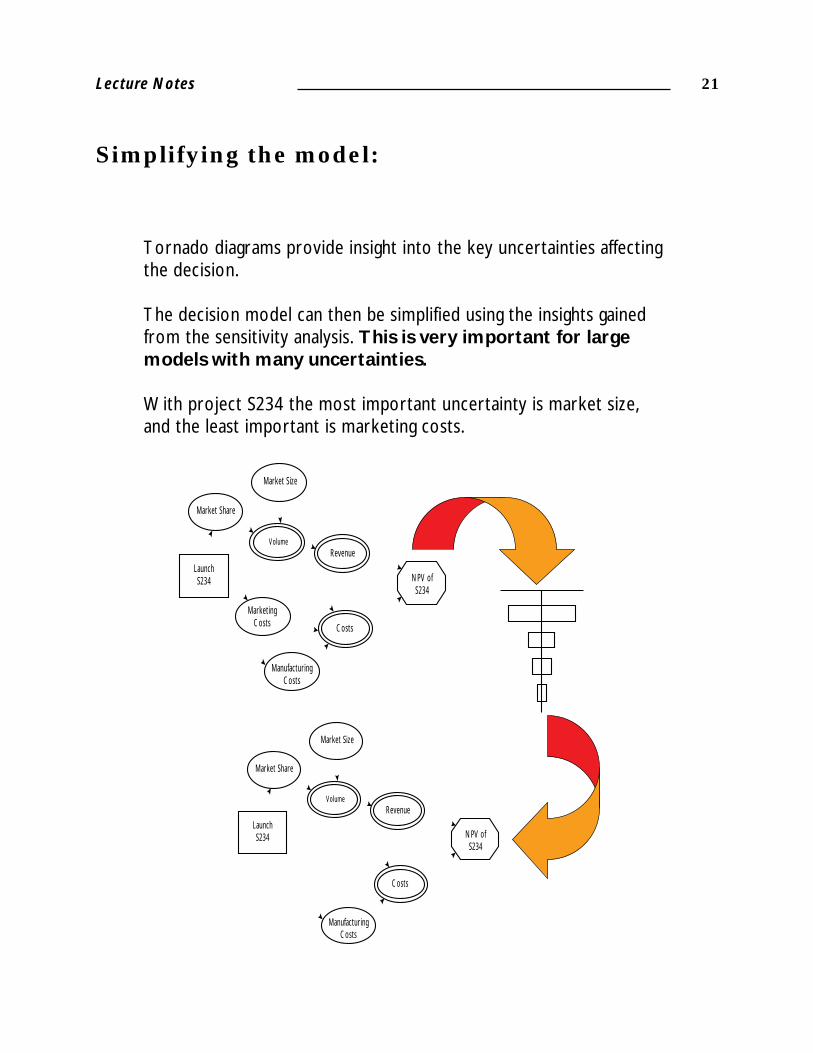
Simplifying the model:
Tornado diagrams provide insight into the key uncertainties affectingthe decision.
The decision model can then be simplified using the insights gainedfrom the sensitivity analysis. This is very important for largemodels with many uncertainties.
With project S234 the most important uncertainty is market size,and the least important is marketing costs.
LaunchS234
Revenue
Costs
NPV ofS234
Market Share
Market Size
Volume
ManufacturingCosts
MarketingCosts
LaunchS234
Revenue
Costs
NPV ofS234
Market Share
Market Size
Volume
ManufacturingCosts
Introduction to Decision Analysis22
Net Present Value
Cumulative
Probability
0–596977.4
.1
.2
649140.8
.3
.4
1895259.0
.5
.6
3141377.2
.7
.8
4387495.4
.9
1.0
5633613.6
EV=1310910.7
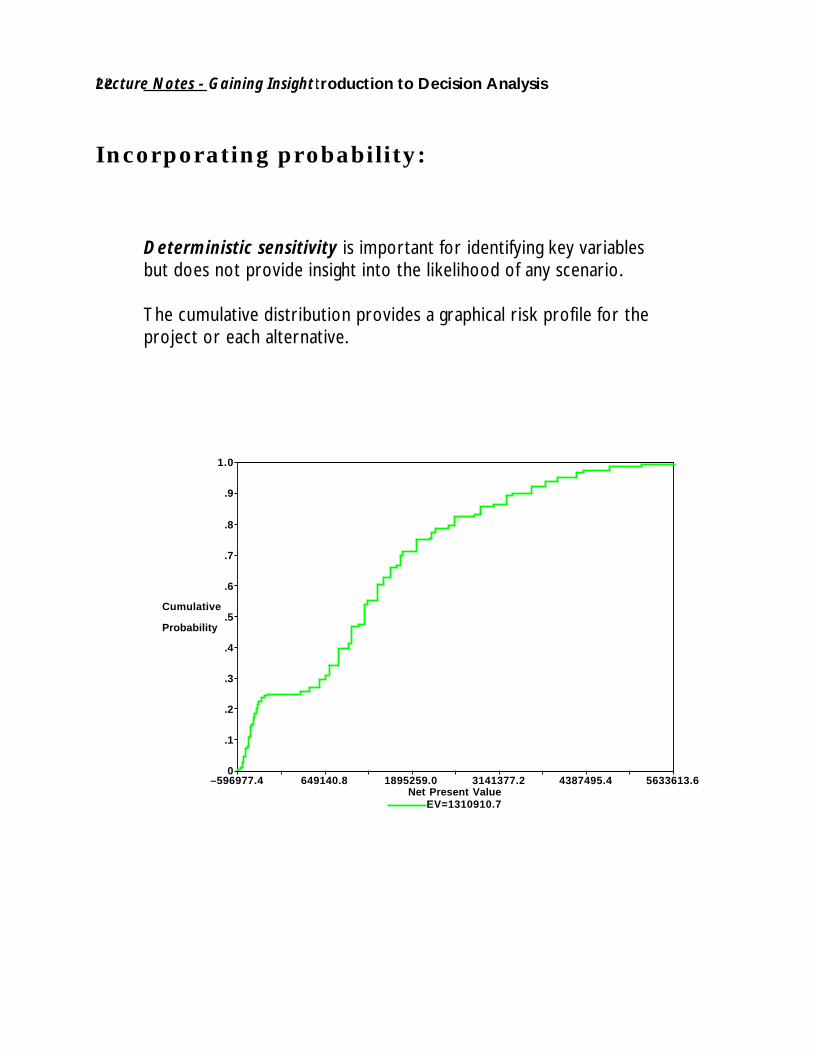
Incorporating probability:
Deterministic sensitivity is important for identifying key variablesbut does not provide insight into the likelihood of any scenario.
The cumulative distribution provides a graphical risk profile for theproject or each alternative.
Lecture Notes - Gaining Insight

23Lecture Notes
Another alternative? Selling S234:
In addition to launching S234 the company also wanted to evaluatethe alternatives of selling and/or licensing the product.
The influence diagram for selling S234 to another company:
SellS234
Probability ofLarge Offer
Selling Costs
NPV ofS234
Sales Price
Small CompanyOffer
Large CompanyOffer

Introduction to Decision Analysis24
LicenseS234
Revenue
LicensingCosts
NPV ofS234
Market Share
Market Size
Volume
RoyaltyRate
Licensing S234:
The company could license S234 and receive royalties from the sales.
Lecture Notes - Gaining Insight
25Lecture Notes
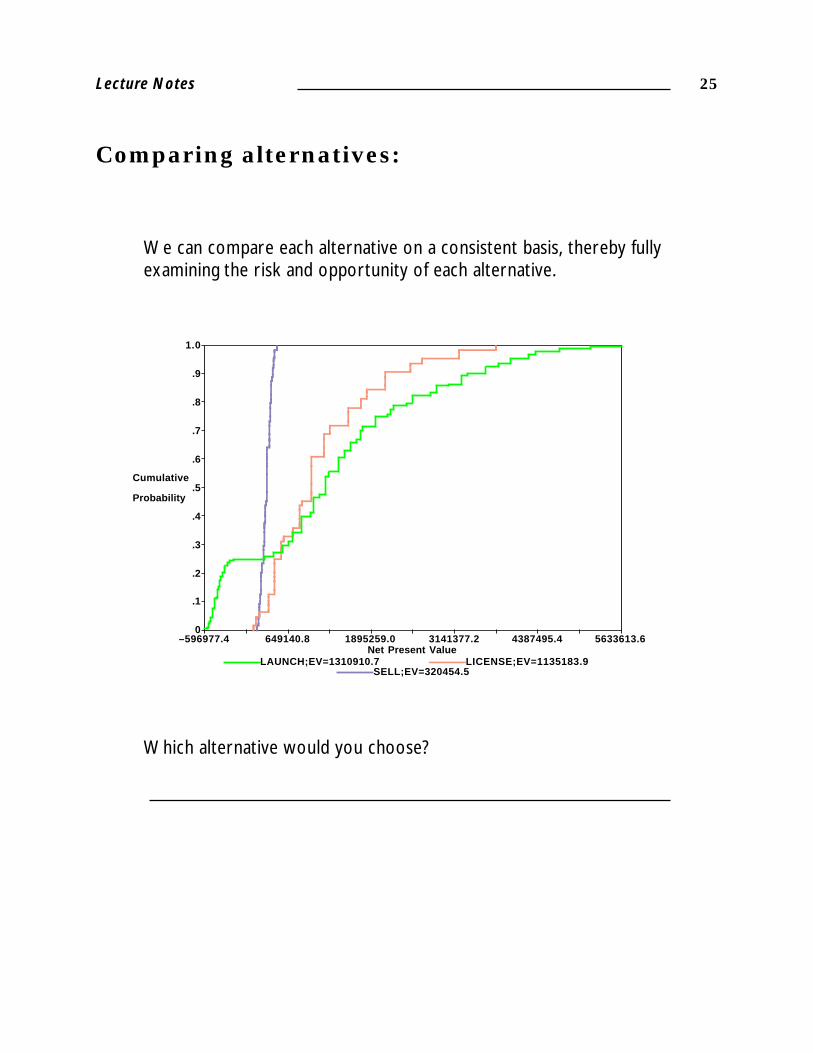
Comparing alternatives:
We can compare each alternative on a consistent basis, thereby fullyexamining the risk and opportunity of each alternative.
Net Present Value
Cumulative
Probability
0–596977.4
.1
.2
649140.8
.3
.4
1895259.0
.5
.6
3141377.2
.7
.8
4387495.4
.9
1.0
5633613.6
LAUNCH;EV=1310910.7 LICENSE;EV=1135183.9SELL;EV=320454.5
Which alternative would you choose?

Introduction to Decision Analysis26
Choosing wisely:
Dominance—• Dominance can be deterministic or stochastic• Allows inferior alternatives to be eliminated• Is always better than the other alternatives
None of the three alternatives show complete dominance over theother two. The sell option, however, is less attractive based on anEMV of $320,455.
Net Present Value
Cumulative
Probability
0–596977.4
.1
.2
649140.8
.3
.4
1895259.0
.5
.6
3141377.2
.7
.8
4387495.4
.9
1.0
5633613.6
LAUNCH;EV=1310910.7 LICENSE;EV=1135183.9SELL;EV=320454.5
Lecture Notes - Gaining Insight
27Lecture Notes
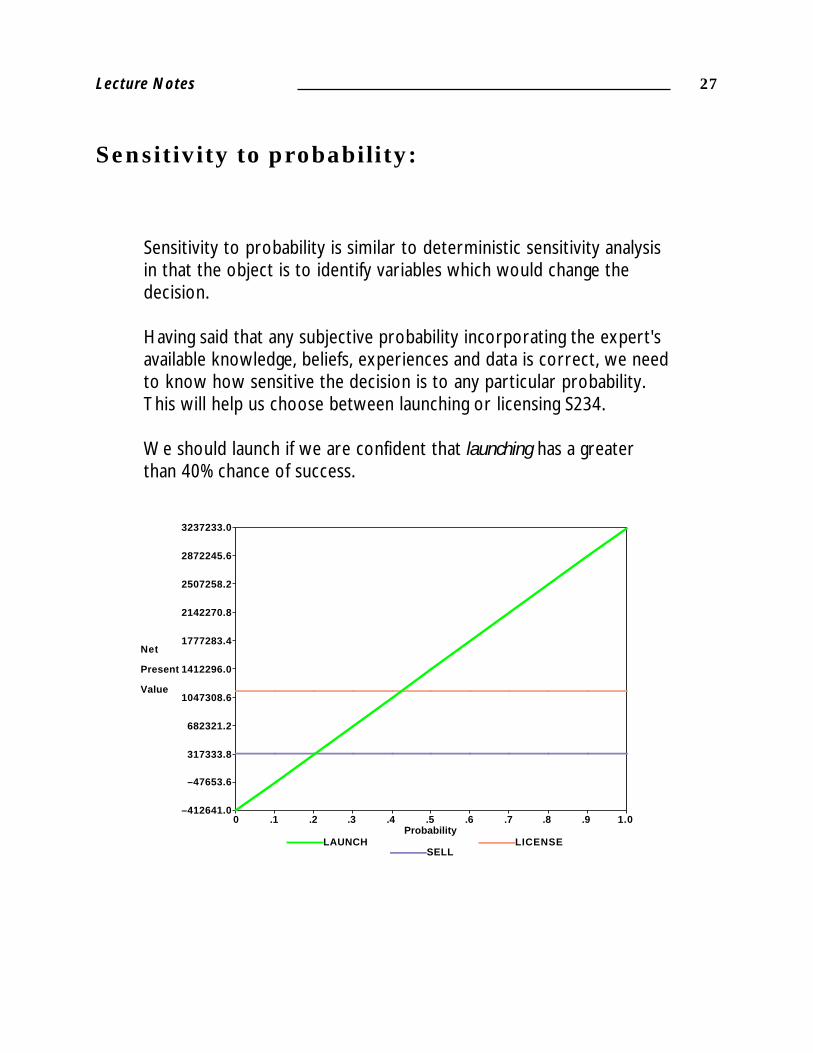
Sensitivity to probability:
Sensitivity to probability is similar to deterministic sensitivity analysisin that the object is to identify variables which would change thedecision.
Having said that any subjective probability incorporating the expert'savailable knowledge, beliefs, experiences and data is correct, we needto know how sensitive the decision is to any particular probability.This will help us choose between launching or licensing S234.
We should launch if we are confident that launching has a greaterthan 40% chance of success.
Probability
Net
Present
Value
–412641.00
–47653.6
.1
317333.8
.2
682321.2
.3
1047308.6
.4
1412296.0
.5
1777283.4
.6
2142270.8
.7
2507258.2
.8
2872245.6
.9
3237233.0
1.0
LAUNCH LICENSESELL
Introduction to Decision Analysis28
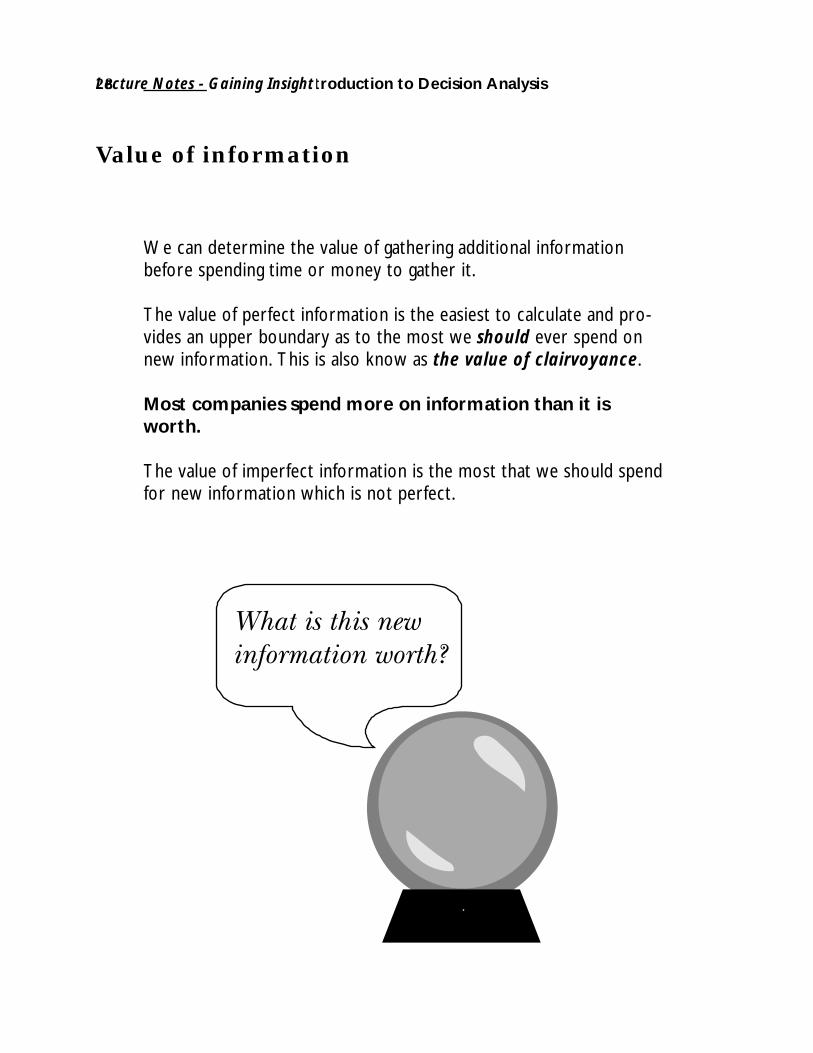
Value of information
We can determine the value of gathering additional informationbefore spending time or money to gather it.
The value of perfect information is the easiest to calculate and pro-vides an upper boundary as to the most we should ever spend onnew information. This is also know as the value of clairvoyance.
Most companies spend more on information than it isworth.
The value of imperfect information is the most that we should spendfor new information which is not perfect.
Lecture Notes - Gaining Insight

29Lecture Notes
Calculating value of perfect information:
= Value with perfect information– Value without perfect information= $1,697,866 – $1,310,910= $386,956 = Value of perfect information
The value of perfect information is calculated by placing the uncer-tainty you want to evaluate, before the decision. Then, recalculatethe expected value.
Original tree: EMV $1,310,910
S234 Exp Val Probs MKTSIZE Exp Val0.250 2000000 3237232.50.500 1000000 1209525.30.250 200000 -412640.4
>LAUNCH 1310910.7
LICENSE 1135183.9 SELL 320454.5
VOPI tree: EMV $1,697,866
Probs MKTSIZE Exp Val S234 Exp Val>LAUNCH 3237232.5 LICENSE 1135183.9 SELL 320454.5
0.250 2000000 3237232.5
>LAUNCH 1209525.3 LICENSE 1135183.9 SELL 320454.5
0.500 1000000 1209525.3
LAUNCH -412640.4>LICENSE 1135183.9 SELL 320454.5
0.250 200000 1135183.9
Introduction to Decision Analysis30
LaunchS234
Revenue
Costs
NPV ofS234
Market Share
Market Size
Volume
ManufacturingCosts
MarketingCosts
Market Survey
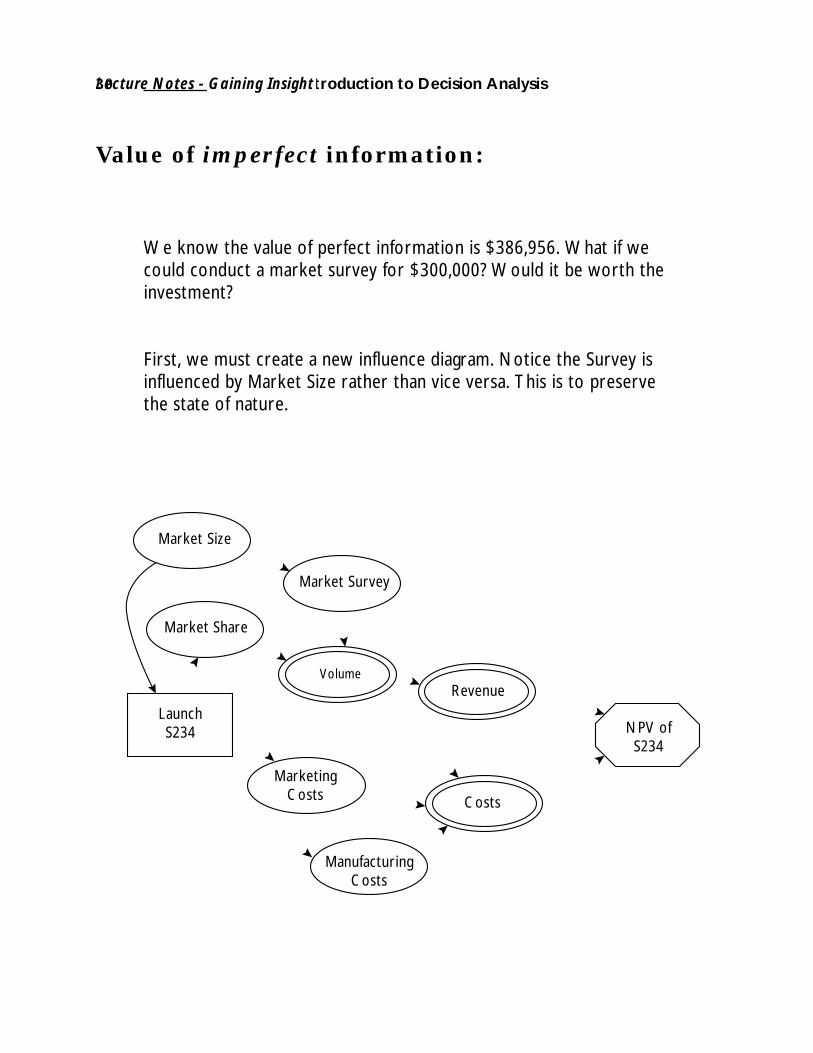
Value of imperfect information:
We know the value of perfect information is $386,956. What if wecould conduct a market survey for $300,000? Would it be worth theinvestment?
First, we must create a new influence diagram. Notice the Survey isinfluenced by Market Size rather than vice versa. This is to preservethe state of nature.
Lecture Notes - Gaining Insight
31Lecture Notes
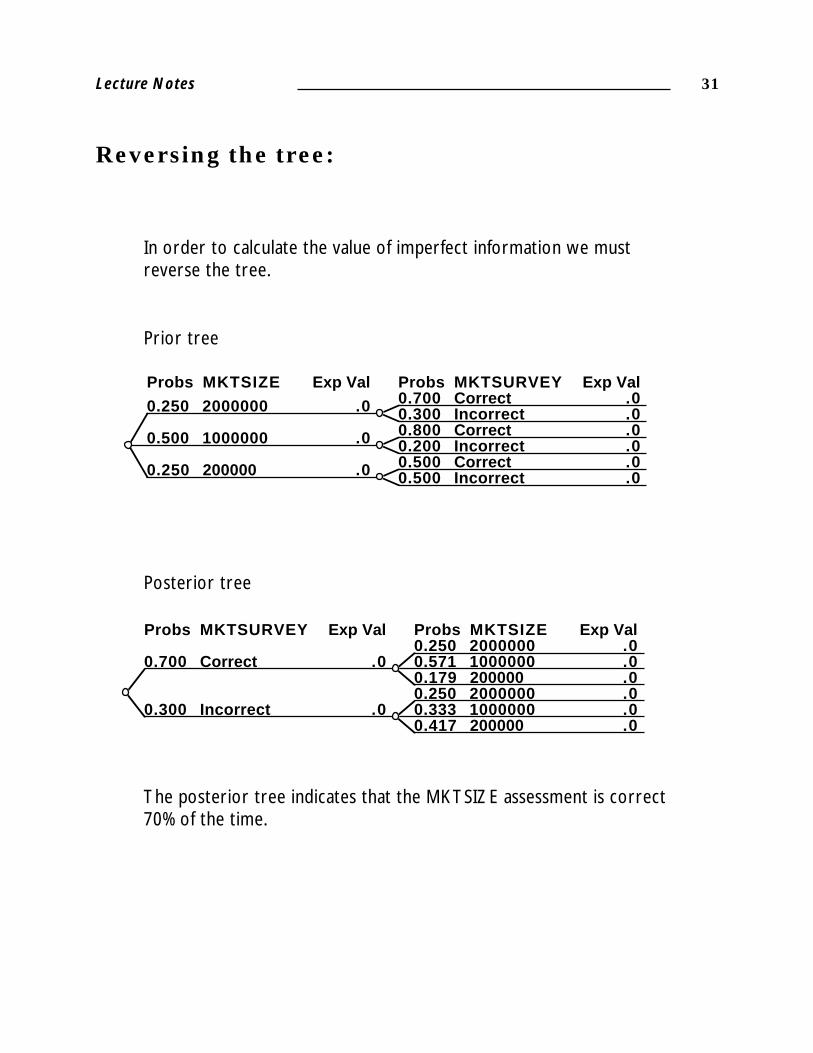
Reversing the tree:
In order to calculate the value of imperfect information we mustreverse the tree.
Probs MKTSIZE Exp Val Probs MKTSURVEY Exp Val0.700 Correct .00.300 Incorrect .00.250 2000000 .0
0.800 Correct .00.200 Incorrect .00.500 1000000 .0
0.500 Correct .00.500 Incorrect .00.250 200000 .0
Posterior tree
Probs MKTSURVEY Exp Val Probs MKTSIZE Exp Val0.250 2000000 .00.571 1000000 .00.179 200000 .0
0.700 Correct .0
0.250 2000000 .00.333 1000000 .00.417 200000 .0
0.300 Incorrect .0
Prior tree
The posterior tree indicates that the MKTSIZE assessment is correct70% of the time.

Introduction to Decision Analysis32
Probs Survey Exp Val S234 Exp Val Probs Marketsize Exp Val0.250 2000000 3237232.50.571 1000000 1209525.30.179 200000 -412640.4
>Launch 1426779.7
License 1135183.9 Sell 320454.5
0.700 correct 1426779.7
0.250 2000000 3237232.50.333 1000000 1209525.30.417 200000 -412640.4
Launch 1040549.7
>License 1135183.9 Sell 320454.5
0.300 incorrect 1135183.9
Summary
Decision analysis provides tremendous insight into the value of all thedifferent alternatives and can help to create new alternatives.
Sensitivity analysis is important in identifying the factors which affectthe decision.
Sensitivity to probability can help identify the variance that wouldcause you to change your decision.
The value of gathering new information can be calculated beforegathering the information.
Remember to consider the feasibility and reliability of gathering newinformation. Just because you can calculate the value does not meanyou can either find the information or obtain it.
The new tree reveals:
= Value with imperfect information– Value without= $1,426,779 – $1,310,910= $115,869 = Value of imperfect information
We would not pay more than $115,869 for the market survey.
Lecture Notes - Gaining Insight
33Lecture Notes
The Four D'sDecision
Decision Analysis
DeathEPA Protocols
DestructionFault Tree Analysis
DefectsStatistical Process
Control
Risk
Net Present Value
Cumulative
Probability
0–596977.4
.1
.2
649140.8
.3
.4
1895259.0
.5
.6
3141377.2
.7
.8
4387495.4
.9
1.0
5633613.6
EV=1310910.7
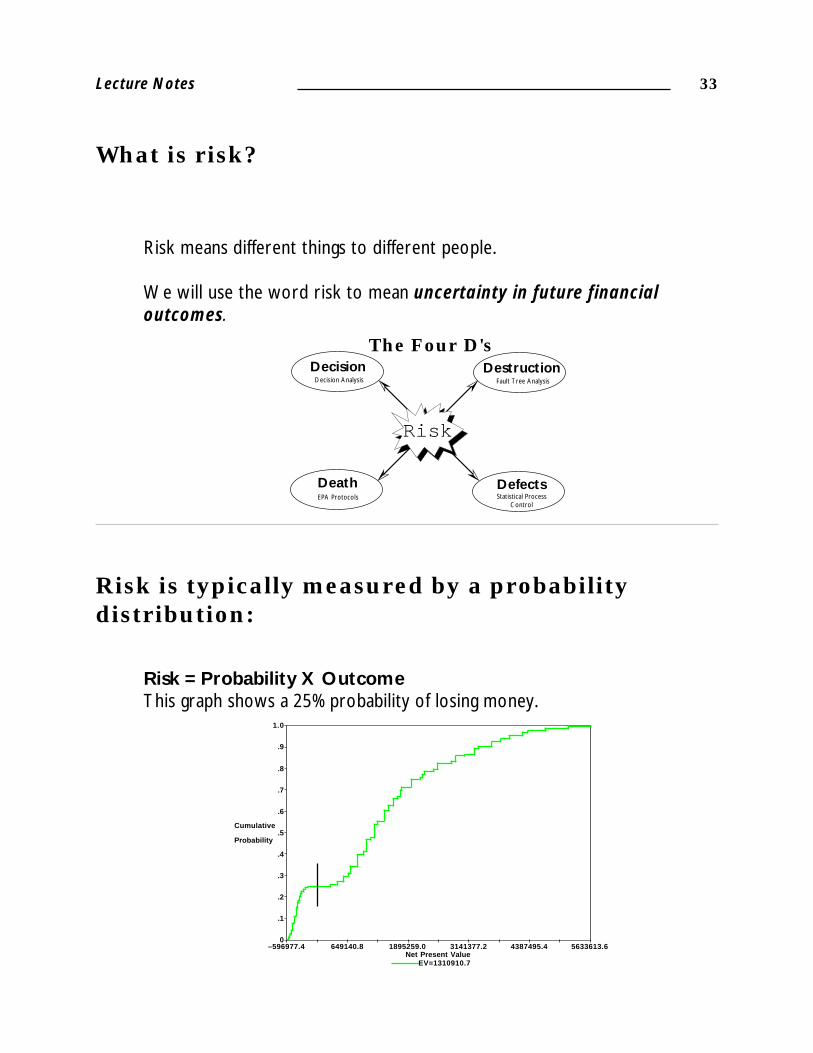
What is risk?
Risk means different things to different people.
We will use the word risk to mean uncertainty in future financialoutcomes.
Risk is typically measured by a probabilitydistribution:
Risk = Probability X OutcomeThis graph shows a 25% probability of losing money.

Introduction to Decision Analysis34
Risk attitude is how individuals ororganizations view decisions involving risk.
What is this deal worth to you?How much would you pay for the opportunity?
The Risk-Taking Scale:
An individual's willingness to take risk is often based on a personalrisk attitude rather than on the corporate risk attitude.
Where do you fall on this scale for most decisions? (Look at yourresponse to the DRIVE exercise)
What should your risk attitude be for corporate decisions?
Risk Neutral
Risk SeekingRisk AverseEMV
+–
.20
.30
.50
$1000
–$500
$0
Win
Lose
Break even
Lecture Notes - Gaining Insight
35Lecture Notes
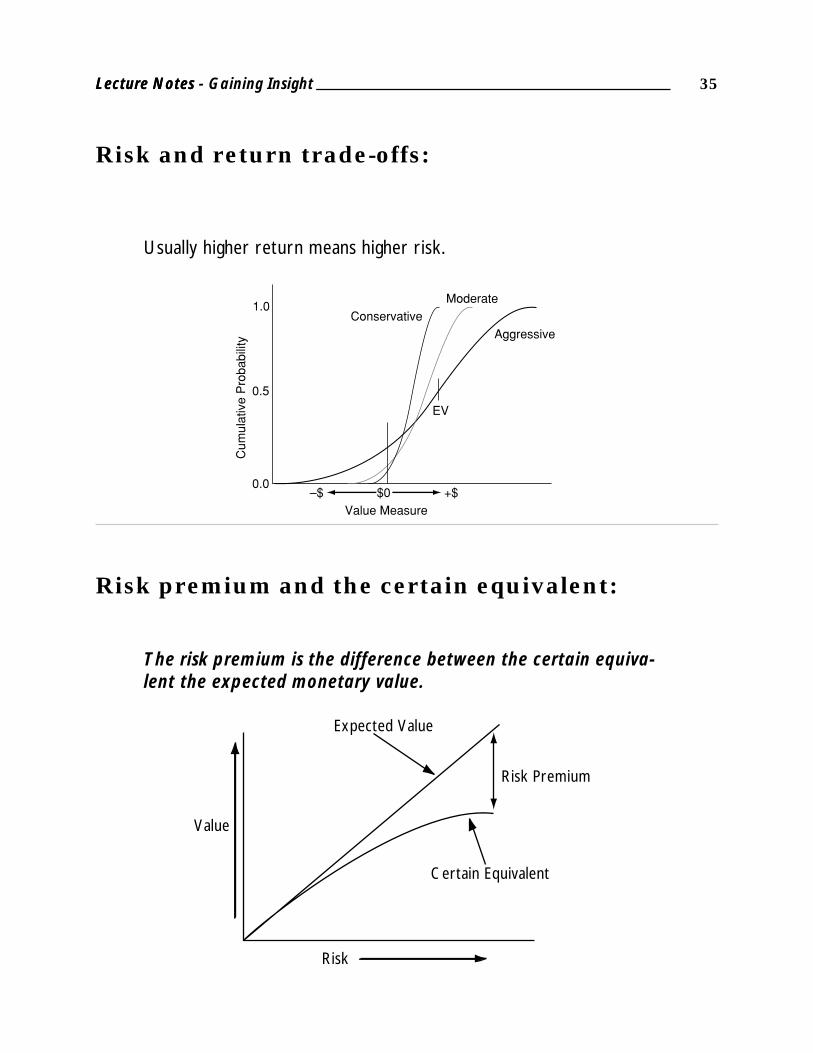
Risk and return trade-offs:
Usually higher return means higher risk.
1.0
0.0
0.5
EV
$0–$ +$
Cum
ulat
ive
Pro
babi
lity
Value Measure
ConservativeModerate
Aggressive
Risk premium and the certain equivalent:
The risk premium is the difference between the certain equiva-lent the expected monetary value.
Certain Equivalent
Value
Risk
Risk Premium
Expected Value
Lecture Notes - Gaining Insight
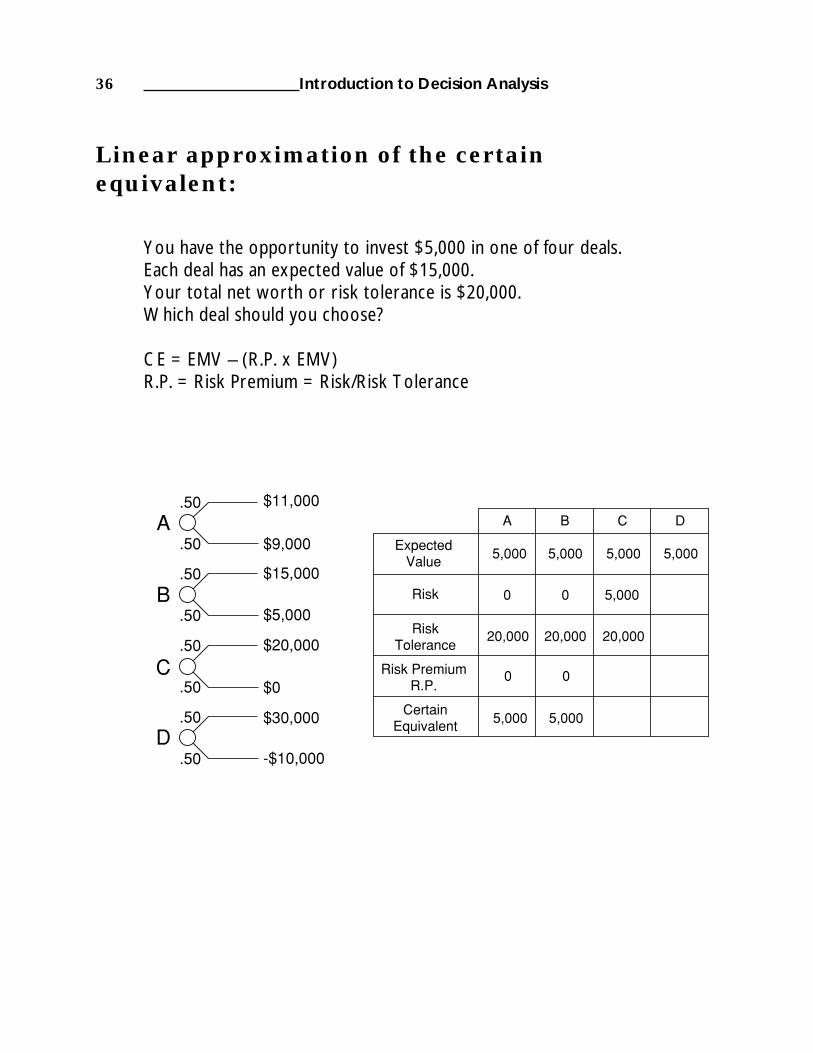
Introduction to Decision Analysis36
A
C
D
B
.50
.50
.50
.50
.50
.50
.50
.50
$11,000
$9,000
$15,000
$5,000
-$10,000
$30,000
$0
$20,000
ExpectedValue
Risk
RiskTolerance
Risk PremiumR.P.
CertainEquivalent
A B C D
5,000 5,000 5,000 5,000
0 5,0000
20,000 20,00020,000
0 0
5,000 5,000
Linear approximation of the certainequivalent:
You have the opportunity to invest $5,000 in one of four deals.Each deal has an expected value of $15,000.Your total net worth or risk tolerance is $20,000.Which deal should you choose?
CE = EMV – (R.P. x EMV)R.P. = Risk Premium = Risk/Risk Tolerance

37Lecture Notes
Utility method of calculating the certainequivalent for S234:
Using utility allows for curvature and scaling of risk.
U(X) = 1– exp(–X/R)where R = Risk Tolerance
R is assessed by:Maximum you would pay for a 50/50 chance at Winning R or Losing1/2 x R
Risk Tolerance
Net
Present
Value
318114.1INFINITY
417393.8
516673.4
5000000.0
615953.1
715232.7
2500000.0
814512.4
913792.1
1666666.7
1013071.7
1112351.4
1250000.0
1211631.0
1310910.7
1000000.0
LAUNCH LICENSESELL
Lecture Notes - Gaining Insight

Introduction to Decision Analysis38
Summary
We should account for risk separate from the time value of money.
Using the certain equivalent we can account for both the riskassociated with the potential for loss and the time value of money.
Risk means different things to different people, make sure you under-stand how the word risk is being used.
The value of any deal depends on the decision maker's risk attitude.
Most people are risk averse, but we should in most cases be riskneutral when making corporate decisions.
What is agreement?
Agreement is the last framework in the decision analysis process.
Check for refinementIs the proposed alternative complete and doable, or isadditional refinement needed?
Agree on course of actionDoes management and the project team agree on the samealternative? Is there commitment to a course of action?
Implement the course of actionHave the right people for implementation been identified andinvolved in the process?
39Lecture Notes
Preparing the organization:
Checklist for agreement:
√ Does management understand and accept the analysis findings?
√ Has the decision changed?
√ Has the right level of analysis been performed?
√ Have all the decision maker's uncertainties and preferences been identified and incorporated?
√ Are there any issues unresolved or unaccounted for that affect the decision?
√ Is the recommendation appropriate and doable?
Effectively applying decision analysis means changing theorganizational culture.
• Good decisions ≠ good outcomes
• Uncertainty should be expressed using probability
• Expertise is knowing what you don't know
• Information has a price, and that price can be determined before gathering the information
• Good strategic decisions require the expertise and collaboration of the right people at the right time
Introduction to Decision Analysis40
Summary
The decision analysis process is a quality process for makingdecisions.
Always look for refinement that would change the decision.
Management must be committed to the process and the results.
Include the implementation personnel in the process.
Don't try to solve your hardest problem first. Begin with a simpleproblem and gain an understanding of the process throughexperience.
Lecture Notes - Agreement


