ECO1000 Principles of Microeconomics Lecture Notes Economics is the study of how society manages its scarce resources. What questions does economics deal with? > Economics deals with the allocation of scarce resources - market or non-market resource allocation mechanisms. > What goods and services will be produced? (positive analysis) - describe the world as it is. > What goods and services should be produced? (normative analysis) - prescribes how the world should be. e.g policy-making > How individual households and firms make decisions of resource allocation? (microeconomics) > How a national economy allocates resources? (macroeconomics - unemployment, inflation) > All economic decisions involve choice. Thinking like an economist: 3 key factors in decision making > Every economic decision entails a tradeoff, whereby the decision made trades off one goal against another. e.g work vs leisure efficiency vs equity: often when government policies are being designed, these two goals conflict > If a resource is allocated to one activity, it cannot be allocated to another. > Therefore, making a choice requires careful analysis of costs and benefits. - The choice made should maximise surplus as determined by benefits minus costs. > Opportunity cost (of an activity) is the best alternative that must be given up to obtain some item. e.g On Saturday night, Mei can watch a movie on Netflix, sleep, study accounting, go to a party. What is Mei’s opportunity cost of going to the party? If she goes to a party, she gives up sleep. What is your opportunity cost of a 3-year degree at university? Work experience, earnings. > Rational people think at the margin. Marginal analysis - An individual (or a firm or a society) should take an action if and only if, the marginal benefit of the action exceeds the marginal cost. e.g It costs $20,000 to hire, fuel and crew a place with 100 seats to Bali and back. The extra cost of each additional passenger is $50 per passenger. You set the price of a ticket as $400 and sell 80 tickets (total revenue is $32,000 and total cost is $20,000 + $50 x 80 = $24,000) Just before take-off, a new passenger offers you $100 to join the flight. Should you accept the offer? Case 1 - rejecting the passenger (and the $100) Then you still make $32,000 revenue. Your costs are still $24,000. So, your profit is $8,000. Case 2 - accept the passenger (and the $100) Your revenue goes up by the $100 to $32,100. But your costs also rise by the extra cost of $50 for the passenger to $8050. So your profit is $8050. You accept the passenger, and make an extra $50. This is the decision you would make by comparing the extra revenue ($100) and the extra cost ($50) of the last minute passenger. How do economists proceed? > Observation of real world phenomena > Construction of a model (verbal, graphical, mathematical) - identification of relevant relationships - specification of assumptions > Logical deductions from the model > Conclusions and testable predictions > Comparison with actual economic behaviour Efficiency Equity Efficiency means that society is getting the most it can from its scare resources. Equity means that the benefits of those resources are distributed fairly among society’s members. Refers to the economic pie. Refers to how the pie is divided.
Transcript
ECO1000 Principles of Microeconomics
Lecture Notes Economics is the study of how society manages its scarce resources. What questions does economics deal with? > Economics deals with the allocation of scarce resources - market or non-market resource allocation mechanisms.> What goods and services will be produced? (positive analysis) - describe the world as it is. > What goods and services should be produced? (normative analysis) - prescribes how the world should be. e.g policy-making > How individual households and firms make decisions of resource allocation? (microeconomics) > How a national economy allocates resources? (macroeconomics - unemployment, inflation) > All economic decisions involve choice. Thinking like an economist: 3 key factors in decision making > Every economic decision entails a tradeoff, whereby the decision made trades off one goal against another. e.g work vs leisure efficiency vs equity: often when government policies are being designed, these two goals conflict
> If a resource is allocated to one activity, it cannot be allocated to another. > Therefore, making a choice requires careful analysis of costs and benefits. - The choice made should maximise surplus as determined by benefits minus costs. > Opportunity cost (of an activity) is the best alternative that must be given up to obtain some item. e.g On Saturday night, Mei can watch a movie on Netflix, sleep, study accounting, go to a party. What is Mei’s opportunity cost of going to the party? If she goes to a party, she gives up sleep. What is your opportunity cost of a 3-year degree at university? Work experience, earnings. > Rational people think at the margin. Marginal analysis - An individual (or a firm or a society) should take an action if and only if, the marginal benefit of the action exceeds the marginal cost. e.g It costs $20,000 to hire, fuel and crew a place with 100 seats to Bali and back. The extra cost of each additional passenger is $50 per passenger. You set the price of a ticket as $400 and sell 80 tickets (total revenue is $32,000 and total cost is $20,000 + $50 x 80 = $24,000) Just before take-off, a new passenger offers you $100 to join the flight. Should you accept the offer? Case 1 - rejecting the passenger (and the $100) Then you still make $32,000 revenue. Your costs are still $24,000. So, your profit is $8,000. Case 2 - accept the passenger (and the $100) Your revenue goes up by the $100 to $32,100. But your costs also rise by the extra cost of $50 for the passenger to $8050. So your profit is $8050. You accept the passenger, and make an extra $50. This is the decision you would make by comparing the extra revenue ($100) and the extra cost ($50) of the last minute passenger.
How do economists proceed? > Observation of real world phenomena > Construction of a model (verbal, graphical, mathematical) - identification of relevant relationships - specification of assumptions > Logical deductions from the model > Conclusions and testable predictions > Comparison with actual economic behaviour
Efficiency Equity
Efficiency means that society is getting the most it can from its scare resources.
Equity means that the benefits of those resources are distributed fairly among society’s members.
Refers to the economic pie. Refers to how the pie is divided.
ECO1000 Principles of Microeconomics
The importance of assumptions > Without assumptions, there is no way we can analyse way in any meaningful way. > Assumptions simplify reality to a tractable model that can be analysed scientifically e.g 2 x 2 model of international trade, 2 countries whereby each country produces 2 goods. This model explains to us the main principles of trade. > The art of assumption making e.g Q: Should China float the yuan? A: It depends … on the one hand… on the other hand…
Example of Economic Model: Production Possibilities Frontier The production possibilities frontier (PPF) is a graph showing the various combinations of output that the economy can possibly produce given the available factors of available production and technology. It is a useful model to understand the concepts of opportunity cost and efficiency.
Why is the production possibilities curve bowed-out in shape?The reason for the shape of the Production Possibilities Curve (PPC) is something called the law of increasing opportunity costs. Basically, what this means is that as an economy devotes more of its resources to one kind of product, it becomes less efficient. This is why the PPC is flatter at its end points and more curved in the middle.
If an economy produces two kinds of goods, it stands to reason that some of its productive resources will be more efficient at making one kind of good and some will be better at making the other. Some of them will be equally good at either. For example, imagine that our economy can make capital goods or consumer goods and services. Some people will be good at making either. But there will be some people who are only good for making consumer goods or services (let’s say they are really good at dealing with people and are good salespeople) while others will only be good at making capital goods.
As the economy makes choices in the middle of the curve (making large amounts of both) it can use everyone very efficiently. But let’s say it starts to make only capital goods. The people who are only good for dealing with people will be practically worthless. As they are employed to make capital goods, they will create less marginal product. This means that the curve will flatten out as it gets toward its endpoints.
The economy might be producing at Point B due to unemployment, recession or perhaps the economy is using technology that is not efficient. The economy might be able to reach Point D as a result of technological advances, enabling the economy to move out of the PPF. If the economy chooses C instead of A, what is the opportunity cost of 200 more computers? 100 cars
ECO1000 Principles of Microeconomics
Opportunity Cost and Gains from Trade The concept of opportunity cost is fundamental to many economic ideas and models. An example is the notion of gains from trade. Trade allows people to specialise in what they do best, leading to a mutually beneficial outcome. The concept of opportunity cost can be applied to explain:
> the pattern of specialisation, by determining comparative advantages and > how the terms of trade (relative price) should be determined
e.g Imagine only two goods (car and rice) and only two countries (Australia and Japan)
> Without trade (self-sufficiency or autarky), each country chooses consumption allocation on its production possibilities frontier.
absolute advantage - the ability to produce a good using fewer inputs than another producer comparative advantage - the ability to produce a good at a lower opportunity cost than another producer
> Australia is better at both, but relatively better at producing rice. > Australia can produce both goods at a lower cost (using fewer resources). Therefore Australia has an absolute advantage in both goods. > However, the opportunity cost of producing a car is lower in Japan (2 tons of rice) than in Australia (5 tons of rice). Therefore, Japan has a comparative advantage in producing cars. > As such, Australia has a comparative advantage in producing rice.
* Steeper slope on the PPF means that the producer has a comparative advantage in the production of the good on the vertical axisSpecialisation and Trade > Suppose the two countries specialise in what they have comparative advantages in.> Australia uses all its resources producing 100 tons of rice and Japan uses all its resources producing 50 cars. > Under self-sufficiency, the total output the two countries consume is 75 tons of rice and 40 cars. > When each country specialises in what they have comparative advantages in, it allows the two countries to produce more than they would have previously, under autarky. Consumption Before and After Trade > A city will remain no worse-off from trade if its terms of trade (the ratio of the price of the exported good to the price of the imported good) are higher than or equal to the ratio of the domestic prices of the same two goods before opening up to trade. If the terms of trade do not meet this condition for either or both of a pair of cities, the city for which this is not met will prefer not to trade since it will be better off without trade. In such a situation, mutually agreeable trade cannot take place.> Before trade, AUS chooses (15,25) and JPN chooses (25,50) > After specialisation, AUS produces (0,100) and JPN produces (50,0) > Suppose AUS sells rice to JPN in exchange for car at any price between 1 car for 2 tons of rice (JPN’s opportunity cost) and 1 car for 5 tons of rice (AUS’s opportunity cost). e.g AUS sells 60 tons of rice for 20 cars (called the terms of trade). Then AUS can consume (20,40) > (15,25) and JPN can consume (30,60) > (25,50).
Resource Endowment: Australia - 100 units of labour Japan - 500 units of labour
TechnologyAustralia: 5 units of labour for 1 car, 1 unit of labour for 1 ton of riceJapan: 10 units of labour for 1 car, 5 units of labour for 1 ton of rice
Straight line because it is a linear relationship between the units of labour used and the car and rice produced.
ECO1000 Principles of Microeconomics
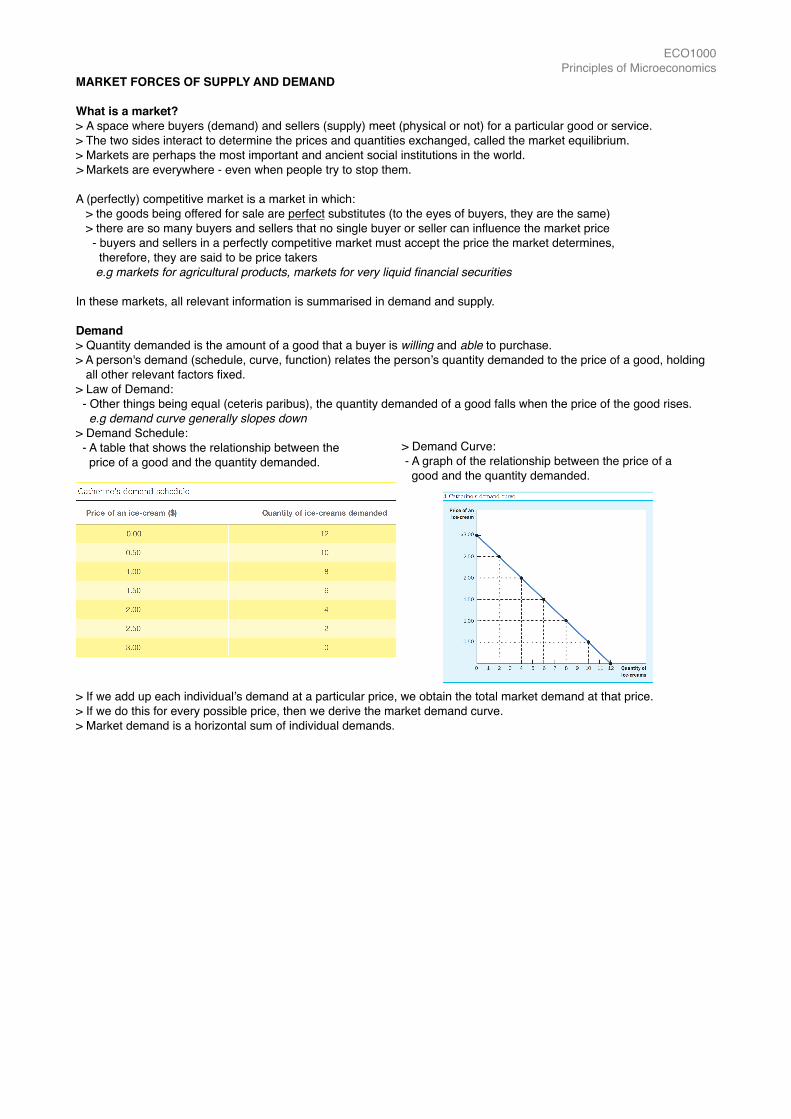
MARKET FORCES OF SUPPLY AND DEMAND What is a market? > A space where buyers (demand) and sellers (supply) meet (physical or not) for a particular good or service. > The two sides interact to determine the prices and quantities exchanged, called the market equilibrium. > Markets are perhaps the most important and ancient social institutions in the world. > Markets are everywhere - even when people try to stop them.A (perfectly) competitive market is a market in which: > the goods being offered for sale are perfect substitutes (to the eyes of buyers, they are the same) > there are so many buyers and sellers that no single buyer or seller can influence the market price - buyers and sellers in a perfectly competitive market must accept the price the market determines, therefore, they are said to be price takers e.g markets for agricultural products, markets for very liquid financial securities In these markets, all relevant information is summarised in demand and supply. Demand > Quantity demanded is the amount of a good that a buyer is willing and able to purchase. > A person's demand (schedule, curve, function) relates the person’s quantity demanded to the price of a good, holding all other relevant factors fixed. > Law of Demand: - Other things being equal (ceteris paribus), the quantity demanded of a good falls when the price of the good rises. e.g demand curve generally slopes down > Demand Schedule: - A table that shows the relationship between the price of a good and the quantity demanded.
> If we add up each individual’s demand at a particular price, we obtain the total market demand at that price. > If we do this for every possible price, then we derive the market demand curve. > Market demand is a horizontal sum of individual demands.
> Demand Curve: - A graph of the relationship between the price of a good and the quantity demanded.