Phys 6715 - Biomedical Physics Raman tweezers and Raman microscopy for single call analysis Yong qing Li PhD for single call analysis Yong-qing Li, PhD Department of Physics, East Carolina University Greenville, NC 27858, USA 1 Email: [email protected]
Transcript
Phys 6715 - Biomedical Physics
Raman tweezers and Raman microscopy
for single call analysis
Yong qing Li PhD
for single call analysis
Yong-qing Li, PhD
Department of Physics, East Carolina Universityepa e o ys cs, as Ca o a U e s yGreenville, NC 27858, USA
Mi fl idi LTRSMicrofluidic LTRSCombination of phase contrast & fluorescence microscopyMulti-trap LTRSRapid confocal Raman imagingMultifocus confocal Raman microspectroscopy
III Biological applicationsIII. Biological applicationsMonitoring of single cell dynamics: bacterial spore germination, wet-heat inactivation and response to high vacuumRaman sorting and flow cytometry: cells and chromosomesBiosensing: identification and detection of microorganismsBiotech: probing recombinant proteins produced in transgenic
2
p g p p gcellsMedical: cancer cells, virus-infection and thalassemia
I) Introduction: single cell l i i l tianalysis in real-time
- Population analysis: most of cellular and molecular analyses b d bl f llare based on an ensemble of cells.
• Need large number of cells• Slow response due to cultureSlow response due to culture• But 99% microbes cannot be cultured• Report average results
- Needs for single cell analysis:• Monitor dynamic processes of individual cell in real-time.
E l h i i di id l ll• Explore heterogeneity among individual cells.• Measure features of individual cell that are masked by
population measurement.
3
p p
What do we concern about single ll ?cells?
Single atoms: energy levels (structure) velocitySingle atoms: energy levels (structure), velocity (temperature), atom-atom interaction, atom-environment (light, EM, cavity) interaction … 0 1 nm( g , , y)
Single cells:
0.1 nm
- chemical composition, spatial distribution of different molecules (structure)
- key molecules that control the cell’s function & signal y gtransduction
- cellular heterogeneity. Is each cell the same? cell cell & cell environment interactions (light 1
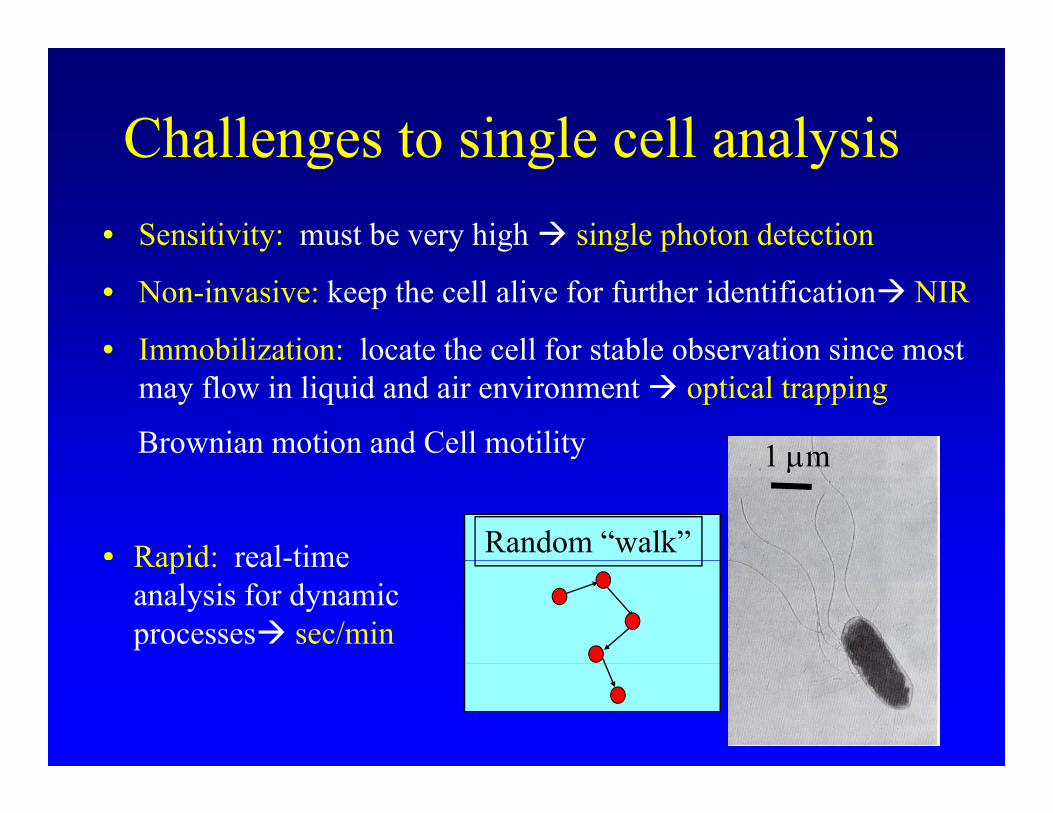
Challenges to single cell analysisChallenges to single cell analysis• Sensitivity: must be very high single photon detection
• Non-invasive: keep the cell alive for further identification NIR
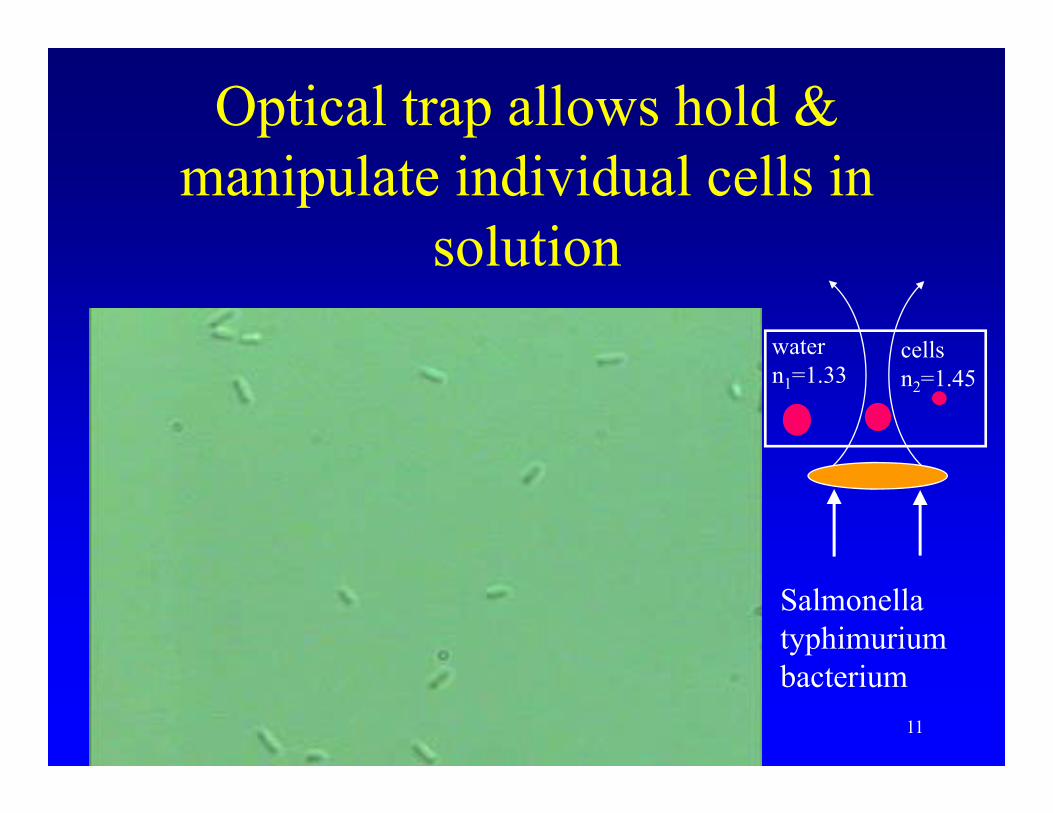
• Immobilization: locate the cell for stable observation since mostImmobilization: locate the cell for stable observation since most may flow in liquid and air environment optical trapping
1 μmBrownian motion and Cell motility
Random “walk”
1 μmy
• Rapid: real-timeRapid: real-time analysis for dynamic processes sec/min
5
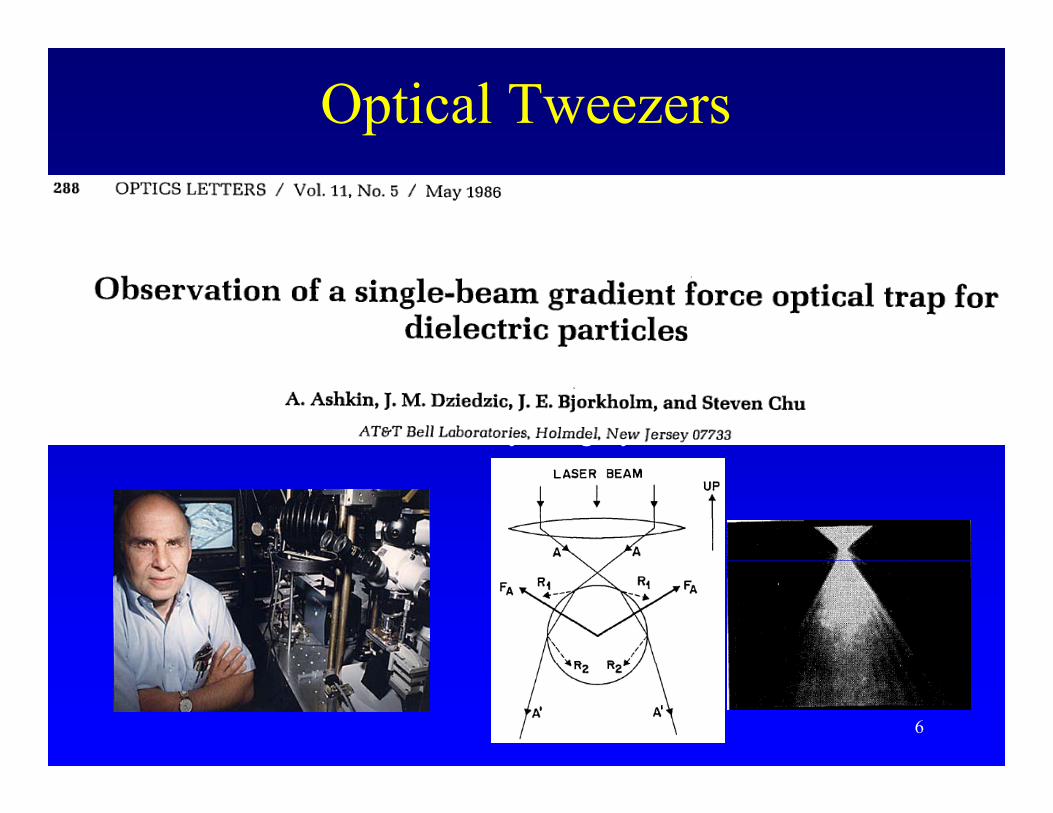
Optical Tweezers
Optical tweezers is a three-Optical tweezers is a three-dimensional optical trap formed by a highly focused laser beam.
6
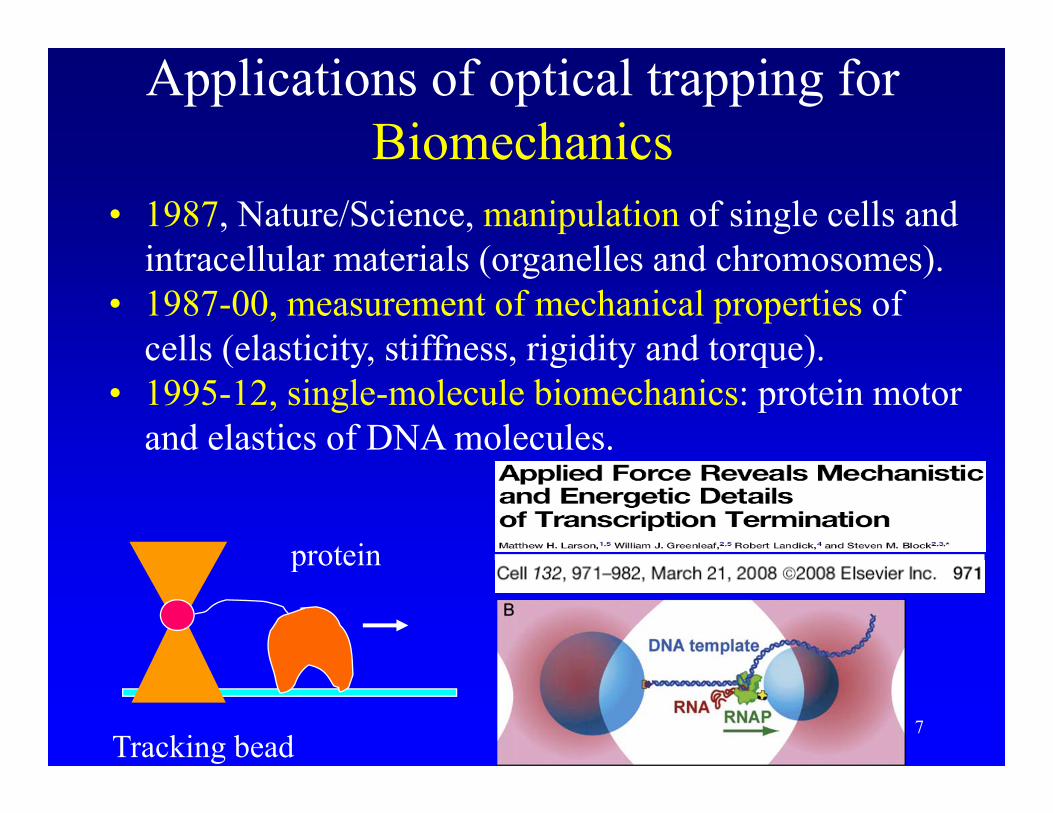
Applications of optical trapping for BiomechanicsBiomechanics
• 1987, Nature/Science, manipulation of single cells and i t ll l t i l ( ll d h )intracellular materials (organelles and chromosomes).
• 1987-00, measurement of mechanical properties of cells (elasticity stiffness rigidity and torque)cells (elasticity, stiffness, rigidity and torque).
• 1995-12, single-molecule biomechanics: protein motor and elastics of DNA molecules.
proteinprotein
7Tracking bead
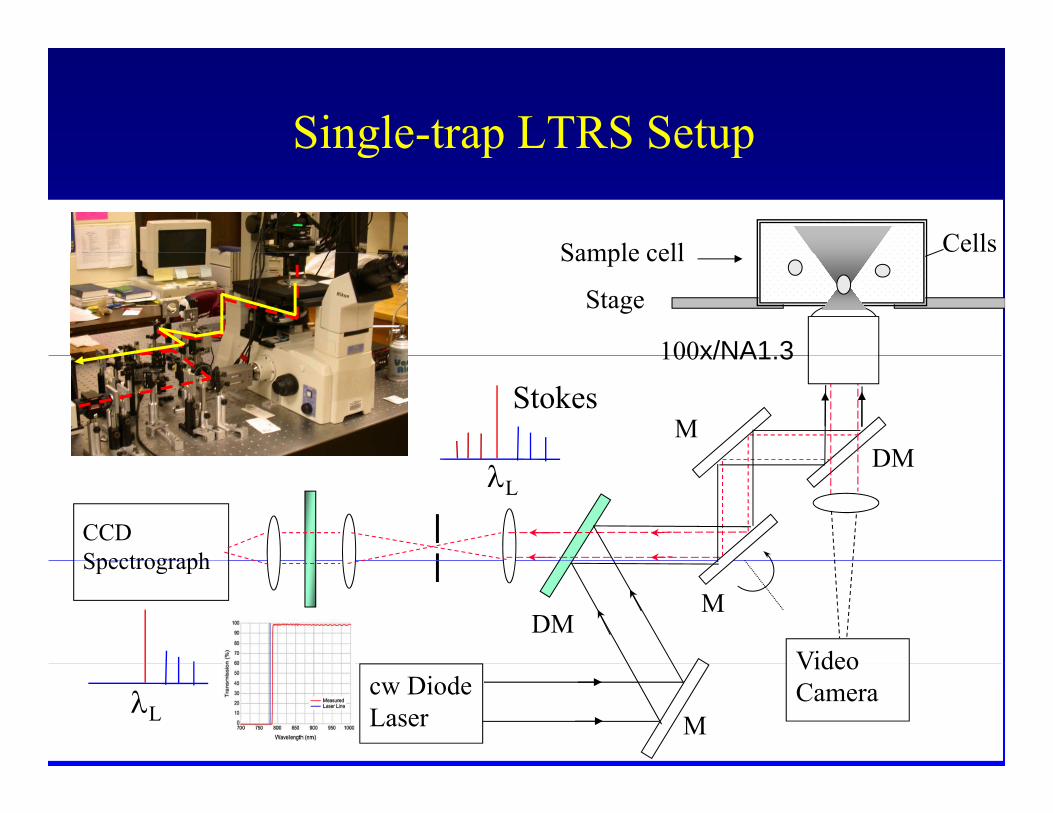
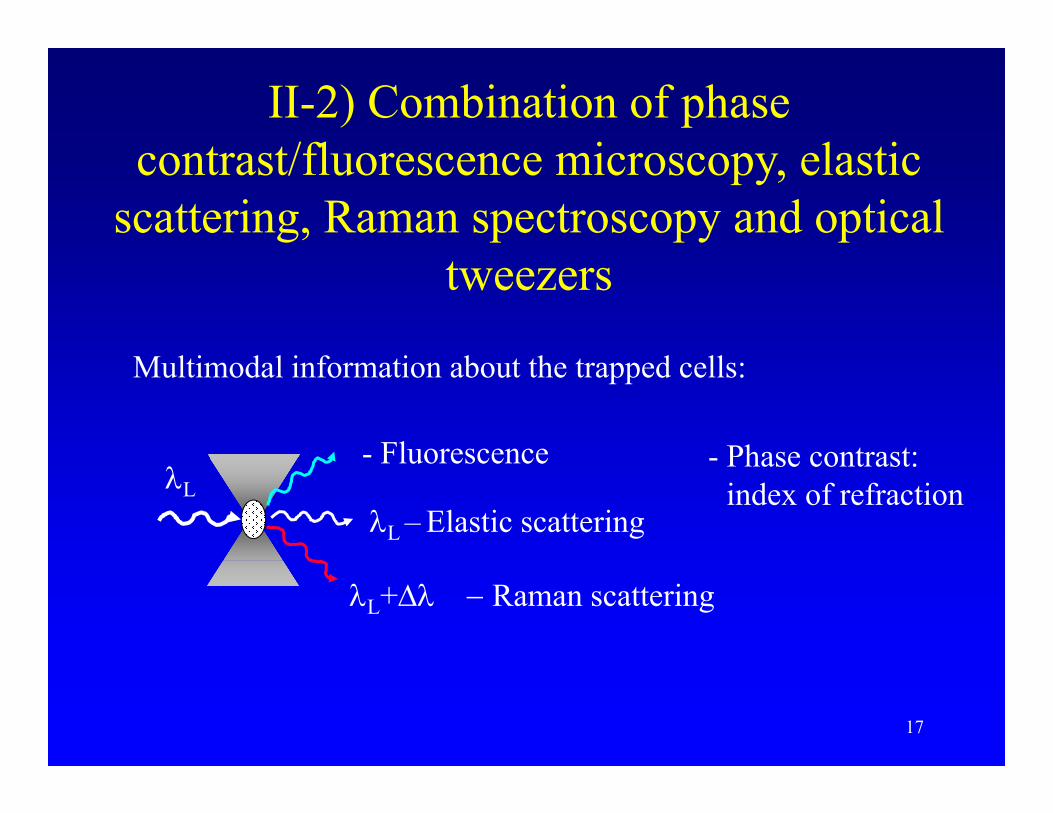
Raman spectroscopy combined with optical tweezers allows analyzing Biochemical Properties of single cells
i diin aqueous media
Laser can not only control the cell, but also analyze the
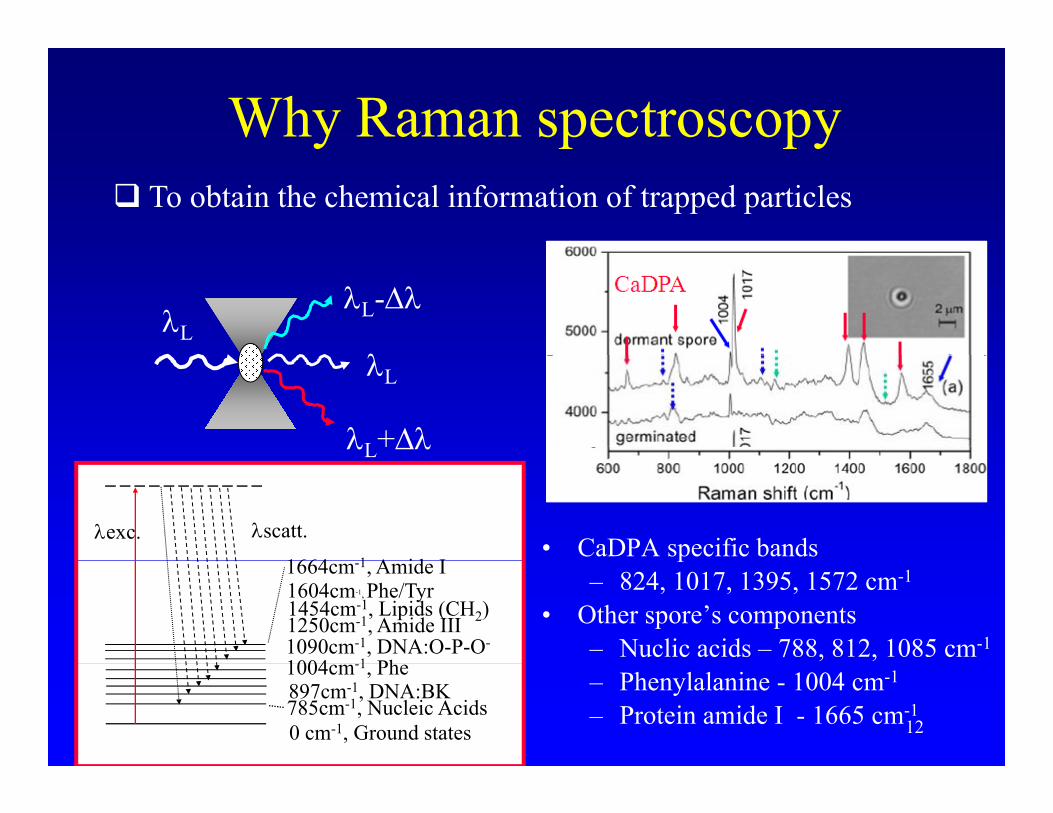
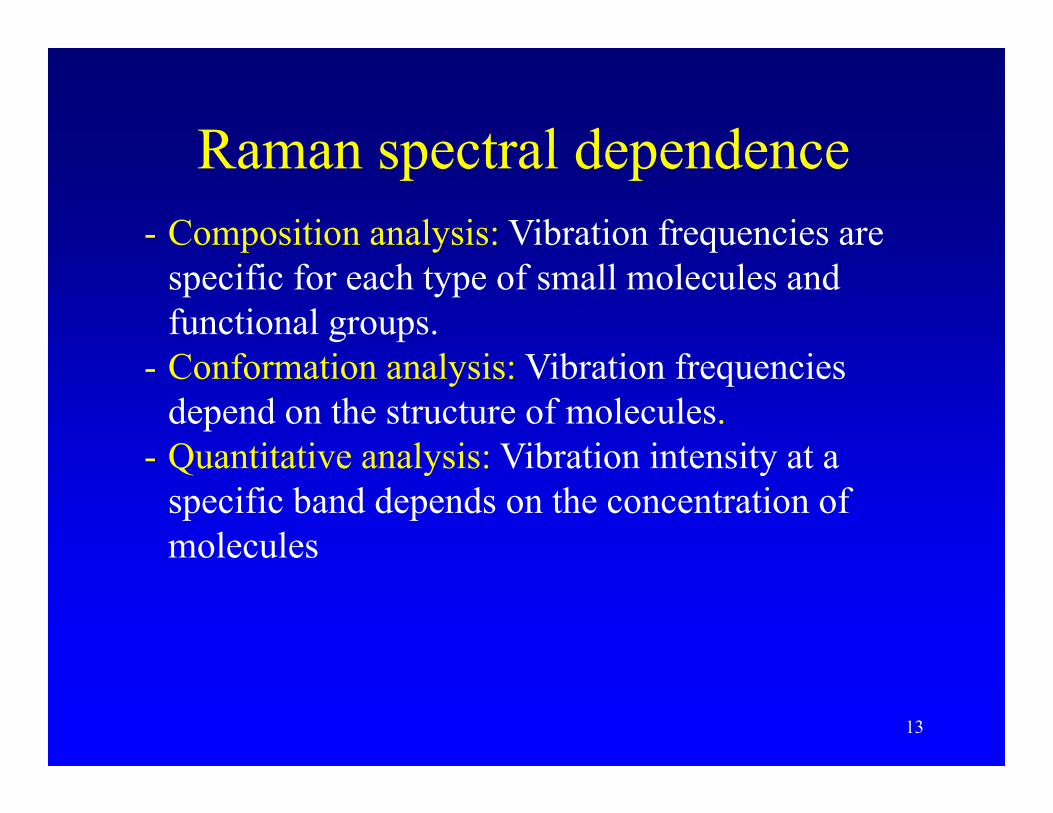
Raman spectral dependenceRaman spectral dependence- Composition analysis: Vibration frequencies are
specific for each type of small molecules and functional groups.C f i l i Vib i f i- Conformation analysis: Vibration frequencies depend on the structure of molecules. Quantitative analysis: Vibration intensity at a- Quantitative analysis: Vibration intensity at a specific band depends on the concentration of molecules
13
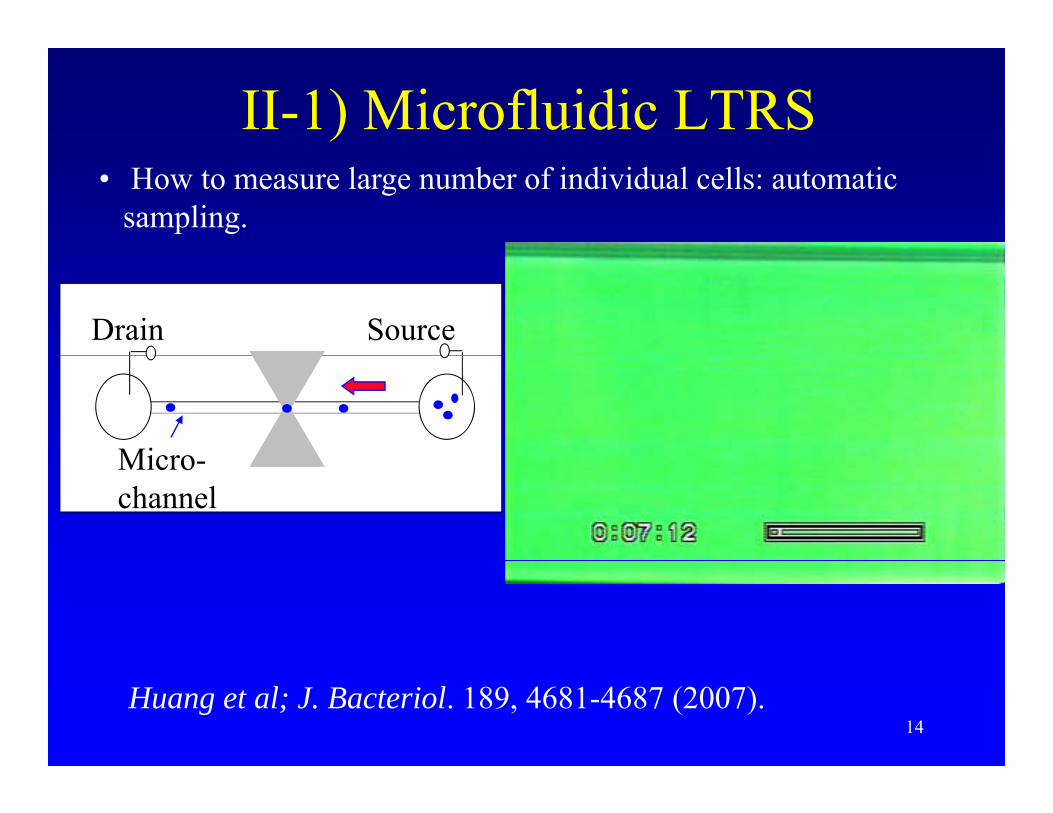
II-1) Microfluidic LTRS• How to measure large number of individual cells: automatic
sampling.
SourceDrain
MicroMicro-channel
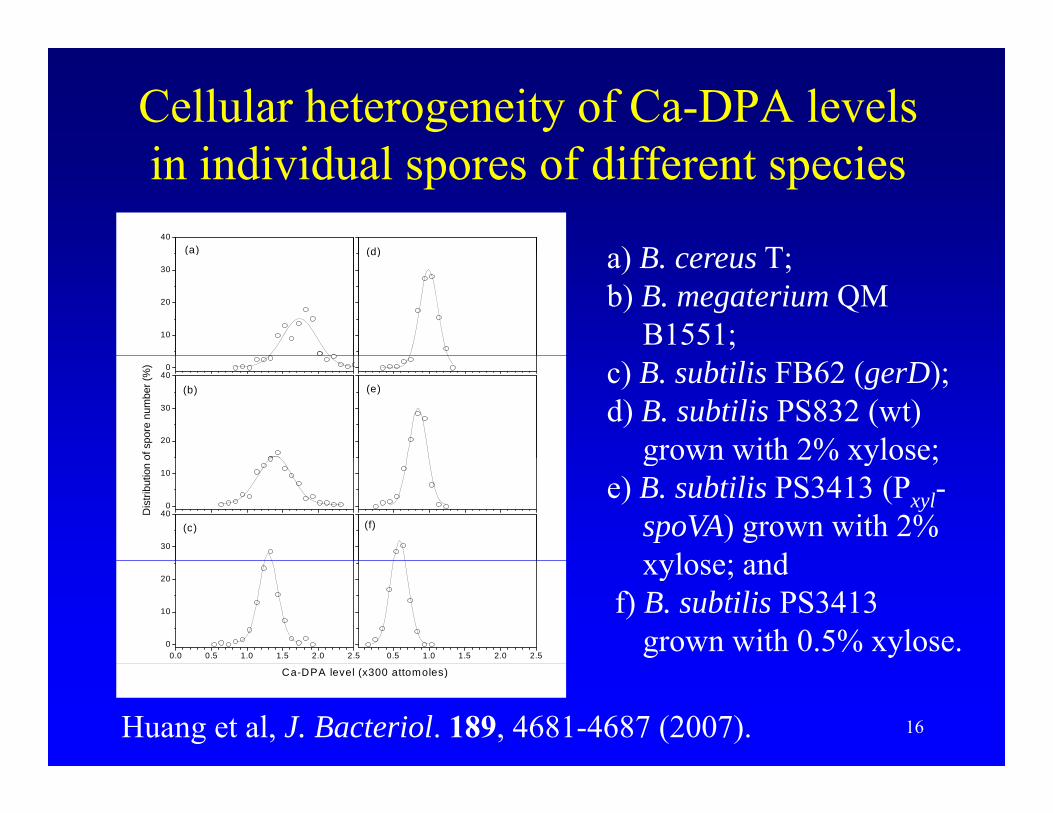
14Huang et al; J. Bacteriol. 189, 4681-4687 (2007).
Diagnosis of thalassamia: Hemoglobin heterogeneity - α- and β-thalassemiaα and β thalassemia I1545/I1450 Histogram
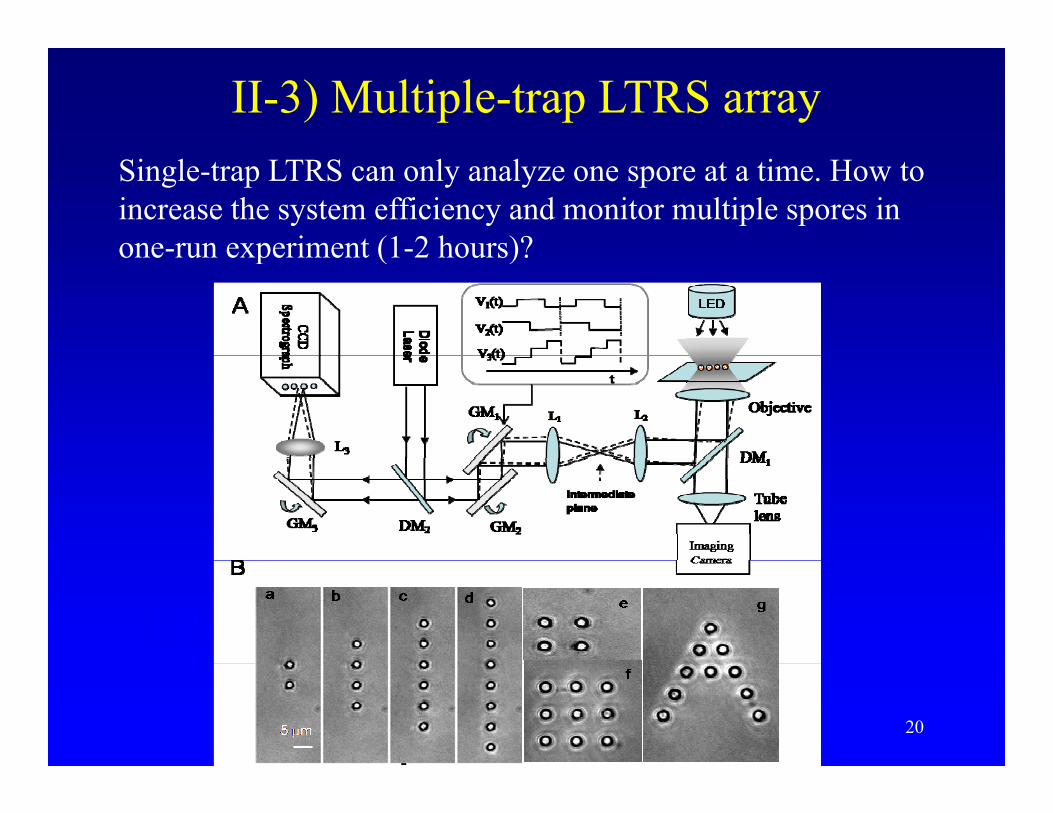
II-3) Multiple-trap LTRS arraySingle-trap LTRS can only analyze one spore at a time. How to increase the system efficiency and monitor multiple spores in one-run experiment (1-2 hours)?one run experiment (1 2 hours)?
1-D array2-D array
20
2-D array
21
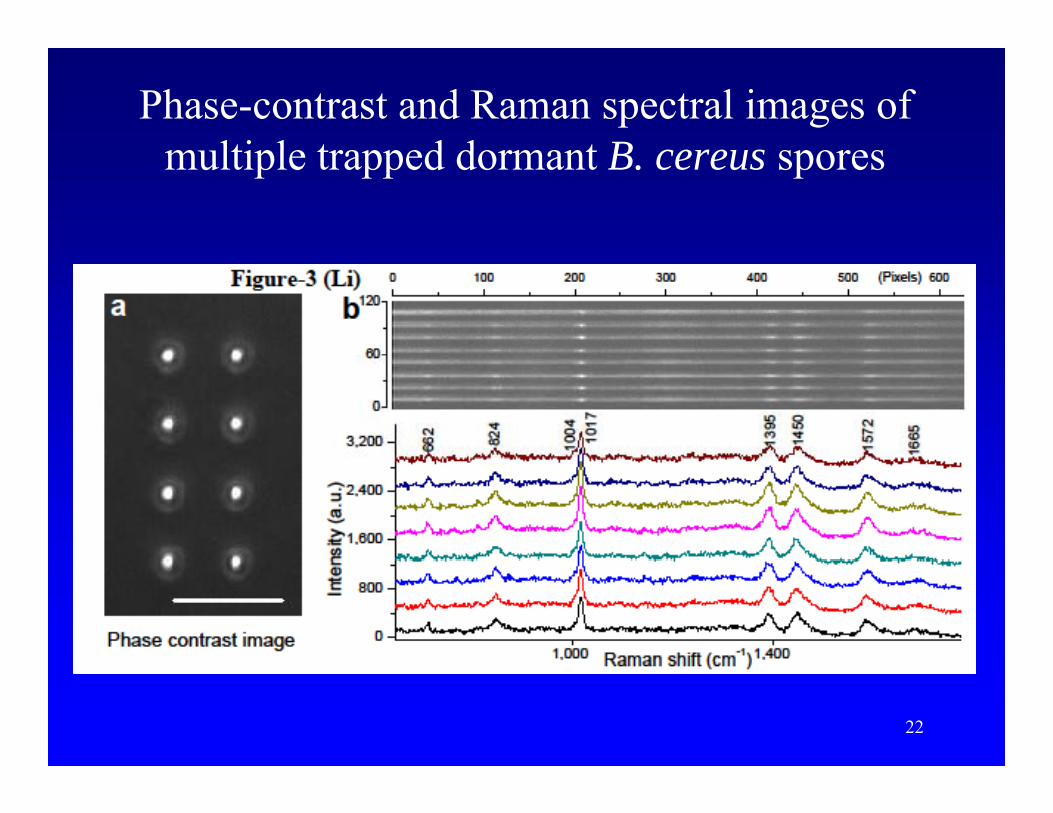
Phase-contrast and Raman spectral images of m ltiple trapped dormant B sporesmultiple trapped dormant B. cereus spores
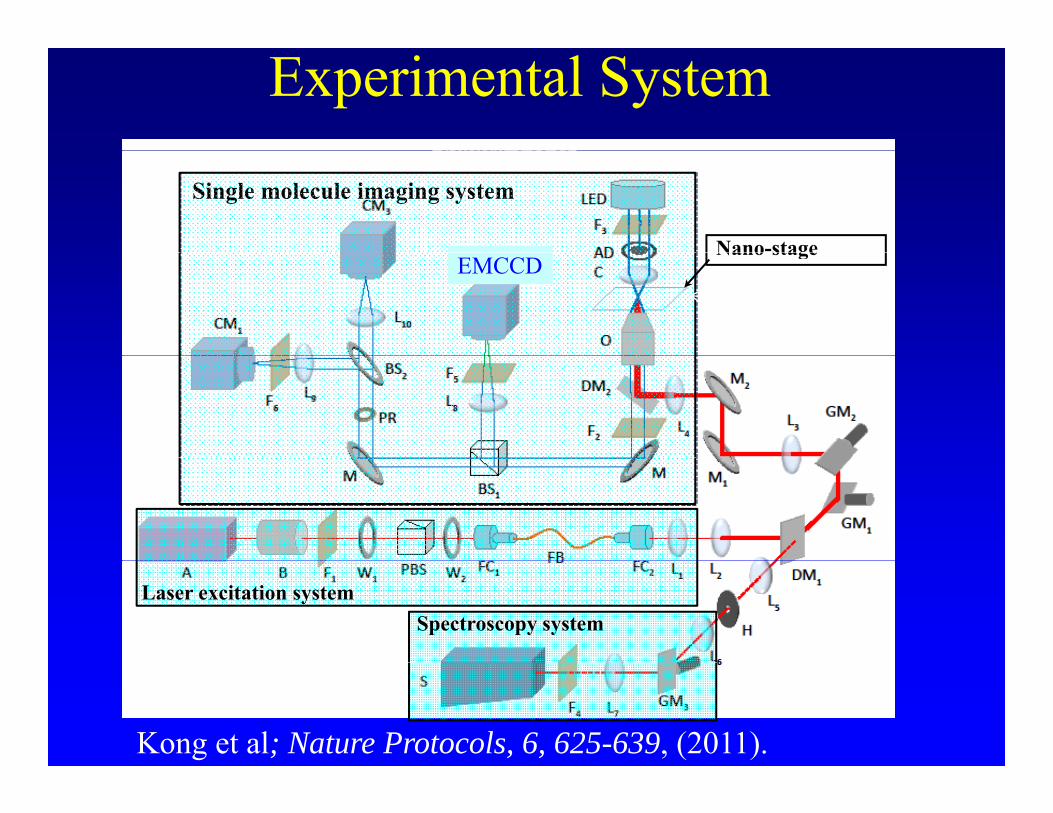
22Nat. Prot.2011, 6, 625-639.
Monitoring four trapped B. cereus spores germinating in 10 mM L alanine 25 mM Tris buffer and 0 5 μMin 10 mM L-alanine, 25 mM Tris buffer and 0.5 μM
SYTO 16 using LTRS array
23
Advantages of LTRSg• Allow capture and analysis of single or multiple individual
living in aqueous environmentliving in aqueous environment.
• Identify by molecular vibration. No fluorescent label is needed generally.needed generally.
• High sensitivity (confocal excitation and collection).
R id ( i b ti l ti )• Rapid response (no incubation, no sample preparation).
• Non-invasive to the cells (no adding chemicals, no breaking the cells low absorption in NIR)breaking the cells, low absorption in NIR).
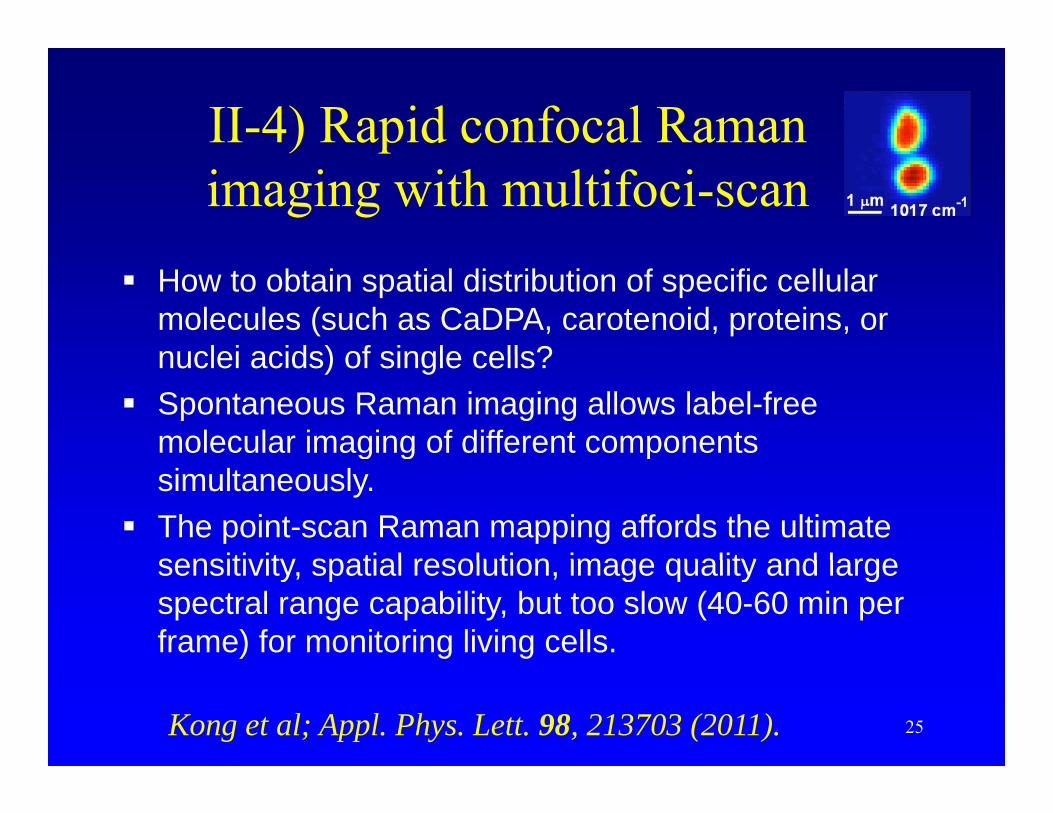
II-4) Rapid confocal Raman ) pimaging with multifoci-scan
How to obtain spatial distribution of specific cellular molecules (such as CaDPA, carotenoid, proteins, or nuclei acids) of single cells?nuclei acids) of single cells?Spontaneous Raman imaging allows label-free molecular imaging of different components g g psimultaneously. The point-scan Raman mapping affords the ultimate sensitivity spatial resolution image quality and largesensitivity, spatial resolution, image quality and large spectral range capability, but too slow (40-60 min per frame) for monitoring living cells.
25Kong et al; Appl. Phys. Lett. 98, 213703 (2011).
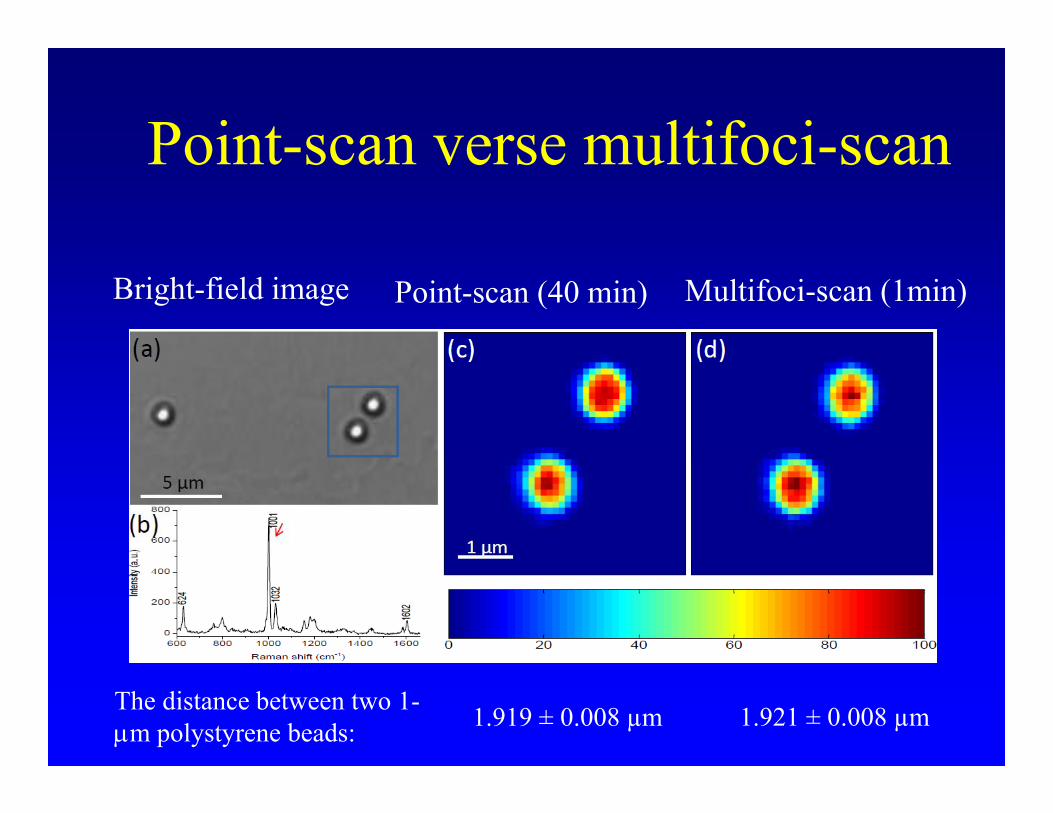
Multifoci-scan confocal Raman microscopy
Synchro multifoci-scan allows acquiring 40-80 spectra simultaneouslySynchro multifoci-scan allows acquiring 40-80 spectra simultaneously while retaining point-scan resolution. The image acquisition time is 40-80 times faster.
The distance between two 1-μm polystyrene beads: 1.919 ± 0.008 µm 1.921 ± 0.008 µm
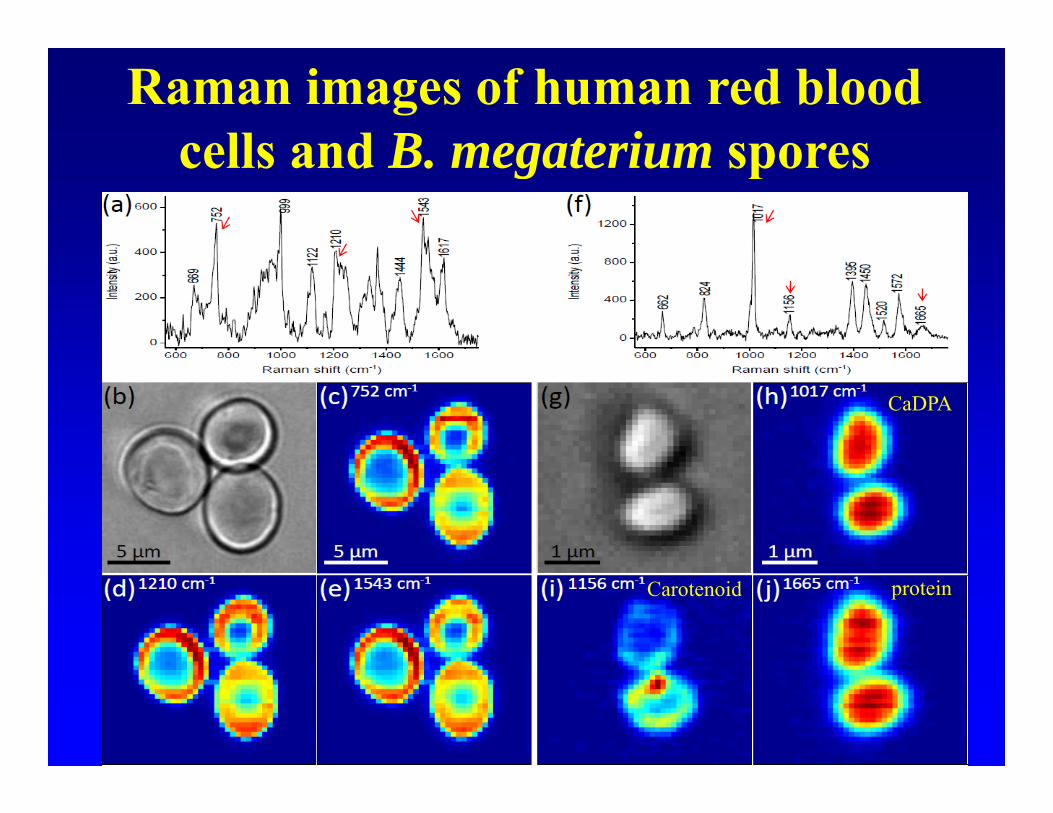
Raman images of human red blood cells and B megaterium sporescells and B. megaterium spores
CaDPA
Carotenoid protein
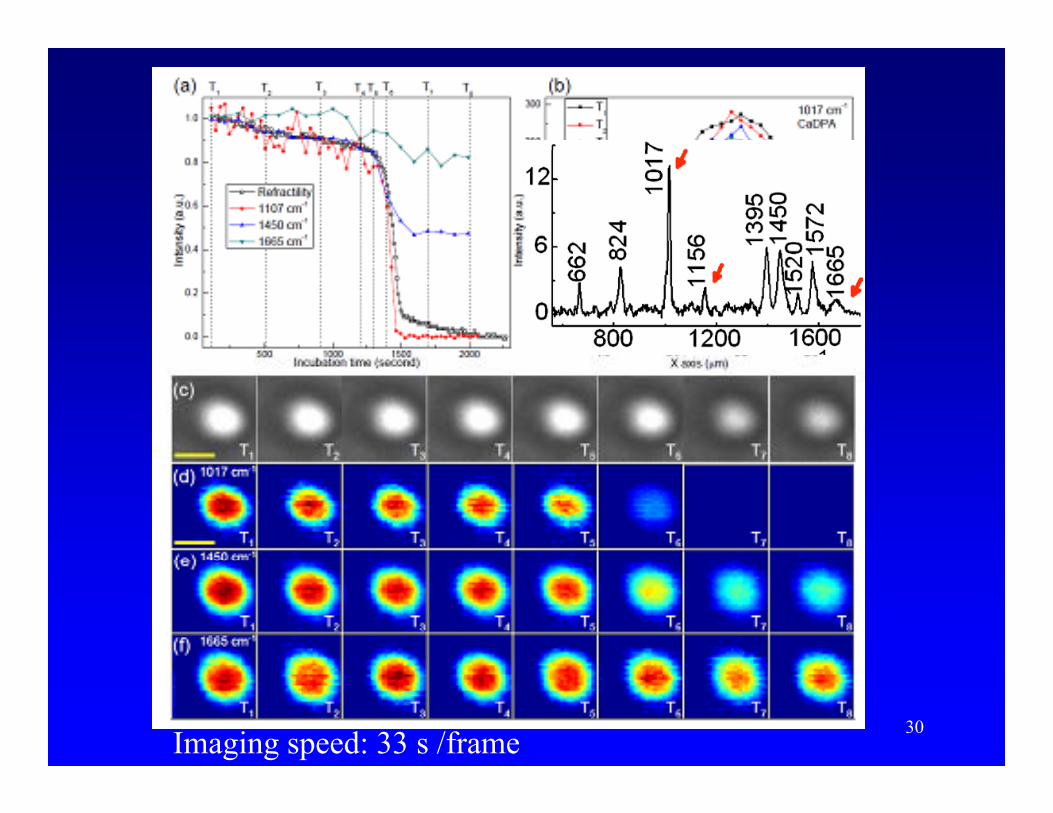
30Imaging speed: 33 s /frame
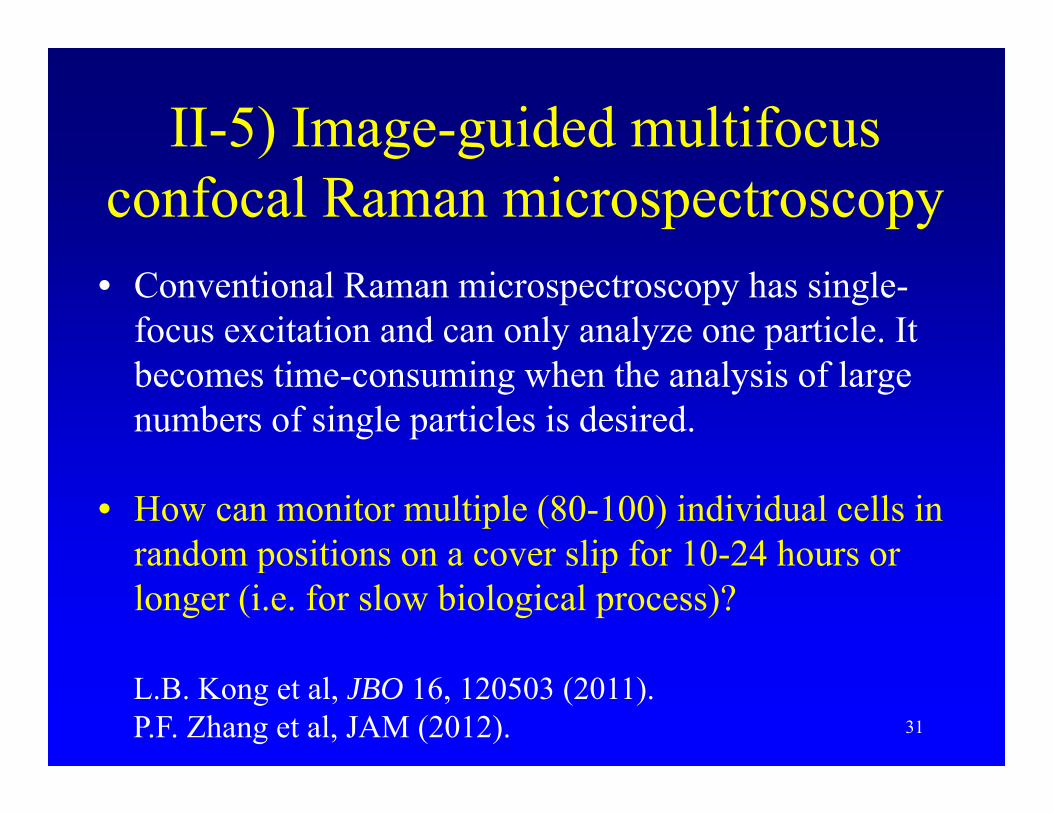
II-5) Image-guided multifocus) g gconfocal Raman microspectroscopy• Conventional Raman microspectroscopy has single-
focus excitation and can only analyze one particle. It becomes time-consuming when the analysis of large numbers of single particles is desired.
• How can monitor multiple (80-100) individual cells in random positions on a cover slip for 10-24 hours orrandom positions on a cover slip for 10 24 hours or longer (i.e. for slow biological process)?
31
L.B. Kong et al, JBO 16, 120503 (2011).P.F. Zhang et al, JAM (2012).
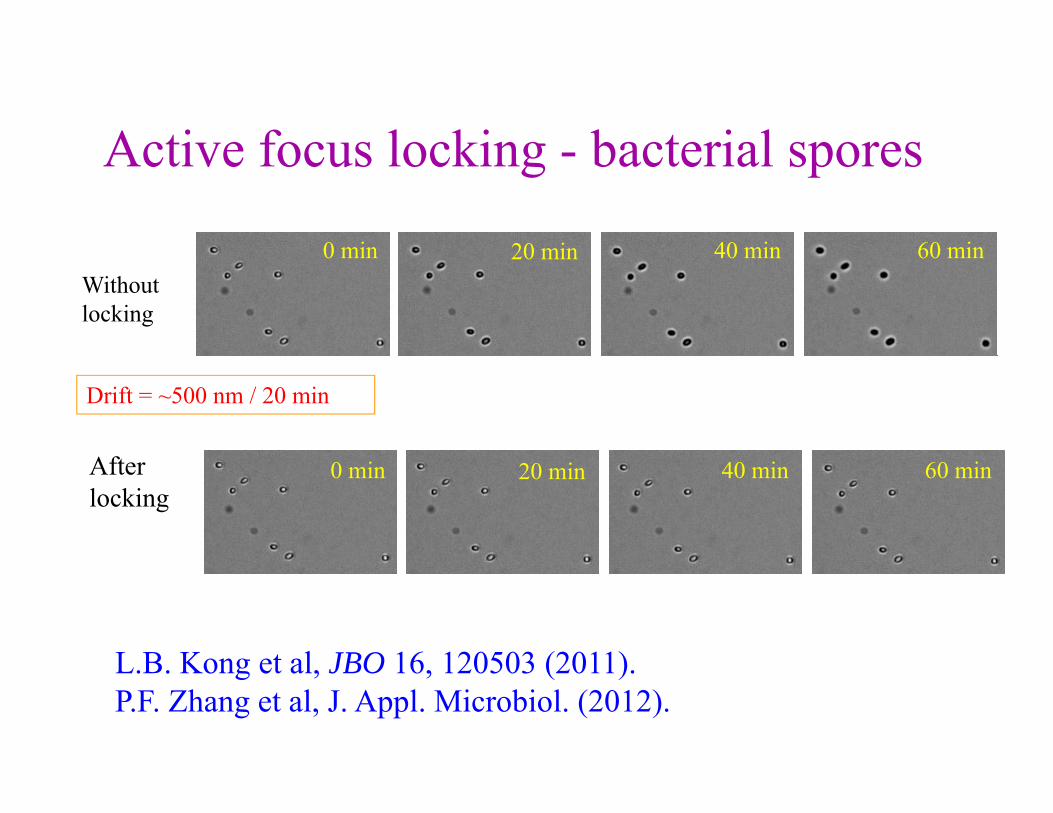
There are two challengesg1) Microscope stabilization in z-
di ti (f i ) d di ti0 min
direction (focusing) and x-y direction (stage horizontal movement) over >60 min is required 100-200 nm>60 min is required. 100 200 nm drift will cause Raman signal significantly reduction. 60 min
2) Precisely targeting laser focus to h f l i l i l deach of multiple particles at random
positions and collecting their Raman spectra simultaneously are required Drift ~500 nm / 20
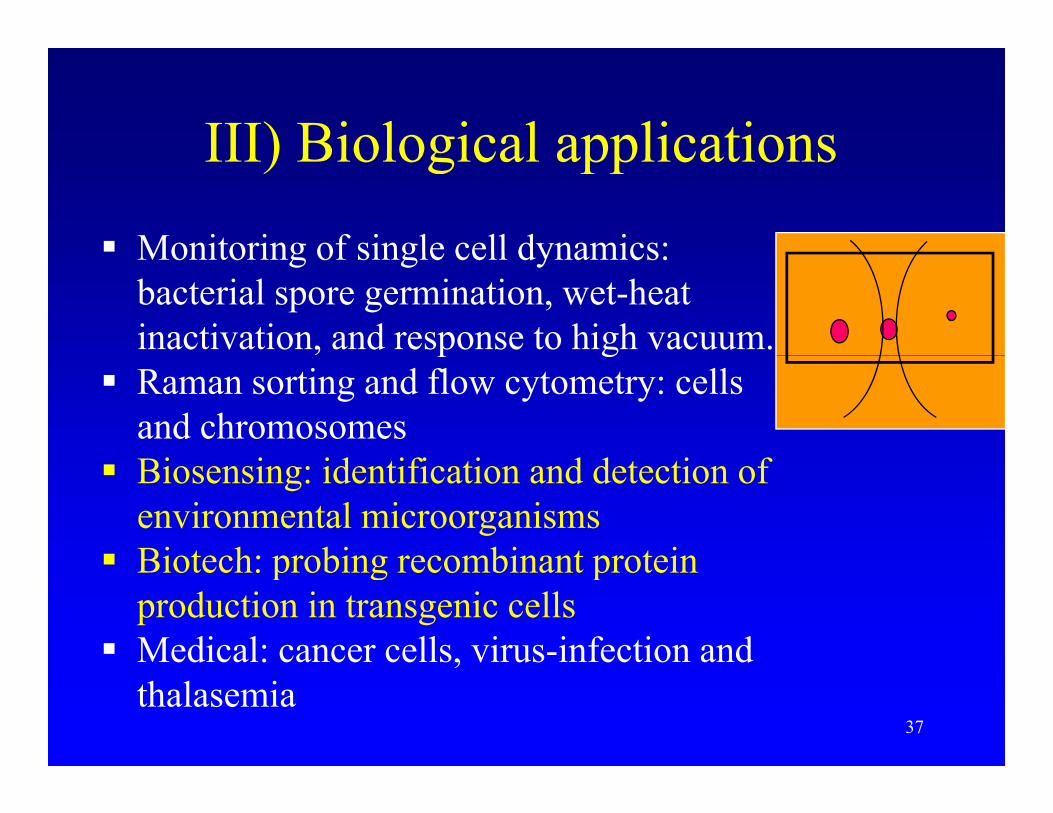
Monitoring of single cell dynamics:Monitoring of single cell dynamics: bacterial spore germination, wet-heat inactivation, and response to high vacuum.p gRaman sorting and flow cytometry: cells and chromosomes
i i id ifi i d d i fBiosensing: identification and detection of environmental microorganismsBiotech: probing recombinant proteinBiotech: probing recombinant protein production in transgenic cellsMedical: cancer cells, virus-infection and
37
,thalasemia
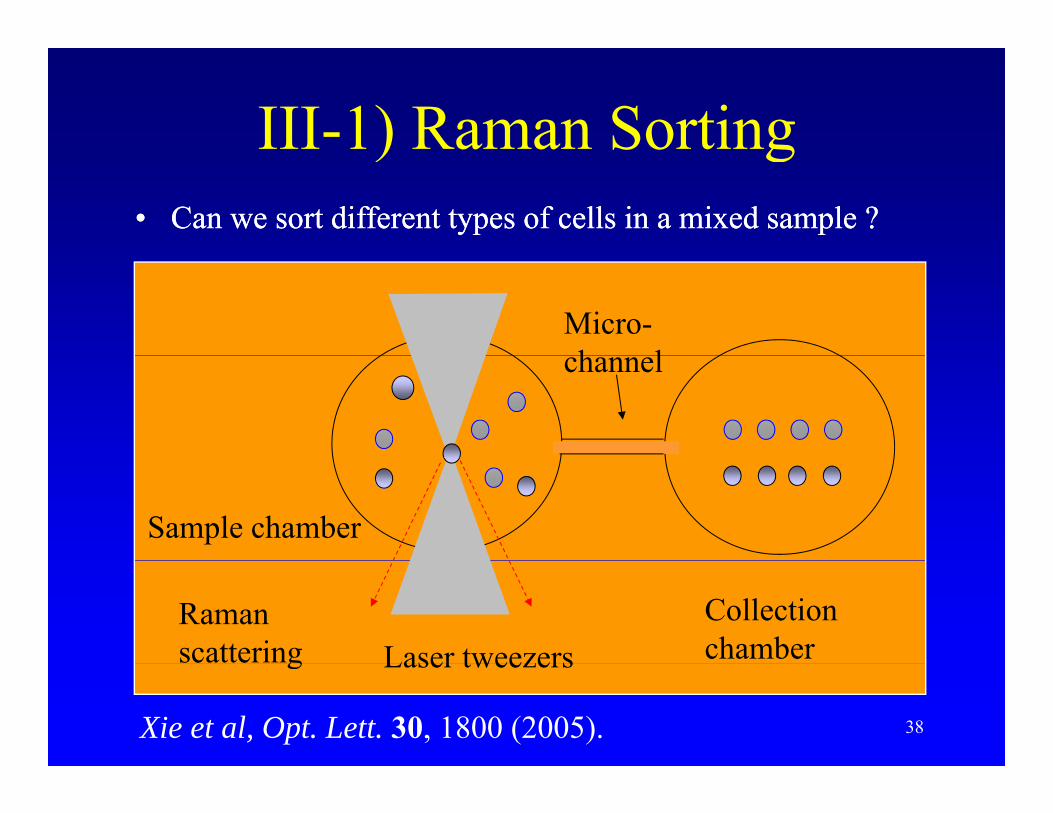
III-1) Raman Sorting) g•• Can we sort different types of cells in a mixed sample ?Can we sort different types of cells in a mixed sample ?
Micro-h lchannel
Sample chamber
Laser tweezersCollection chamber
Raman scattering
38
Laser tweezersg
Xie et al, Opt. Lett. 30, 1800 (2005).
Sorting living yeast cells300
Lipi
ds
efor
med
)
NA
O-P
-O-
1443Living
Cou
nts)
100
200
Am
ide
ITy
r/PheAm
ide
III (d
e
Amid
e III
1262
DN
PheD
NA
bk
Tyr
1660
1604
1305
1124
1085
100589
2858
717
300DeadIn
tens
ity (C
0
7
200
0
100
39
600 800 1000 1200 1400 1600
Raman shift (cm-1)
Staining
Manipulation and discrimination of i l t i d h hsingle unstained human chromosomes
- Capture an unknown chromosomeR i iti- Raman acquisition
- Manipulation- Fixation & G-banding verification
G-banding
Sample reservoir Buffer reservoir Fixed slide Unstained chromosomes of
• Biological: nutrient triggeredBiological: nutrient triggered germination, growth, reproduction, protein
i i i f t dexpression, virus-infected …
Examples include spore germination, heat-i ti ti d ti f bi f l l l t
41inactivation, production of biofuel molecules, yeast fermentation……
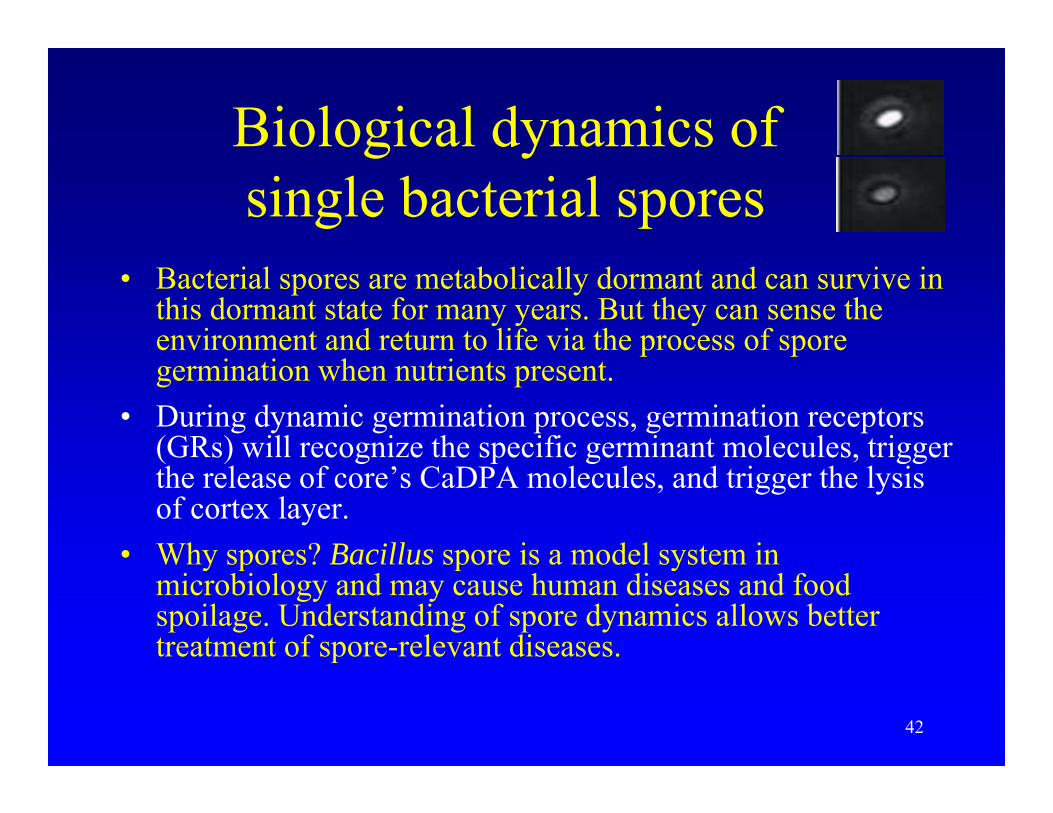
Biological dynamics of g ysingle bacterial spores
• Bacterial spores are metabolically dormant and can survive in this dormant state for many years. But they can sense the environment and return to life via the process of spore p pgermination when nutrients present.
• During dynamic germination process, germination receptors (GRs) will recognize the specific germinant molecules, trigger ( ) g p g , ggthe release of core’s CaDPA molecules, and trigger the lysis of cortex layer.
• Why spores? Bacillus spore is a model system inWhy spores? Bacillus spore is a model system in microbiology and may cause human diseases and food spoilage. Understanding of spore dynamics allows better treatment of spore-relevant diseases.
42
p
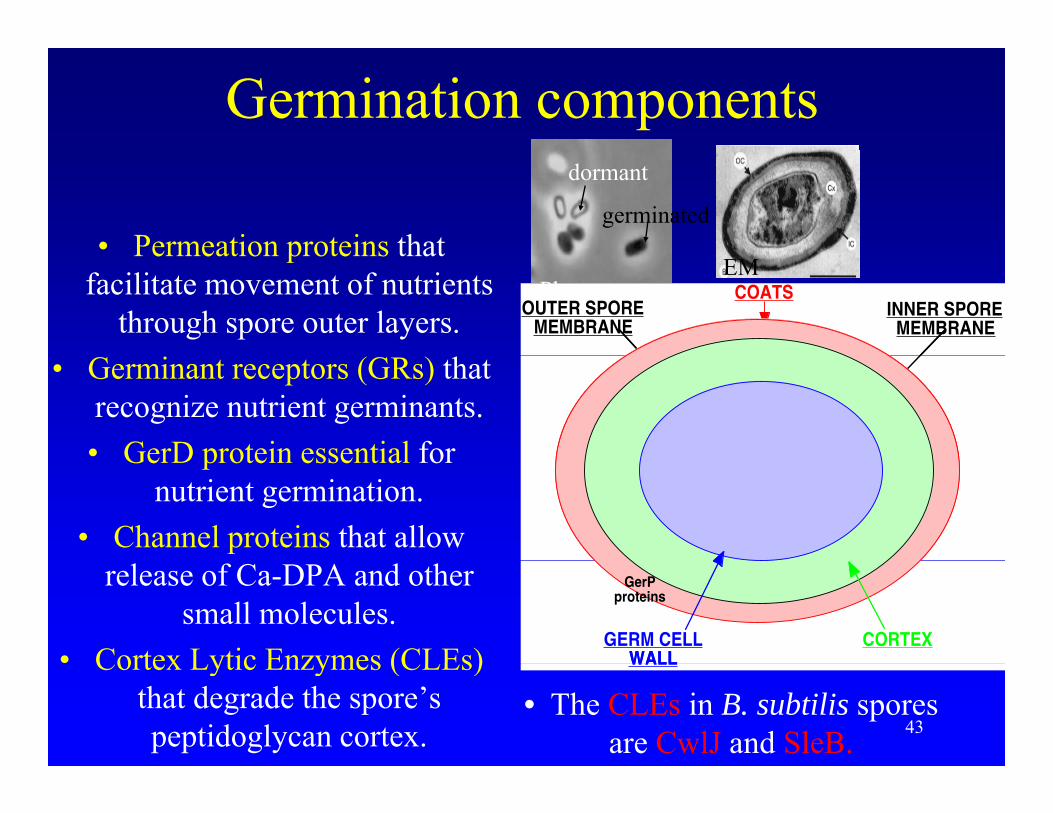
Germination components
• Permeation proteins that
dormant
germinatedPermeation proteins that
facilitate movement of nutrients through spore outer layers.
Phase-contrastEM
• Germinant receptors (GRs) that recognize nutrient germinants.• GerD protein essential forGerD protein essential for
nutrient germination.• Channel proteins that allow
GerD
release of Ca-DPA and other small molecules.
• Cortex Lytic Enzymes (CLEs)
43
Cortex Lytic Enzymes (CLEs) that degrade the spore’s peptidoglycan cortex.
• The CLEs in B. subtilis spores are CwlJ and SleB.
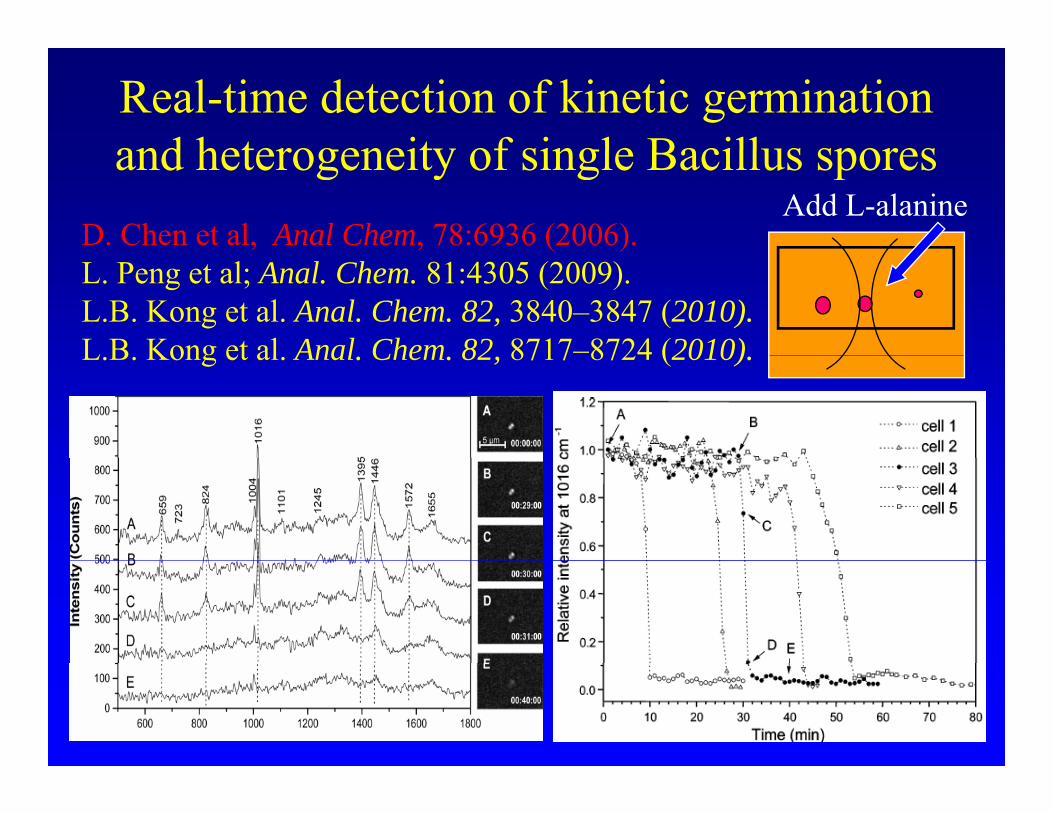
Real-time detection of kinetic germination and heterogeneity of single Bacillus spores
D. Chen et al, Anal Chem, 78:6936 (2006).
and heterogeneity of single Bacillus sporesAdd L-alanine
L. Peng et al; Anal. Chem. 81:4305 (2009).L.B. Kong et al. Anal. Chem. 82, 3840–3847 (2010).L B Kong et al Anal Chem 82 8717–8724 (2010)L.B. Kong et al. Anal. Chem. 82, 8717 8724 (2010).
44
A) Monitoring germination of single B. cereus spores by Raman and phasecereus spores by Raman and phase
contrast/DIC microscopy
Dormant spores appear as bright and d germinated spores as dark.
Based on the change in image intensity the germination of single
dormant
germinated intensity, the germination of single spores was separated into two stages.Stage I is thought as primarily the
germinated
release of the spores’ CaDPA, but not been proven.What is the precise correlationStage I Stage II
45
What is the precise correlation between phase contrast image change and CaDPA release is unclear.
Stage I Stage II
Simultaneous monitoring of L-alanine germination f i l i ll d bof a single optically trapped B. cereus spore by
Raman spectroscopy and PC microscopy
46Kong et al. Anal. Chem. 82, 3840–3847 (2010).
Correspondence between the rapid drop in spore 1. When repeat the experiments with other cells, we
found their responses varied.refractility and complete CaDPA release 2. Some cells response earlier, some later. But
correspondence always exists.
47
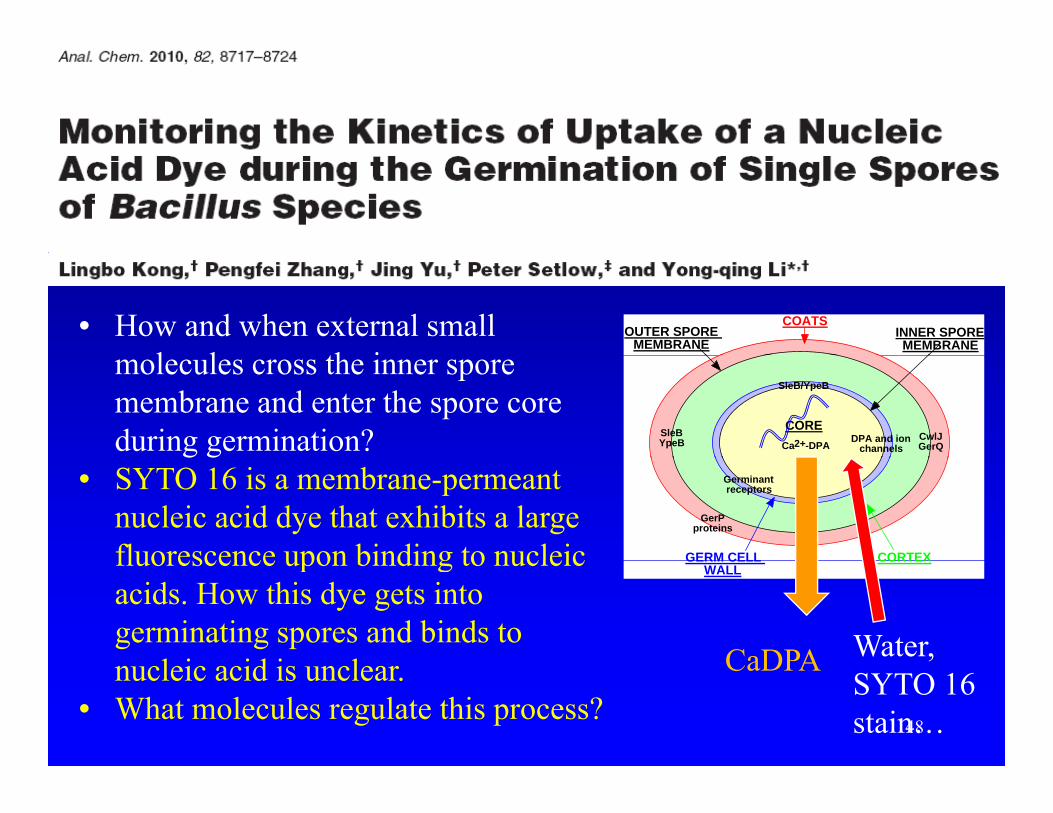
• How and when external small l l th i
COATSOUTER SPORE
MEMBRANEINNER SPOREMEMBRANE
molecules cross the inner spore membrane and enter the spore core during germination?
CORECwlJ GerQ
SleB YpeB
SleB/YpeB
DPA and ion channelsCa2+-DPA
• SYTO 16 is a membrane-permeant nucleic acid dye that exhibits a large fluorescence upon binding to nucleic CORTEXGERM CELL
Germinant receptors
GerP proteins
fluorescence upon binding to nucleic acids. How this dye gets into germinating spores and binds to
l i id i l
CORTEXGERM CELL WALL
CaDPA Water,
48
nucleic acid is unclear. • What molecules regulate this process?
CaDPASYTO 16 stain…
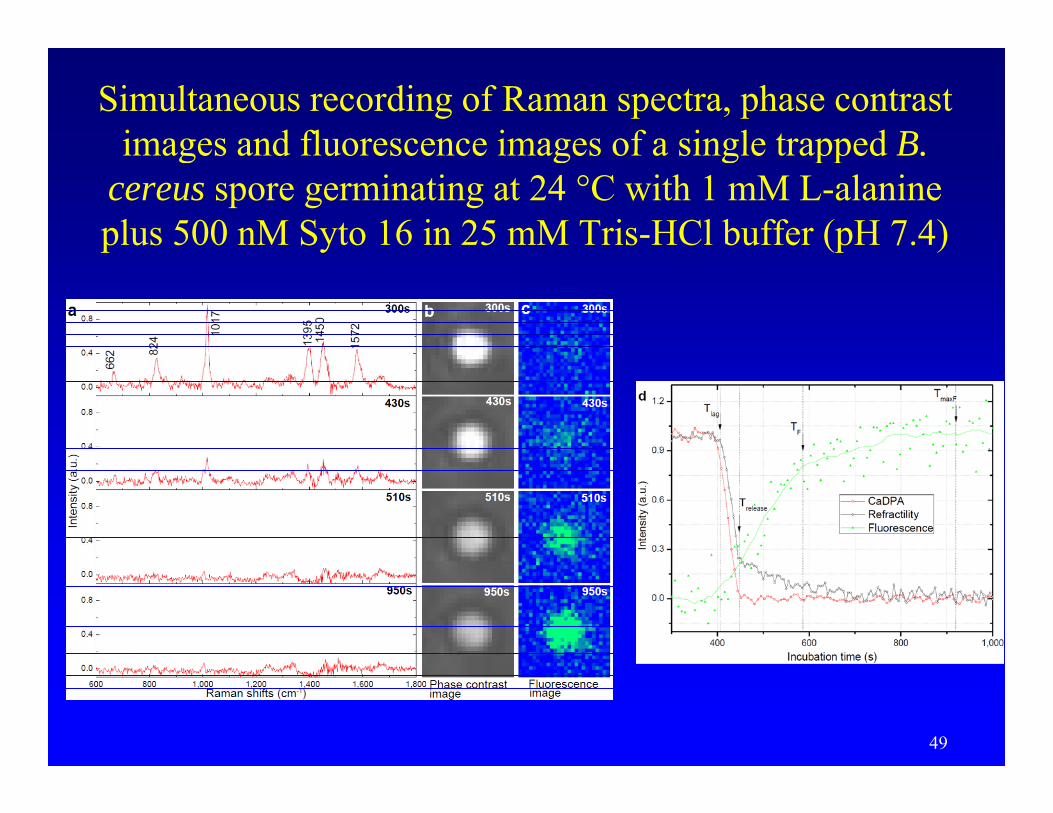
Simultaneous recording of Raman spectra, phase contrast images and fluorescence images of a single trapped Bimages and fluorescence images of a single trapped B.
cereus spore germinating at 24 °C with 1 mM L-alanine plus 500 nM Syto 16 in 25 mM Tris-HCl buffer (pH 7.4)
49
Results obtained• During nutrient germination SYTO 16 began to enter the
spore core and bind to nucleic acids just when spores had released all CaDPA, and continued until hydrolysis of spores’ peptidoglycan cortex was complete.Th ti b t th dditi f t i t i t• The time between the addition of nutrient germinants and the rapid uptake of individual spores is highly heterogeneous in a populationheterogeneous in a population.
50
C) Characterization of thermal inactivation of single spores by wet heatinactivation of single spores by wet heat• Goal: to study aspects of the release of Ca-dipicolinic y
acid (DPA), protein denaturation and cellular heterogeneity during treatment of single Bacillus spores with wet heat
High Tempwith wet heat
51Real-time Raman, ELS, PC or DIC imaging…
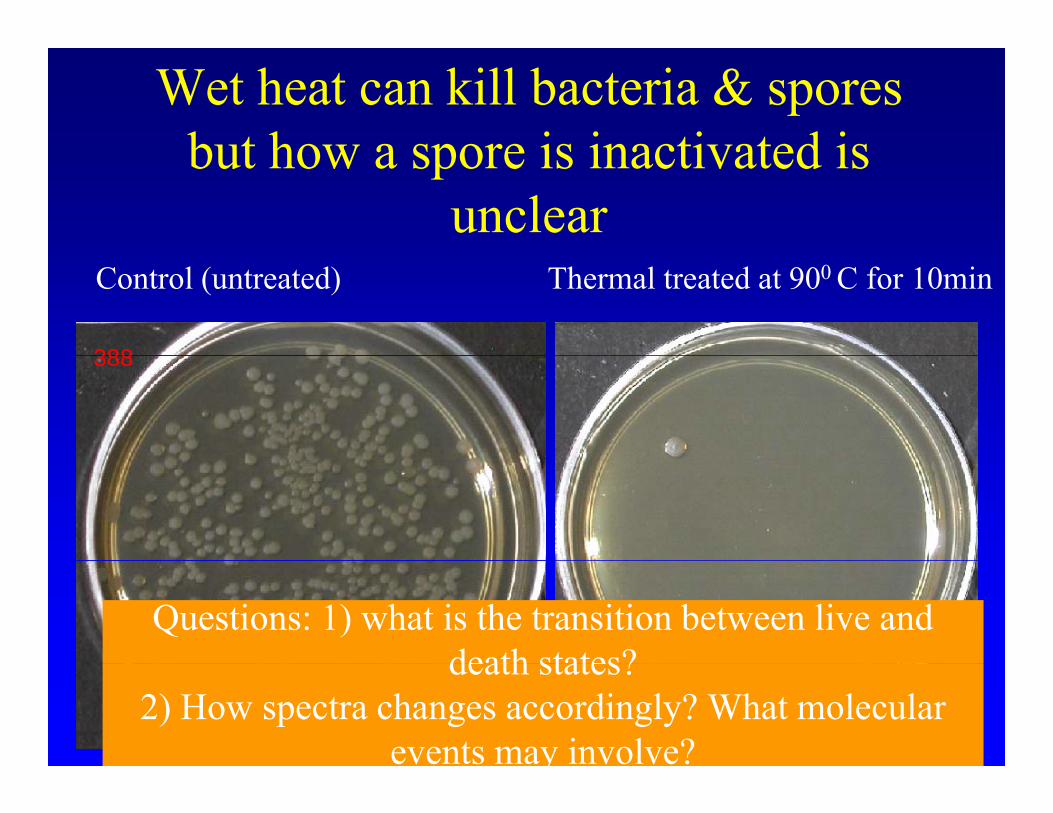
Wet heat can kill bacteria & spores but how a spore is inactivated isbut how a spore is inactivated is
unclear
388
Control (untreated) Thermal treated at 900 C for 10min
388
Questions: 1) what is the transition between live and death states?
52
death states?2) How spectra changes accordingly? What molecular
events may involve?
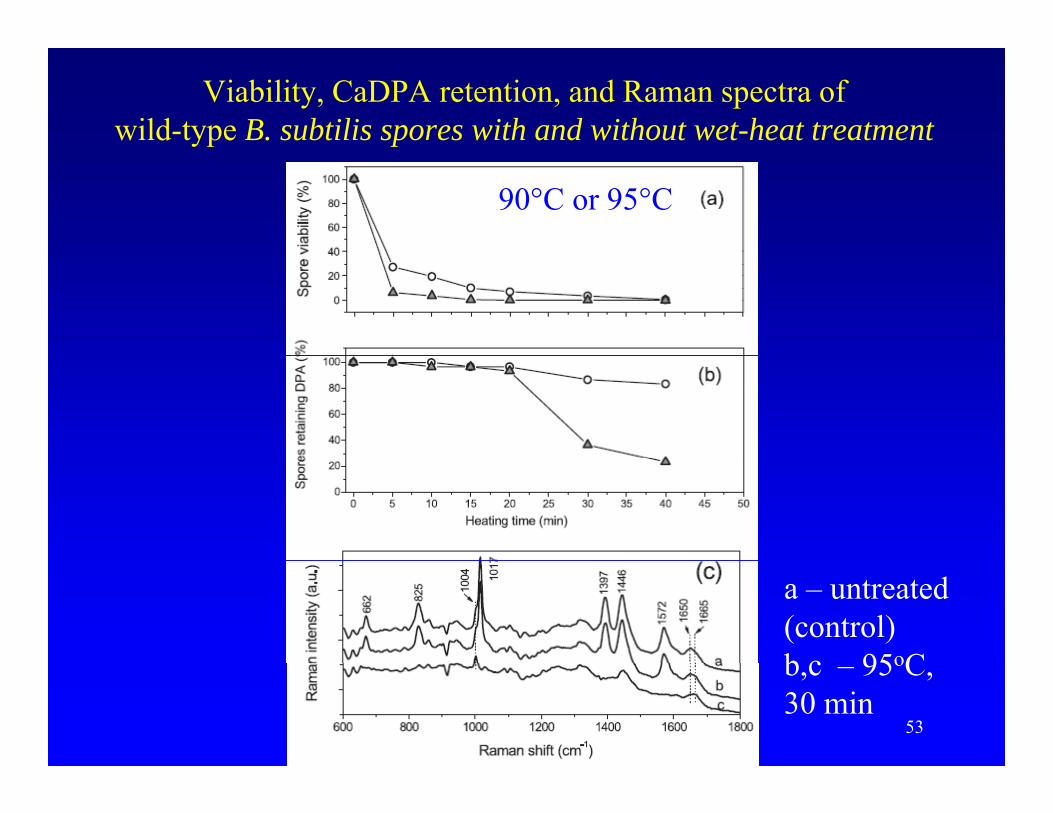
Viability, CaDPA retention, and Raman spectra ofwild-type B. subtilis spores with and without wet-heat treatment
90°C or 95°C
a – untreated (control)b c 95oC
53
b,c – 95oC, 30 min
Single B. cereus spores heat-treated at 90oC
DPA
2 8 min protein2.8 min
6.5 min7.8 min
30 minNucleic acid
Results: 1) DPA band dropped rapidly at a specific time trelease.
54APPL. ENVIRON. MICROBIOL. 77, 4757 (2011).
release2) Protein band shifted prior to DPA released, indicating
denaturation.
Heterogeneity of individual spores i ti t d b t h tinactivated by wet heat
1) Some spores release DPA earlier, some later.
2) There are always a very small percentage of spores retaining their DPA superdormant/hard to killDPA – superdormant/hard to kill.
3) Why some spores easy to kill, some difficult is unknown, but may related to
DPA level contained.
55
Zhang et al, Appl. Environ. Microbiol. 76, 1796–1805 (2010).
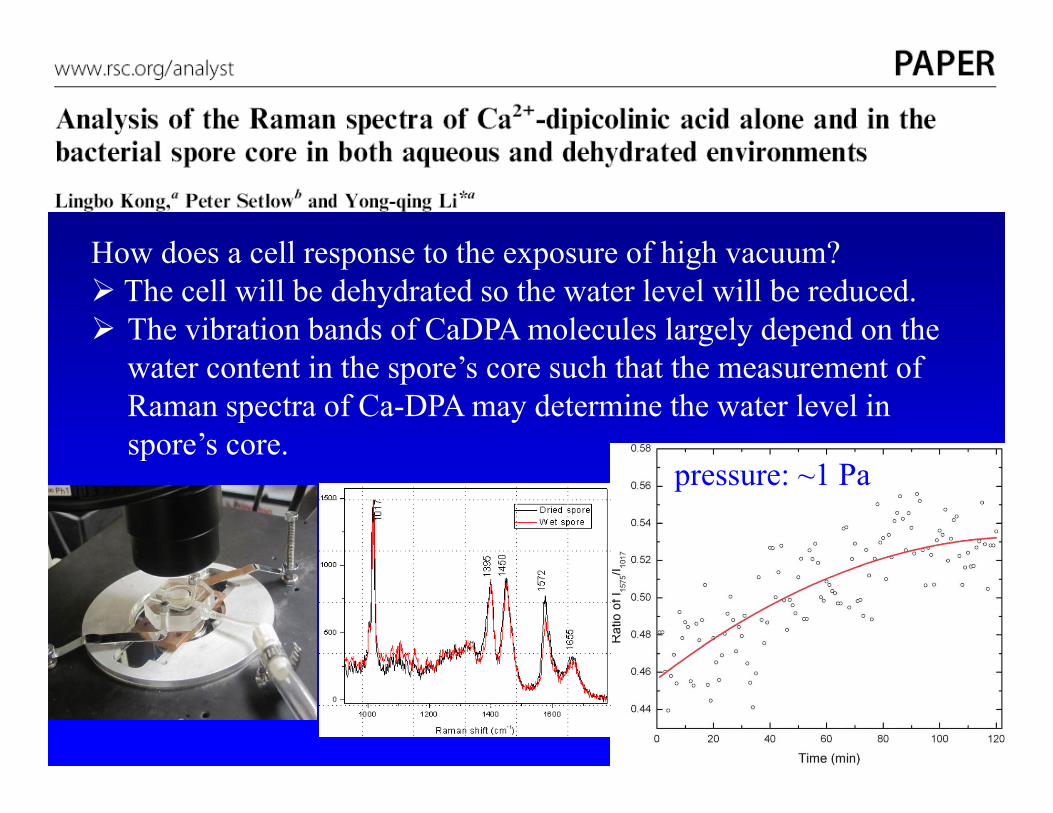
How does a cell response to the exposure of high vacuum?How does a cell response to the exposure of high vacuum?The cell will be dehydrated so the water level will be reduced.The vibration bands of CaDPA molecules largely depend on the water content in the spore’s core such that the measurement of Raman spectra of Ca-DPA may determine the water level in spore’s core.p
pressure: ~1 Pa
56
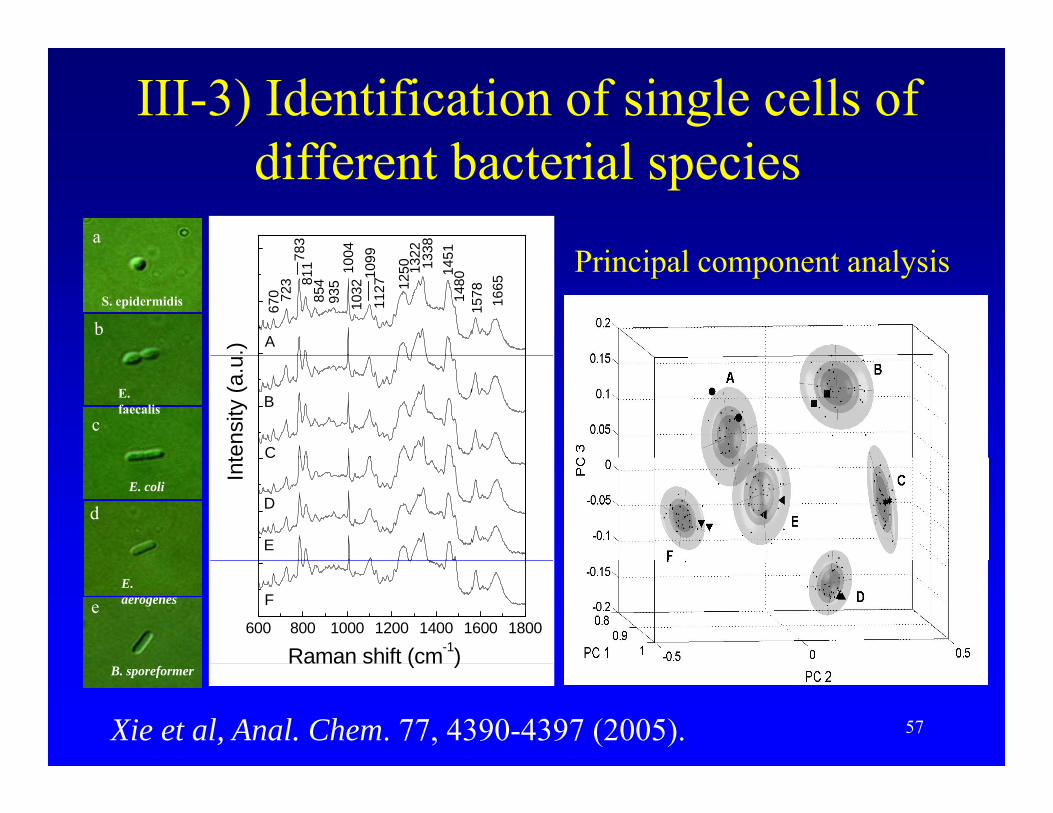
III-3) Identification of single cells of diff t b t i l i
a
513822983 04 P i i l t l i
different bacterial species
bS. epidermidis 14
80
A
1665
1578
14513132
1250
1127
1099
1032935
854
670 72
3 8117
100
.)Principal component analysis
c
E. faecalis
C
B
tens
ity (a
.u
dE. coli
E
D
Int
eE. aerogenes
600 800 1000 1200 1400 1600 1800
F
Raman shift (cm-1)
57
B. sporeformerRaman shift (cm )
Xie et al, Anal. Chem. 77, 4390-4397 (2005).
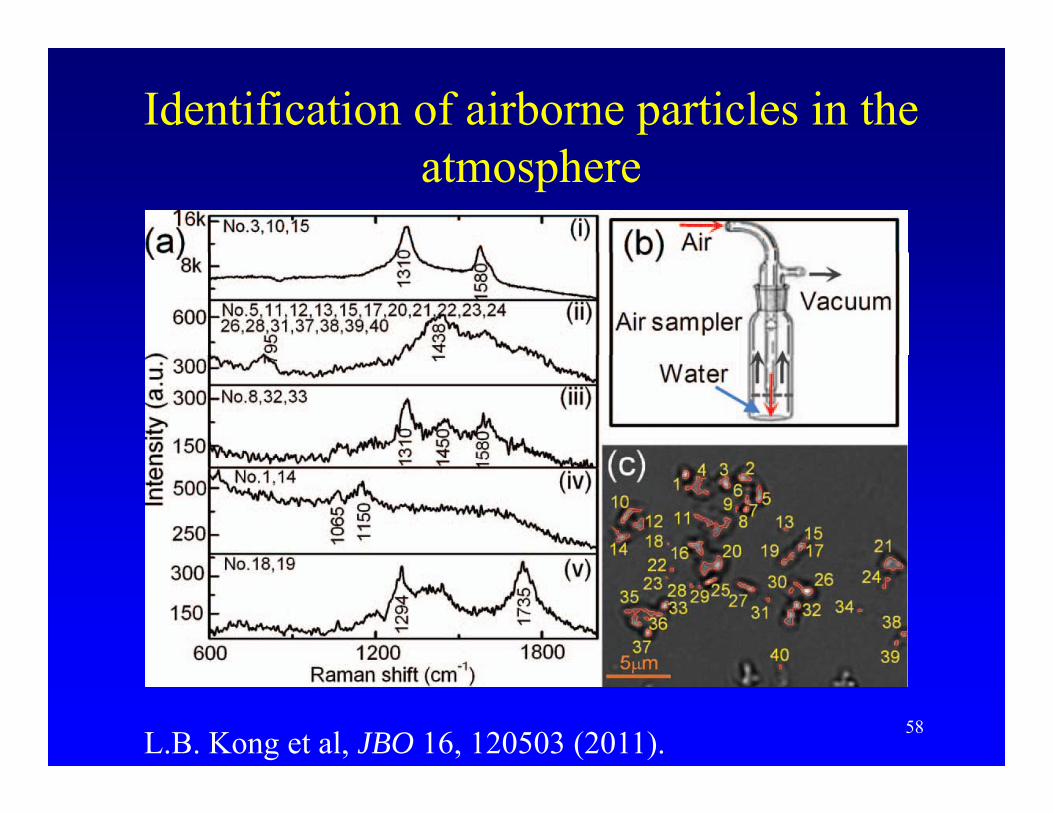
Identification of airborne particles in the hatmosphere
58L.B. Kong et al, JBO 16, 120503 (2011).
III-4) Detect recombinant protein production
• Transgenic cells can make recombinant proteins after induction of specific gene.
• When are new proteins made after induction?
• How many proteins are made in single cells?
• Can we detect the generated proteins within single cells without breaking the cell?
59Anal. Chem. 79, 9269-9275 (2007).
Detect SLB proteins in E. coli
III 5) Medical applications:III-5) Medical applications:
1. Characterize cancer cells.2 Analyze virus infected cells2.Analyze virus-infected cells3. Diagnosis of thelassamiag
60
61
Vibration. Spectros., 50, 193-197 (2009).
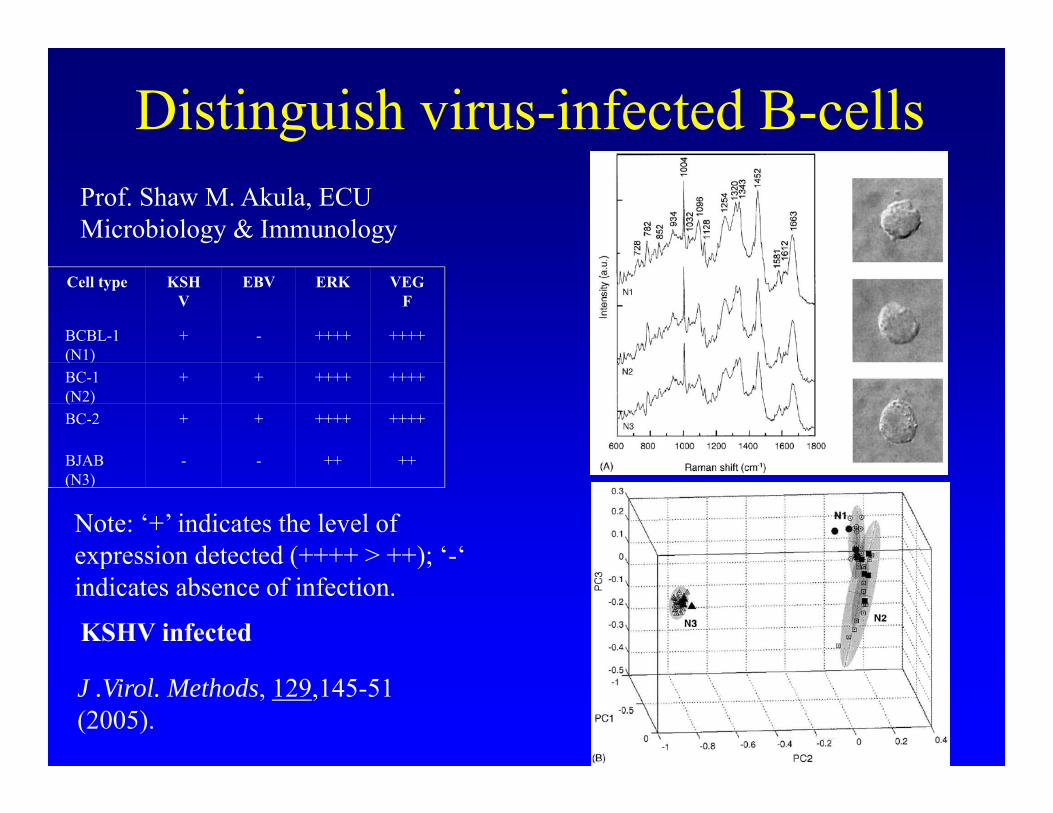
Distinguish virus-infected B-cellsProf. Shaw M. Akula, ECU Microbiology & Immunology
Cell type KSHV
EBV ERK VEGF
BCBL-1 (N1)
+ - ++++ ++++(N1)BC-1 (N2)
+ + ++++ ++++
BC-2 + + ++++ ++++
BJAB ++ ++BJAB (N3)
- - ++ ++
Note: ‘+’ indicates the level of expression detected (++++ > ++); ‘-‘expression detected (++++ > ++); indicates absence of infection.
KSHV infected
62
J .Virol. Methods, 129,145-51 (2005).
SummarySummary• LTRS technique in combination with optical tweezers q p
id l bl l f h l f i l llprovides a valuable tool for the analyses of single cells.• Applications for single-cell studies may include
detection of cellular dynamics i e spore germinationdetection of cellular dynamics, i.e. spore germination, rapid identification of microorganisms, spectroscopic sorting of useful cells, diagnosis of cellular disorders at g , gsingle cell level, and more.
• Many biological questions remain unanswered.
63
References1. L.B. Kong, P.F. Zhang, J. Yu, P. Setlow, and Y.Q. Li, “Rapid confocal
Raman imaging using a synchro multifoci-scan scheme for dynamic monitoring of single living cells” Appl Phys Lett 98 213703 (2011)monitoring of single living cells , Appl. Phys. Lett. 98, 213703 (2011).
2. C.A. Xie, M. A. Dinno, and Y.Q. Li, “Near-infrared Raman spectroscopy of single optically trapped biological cells”, Opt. Lett., 27 249-251 (2002)27, 249-251 (2002).
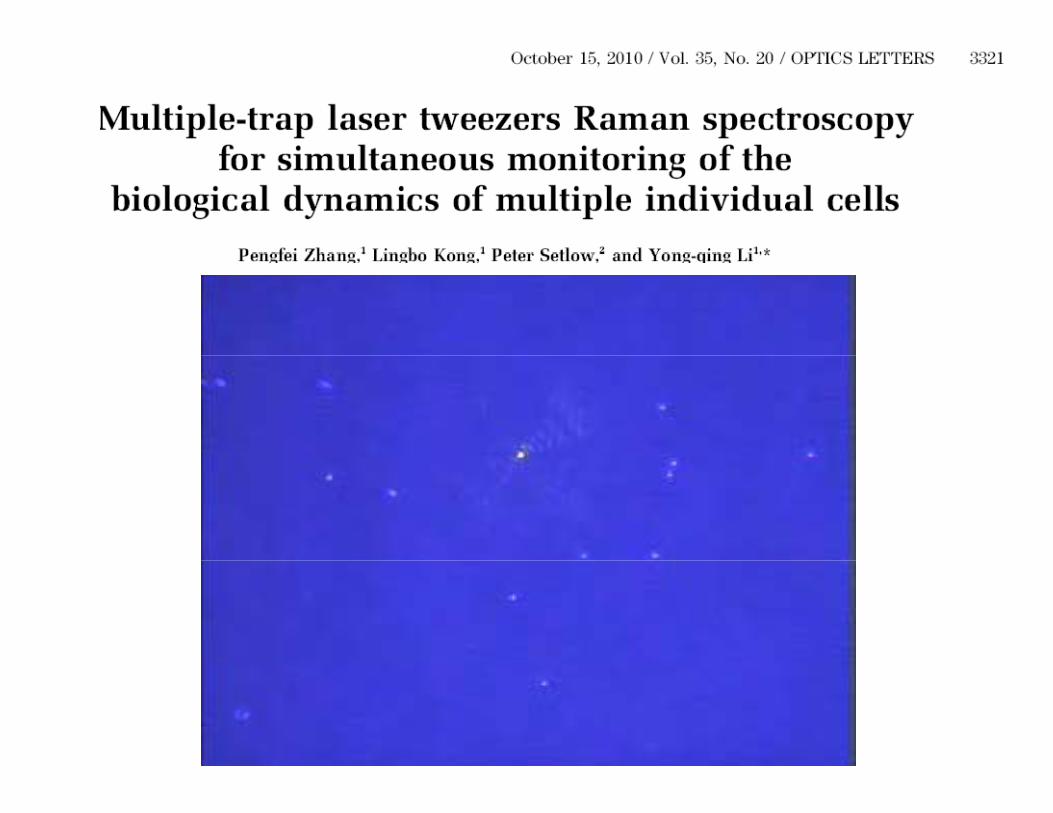
3. P.F. Zhang, L.B. Kong, P. Setlow and Y.Q. Li, “Multiple-trap laser tweezers Raman spectroscopy for simultaneous monitoring of the biological dynamics of multiple individual cells” Opt Lett 35 3321biological dynamics of multiple individual cells , Opt. Lett. 35, 3321-3323 (2010).
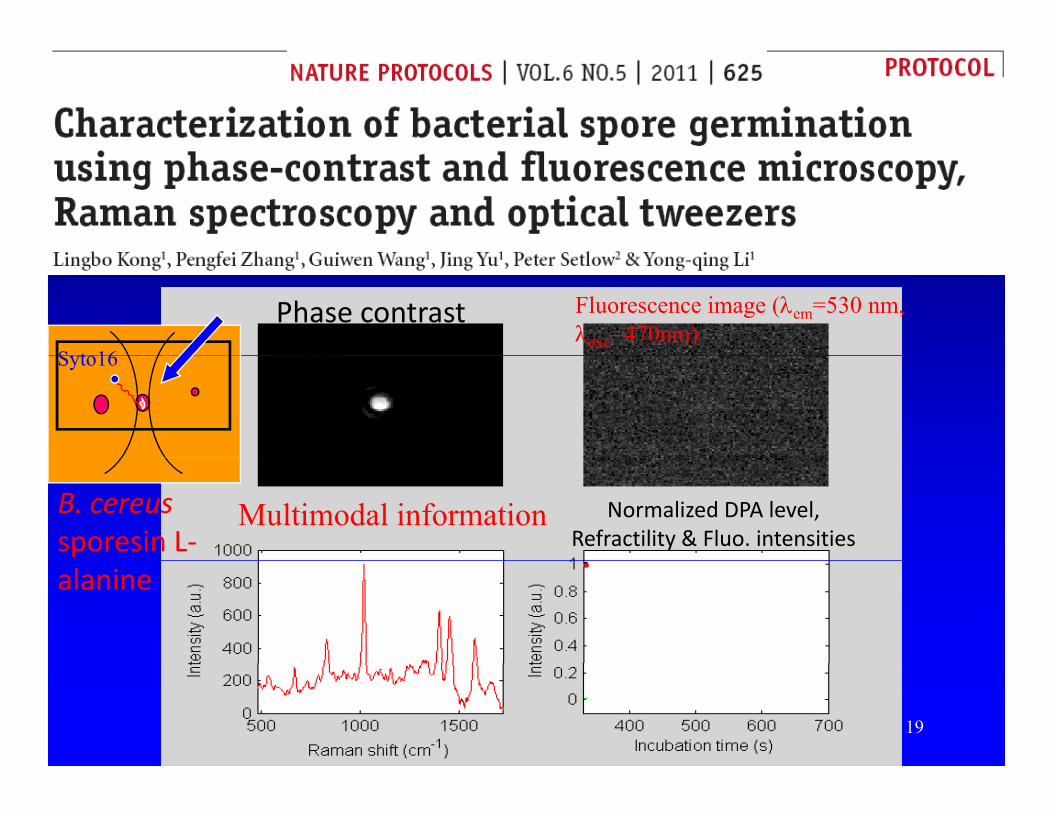
4. L.B. Kong, P.F. Zhang, P. Setlow, and Y.Q. Li. “Characterization of bacterial spore germination using integrated phase contrast microscopybacterial spore germination using integrated phase contrast microscopy, Raman spectroscopy and optical tweezers”, Anal. Chem. 82, 3840–3847 (2010).
5 D Ch S S H Y Q Li “R l ti d t ti f ki ti
64
5. D. Chen, S.S. Huang, Y.Q. Li. “Real-time detection of kinetic germination and heterogeneity of single Bacillus spores by laser tweezers Raman spectroscopy”, Anal. Chem. 78, 2936-6941 (2006).